Zip Codes with the Highest Percentage of Population Employed in Food Preparation & Serving in Martinsburg, WV
RELATED REPORTS & OPTIONS
Food Preparation & Serving
Martinsburg
Compare Zip Codes
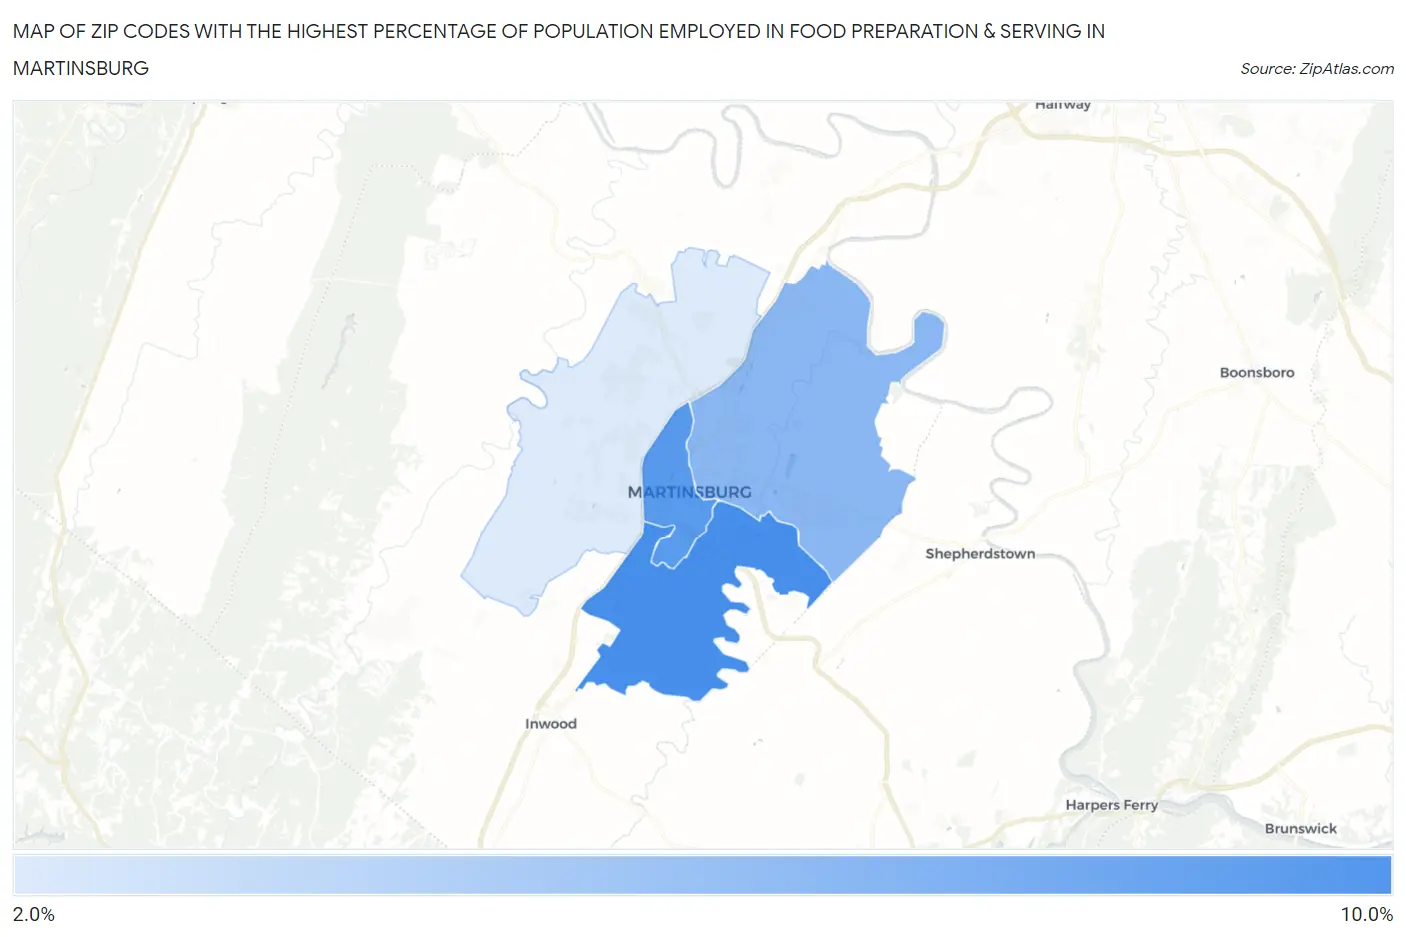
Map of Zip Codes with the Highest Percentage of Population Employed in Food Preparation & Serving in Martinsburg
2.8%
8.1%
Zip Codes with the Highest Percentage of Population Employed in Food Preparation & Serving in Martinsburg, WV
| Zip Code | % Employed | vs State | vs National | |
| 1. | 25405 | 8.1% | 5.7%(+2.41)#128 | 5.3%(+2.78)#4,633 |
| 2. | 25401 | 7.5% | 5.7%(+1.85)#146 | 5.3%(+2.22)#5,547 |
| 3. | 25404 | 5.7% | 5.7%(+0.028)#200 | 5.3%(+0.399)#10,404 |
| 4. | 25403 | 2.8% | 5.7%(-2.83)#316 | 5.3%(-2.46)#21,985 |
1
Common Questions
What are the Top 3 Zip Codes with the Highest Percentage of Population Employed in Food Preparation & Serving in Martinsburg, WV?
Top 3 Zip Codes with the Highest Percentage of Population Employed in Food Preparation & Serving in Martinsburg, WV are:
What zip code has the Highest Percentage of Population Employed in Food Preparation & Serving in Martinsburg, WV?
25405 has the Highest Percentage of Population Employed in Food Preparation & Serving in Martinsburg, WV with 8.1%.
What is the Percentage of Population Employed in Food Preparation & Serving in Martinsburg, WV?
Percentage of Population Employed in Food Preparation & Serving in Martinsburg is 7.5%.
What is the Percentage of Population Employed in Food Preparation & Serving in West Virginia?
Percentage of Population Employed in Food Preparation & Serving in West Virginia is 5.7%.
What is the Percentage of Population Employed in Food Preparation & Serving in the United States?
Percentage of Population Employed in Food Preparation & Serving in the United States is 5.3%.