Granville, WV Map & Demographics
Granville Map
Granville Overview
$19,434
PER CAPITA INCOME
$57,614
AVG FAMILY INCOME
$29,000
AVG HOUSEHOLD INCOME
0.49
INEQUALITY / GINI INDEX
1,384
TOTAL POPULATION
776
MALE POPULATION
608
FEMALE POPULATION
127.63
MALES / 100 FEMALES
78.35
FEMALES / 100 MALES
24.2
MEDIAN AGE
2.8
AVG FAMILY SIZE
2.2
AVG HOUSEHOLD SIZE
771
LABOR FORCE [ PEOPLE ]
60.1%
PERCENT IN LABOR FORCE
10.4%
UNEMPLOYMENT RATE
Granville Zip Codes
Granville Area Codes
Income in Granville
Income Overview in Granville
Per Capita Income in Granville is $19,434, while median incomes of families and households are $57,614 and $29,000 respectively.
| Characteristic | Number | Measure |
| Per Capita Income | 1,384 | $19,434 |
| Median Family Income | 185 | $57,614 |
| Mean Family Income | 185 | $58,365 |
| Median Household Income | 628 | $29,000 |
| Mean Household Income | 628 | $40,502 |
| Income Deficit | 185 | $0 |
| Wage / Income Gap (%) | 1,384 | 0.00% |
| Wage / Income Gap ($) | 1,384 | 100.00¢ per $1 |
| Gini / Inequality Index | 1,384 | 0.49 |
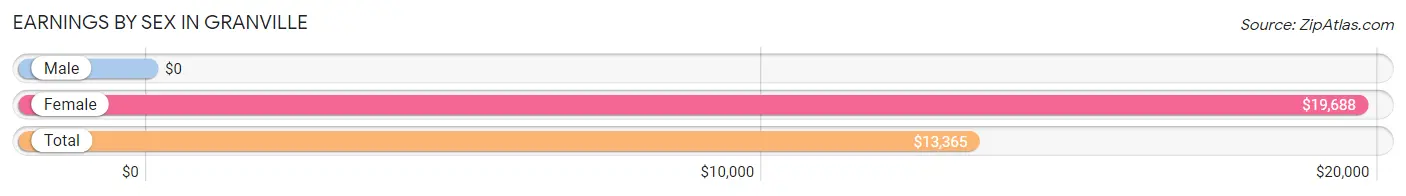
Earnings by Sex in Granville
| Sex | Number | Average Earnings |
| Male | 504 (56.8%) | $0 |
| Female | 383 (43.2%) | $19,688 |
| Total | 887 (100.0%) | $13,365 |
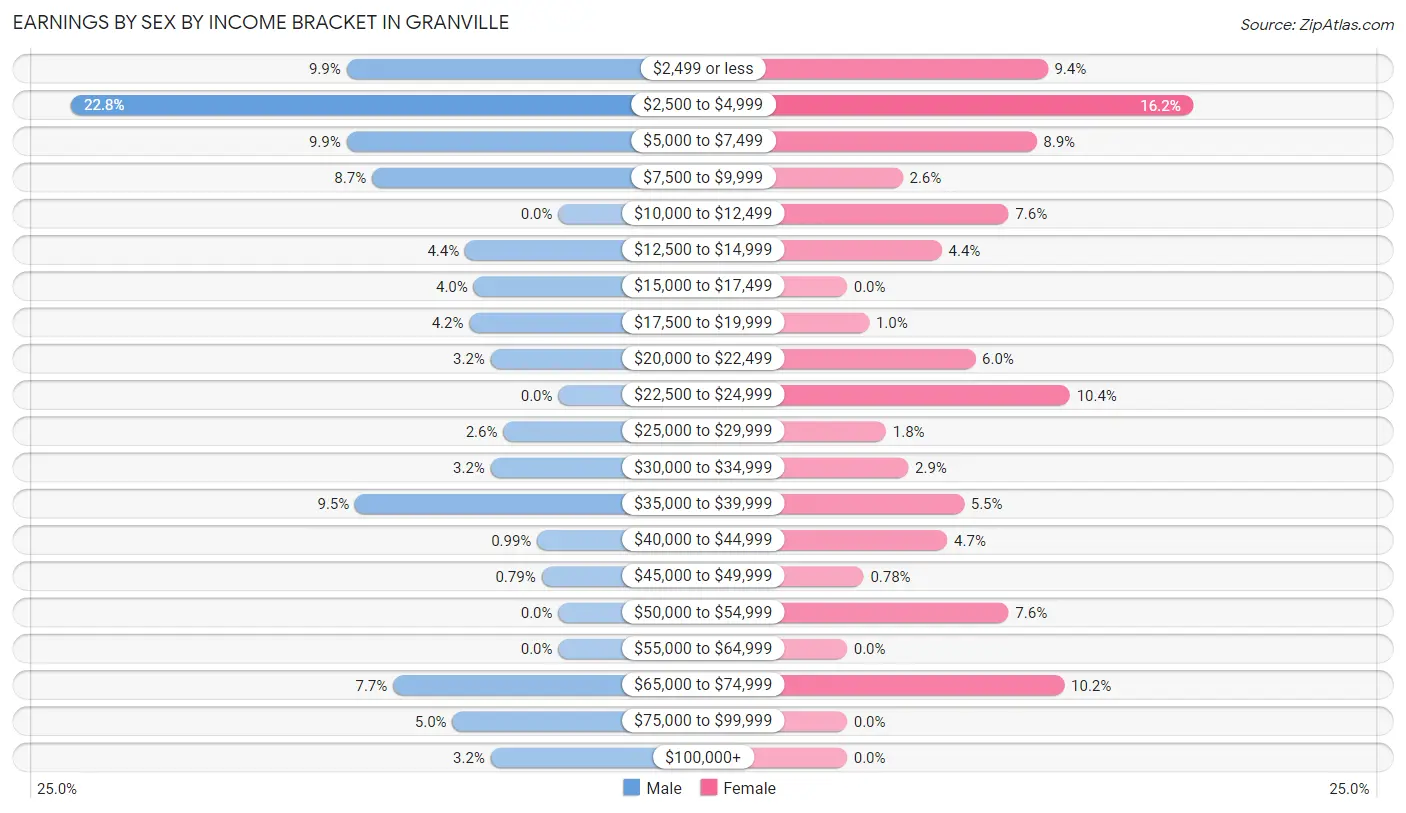
Earnings by Sex by Income Bracket in Granville
The most common earnings brackets in Granville are $2,500 to $4,999 for men (115 | 22.8%) and $2,500 to $4,999 for women (62 | 16.2%).
| Income | Male | Female |
| $2,499 or less | 50 (9.9%) | 36 (9.4%) |
| $2,500 to $4,999 | 115 (22.8%) | 62 (16.2%) |
| $5,000 to $7,499 | 50 (9.9%) | 34 (8.9%) |
| $7,500 to $9,999 | 44 (8.7%) | 10 (2.6%) |
| $10,000 to $12,499 | 0 (0.0%) | 29 (7.6%) |
| $12,500 to $14,999 | 22 (4.4%) | 17 (4.4%) |
| $15,000 to $17,499 | 20 (4.0%) | 0 (0.0%) |
| $17,500 to $19,999 | 21 (4.2%) | 4 (1.0%) |
| $20,000 to $22,499 | 16 (3.2%) | 23 (6.0%) |
| $22,500 to $24,999 | 0 (0.0%) | 40 (10.4%) |
| $25,000 to $29,999 | 13 (2.6%) | 7 (1.8%) |
| $30,000 to $34,999 | 16 (3.2%) | 11 (2.9%) |
| $35,000 to $39,999 | 48 (9.5%) | 21 (5.5%) |
| $40,000 to $44,999 | 5 (1.0%) | 18 (4.7%) |
| $45,000 to $49,999 | 4 (0.8%) | 3 (0.8%) |
| $50,000 to $54,999 | 0 (0.0%) | 29 (7.6%) |
| $55,000 to $64,999 | 0 (0.0%) | 0 (0.0%) |
| $65,000 to $74,999 | 39 (7.7%) | 39 (10.2%) |
| $75,000 to $99,999 | 25 (5.0%) | 0 (0.0%) |
| $100,000+ | 16 (3.2%) | 0 (0.0%) |
| Total | 504 (100.0%) | 383 (100.0%) |
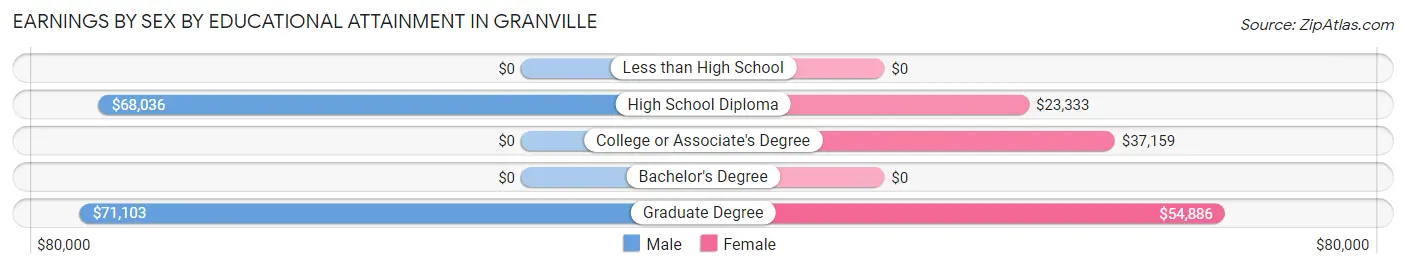
Earnings by Sex by Educational Attainment in Granville
| Educational Attainment | Male Income | Female Income |
| Less than High School | - | - |
| High School Diploma | $68,036 | $23,333 |
| College or Associate's Degree | - | - |
| Bachelor's Degree | - | - |
| Graduate Degree | $71,103 | $54,886 |
| Total | - | - |
Family Income in Granville
Family Income Brackets in Granville
According to the Granville family income data, there are 50 families falling into the $50,000 to $74,999 income range, which is the most common income bracket and makes up 27.0% of all families.
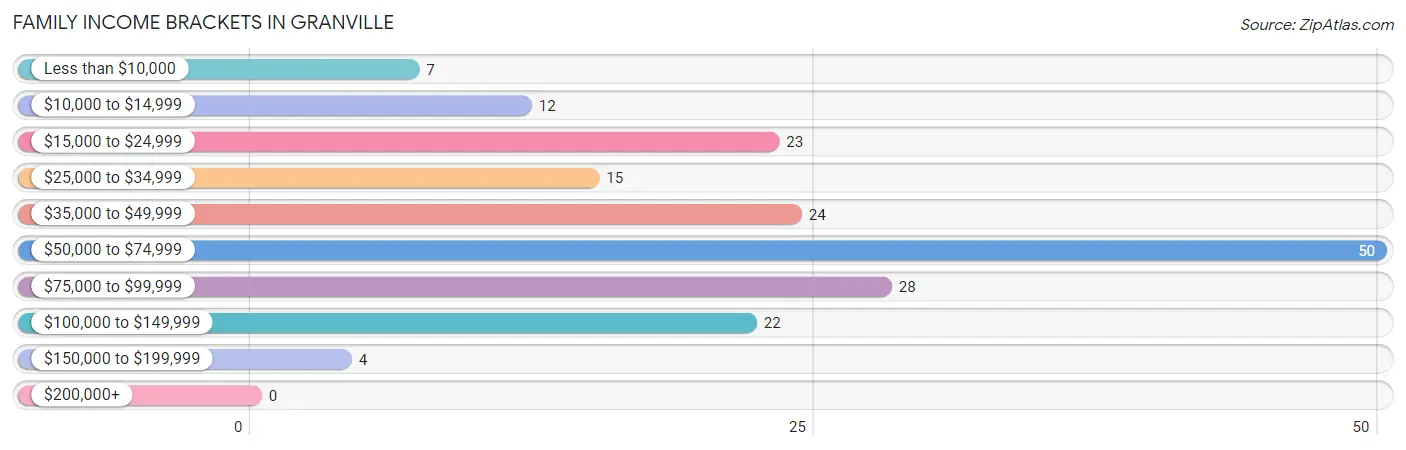
| Income Bracket | # Families | % Families |
| Less than $10,000 | 7 | 3.8% |
| $10,000 to $14,999 | 12 | 6.5% |
| $15,000 to $24,999 | 23 | 12.4% |
| $25,000 to $34,999 | 15 | 8.1% |
| $35,000 to $49,999 | 24 | 13.0% |
| $50,000 to $74,999 | 50 | 27.0% |
| $75,000 to $99,999 | 28 | 15.1% |
| $100,000 to $149,999 | 22 | 11.9% |
| $150,000 to $199,999 | 4 | 2.2% |
| $200,000+ | 0 | 0.0% |
Family Income by Famaliy Size in Granville
3-person families (67 | 36.2%) account for the highest median family income in Granville with $58,977 per family, while 2-person families (87 | 47.0%) have the highest median income of $26,080 per family member.
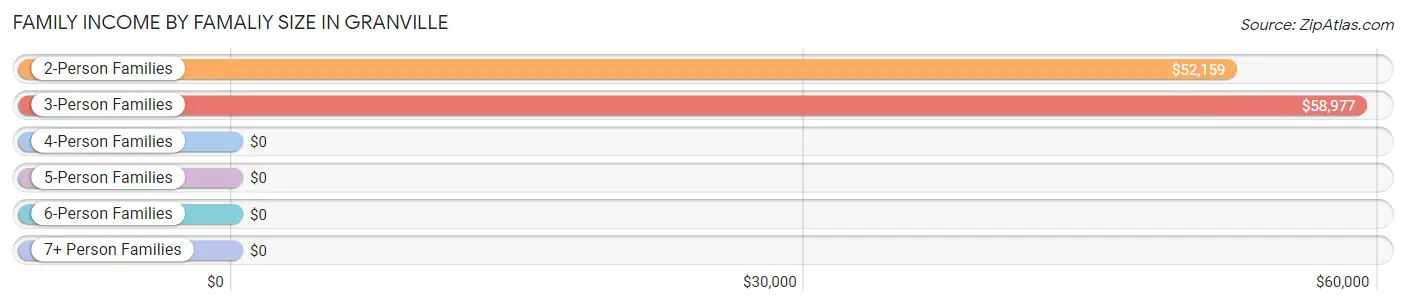
| Income Bracket | # Families | Median Income |
| 2-Person Families | 87 (47.0%) | $52,159 |
| 3-Person Families | 67 (36.2%) | $58,977 |
| 4-Person Families | 31 (16.8%) | $0 |
| 5-Person Families | 0 (0.0%) | $0 |
| 6-Person Families | 0 (0.0%) | $0 |
| 7+ Person Families | 0 (0.0%) | $0 |
| Total | 185 (100.0%) | $57,614 |
Family Income by Number of Earners in Granville
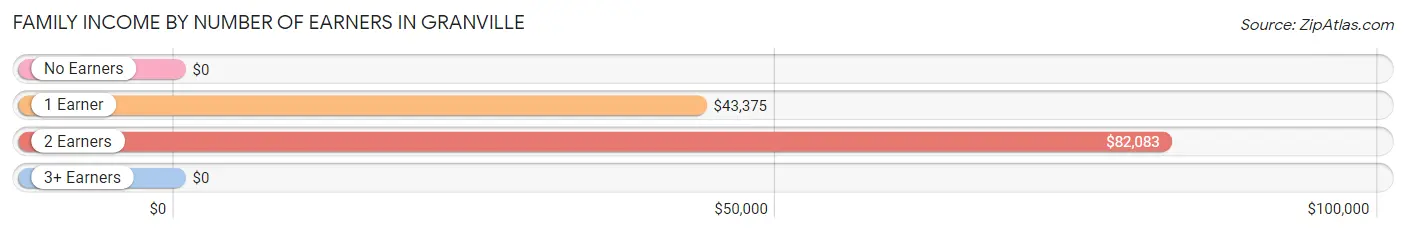
| Number of Earners | # Families | Median Income |
| No Earners | 11 (5.9%) | $0 |
| 1 Earner | 98 (53.0%) | $43,375 |
| 2 Earners | 65 (35.1%) | $82,083 |
| 3+ Earners | 11 (5.9%) | $0 |
| Total | 185 (100.0%) | $57,614 |
Household Income in Granville
Household Income Brackets in Granville
With 119 households falling in the category, the less than $10,000 income range is the most frequent in Granville, accounting for 19.0% of all households.
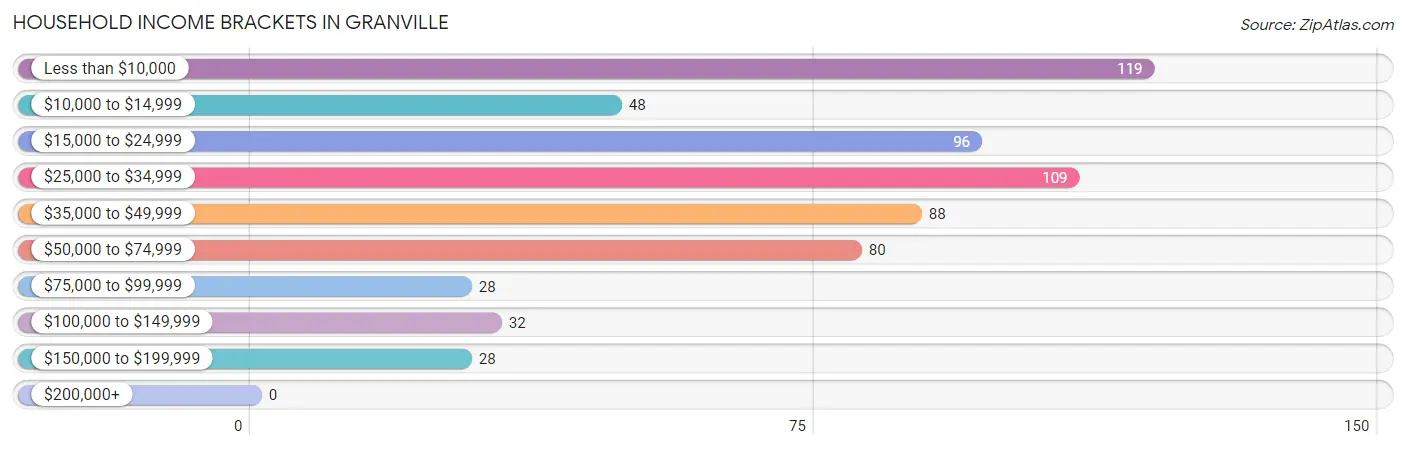
| Income Bracket | # Households | % Households |
| Less than $10,000 | 119 | 18.9% |
| $10,000 to $14,999 | 48 | 7.6% |
| $15,000 to $24,999 | 96 | 15.3% |
| $25,000 to $34,999 | 109 | 17.4% |
| $35,000 to $49,999 | 88 | 14.0% |
| $50,000 to $74,999 | 80 | 12.7% |
| $75,000 to $99,999 | 28 | 4.5% |
| $100,000 to $149,999 | 32 | 5.1% |
| $150,000 to $199,999 | 28 | 4.5% |
| $200,000+ | 0 | 0.0% |
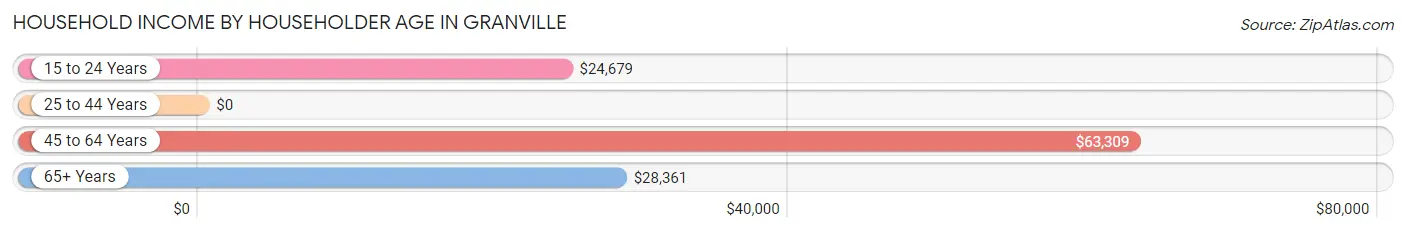
Household Income by Householder Age in Granville
The median household income in Granville is $29,000, with the highest median household income of $63,309 found in the 45 to 64 years age bracket for the primary householder. A total of 105 households (16.7%) fall into this category. Meanwhile, the 25 to 44 years age bracket for the primary householder has the lowest median household income of $0, with 169 households (26.9%) in this group.
| Income Bracket | # Households | Median Income |
| 15 to 24 Years | 209 (33.3%) | $24,679 |
| 25 to 44 Years | 169 (26.9%) | $0 |
| 45 to 64 Years | 105 (16.7%) | $63,309 |
| 65+ Years | 145 (23.1%) | $28,361 |
| Total | 628 (100.0%) | $29,000 |
Poverty in Granville
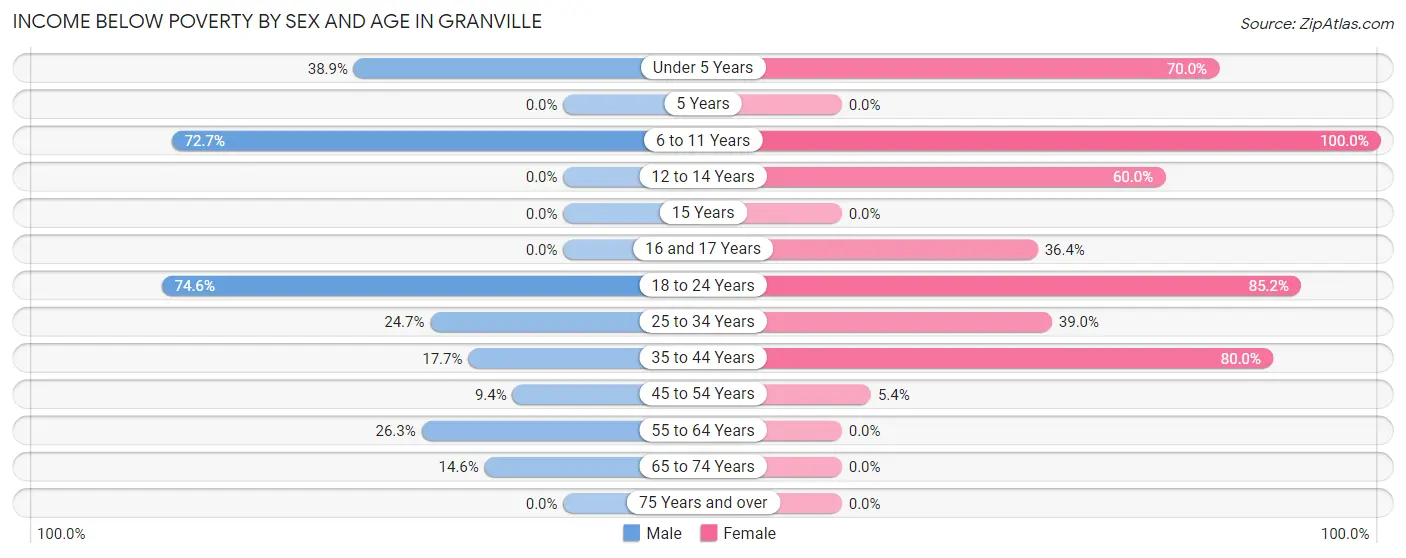
Income Below Poverty by Sex and Age in Granville
With 48.9% poverty level for males and 46.3% for females among the residents of Granville, 18 to 24 year old males and 6 to 11 year old females are the most vulnerable to poverty, with 299 males (74.6%) and 12 females (100.0%) in their respective age groups living below the poverty level.
| Age Bracket | Male | Female |
| Under 5 Years | 7 (38.9%) | 7 (70.0%) |
| 5 Years | 0 (0.0%) | 0 (0.0%) |
| 6 to 11 Years | 16 (72.7%) | 12 (100.0%) |
| 12 to 14 Years | 0 (0.0%) | 6 (60.0%) |
| 15 Years | 0 (0.0%) | 0 (0.0%) |
| 16 and 17 Years | 0 (0.0%) | 8 (36.4%) |
| 18 to 24 Years | 299 (74.6%) | 161 (85.2%) |
| 25 to 34 Years | 20 (24.7%) | 62 (39.0%) |
| 35 to 44 Years | 6 (17.6%) | 16 (80.0%) |
| 45 to 54 Years | 5 (9.4%) | 4 (5.4%) |
| 55 to 64 Years | 10 (26.3%) | 0 (0.0%) |
| 65 to 74 Years | 13 (14.6%) | 0 (0.0%) |
| 75 Years and over | 0 (0.0%) | 0 (0.0%) |
| Total | 376 (48.9%) | 276 (46.3%) |
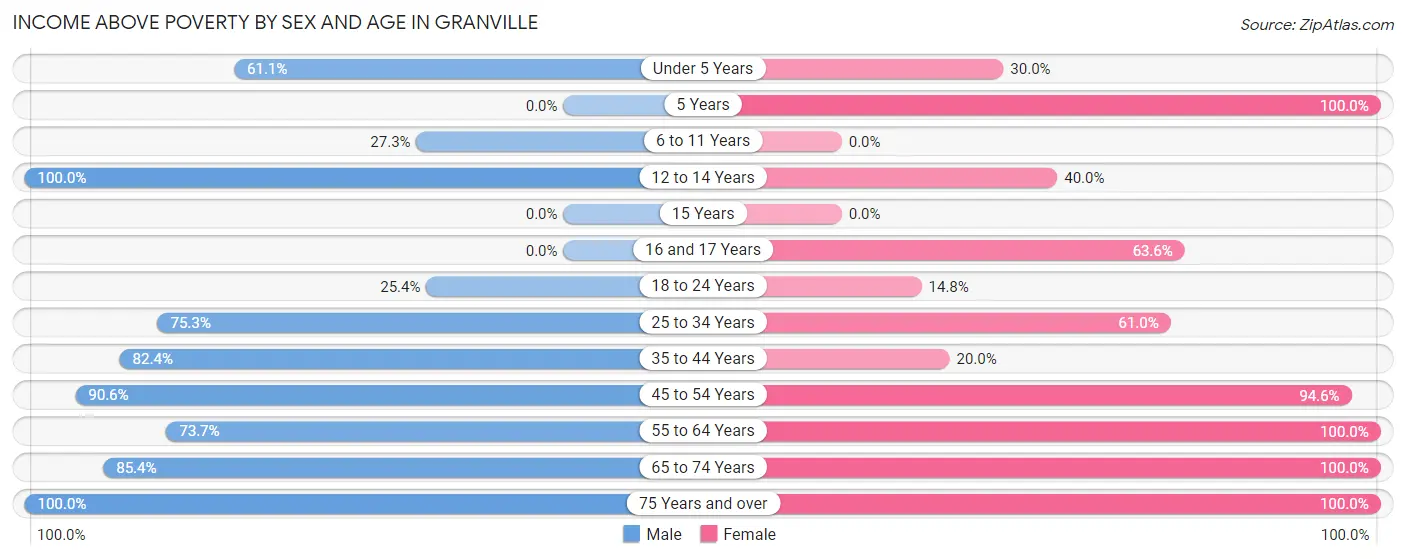
Income Above Poverty by Sex and Age in Granville
According to the poverty statistics in Granville, males aged 12 to 14 years and females aged 5 years are the age groups that are most secure financially, with 100.0% of males and 100.0% of females in these age groups living above the poverty line.
| Age Bracket | Male | Female |
| Under 5 Years | 11 (61.1%) | 3 (30.0%) |
| 5 Years | 0 (0.0%) | 3 (100.0%) |
| 6 to 11 Years | 6 (27.3%) | 0 (0.0%) |
| 12 to 14 Years | 7 (100.0%) | 4 (40.0%) |
| 15 Years | 0 (0.0%) | 0 (0.0%) |
| 16 and 17 Years | 0 (0.0%) | 14 (63.6%) |
| 18 to 24 Years | 102 (25.4%) | 28 (14.8%) |
| 25 to 34 Years | 61 (75.3%) | 97 (61.0%) |
| 35 to 44 Years | 28 (82.4%) | 4 (20.0%) |
| 45 to 54 Years | 48 (90.6%) | 70 (94.6%) |
| 55 to 64 Years | 28 (73.7%) | 24 (100.0%) |
| 65 to 74 Years | 76 (85.4%) | 42 (100.0%) |
| 75 Years and over | 26 (100.0%) | 31 (100.0%) |
| Total | 393 (51.1%) | 320 (53.7%) |
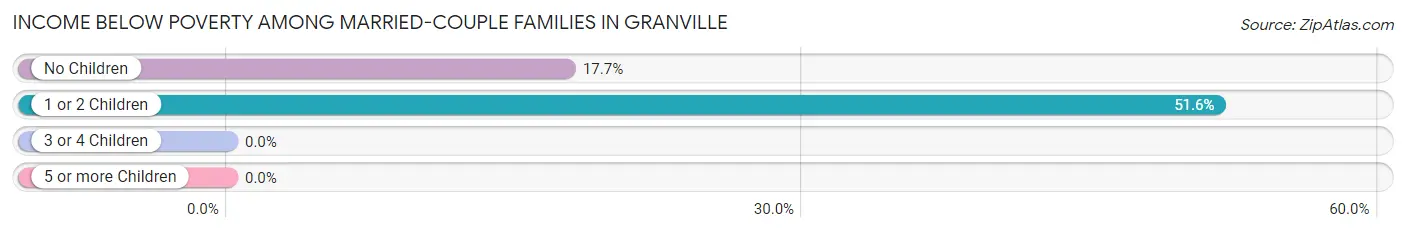
Income Below Poverty Among Married-Couple Families in Granville
The poverty statistics for married-couple families in Granville show that 26.7% or 31 of the total 116 families live below the poverty line. Families with 1 or 2 children have the highest poverty rate of 51.6%, comprising of 16 families. On the other hand, families with no children have the lowest poverty rate of 17.6%, which includes 15 families.
| Children | Above Poverty | Below Poverty |
| No Children | 70 (82.4%) | 15 (17.6%) |
| 1 or 2 Children | 15 (48.4%) | 16 (51.6%) |
| 3 or 4 Children | 0 (0.0%) | 0 (0.0%) |
| 5 or more Children | 0 (0.0%) | 0 (0.0%) |
| Total | 85 (73.3%) | 31 (26.7%) |
Income Below Poverty Among Single-Parent Households in Granville
According to the poverty data in Granville, 13.8% or 4 single-father households and 17.5% or 7 single-mother households are living below the poverty line. Among single-father households, those with 3 or 4 children have the highest poverty rate, with 4 households (36.4%) experiencing poverty. Likewise, among single-mother households, those with 1 or 2 children have the highest poverty rate, with 7 households (38.9%) falling below the poverty line.
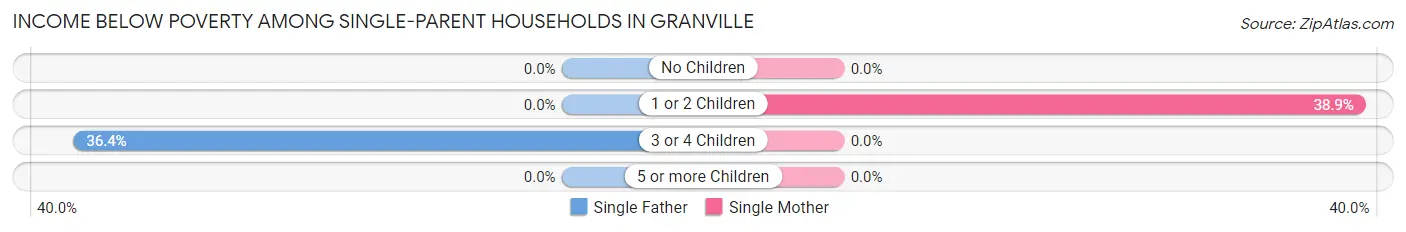
| Children | Single Father | Single Mother |
| No Children | 0 (0.0%) | 0 (0.0%) |
| 1 or 2 Children | 0 (0.0%) | 7 (38.9%) |
| 3 or 4 Children | 4 (36.4%) | 0 (0.0%) |
| 5 or more Children | 0 (0.0%) | 0 (0.0%) |
| Total | 4 (13.8%) | 7 (17.5%) |
Income Below Poverty Among Married-Couple vs Single-Parent Households in Granville
The poverty data for Granville shows that 31 of the married-couple family households (26.7%) and 11 of the single-parent households (15.9%) are living below the poverty level. Within the married-couple family households, those with 1 or 2 children have the highest poverty rate, with 16 households (51.6%) falling below the poverty line. Among the single-parent households, those with 1 or 2 children have the highest poverty rate, with 7 household (38.9%) living below poverty.
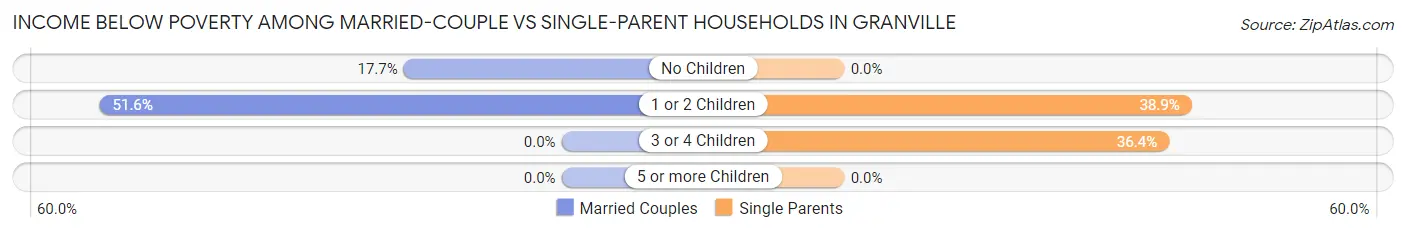
| Children | Married-Couple Families | Single-Parent Households |
| No Children | 15 (17.6%) | 0 (0.0%) |
| 1 or 2 Children | 16 (51.6%) | 7 (38.9%) |
| 3 or 4 Children | 0 (0.0%) | 4 (36.4%) |
| 5 or more Children | 0 (0.0%) | 0 (0.0%) |
| Total | 31 (26.7%) | 11 (15.9%) |
Race in Granville
The most populous races in Granville are White / Caucasian (1,187 | 85.8%), Two or more Races (93 | 6.7%), and Some other Race (71 | 5.1%).
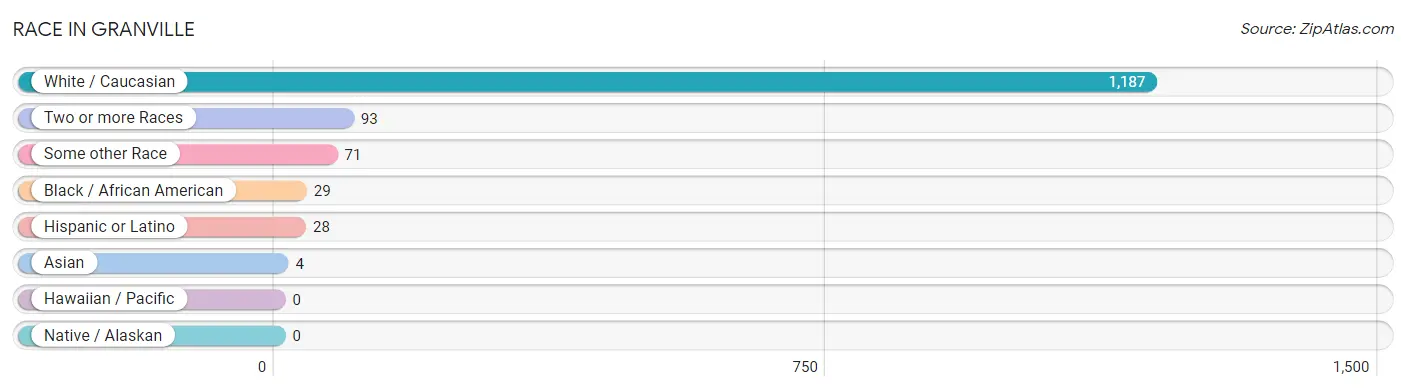
| Race | # Population | % Population |
| Asian | 4 | 0.3% |
| Black / African American | 29 | 2.1% |
| Hawaiian / Pacific | 0 | 0.0% |
| Hispanic or Latino | 28 | 2.0% |
| Native / Alaskan | 0 | 0.0% |
| White / Caucasian | 1,187 | 85.8% |
| Two or more Races | 93 | 6.7% |
| Some other Race | 71 | 5.1% |
| Total | 1,384 | 100.0% |
Ancestry in Granville
The most populous ancestries reported in Granville are German (319 | 23.1%), Irish (245 | 17.7%), Italian (231 | 16.7%), English (154 | 11.1%), and French (84 | 6.1%), together accounting for 74.6% of all Granville residents.
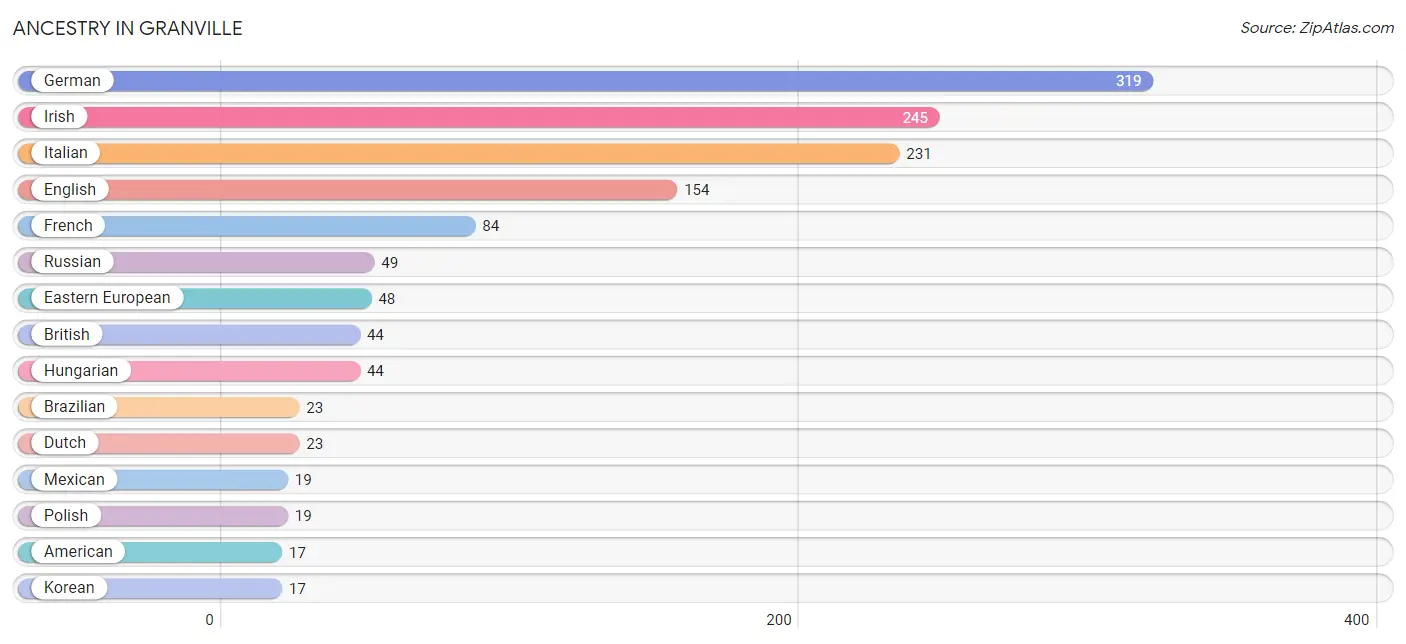
| Ancestry | # Population | % Population |
| American | 17 | 1.2% |
| Brazilian | 23 | 1.7% |
| British | 44 | 3.2% |
| Croatian | 10 | 0.7% |
| Dutch | 23 | 1.7% |
| Eastern European | 48 | 3.5% |
| English | 154 | 11.1% |
| French | 84 | 6.1% |
| German | 319 | 23.1% |
| Greek | 12 | 0.9% |
| Hungarian | 44 | 3.2% |
| Irish | 245 | 17.7% |
| Italian | 231 | 16.7% |
| Korean | 17 | 1.2% |
| Mexican | 19 | 1.4% |
| Pennsylvania German | 10 | 0.7% |
| Polish | 19 | 1.4% |
| Russian | 49 | 3.5% |
| Scandinavian | 7 | 0.5% |
| Scotch-Irish | 4 | 0.3% |
| Scottish | 10 | 0.7% |
| Slovak | 10 | 0.7% |
| Welsh | 8 | 0.6% | View All 23 Rows |
Immigrants in Granville
The most numerous immigrant groups reported in Granville came from Latin America (32 | 2.3%), Brazil (23 | 1.7%), South America (23 | 1.7%), Central America (9 | 0.6%), and Guatemala (9 | 0.6%), together accounting for 6.9% of all Granville residents.
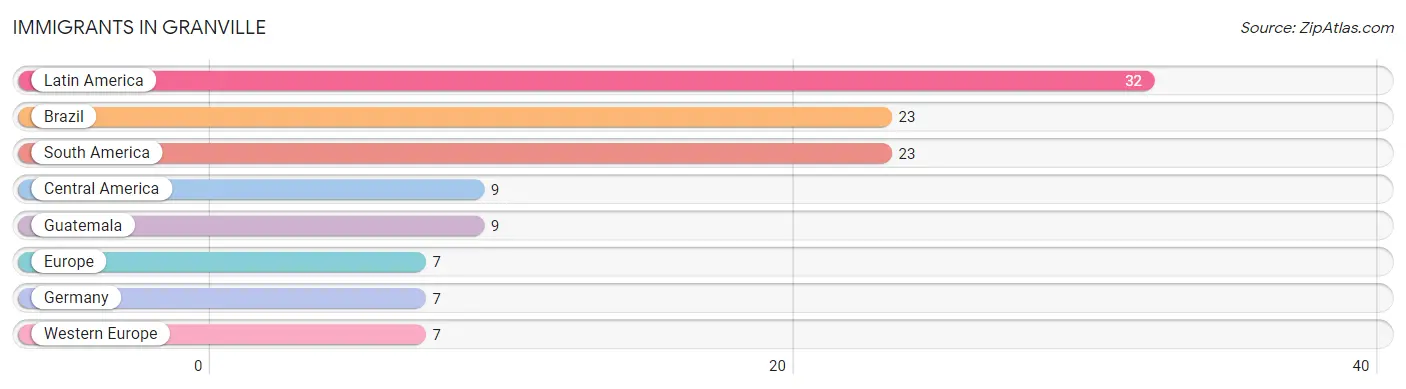
| Immigration Origin | # Population | % Population |
| Brazil | 23 | 1.7% |
| Central America | 9 | 0.6% |
| Europe | 7 | 0.5% |
| Germany | 7 | 0.5% |
| Guatemala | 9 | 0.6% |
| Latin America | 32 | 2.3% |
| South America | 23 | 1.7% |
| Western Europe | 7 | 0.5% | View All 8 Rows |
Sex and Age in Granville
Sex and Age in Granville
The most populous age groups in Granville are 20 to 24 Years (354 | 45.6%) for men and 15 to 19 Years (109 | 17.9%) for women.
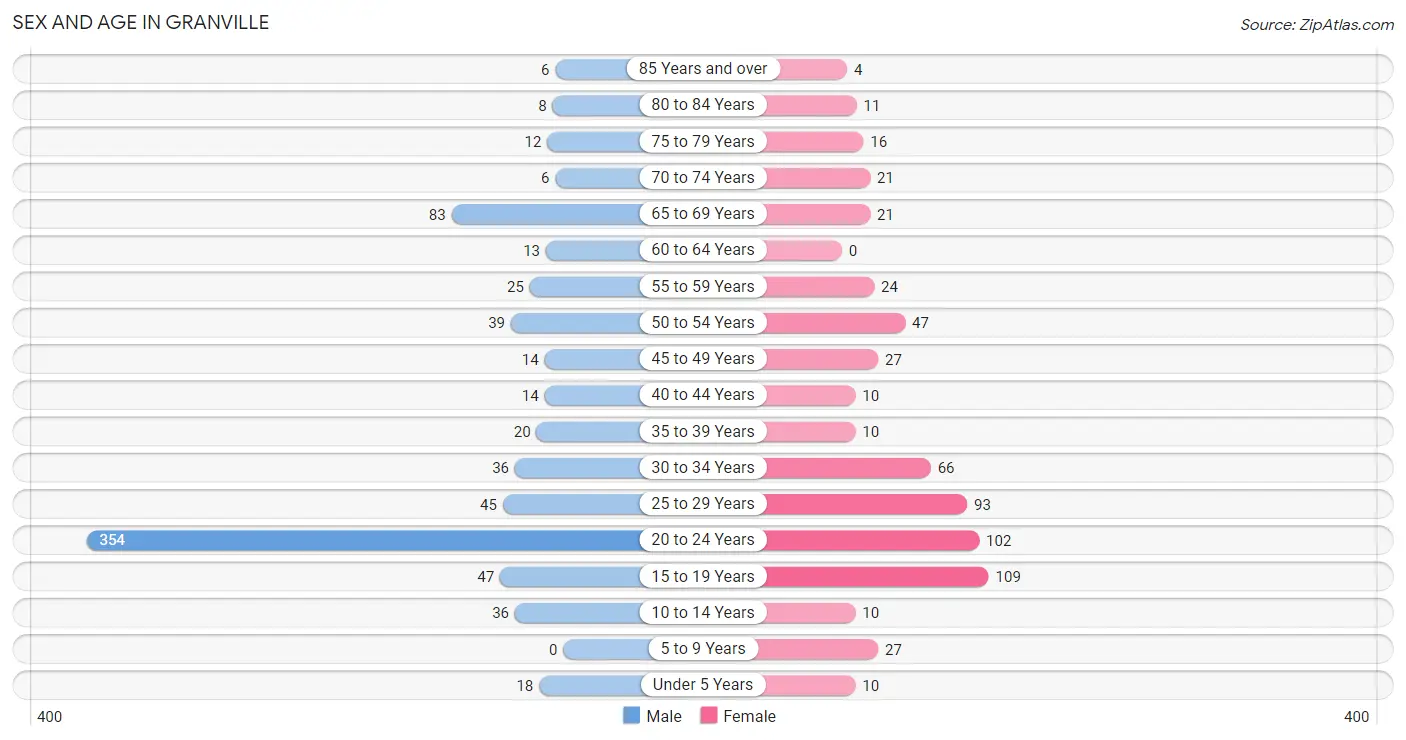
| Age Bracket | Male | Female |
| Under 5 Years | 18 (2.3%) | 10 (1.6%) |
| 5 to 9 Years | 0 (0.0%) | 27 (4.4%) |
| 10 to 14 Years | 36 (4.6%) | 10 (1.6%) |
| 15 to 19 Years | 47 (6.1%) | 109 (17.9%) |
| 20 to 24 Years | 354 (45.6%) | 102 (16.8%) |
| 25 to 29 Years | 45 (5.8%) | 93 (15.3%) |
| 30 to 34 Years | 36 (4.6%) | 66 (10.9%) |
| 35 to 39 Years | 20 (2.6%) | 10 (1.6%) |
| 40 to 44 Years | 14 (1.8%) | 10 (1.6%) |
| 45 to 49 Years | 14 (1.8%) | 27 (4.4%) |
| 50 to 54 Years | 39 (5.0%) | 47 (7.7%) |
| 55 to 59 Years | 25 (3.2%) | 24 (4.0%) |
| 60 to 64 Years | 13 (1.7%) | 0 (0.0%) |
| 65 to 69 Years | 83 (10.7%) | 21 (3.5%) |
| 70 to 74 Years | 6 (0.8%) | 21 (3.5%) |
| 75 to 79 Years | 12 (1.5%) | 16 (2.6%) |
| 80 to 84 Years | 8 (1.0%) | 11 (1.8%) |
| 85 Years and over | 6 (0.8%) | 4 (0.7%) |
| Total | 776 (100.0%) | 608 (100.0%) |
Families and Households in Granville
Median Family Size in Granville
The median family size in Granville is 2.81 persons per family, with single male/father families (29 | 15.7%) accounting for the largest median family size of 3.21 persons per family. On the other hand, married-couple families (116 | 62.7%) represent the smallest median family size with 2.59 persons per family.
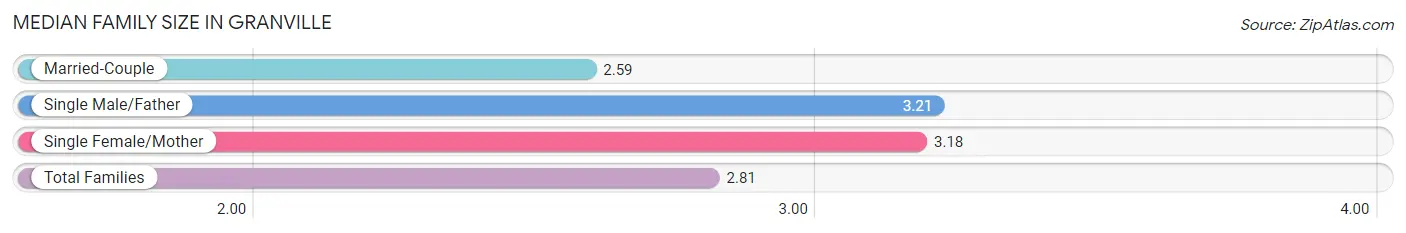
| Family Type | # Families | Family Size |
| Married-Couple | 116 (62.7%) | 2.59 |
| Single Male/Father | 29 (15.7%) | 3.21 |
| Single Female/Mother | 40 (21.6%) | 3.18 |
| Total Families | 185 (100.0%) | 2.81 |
Median Household Size in Granville
The median household size in Granville is 2.20 persons per household, with single male/father households (29 | 4.6%) accounting for the largest median household size of 3.79 persons per household. non-family households (443 | 70.5%) represent the smallest median household size with 1.85 persons per household.
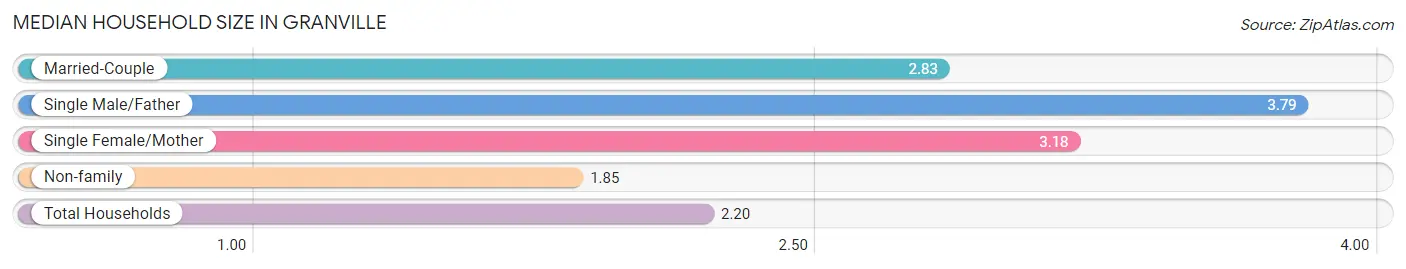
| Household Type | # Households | Household Size |
| Married-Couple | 116 (18.5%) | 2.83 |
| Single Male/Father | 29 (4.6%) | 3.79 |
| Single Female/Mother | 40 (6.4%) | 3.18 |
| Non-family | 443 (70.5%) | 1.85 |
| Total Households | 628 (100.0%) | 2.20 |
Household Size by Marriage Status in Granville
Out of a total of 628 households in Granville, 185 (29.5%) are family households, while 443 (70.5%) are nonfamily households. The most numerous type of family households are 2-person households, comprising 80, and the most common type of nonfamily households are 1-person households, comprising 259.
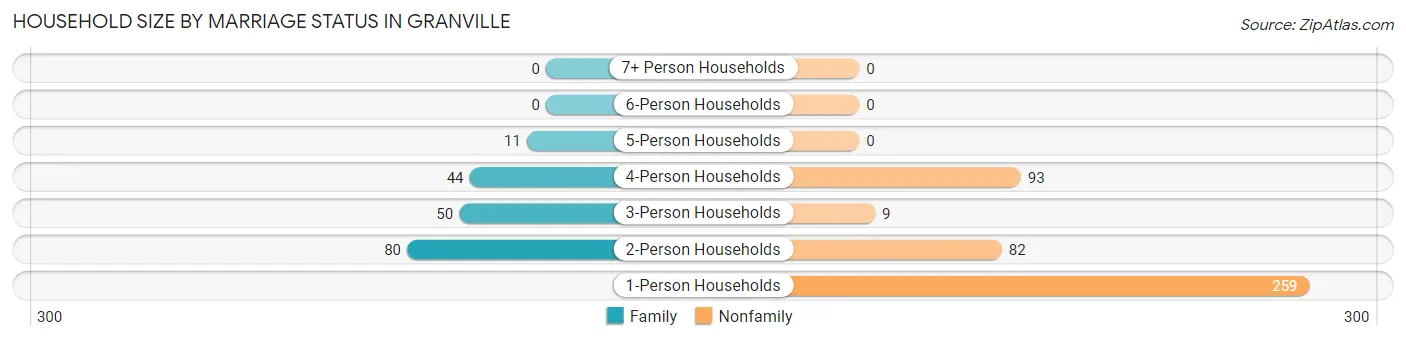
| Household Size | Family Households | Nonfamily Households |
| 1-Person Households | - | 259 (41.2%) |
| 2-Person Households | 80 (12.7%) | 82 (13.1%) |
| 3-Person Households | 50 (8.0%) | 9 (1.4%) |
| 4-Person Households | 44 (7.0%) | 93 (14.8%) |
| 5-Person Households | 11 (1.8%) | 0 (0.0%) |
| 6-Person Households | 0 (0.0%) | 0 (0.0%) |
| 7+ Person Households | 0 (0.0%) | 0 (0.0%) |
| Total | 185 (29.5%) | 443 (70.5%) |
Female Fertility in Granville
Fertility by Age in Granville
Average fertility rate in Granville is 37.0 births per 1,000 women. Women in the age bracket of 20 to 34 years have the highest fertility rate with 61.0 births per 1,000 women. Women in the age bracket of 20 to 34 years acount for 100.0% of all women with births.
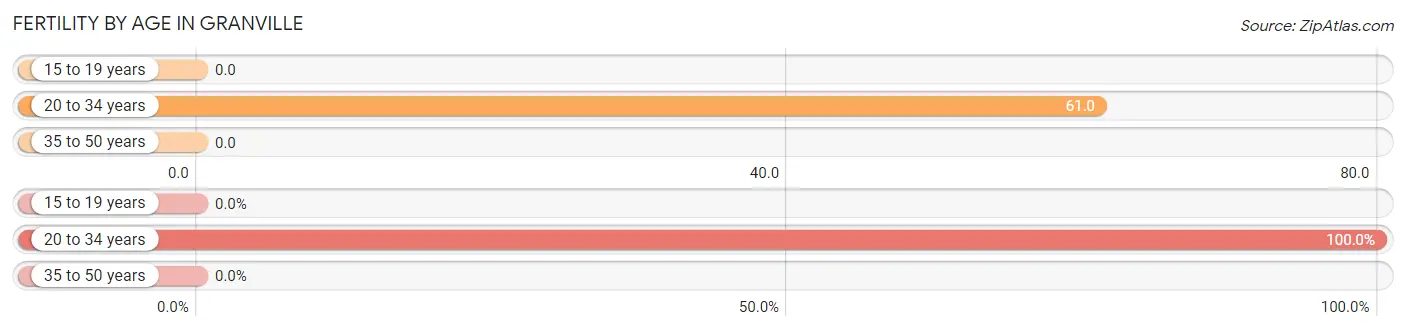
| Age Bracket | Women with Births | Births / 1,000 Women |
| 15 to 19 years | 0 (0.0%) | 0.0 |
| 20 to 34 years | 16 (100.0%) | 61.0 |
| 35 to 50 years | 0 (0.0%) | 0.0 |
| Total | 16 (100.0%) | 37.0 |
Fertility by Age by Marriage Status in Granville
25.0% of women with births (16) in Granville are married. The highest percentage of unmarried women with births falls into 20 to 34 years age bracket with 75.0% of them unmarried at the time of birth, while the lowest percentage of unmarried women with births belong to 20 to 34 years age bracket with 75.0% of them unmarried.
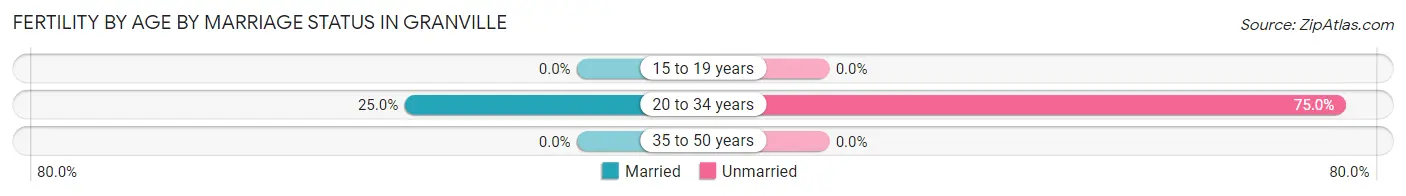
| Age Bracket | Married | Unmarried |
| 15 to 19 years | 0 (0.0%) | 0 (0.0%) |
| 20 to 34 years | 4 (25.0%) | 12 (75.0%) |
| 35 to 50 years | 0 (0.0%) | 0 (0.0%) |
| Total | 4 (25.0%) | 12 (75.0%) |
Fertility by Education in Granville
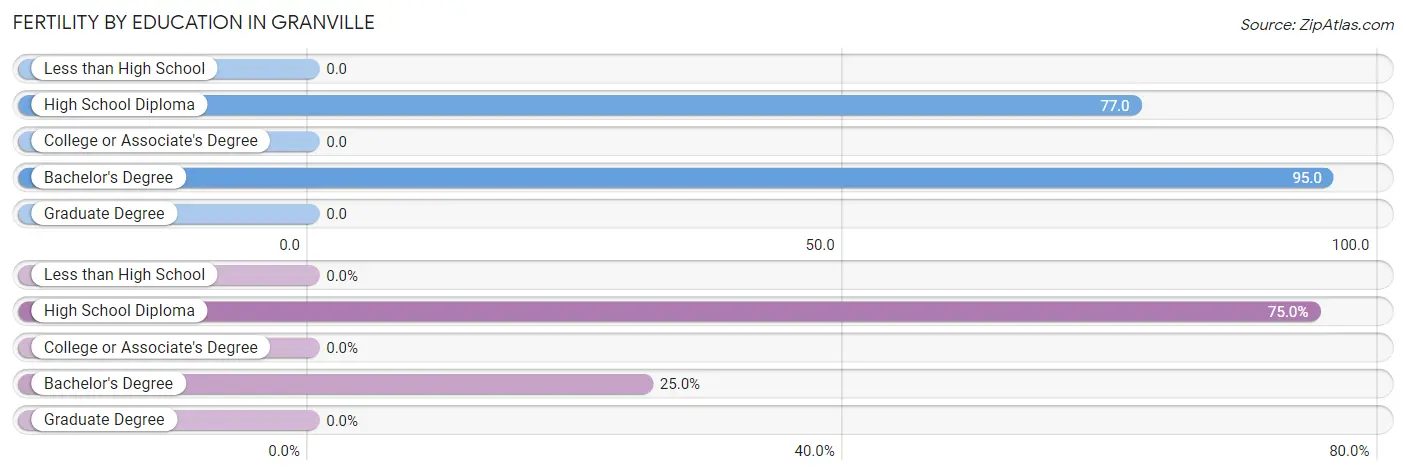
| Educational Attainment | Women with Births | Births / 1,000 Women |
| Less than High School | 0 (0.0%) | 0.0 |
| High School Diploma | 12 (75.0%) | 77.0 |
| College or Associate's Degree | 0 (0.0%) | 0.0 |
| Bachelor's Degree | 4 (25.0%) | 95.0 |
| Graduate Degree | 0 (0.0%) | 0.0 |
| Total | 16 (100.0%) | 37.0 |
Fertility by Education by Marriage Status in Granville
75.0% of women with births in Granville are unmarried. Women with the educational attainment of bachelor's degree are most likely to be married with 100.0% of them married at childbirth, while women with the educational attainment of high school diploma are least likely to be married with 100.0% of them unmarried at childbirth.
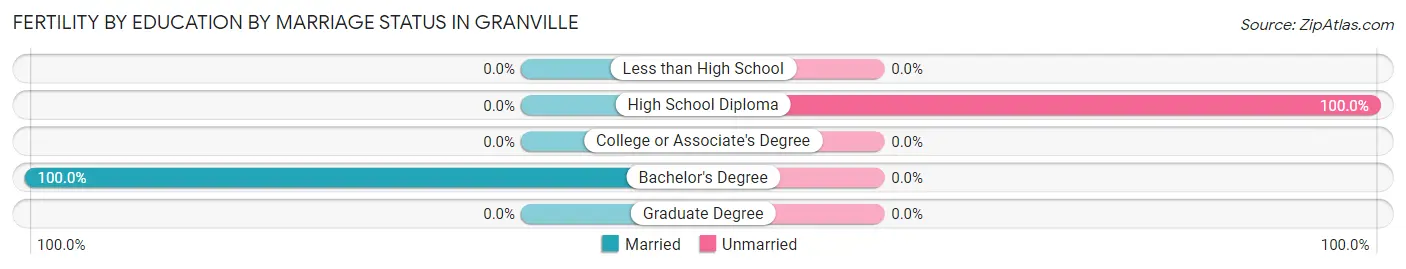
| Educational Attainment | Married | Unmarried |
| Less than High School | 0 (0.0%) | 0 (0.0%) |
| High School Diploma | 0 (0.0%) | 12 (100.0%) |
| College or Associate's Degree | 0 (0.0%) | 0 (0.0%) |
| Bachelor's Degree | 4 (100.0%) | 0 (0.0%) |
| Graduate Degree | 0 (0.0%) | 0 (0.0%) |
| Total | 4 (25.0%) | 12 (75.0%) |
Employment Characteristics in Granville
Employment by Class of Employer in Granville
Among the 647 employed individuals in Granville, private company employees (528 | 81.6%), federal government employees (36 | 5.6%), and state government employees (31 | 4.8%) make up the most common classes of employment.
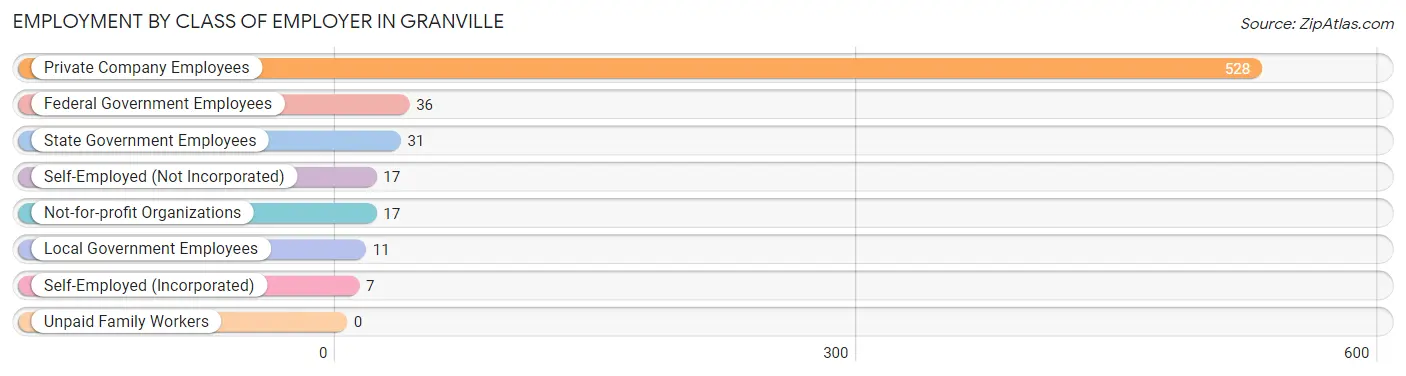
| Employer Class | # Employees | % Employees |
| Private Company Employees | 528 | 81.6% |
| Self-Employed (Incorporated) | 7 | 1.1% |
| Self-Employed (Not Incorporated) | 17 | 2.6% |
| Not-for-profit Organizations | 17 | 2.6% |
| Local Government Employees | 11 | 1.7% |
| State Government Employees | 31 | 4.8% |
| Federal Government Employees | 36 | 5.6% |
| Unpaid Family Workers | 0 | 0.0% |
| Total | 647 | 100.0% |
Employment Status by Age in Granville
According to the labor force statistics for Granville, out of the total population over 16 years of age (1,283), 60.1% or 771 individuals are in the labor force, with 10.4% or 80 of them unemployed. The age group with the highest labor force participation rate is 30 to 34 years, with 100.0% or 102 individuals in the labor force. Within the labor force, the 25 to 29 years age range has the highest percentage of unemployed individuals, with 45.4% or 59 of them being unemployed.
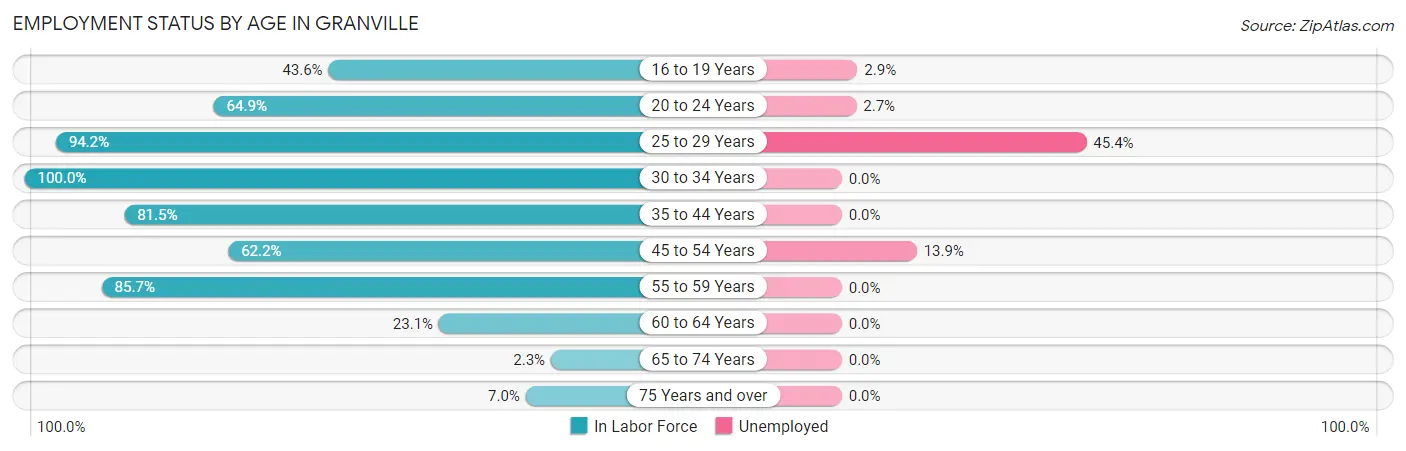
| Age Bracket | In Labor Force | Unemployed |
| 16 to 19 Years | 68 (43.6%) | 2 (2.9%) |
| 20 to 24 Years | 296 (64.9%) | 8 (2.7%) |
| 25 to 29 Years | 130 (94.2%) | 59 (45.4%) |
| 30 to 34 Years | 102 (100.0%) | 0 (0.0%) |
| 35 to 44 Years | 44 (81.5%) | 0 (0.0%) |
| 45 to 54 Years | 79 (62.2%) | 11 (13.9%) |
| 55 to 59 Years | 42 (85.7%) | 0 (0.0%) |
| 60 to 64 Years | 3 (23.1%) | 0 (0.0%) |
| 65 to 74 Years | 3 (2.3%) | 0 (0.0%) |
| 75 Years and over | 4 (7.0%) | 0 (0.0%) |
| Total | 771 (60.1%) | 80 (10.4%) |
Employment Status by Educational Attainment in Granville
According to labor force statistics for Granville, 82.8% of individuals (400) out of the total population between 25 and 64 years of age (483) are in the labor force, with 17.5% or 70 of them being unemployed. The group with the highest labor force participation rate are those with the educational attainment of bachelor's degree or higher, with 100.0% or 124 individuals in the labor force. Within the labor force, individuals with high school diploma education have the highest percentage of unemployment, with 45.8% or 70 of them being unemployed.
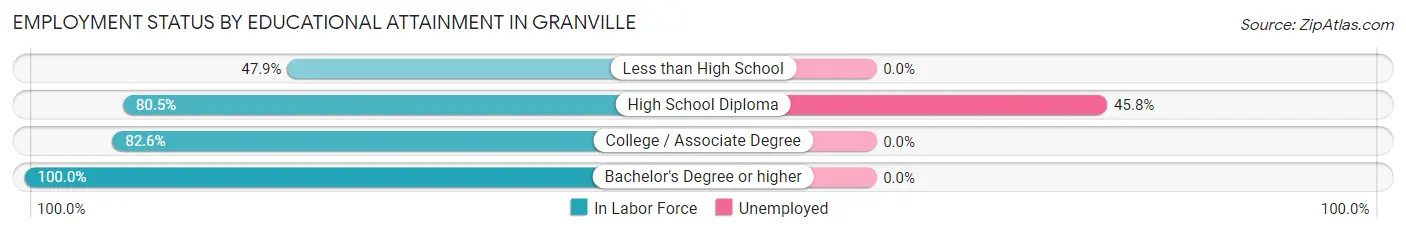
| Educational Attainment | In Labor Force | Unemployed |
| Less than High School | 23 (47.9%) | 0 (0.0%) |
| High School Diploma | 153 (80.5%) | 87 (45.8%) |
| College / Associate Degree | 100 (82.6%) | 0 (0.0%) |
| Bachelor's Degree or higher | 124 (100.0%) | 0 (0.0%) |
| Total | 400 (82.8%) | 85 (17.5%) |
Employment Occupations by Sex in Granville
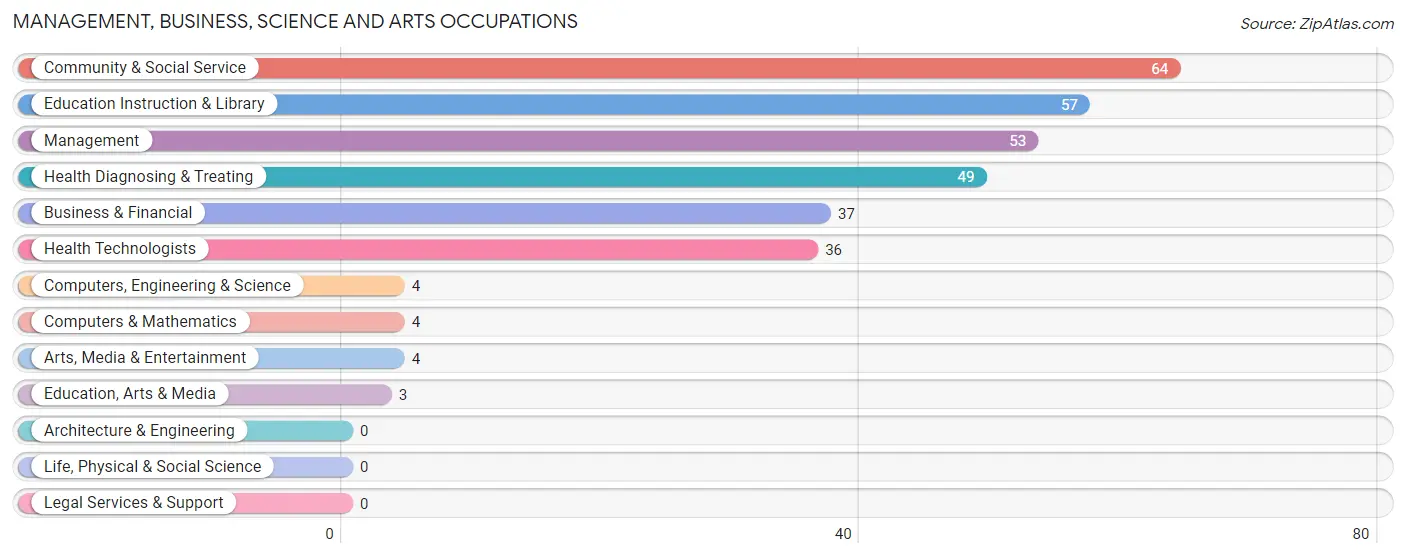
Management, Business, Science and Arts Occupations
The most common Management, Business, Science and Arts occupations in Granville are Community & Social Service (64 | 9.3%), Education Instruction & Library (57 | 8.3%), Management (53 | 7.7%), Health Diagnosing & Treating (49 | 7.1%), and Business & Financial (37 | 5.3%).
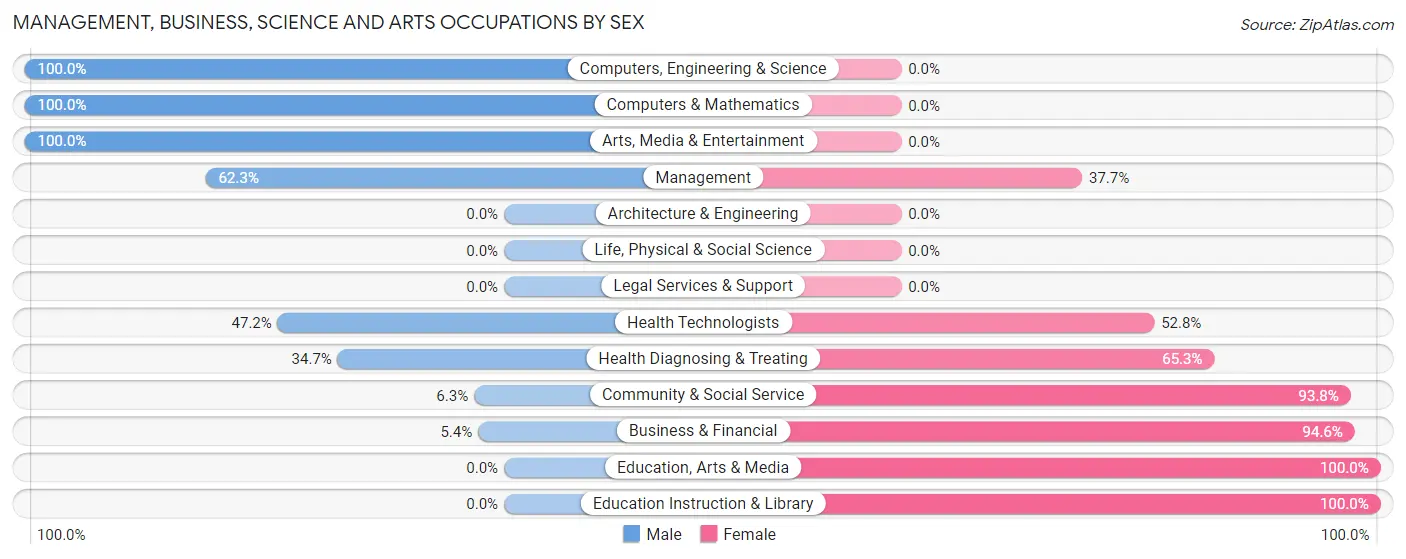
Management, Business, Science and Arts Occupations by Sex
Within the Management, Business, Science and Arts occupations in Granville, the most male-oriented occupations are Computers, Engineering & Science (100.0%), Computers & Mathematics (100.0%), and Arts, Media & Entertainment (100.0%), while the most female-oriented occupations are Education, Arts & Media (100.0%), Education Instruction & Library (100.0%), and Business & Financial (94.6%).
| Occupation | Male | Female |
| Management | 33 (62.3%) | 20 (37.7%) |
| Business & Financial | 2 (5.4%) | 35 (94.6%) |
| Computers, Engineering & Science | 4 (100.0%) | 0 (0.0%) |
| Computers & Mathematics | 4 (100.0%) | 0 (0.0%) |
| Architecture & Engineering | 0 (0.0%) | 0 (0.0%) |
| Life, Physical & Social Science | 0 (0.0%) | 0 (0.0%) |
| Community & Social Service | 4 (6.2%) | 60 (93.8%) |
| Education, Arts & Media | 0 (0.0%) | 3 (100.0%) |
| Legal Services & Support | 0 (0.0%) | 0 (0.0%) |
| Education Instruction & Library | 0 (0.0%) | 57 (100.0%) |
| Arts, Media & Entertainment | 4 (100.0%) | 0 (0.0%) |
| Health Diagnosing & Treating | 17 (34.7%) | 32 (65.3%) |
| Health Technologists | 17 (47.2%) | 19 (52.8%) |
| Total (Category) | 60 (29.0%) | 147 (71.0%) |
| Total (Overall) | 365 (52.8%) | 326 (47.2%) |
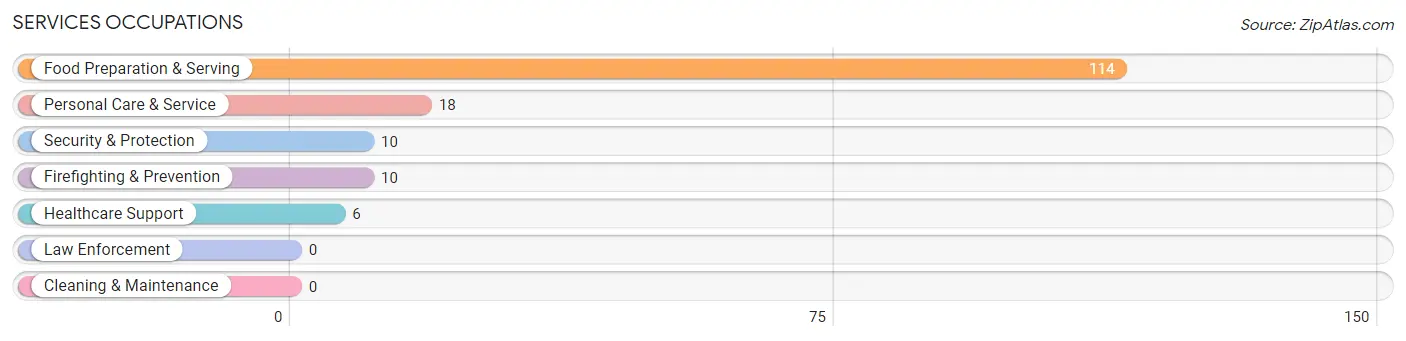
Services Occupations
The most common Services occupations in Granville are Food Preparation & Serving (114 | 16.5%), Personal Care & Service (18 | 2.6%), Security & Protection (10 | 1.5%), Firefighting & Prevention (10 | 1.5%), and Healthcare Support (6 | 0.9%).
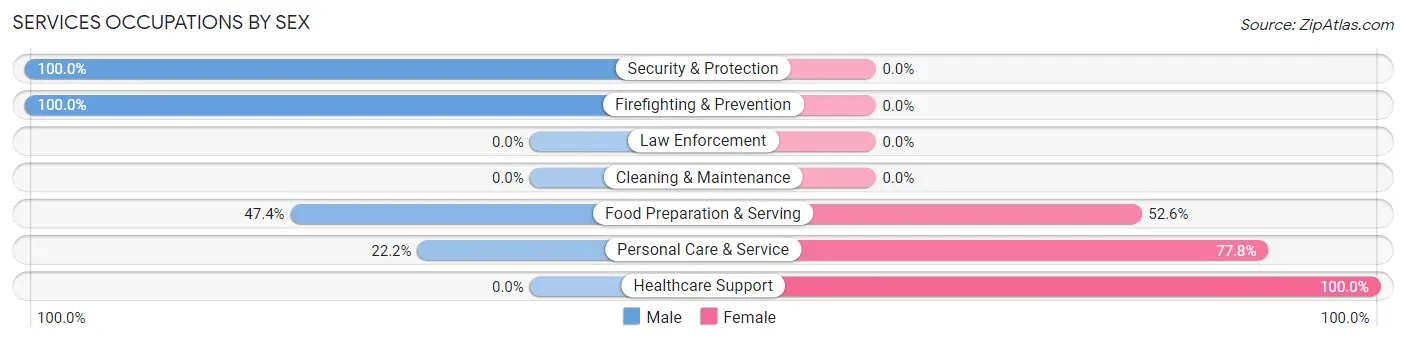
Services Occupations by Sex
Within the Services occupations in Granville, the most male-oriented occupations are Security & Protection (100.0%), Firefighting & Prevention (100.0%), and Food Preparation & Serving (47.4%), while the most female-oriented occupations are Healthcare Support (100.0%), Personal Care & Service (77.8%), and Food Preparation & Serving (52.6%).
| Occupation | Male | Female |
| Healthcare Support | 0 (0.0%) | 6 (100.0%) |
| Security & Protection | 10 (100.0%) | 0 (0.0%) |
| Firefighting & Prevention | 10 (100.0%) | 0 (0.0%) |
| Law Enforcement | 0 (0.0%) | 0 (0.0%) |
| Food Preparation & Serving | 54 (47.4%) | 60 (52.6%) |
| Cleaning & Maintenance | 0 (0.0%) | 0 (0.0%) |
| Personal Care & Service | 4 (22.2%) | 14 (77.8%) |
| Total (Category) | 68 (46.0%) | 80 (54.0%) |
| Total (Overall) | 365 (52.8%) | 326 (47.2%) |
Sales and Office Occupations
The most common Sales and Office occupations in Granville are Office & Administration (122 | 17.7%), and Sales & Related (88 | 12.7%).

Sales and Office Occupations by Sex

| Occupation | Male | Female |
| Sales & Related | 71 (80.7%) | 17 (19.3%) |
| Office & Administration | 69 (56.6%) | 53 (43.4%) |
| Total (Category) | 140 (66.7%) | 70 (33.3%) |
| Total (Overall) | 365 (52.8%) | 326 (47.2%) |
Natural Resources, Construction and Maintenance Occupations
The most common Natural Resources, Construction and Maintenance occupations in Granville are Installation, Maintenance & Repair (25 | 3.6%), and Construction & Extraction (5 | 0.7%).

Natural Resources, Construction and Maintenance Occupations by Sex

| Occupation | Male | Female |
| Farming, Fishing & Forestry | 0 (0.0%) | 0 (0.0%) |
| Construction & Extraction | 5 (100.0%) | 0 (0.0%) |
| Installation, Maintenance & Repair | 25 (100.0%) | 0 (0.0%) |
| Total (Category) | 30 (100.0%) | 0 (0.0%) |
| Total (Overall) | 365 (52.8%) | 326 (47.2%) |
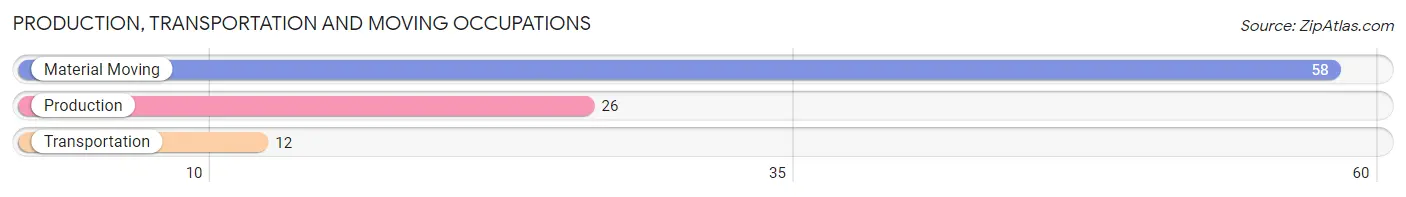
Production, Transportation and Moving Occupations
The most common Production, Transportation and Moving occupations in Granville are Material Moving (58 | 8.4%), Production (26 | 3.8%), and Transportation (12 | 1.7%).
Production, Transportation and Moving Occupations by Sex
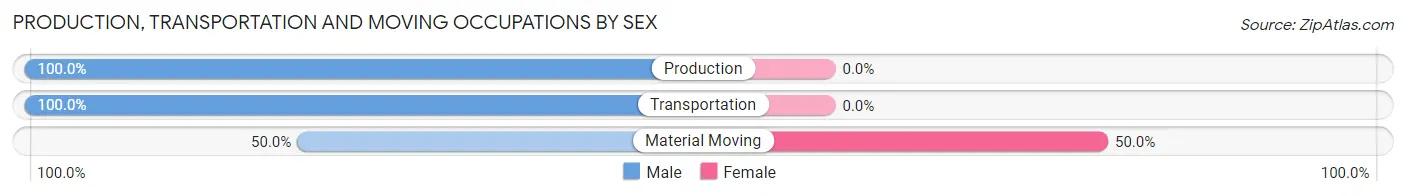
| Occupation | Male | Female |
| Production | 26 (100.0%) | 0 (0.0%) |
| Transportation | 12 (100.0%) | 0 (0.0%) |
| Material Moving | 29 (50.0%) | 29 (50.0%) |
| Total (Category) | 67 (69.8%) | 29 (30.2%) |
| Total (Overall) | 365 (52.8%) | 326 (47.2%) |
Employment Industries by Sex in Granville
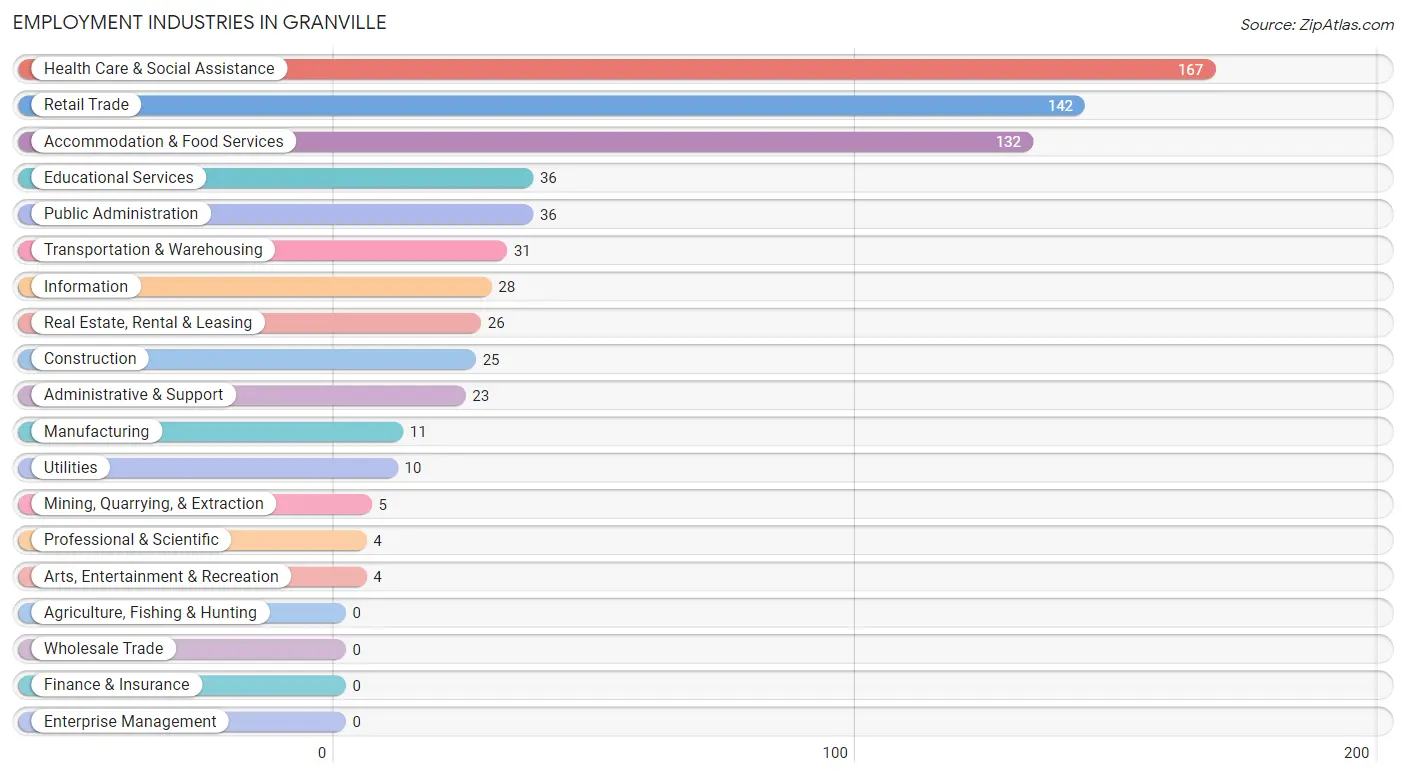
Employment Industries in Granville
The major employment industries in Granville include Health Care & Social Assistance (167 | 24.2%), Retail Trade (142 | 20.5%), Accommodation & Food Services (132 | 19.1%), Educational Services (36 | 5.2%), and Public Administration (36 | 5.2%).
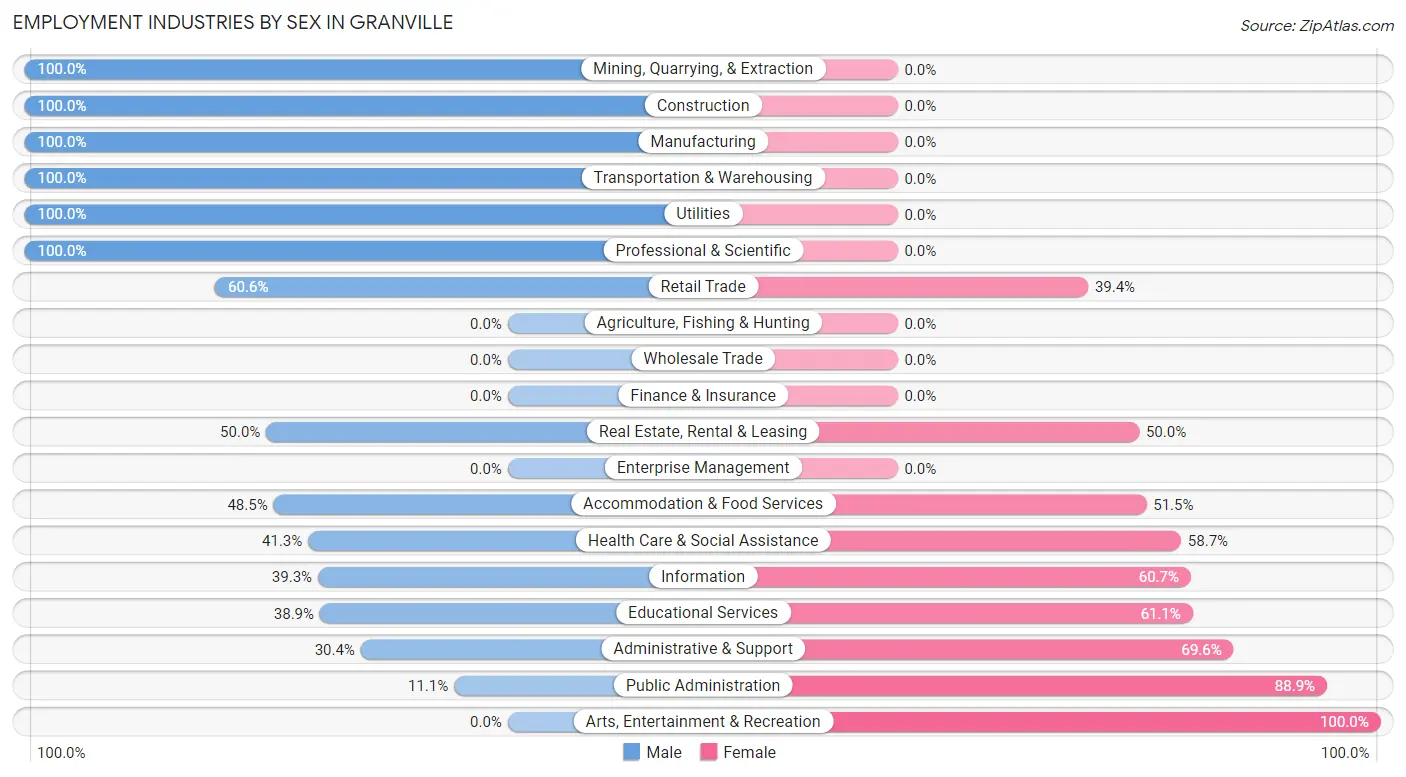
Employment Industries by Sex in Granville
The Granville industries that see more men than women are Mining, Quarrying, & Extraction (100.0%), Construction (100.0%), and Manufacturing (100.0%), whereas the industries that tend to have a higher number of women are Arts, Entertainment & Recreation (100.0%), Public Administration (88.9%), and Administrative & Support (69.6%).
| Industry | Male | Female |
| Agriculture, Fishing & Hunting | 0 (0.0%) | 0 (0.0%) |
| Mining, Quarrying, & Extraction | 5 (100.0%) | 0 (0.0%) |
| Construction | 25 (100.0%) | 0 (0.0%) |
| Manufacturing | 11 (100.0%) | 0 (0.0%) |
| Wholesale Trade | 0 (0.0%) | 0 (0.0%) |
| Retail Trade | 86 (60.6%) | 56 (39.4%) |
| Transportation & Warehousing | 31 (100.0%) | 0 (0.0%) |
| Utilities | 10 (100.0%) | 0 (0.0%) |
| Information | 11 (39.3%) | 17 (60.7%) |
| Finance & Insurance | 0 (0.0%) | 0 (0.0%) |
| Real Estate, Rental & Leasing | 13 (50.0%) | 13 (50.0%) |
| Professional & Scientific | 4 (100.0%) | 0 (0.0%) |
| Enterprise Management | 0 (0.0%) | 0 (0.0%) |
| Administrative & Support | 7 (30.4%) | 16 (69.6%) |
| Educational Services | 14 (38.9%) | 22 (61.1%) |
| Health Care & Social Assistance | 69 (41.3%) | 98 (58.7%) |
| Arts, Entertainment & Recreation | 0 (0.0%) | 4 (100.0%) |
| Accommodation & Food Services | 64 (48.5%) | 68 (51.5%) |
| Public Administration | 4 (11.1%) | 32 (88.9%) |
| Total | 365 (52.8%) | 326 (47.2%) |
Education in Granville
School Enrollment in Granville
The most common levels of schooling among the 613 students in Granville are college / undergraduate (503 | 82.1%), middle school (39 | 6.4%), and high school (29 | 4.7%).
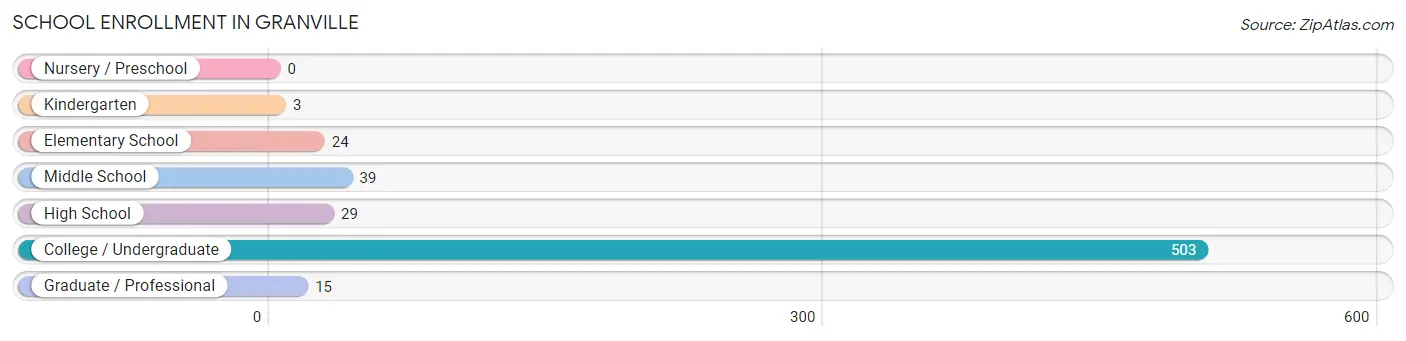
| School Level | # Students | % Students |
| Nursery / Preschool | 0 | 0.0% |
| Kindergarten | 3 | 0.5% |
| Elementary School | 24 | 3.9% |
| Middle School | 39 | 6.4% |
| High School | 29 | 4.7% |
| College / Undergraduate | 503 | 82.1% |
| Graduate / Professional | 15 | 2.5% |
| Total | 613 | 100.0% |
School Enrollment by Age by Funding Source in Granville
Out of a total of 613 students who are enrolled in schools in Granville, 18 (2.9%) attend a private institution, while the remaining 595 (97.1%) are enrolled in public schools. The age group of 20 to 24 year olds has the highest likelihood of being enrolled in private schools, with 18 (5.4% in the age bracket) enrolled. Conversely, the age group of 5 to 9 year old has the lowest likelihood of being enrolled in a private school, with 27 (100.0% in the age bracket) attending a public institution.
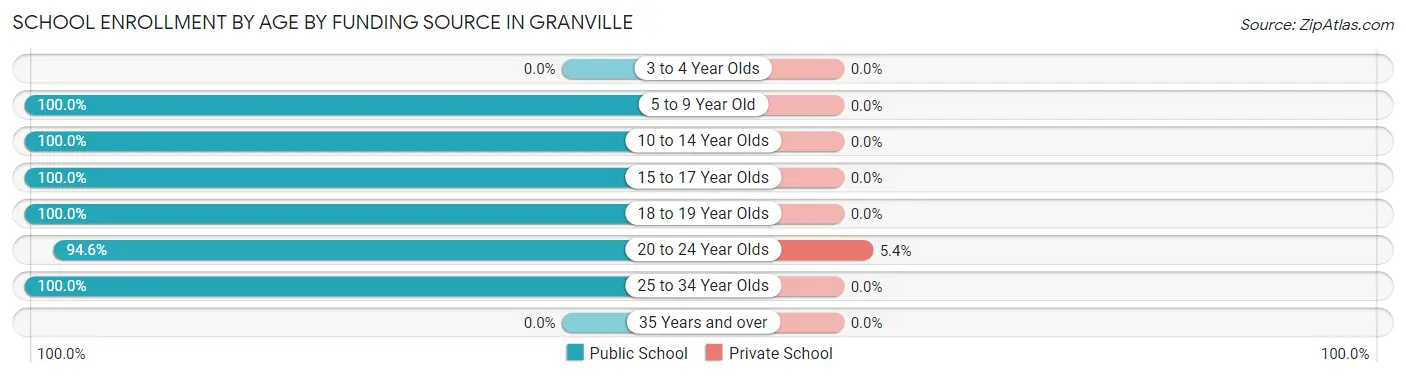
| Age Bracket | Public School | Private School |
| 3 to 4 Year Olds | 0 (0.0%) | 0 (0.0%) |
| 5 to 9 Year Old | 27 (100.0%) | 0 (0.0%) |
| 10 to 14 Year Olds | 46 (100.0%) | 0 (0.0%) |
| 15 to 17 Year Olds | 22 (100.0%) | 0 (0.0%) |
| 18 to 19 Year Olds | 134 (100.0%) | 0 (0.0%) |
| 20 to 24 Year Olds | 315 (94.6%) | 18 (5.4%) |
| 25 to 34 Year Olds | 51 (100.0%) | 0 (0.0%) |
| 35 Years and over | 0 (0.0%) | 0 (0.0%) |
| Total | 595 (97.1%) | 18 (2.9%) |
Educational Attainment by Field of Study in Granville
Arts & humanities (39 | 24.4%), bio, nature & agricultural (32 | 20.0%), science & technology (32 | 20.0%), education (20 | 12.5%), and literature & languages (12 | 7.5%) are the most common fields of study among 160 individuals in Granville who have obtained a bachelor's degree or higher.
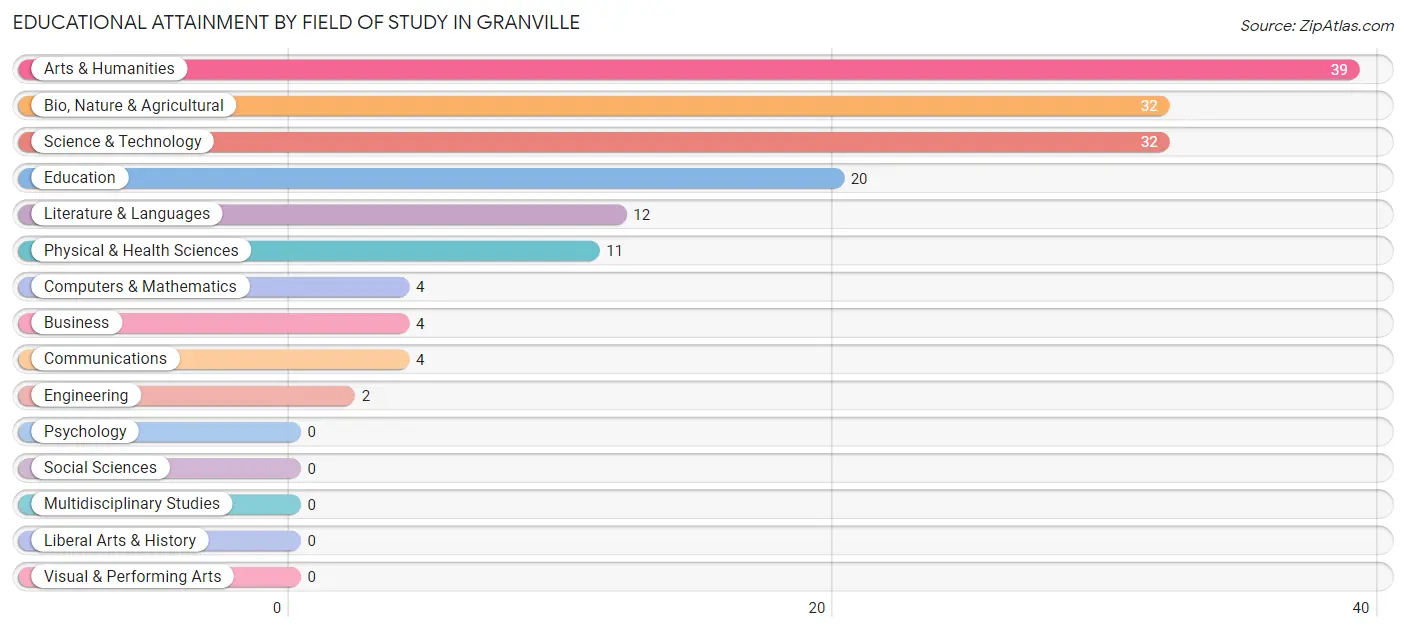
| Field of Study | # Graduates | % Graduates |
| Computers & Mathematics | 4 | 2.5% |
| Bio, Nature & Agricultural | 32 | 20.0% |
| Physical & Health Sciences | 11 | 6.9% |
| Psychology | 0 | 0.0% |
| Social Sciences | 0 | 0.0% |
| Engineering | 2 | 1.3% |
| Multidisciplinary Studies | 0 | 0.0% |
| Science & Technology | 32 | 20.0% |
| Business | 4 | 2.5% |
| Education | 20 | 12.5% |
| Literature & Languages | 12 | 7.5% |
| Liberal Arts & History | 0 | 0.0% |
| Visual & Performing Arts | 0 | 0.0% |
| Communications | 4 | 2.5% |
| Arts & Humanities | 39 | 24.4% |
| Total | 160 | 100.0% |
Transportation & Commute in Granville
Vehicle Availability by Sex in Granville
The most prevalent vehicle ownership categories in Granville are males with 1 vehicle (133, accounting for 36.4%) and females with 1 vehicle (41, making up 47.2%).
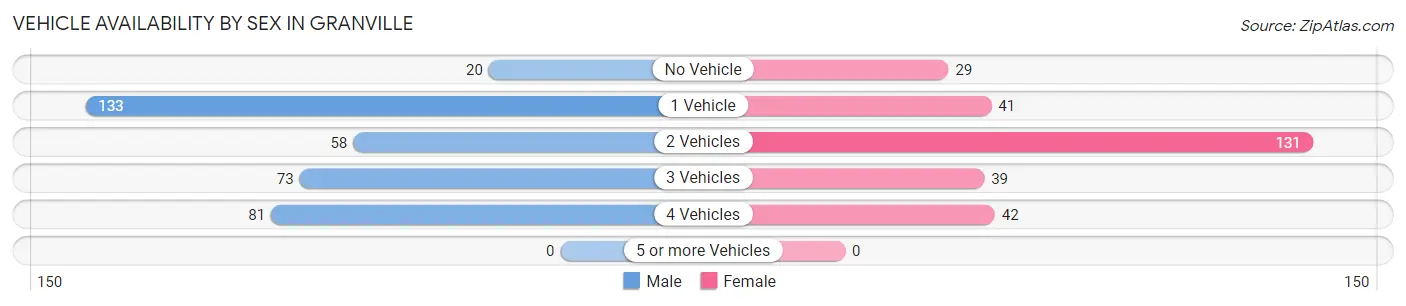
| Vehicles Available | Male | Female |
| No Vehicle | 20 (5.5%) | 29 (10.3%) |
| 1 Vehicle | 133 (36.4%) | 41 (14.5%) |
| 2 Vehicles | 58 (15.9%) | 131 (46.5%) |
| 3 Vehicles | 73 (20.0%) | 39 (13.8%) |
| 4 Vehicles | 81 (22.2%) | 42 (14.9%) |
| 5 or more Vehicles | 0 (0.0%) | 0 (0.0%) |
| Total | 365 (100.0%) | 282 (100.0%) |
Commute Time in Granville
The most frequently occuring commute durations in Granville are 5 to 9 minutes (166 commuters, 27.7%), 15 to 19 minutes (164 commuters, 27.4%), and 10 to 14 minutes (97 commuters, 16.2%).
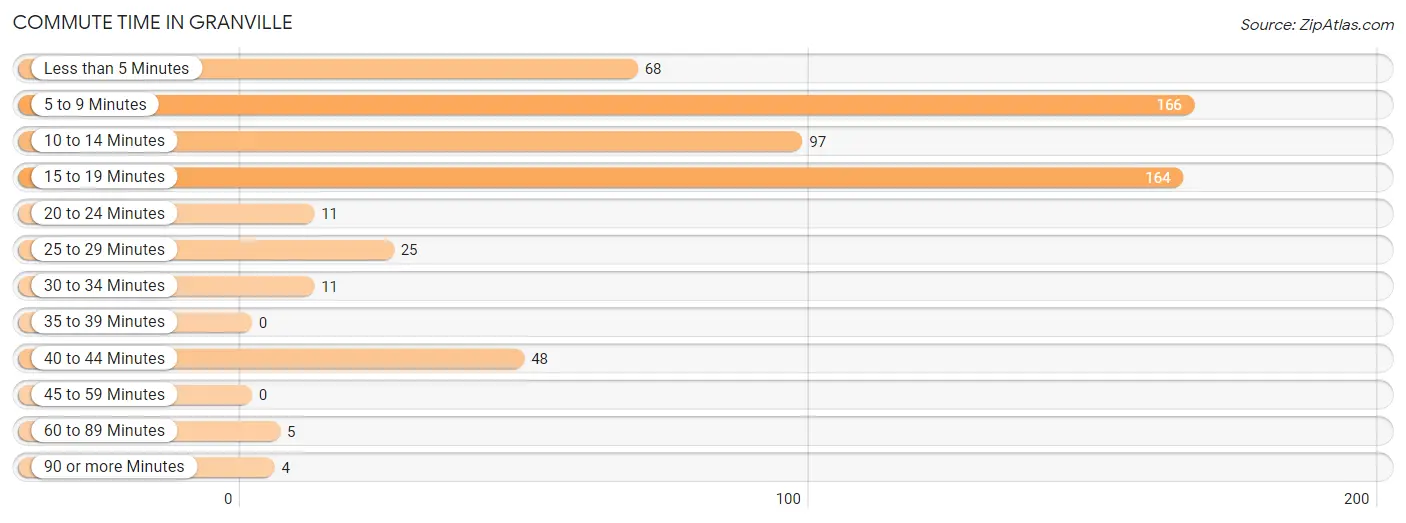
| Commute Time | # Commuters | % Commuters |
| Less than 5 Minutes | 68 | 11.4% |
| 5 to 9 Minutes | 166 | 27.7% |
| 10 to 14 Minutes | 97 | 16.2% |
| 15 to 19 Minutes | 164 | 27.4% |
| 20 to 24 Minutes | 11 | 1.8% |
| 25 to 29 Minutes | 25 | 4.2% |
| 30 to 34 Minutes | 11 | 1.8% |
| 35 to 39 Minutes | 0 | 0.0% |
| 40 to 44 Minutes | 48 | 8.0% |
| 45 to 59 Minutes | 0 | 0.0% |
| 60 to 89 Minutes | 5 | 0.8% |
| 90 or more Minutes | 4 | 0.7% |
Commute Time by Sex in Granville
The most common commute times in Granville are 15 to 19 minutes (92 commuters, 25.9%) for males and 5 to 9 minutes (87 commuters, 35.7%) for females.
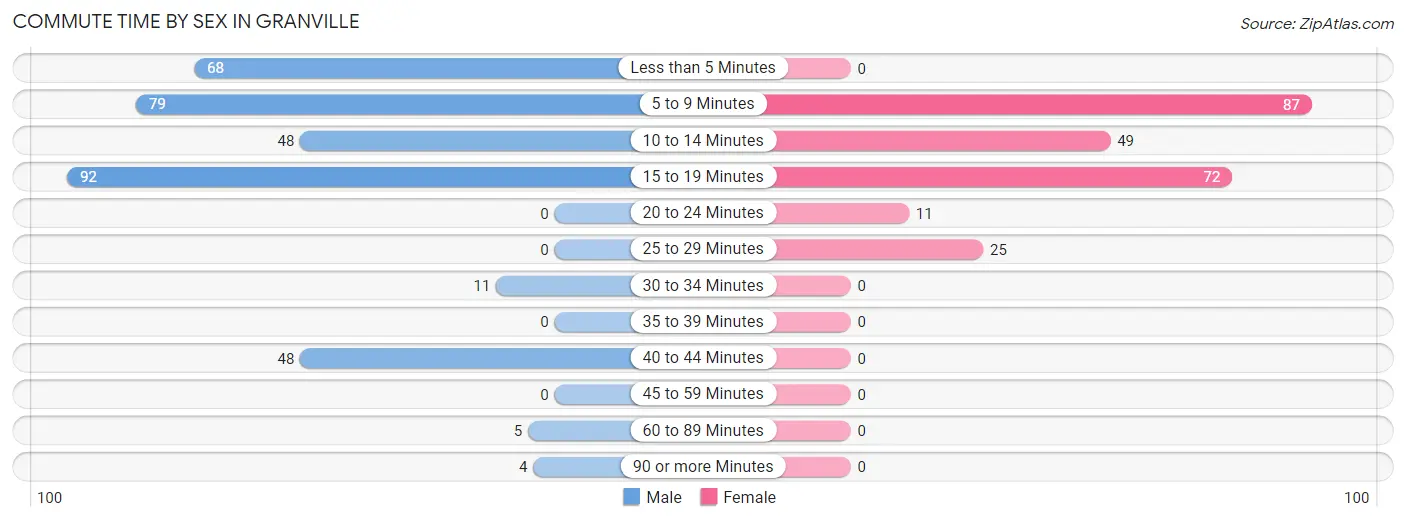
| Commute Time | Male | Female |
| Less than 5 Minutes | 68 (19.2%) | 0 (0.0%) |
| 5 to 9 Minutes | 79 (22.3%) | 87 (35.7%) |
| 10 to 14 Minutes | 48 (13.5%) | 49 (20.1%) |
| 15 to 19 Minutes | 92 (25.9%) | 72 (29.5%) |
| 20 to 24 Minutes | 0 (0.0%) | 11 (4.5%) |
| 25 to 29 Minutes | 0 (0.0%) | 25 (10.2%) |
| 30 to 34 Minutes | 11 (3.1%) | 0 (0.0%) |
| 35 to 39 Minutes | 0 (0.0%) | 0 (0.0%) |
| 40 to 44 Minutes | 48 (13.5%) | 0 (0.0%) |
| 45 to 59 Minutes | 0 (0.0%) | 0 (0.0%) |
| 60 to 89 Minutes | 5 (1.4%) | 0 (0.0%) |
| 90 or more Minutes | 4 (1.1%) | 0 (0.0%) |
Time of Departure to Work by Sex in Granville
The most frequent times of departure to work in Granville are 4:00 PM to 11:59 PM (123, 34.6%) for males and 12:00 PM to 3:59 PM (47, 19.3%) for females.
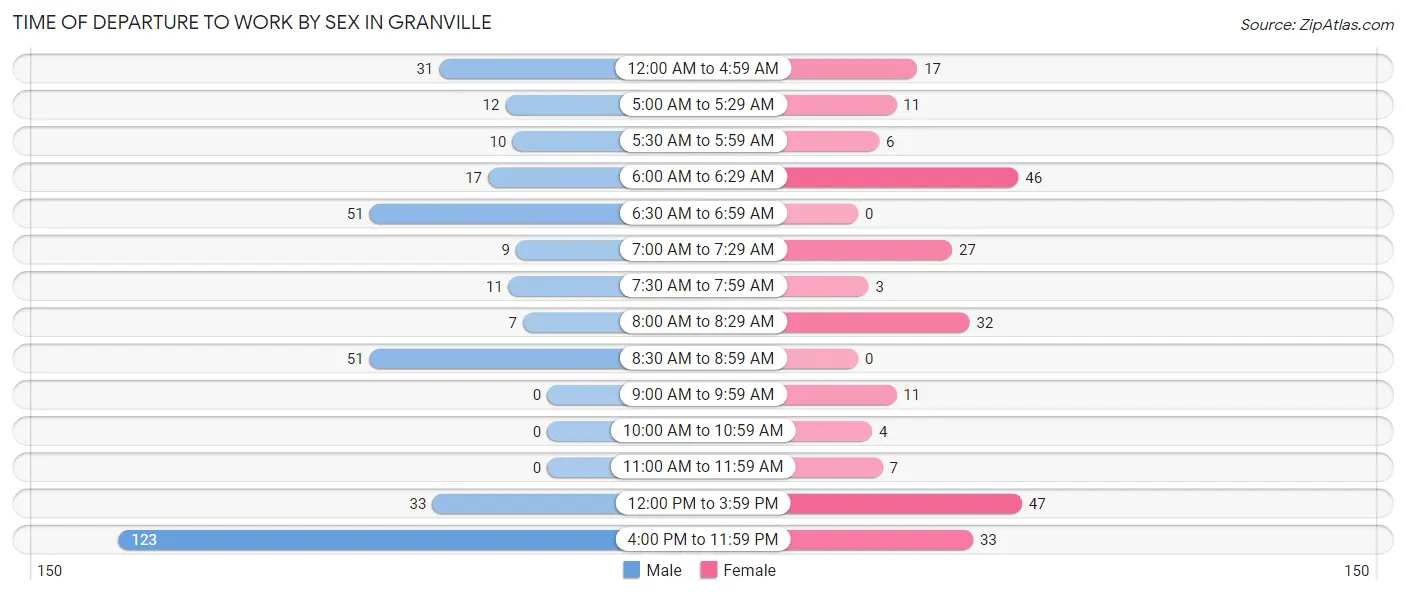
| Time of Departure | Male | Female |
| 12:00 AM to 4:59 AM | 31 (8.7%) | 17 (7.0%) |
| 5:00 AM to 5:29 AM | 12 (3.4%) | 11 (4.5%) |
| 5:30 AM to 5:59 AM | 10 (2.8%) | 6 (2.5%) |
| 6:00 AM to 6:29 AM | 17 (4.8%) | 46 (18.9%) |
| 6:30 AM to 6:59 AM | 51 (14.4%) | 0 (0.0%) |
| 7:00 AM to 7:29 AM | 9 (2.5%) | 27 (11.1%) |
| 7:30 AM to 7:59 AM | 11 (3.1%) | 3 (1.2%) |
| 8:00 AM to 8:29 AM | 7 (2.0%) | 32 (13.1%) |
| 8:30 AM to 8:59 AM | 51 (14.4%) | 0 (0.0%) |
| 9:00 AM to 9:59 AM | 0 (0.0%) | 11 (4.5%) |
| 10:00 AM to 10:59 AM | 0 (0.0%) | 4 (1.6%) |
| 11:00 AM to 11:59 AM | 0 (0.0%) | 7 (2.9%) |
| 12:00 PM to 3:59 PM | 33 (9.3%) | 47 (19.3%) |
| 4:00 PM to 11:59 PM | 123 (34.6%) | 33 (13.5%) |
| Total | 355 (100.0%) | 244 (100.0%) |
Housing Occupancy in Granville
Occupancy by Ownership in Granville
Of the total 628 dwellings in Granville, owner-occupied units account for 252 (40.1%), while renter-occupied units make up 376 (59.9%).
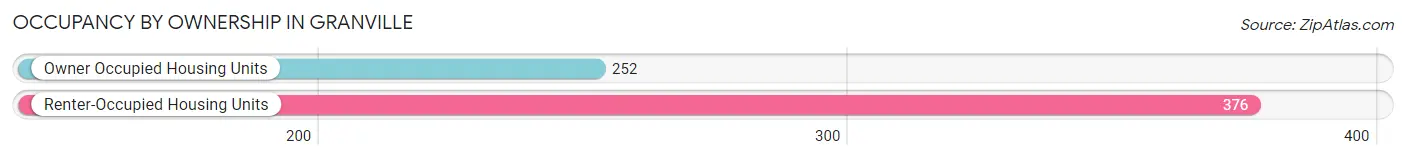
| Occupancy | # Housing Units | % Housing Units |
| Owner Occupied Housing Units | 252 | 40.1% |
| Renter-Occupied Housing Units | 376 | 59.9% |
| Total Occupied Housing Units | 628 | 100.0% |
Occupancy by Household Size in Granville
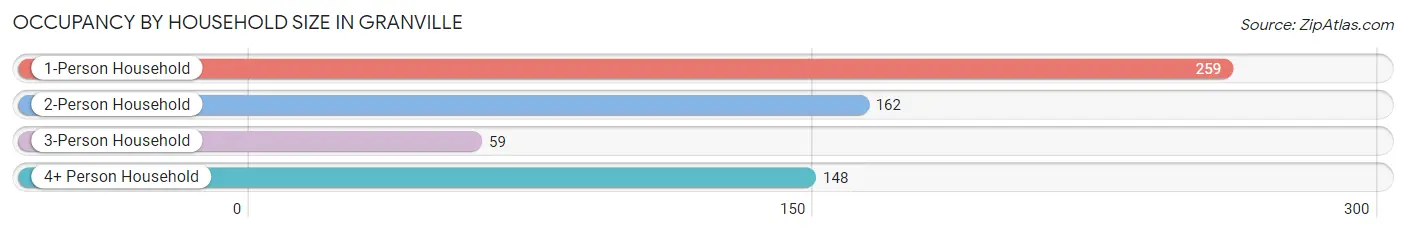
| Household Size | # Housing Units | % Housing Units |
| 1-Person Household | 259 | 41.2% |
| 2-Person Household | 162 | 25.8% |
| 3-Person Household | 59 | 9.4% |
| 4+ Person Household | 148 | 23.6% |
| Total Housing Units | 628 | 100.0% |
Occupancy by Ownership by Household Size in Granville
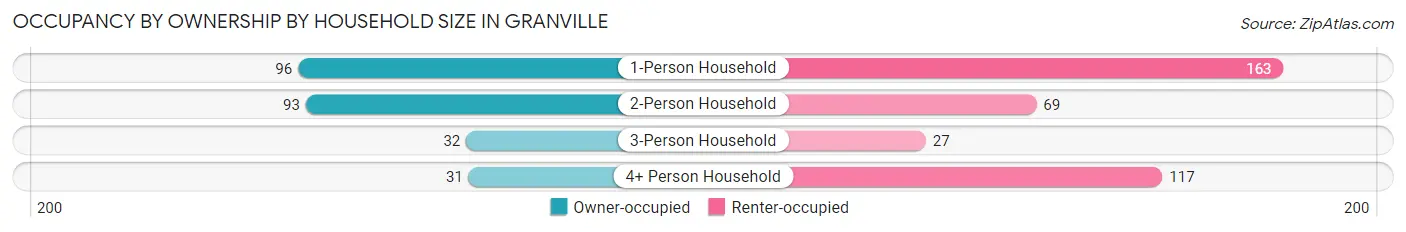
| Household Size | Owner-occupied | Renter-occupied |
| 1-Person Household | 96 (37.1%) | 163 (62.9%) |
| 2-Person Household | 93 (57.4%) | 69 (42.6%) |
| 3-Person Household | 32 (54.2%) | 27 (45.8%) |
| 4+ Person Household | 31 (20.9%) | 117 (79.0%) |
| Total Housing Units | 252 (40.1%) | 376 (59.9%) |
Occupancy by Educational Attainment in Granville
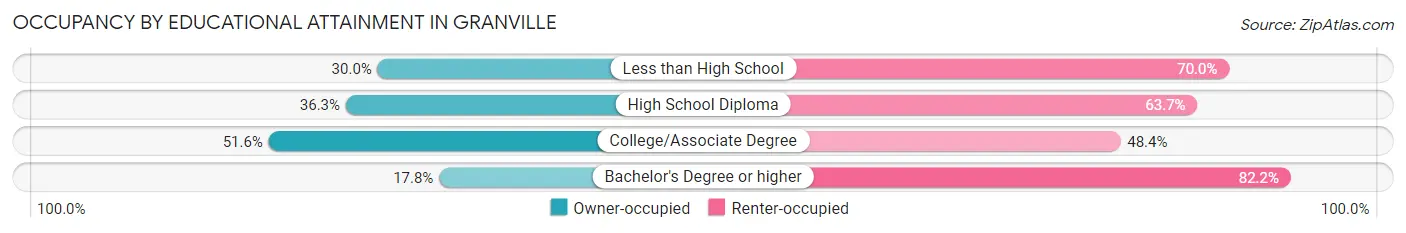
| Household Size | Owner-occupied | Renter-occupied |
| Less than High School | 9 (30.0%) | 21 (70.0%) |
| High School Diploma | 61 (36.3%) | 107 (63.7%) |
| College/Associate Degree | 161 (51.6%) | 151 (48.4%) |
| Bachelor's Degree or higher | 21 (17.8%) | 97 (82.2%) |
Occupancy by Age of Householder in Granville
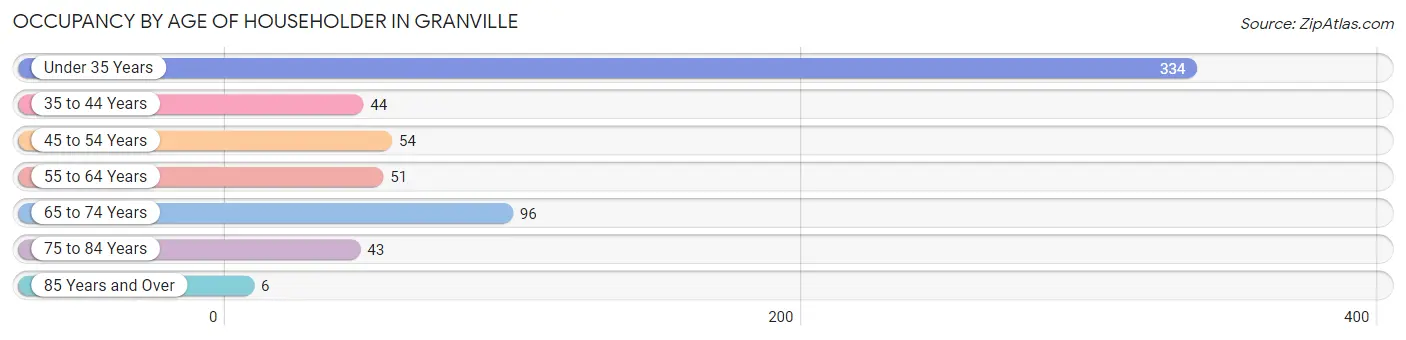
| Age Bracket | # Households | % Households |
| Under 35 Years | 334 | 53.2% |
| 35 to 44 Years | 44 | 7.0% |
| 45 to 54 Years | 54 | 8.6% |
| 55 to 64 Years | 51 | 8.1% |
| 65 to 74 Years | 96 | 15.3% |
| 75 to 84 Years | 43 | 6.9% |
| 85 Years and Over | 6 | 1.0% |
| Total | 628 | 100.0% |
Housing Finances in Granville
Median Income by Occupancy in Granville
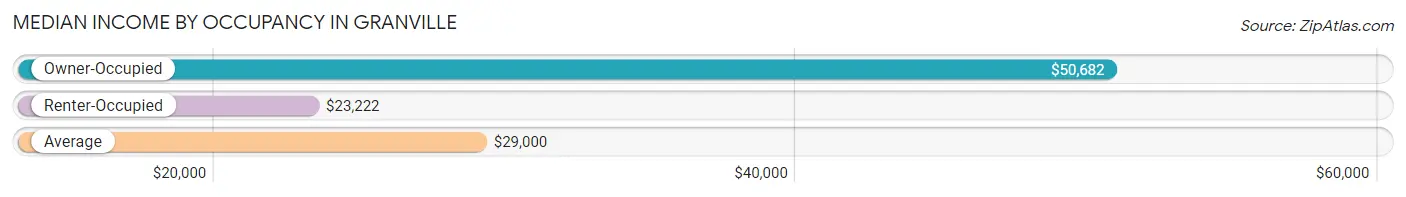
| Occupancy Type | # Households | Median Income |
| Owner-Occupied | 252 (40.1%) | $50,682 |
| Renter-Occupied | 376 (59.9%) | $23,222 |
| Average | 628 (100.0%) | $29,000 |
Occupancy by Householder Income Bracket in Granville
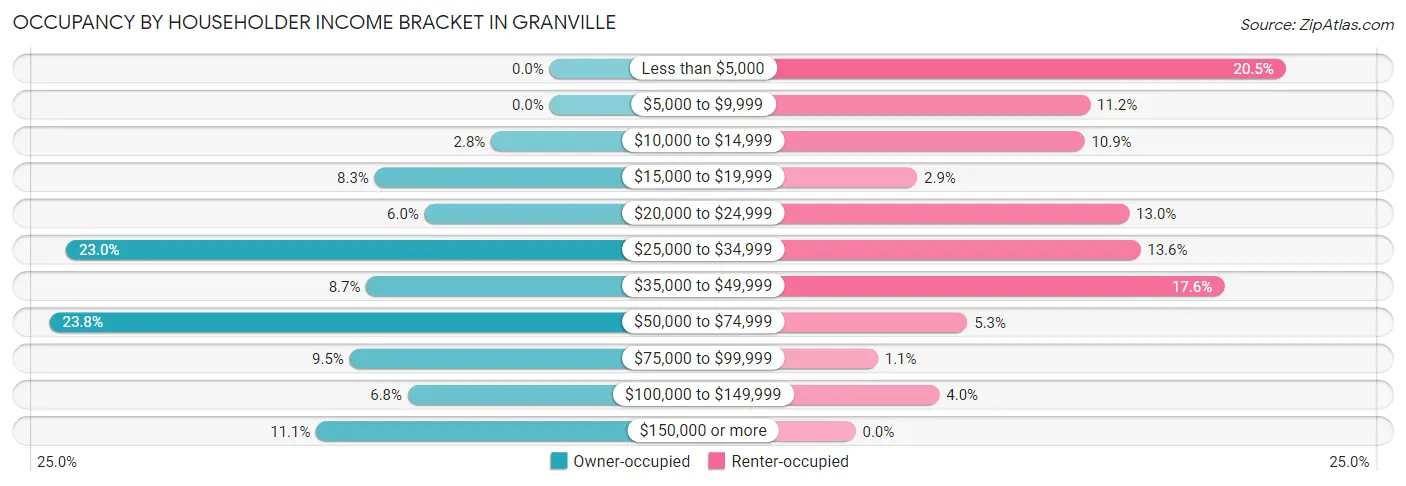
| Income Bracket | Owner-occupied | Renter-occupied |
| Less than $5,000 | 0 (0.0%) | 77 (20.5%) |
| $5,000 to $9,999 | 0 (0.0%) | 42 (11.2%) |
| $10,000 to $14,999 | 7 (2.8%) | 41 (10.9%) |
| $15,000 to $19,999 | 21 (8.3%) | 11 (2.9%) |
| $20,000 to $24,999 | 15 (5.9%) | 49 (13.0%) |
| $25,000 to $34,999 | 58 (23.0%) | 51 (13.6%) |
| $35,000 to $49,999 | 22 (8.7%) | 66 (17.5%) |
| $50,000 to $74,999 | 60 (23.8%) | 20 (5.3%) |
| $75,000 to $99,999 | 24 (9.5%) | 4 (1.1%) |
| $100,000 to $149,999 | 17 (6.8%) | 15 (4.0%) |
| $150,000 or more | 28 (11.1%) | 0 (0.0%) |
| Total | 252 (100.0%) | 376 (100.0%) |
Monthly Housing Cost Tiers in Granville
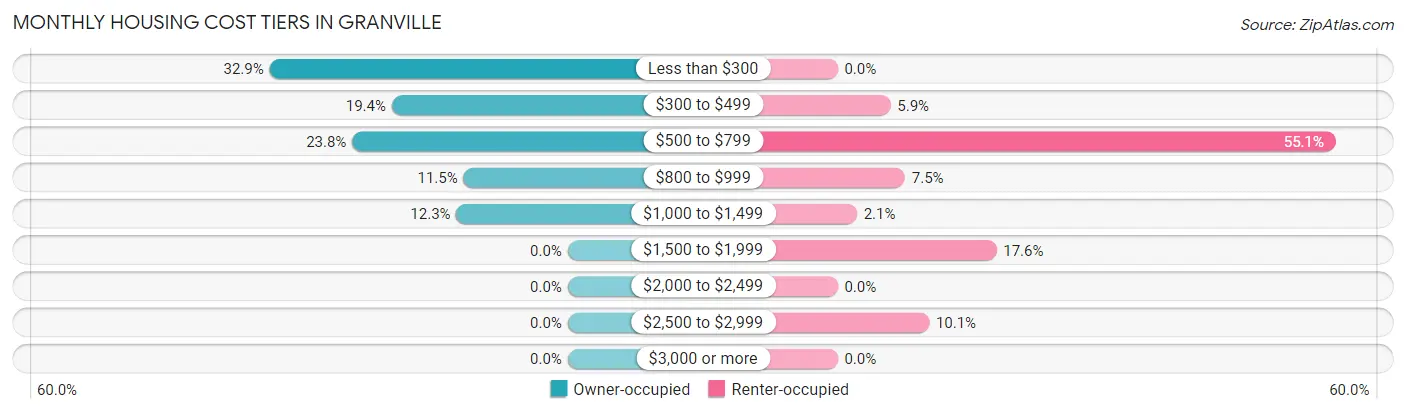
| Monthly Cost | Owner-occupied | Renter-occupied |
| Less than $300 | 83 (32.9%) | 0 (0.0%) |
| $300 to $499 | 49 (19.4%) | 22 (5.9%) |
| $500 to $799 | 60 (23.8%) | 207 (55.0%) |
| $800 to $999 | 29 (11.5%) | 28 (7.4%) |
| $1,000 to $1,499 | 31 (12.3%) | 8 (2.1%) |
| $1,500 to $1,999 | 0 (0.0%) | 66 (17.5%) |
| $2,000 to $2,499 | 0 (0.0%) | 0 (0.0%) |
| $2,500 to $2,999 | 0 (0.0%) | 38 (10.1%) |
| $3,000 or more | 0 (0.0%) | 0 (0.0%) |
| Total | 252 (100.0%) | 376 (100.0%) |
Physical Housing Characteristics in Granville
Housing Structures in Granville
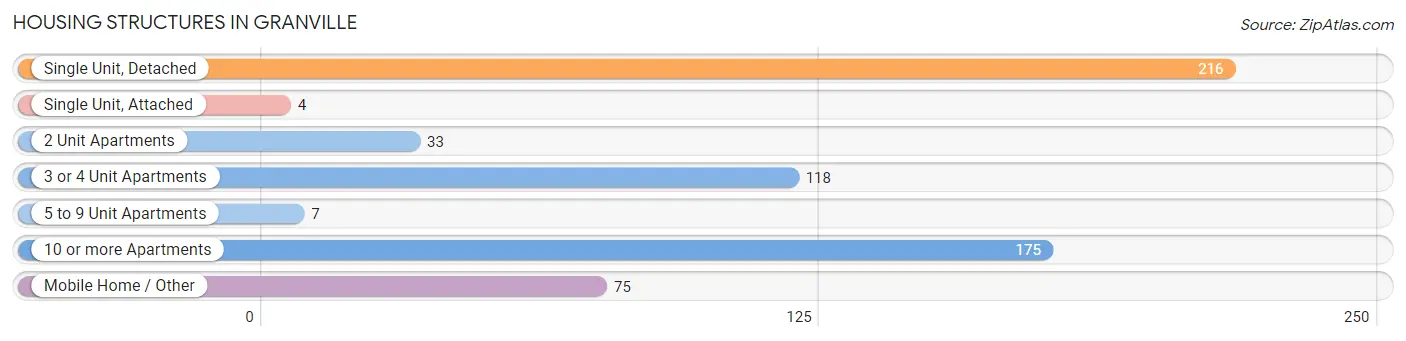
| Structure Type | # Housing Units | % Housing Units |
| Single Unit, Detached | 216 | 34.4% |
| Single Unit, Attached | 4 | 0.6% |
| 2 Unit Apartments | 33 | 5.2% |
| 3 or 4 Unit Apartments | 118 | 18.8% |
| 5 to 9 Unit Apartments | 7 | 1.1% |
| 10 or more Apartments | 175 | 27.9% |
| Mobile Home / Other | 75 | 11.9% |
| Total | 628 | 100.0% |
Housing Structures by Occupancy in Granville
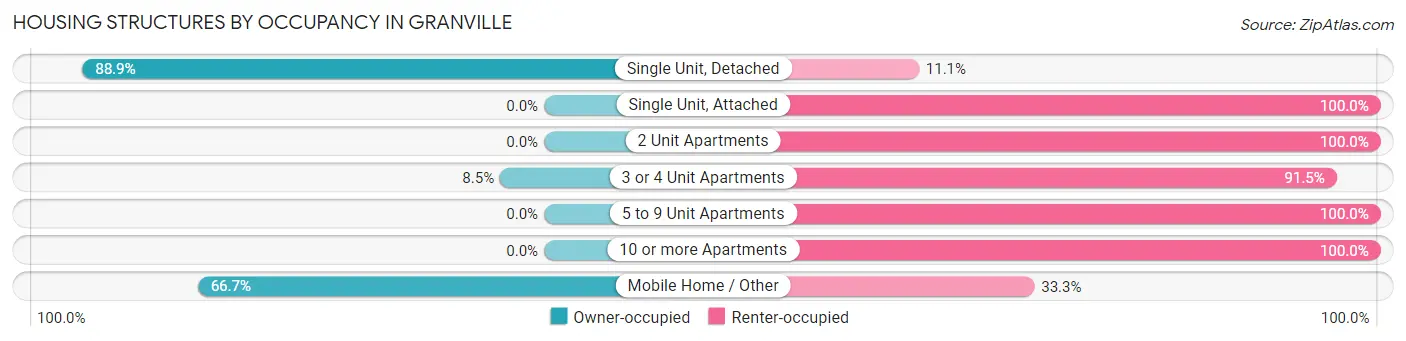
| Structure Type | Owner-occupied | Renter-occupied |
| Single Unit, Detached | 192 (88.9%) | 24 (11.1%) |
| Single Unit, Attached | 0 (0.0%) | 4 (100.0%) |
| 2 Unit Apartments | 0 (0.0%) | 33 (100.0%) |
| 3 or 4 Unit Apartments | 10 (8.5%) | 108 (91.5%) |
| 5 to 9 Unit Apartments | 0 (0.0%) | 7 (100.0%) |
| 10 or more Apartments | 0 (0.0%) | 175 (100.0%) |
| Mobile Home / Other | 50 (66.7%) | 25 (33.3%) |
| Total | 252 (40.1%) | 376 (59.9%) |
Housing Structures by Number of Rooms in Granville
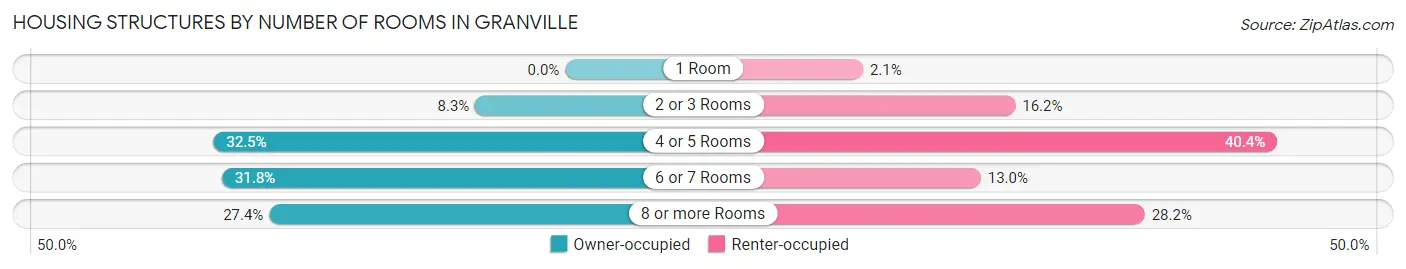
| Number of Rooms | Owner-occupied | Renter-occupied |
| 1 Room | 0 (0.0%) | 8 (2.1%) |
| 2 or 3 Rooms | 21 (8.3%) | 61 (16.2%) |
| 4 or 5 Rooms | 82 (32.5%) | 152 (40.4%) |
| 6 or 7 Rooms | 80 (31.8%) | 49 (13.0%) |
| 8 or more Rooms | 69 (27.4%) | 106 (28.2%) |
| Total | 252 (100.0%) | 376 (100.0%) |
Housing Structure by Heating Type in Granville
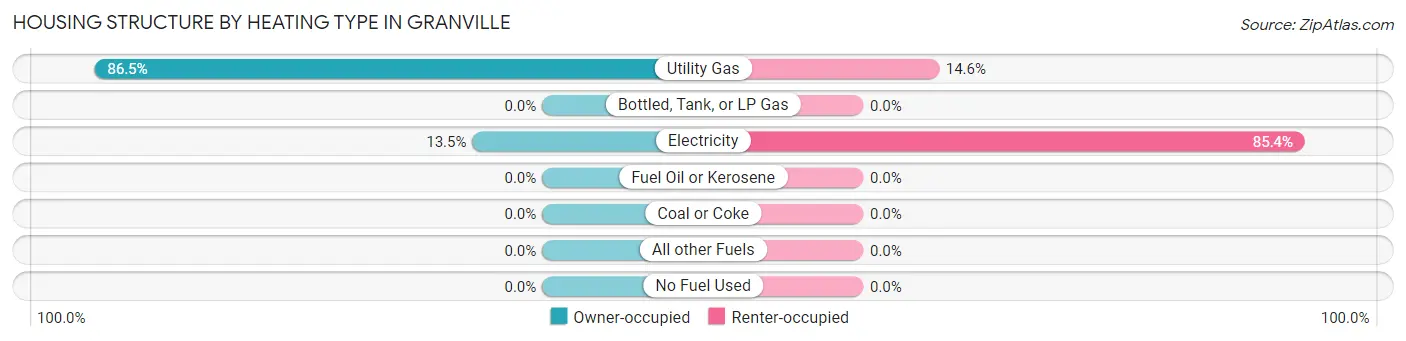
| Heating Type | Owner-occupied | Renter-occupied |
| Utility Gas | 218 (86.5%) | 55 (14.6%) |
| Bottled, Tank, or LP Gas | 0 (0.0%) | 0 (0.0%) |
| Electricity | 34 (13.5%) | 321 (85.4%) |
| Fuel Oil or Kerosene | 0 (0.0%) | 0 (0.0%) |
| Coal or Coke | 0 (0.0%) | 0 (0.0%) |
| All other Fuels | 0 (0.0%) | 0 (0.0%) |
| No Fuel Used | 0 (0.0%) | 0 (0.0%) |
| Total | 252 (100.0%) | 376 (100.0%) |
Household Vehicle Usage in Granville
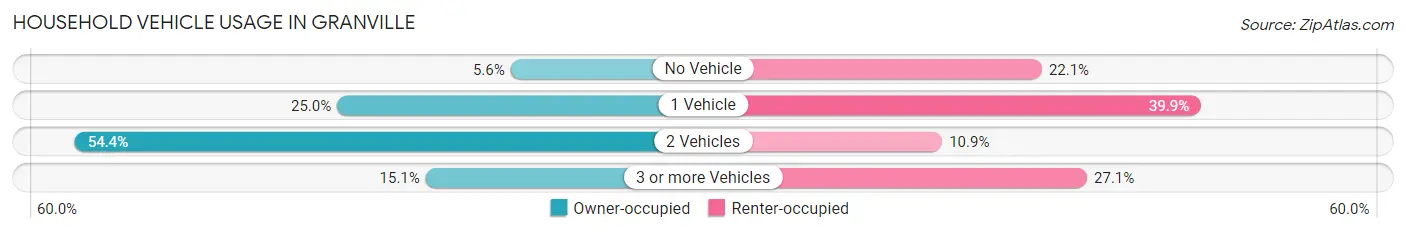
| Vehicles per Household | Owner-occupied | Renter-occupied |
| No Vehicle | 14 (5.6%) | 83 (22.1%) |
| 1 Vehicle | 63 (25.0%) | 150 (39.9%) |
| 2 Vehicles | 137 (54.4%) | 41 (10.9%) |
| 3 or more Vehicles | 38 (15.1%) | 102 (27.1%) |
| Total | 252 (100.0%) | 376 (100.0%) |
Real Estate & Mortgages in Granville
Real Estate and Mortgage Overview in Granville
| Characteristic | Without Mortgage | With Mortgage |
| Housing Units | 167 | 85 |
| Median Property Value | $119,600 | $120,100 |
| Median Household Income | $31,442 | $25 |
| Monthly Housing Costs | $305 | $0 |
| Real Estate Taxes | $498 | $16 |
Property Value by Mortgage Status in Granville
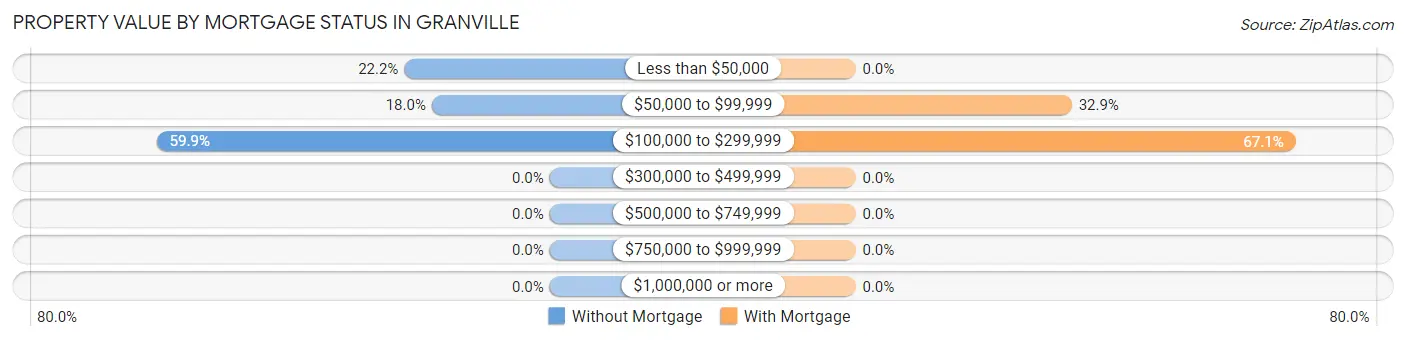
| Property Value | Without Mortgage | With Mortgage |
| Less than $50,000 | 37 (22.2%) | 0 (0.0%) |
| $50,000 to $99,999 | 30 (18.0%) | 28 (32.9%) |
| $100,000 to $299,999 | 100 (59.9%) | 57 (67.1%) |
| $300,000 to $499,999 | 0 (0.0%) | 0 (0.0%) |
| $500,000 to $749,999 | 0 (0.0%) | 0 (0.0%) |
| $750,000 to $999,999 | 0 (0.0%) | 0 (0.0%) |
| $1,000,000 or more | 0 (0.0%) | 0 (0.0%) |
| Total | 167 (100.0%) | 85 (100.0%) |
Household Income by Mortgage Status in Granville
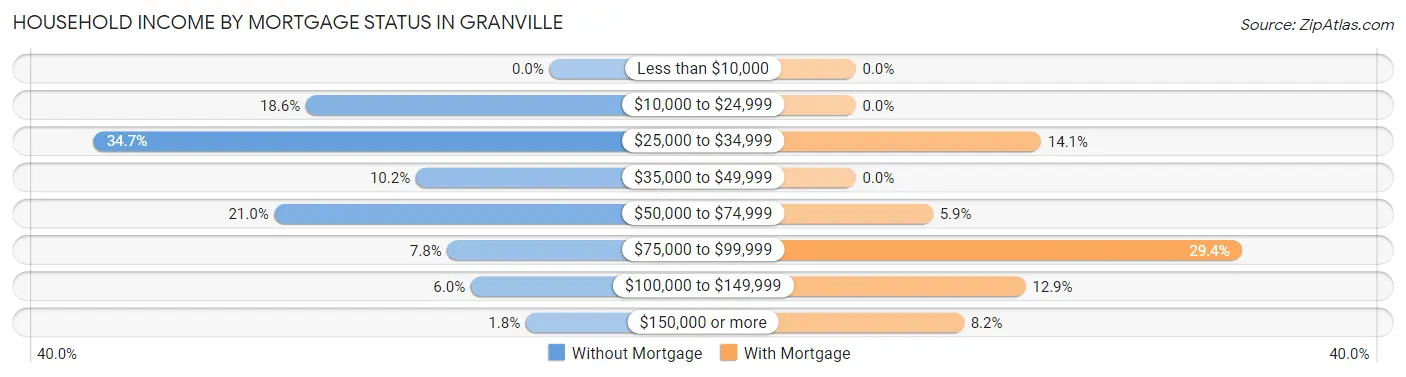
| Household Income | Without Mortgage | With Mortgage |
| Less than $10,000 | 0 (0.0%) | 0 (0.0%) |
| $10,000 to $24,999 | 31 (18.6%) | 0 (0.0%) |
| $25,000 to $34,999 | 58 (34.7%) | 12 (14.1%) |
| $35,000 to $49,999 | 17 (10.2%) | 0 (0.0%) |
| $50,000 to $74,999 | 35 (21.0%) | 5 (5.9%) |
| $75,000 to $99,999 | 13 (7.8%) | 25 (29.4%) |
| $100,000 to $149,999 | 10 (6.0%) | 11 (12.9%) |
| $150,000 or more | 3 (1.8%) | 7 (8.2%) |
| Total | 167 (100.0%) | 85 (100.0%) |
Property Value to Household Income Ratio in Granville
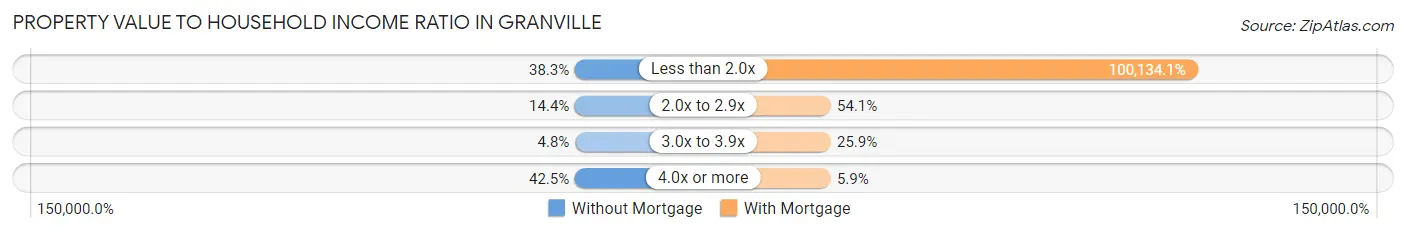
| Value-to-Income Ratio | Without Mortgage | With Mortgage |
| Less than 2.0x | 64 (38.3%) | 85,114 (100,134.1%) |
| 2.0x to 2.9x | 24 (14.4%) | 46 (54.1%) |
| 3.0x to 3.9x | 8 (4.8%) | 22 (25.9%) |
| 4.0x or more | 71 (42.5%) | 5 (5.9%) |
| Total | 167 (100.0%) | 85 (100.0%) |
Real Estate Taxes by Mortgage Status in Granville
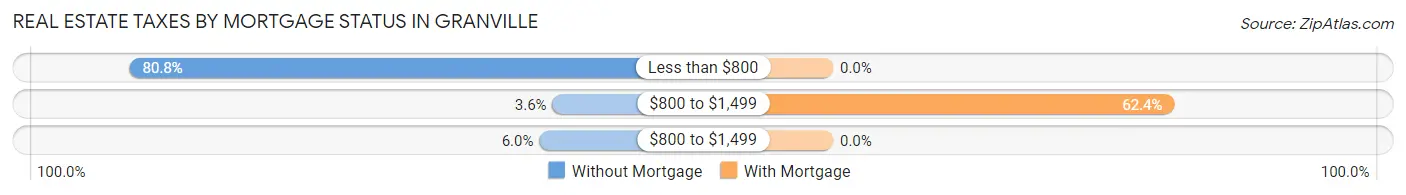
| Property Taxes | Without Mortgage | With Mortgage |
| Less than $800 | 135 (80.8%) | 0 (0.0%) |
| $800 to $1,499 | 6 (3.6%) | 53 (62.4%) |
| $800 to $1,499 | 10 (6.0%) | 0 (0.0%) |
| Total | 167 (100.0%) | 85 (100.0%) |
Health & Disability in Granville
Health Insurance Coverage by Age in Granville
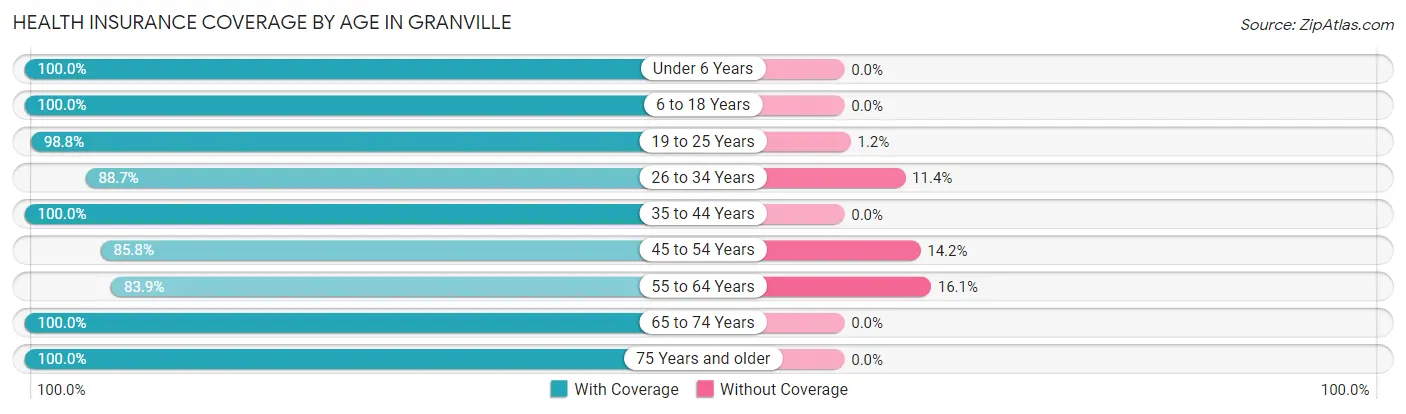
| Age Bracket | With Coverage | Without Coverage |
| Under 6 Years | 31 (100.0%) | 0 (0.0%) |
| 6 to 18 Years | 92 (100.0%) | 0 (0.0%) |
| 19 to 25 Years | 594 (98.8%) | 7 (1.2%) |
| 26 to 34 Years | 203 (88.6%) | 26 (11.4%) |
| 35 to 44 Years | 54 (100.0%) | 0 (0.0%) |
| 45 to 54 Years | 109 (85.8%) | 18 (14.2%) |
| 55 to 64 Years | 52 (83.9%) | 10 (16.1%) |
| 65 to 74 Years | 131 (100.0%) | 0 (0.0%) |
| 75 Years and older | 57 (100.0%) | 0 (0.0%) |
| Total | 1,323 (95.6%) | 61 (4.4%) |
Health Insurance Coverage by Citizenship Status in Granville
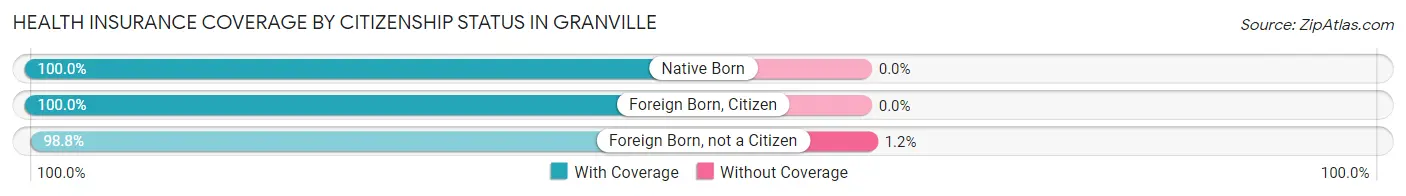
| Citizenship Status | With Coverage | Without Coverage |
| Native Born | 31 (100.0%) | 0 (0.0%) |
| Foreign Born, Citizen | 92 (100.0%) | 0 (0.0%) |
| Foreign Born, not a Citizen | 594 (98.8%) | 7 (1.2%) |
Health Insurance Coverage by Household Income in Granville
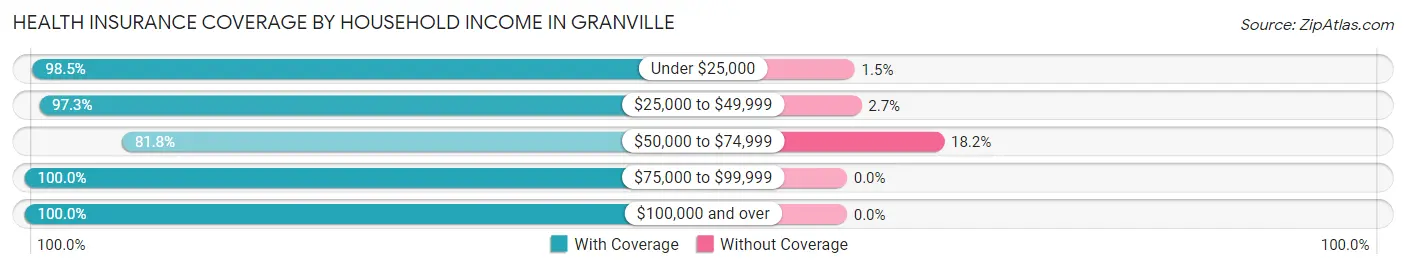
| Household Income | With Coverage | Without Coverage |
| Under $25,000 | 536 (98.5%) | 8 (1.5%) |
| $25,000 to $49,999 | 357 (97.3%) | 10 (2.7%) |
| $50,000 to $74,999 | 193 (81.8%) | 43 (18.2%) |
| $75,000 to $99,999 | 96 (100.0%) | 0 (0.0%) |
| $100,000 and over | 141 (100.0%) | 0 (0.0%) |
Public vs Private Health Insurance Coverage by Age in Granville
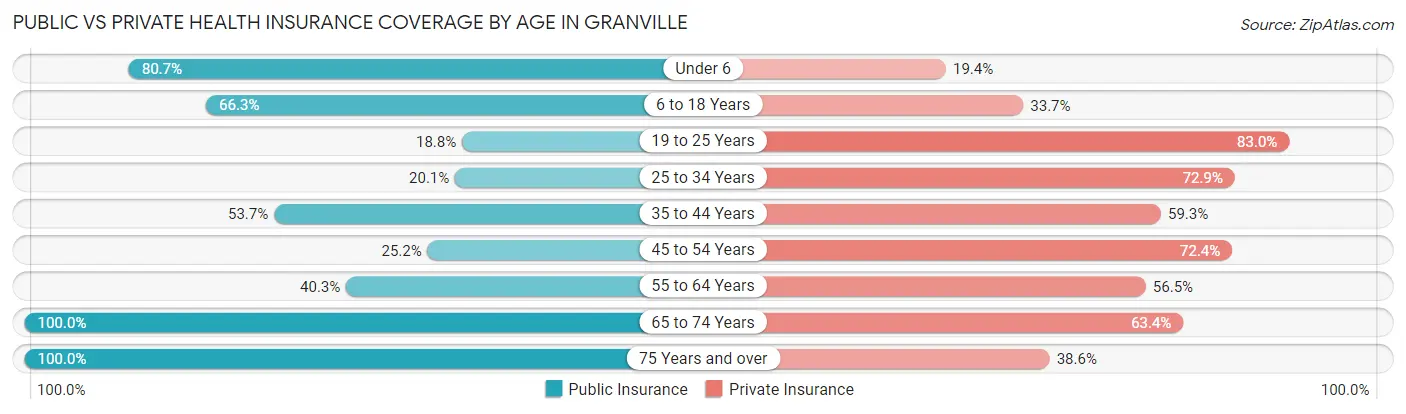
| Age Bracket | Public Insurance | Private Insurance |
| Under 6 | 25 (80.6%) | 6 (19.4%) |
| 6 to 18 Years | 61 (66.3%) | 31 (33.7%) |
| 19 to 25 Years | 113 (18.8%) | 499 (83.0%) |
| 25 to 34 Years | 46 (20.1%) | 167 (72.9%) |
| 35 to 44 Years | 29 (53.7%) | 32 (59.3%) |
| 45 to 54 Years | 32 (25.2%) | 92 (72.4%) |
| 55 to 64 Years | 25 (40.3%) | 35 (56.5%) |
| 65 to 74 Years | 131 (100.0%) | 83 (63.4%) |
| 75 Years and over | 57 (100.0%) | 22 (38.6%) |
| Total | 519 (37.5%) | 967 (69.9%) |
Disability Status by Sex by Age in Granville
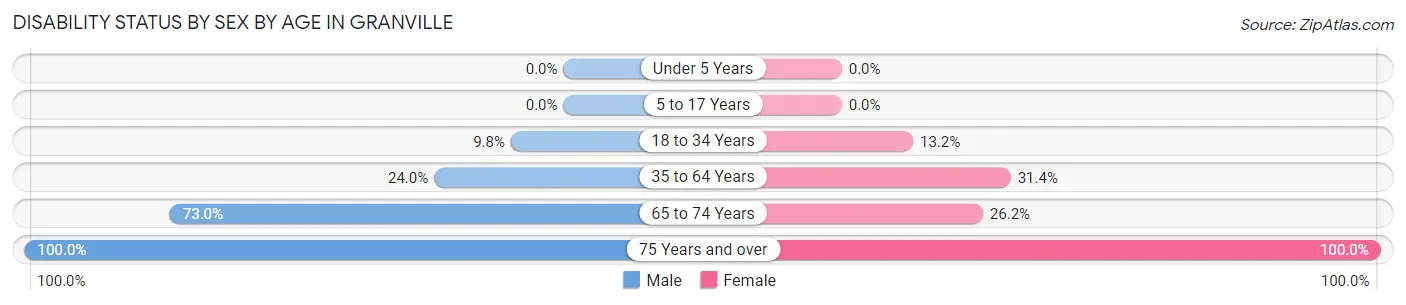
| Age Bracket | Male | Female |
| Under 5 Years | 0 (0.0%) | 0 (0.0%) |
| 5 to 17 Years | 0 (0.0%) | 0 (0.0%) |
| 18 to 34 Years | 47 (9.8%) | 46 (13.2%) |
| 35 to 64 Years | 30 (24.0%) | 37 (31.4%) |
| 65 to 74 Years | 65 (73.0%) | 11 (26.2%) |
| 75 Years and over | 26 (100.0%) | 31 (100.0%) |
Disability Class by Sex by Age in Granville
Disability Class: Hearing Difficulty
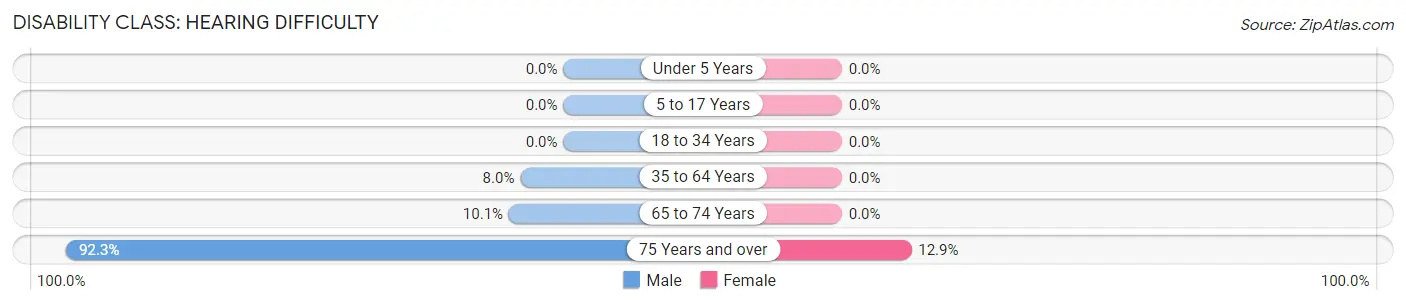
| Age Bracket | Male | Female |
| Under 5 Years | 0 (0.0%) | 0 (0.0%) |
| 5 to 17 Years | 0 (0.0%) | 0 (0.0%) |
| 18 to 34 Years | 0 (0.0%) | 0 (0.0%) |
| 35 to 64 Years | 10 (8.0%) | 0 (0.0%) |
| 65 to 74 Years | 9 (10.1%) | 0 (0.0%) |
| 75 Years and over | 24 (92.3%) | 4 (12.9%) |
Disability Class: Vision Difficulty
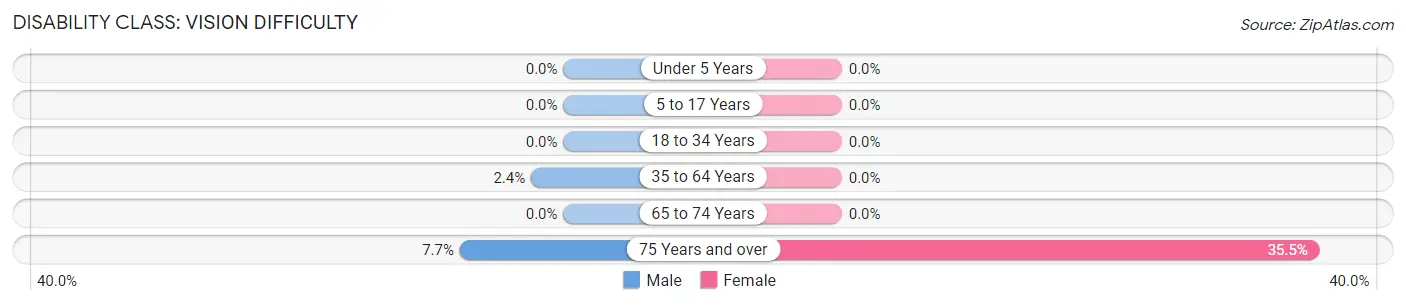
| Age Bracket | Male | Female |
| Under 5 Years | 0 (0.0%) | 0 (0.0%) |
| 5 to 17 Years | 0 (0.0%) | 0 (0.0%) |
| 18 to 34 Years | 0 (0.0%) | 0 (0.0%) |
| 35 to 64 Years | 3 (2.4%) | 0 (0.0%) |
| 65 to 74 Years | 0 (0.0%) | 0 (0.0%) |
| 75 Years and over | 2 (7.7%) | 11 (35.5%) |
Disability Class: Cognitive Difficulty
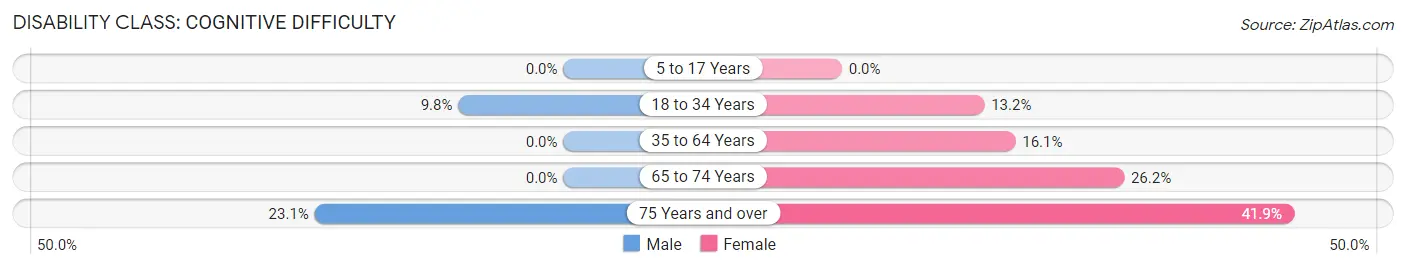
| Age Bracket | Male | Female |
| 5 to 17 Years | 0 (0.0%) | 0 (0.0%) |
| 18 to 34 Years | 47 (9.8%) | 46 (13.2%) |
| 35 to 64 Years | 0 (0.0%) | 19 (16.1%) |
| 65 to 74 Years | 0 (0.0%) | 11 (26.2%) |
| 75 Years and over | 6 (23.1%) | 13 (41.9%) |
Disability Class: Ambulatory Difficulty
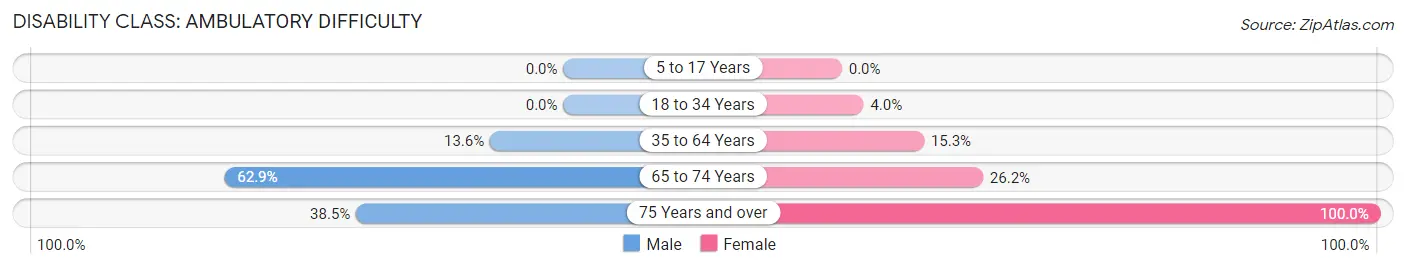
| Age Bracket | Male | Female |
| 5 to 17 Years | 0 (0.0%) | 0 (0.0%) |
| 18 to 34 Years | 0 (0.0%) | 14 (4.0%) |
| 35 to 64 Years | 17 (13.6%) | 18 (15.2%) |
| 65 to 74 Years | 56 (62.9%) | 11 (26.2%) |
| 75 Years and over | 10 (38.5%) | 31 (100.0%) |
Disability Class: Self-Care Difficulty
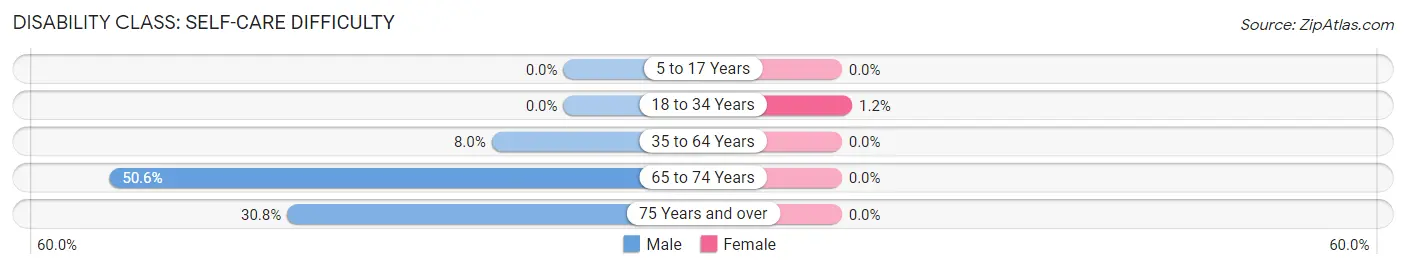
| Age Bracket | Male | Female |
| 5 to 17 Years | 0 (0.0%) | 0 (0.0%) |
| 18 to 34 Years | 0 (0.0%) | 4 (1.1%) |
| 35 to 64 Years | 10 (8.0%) | 0 (0.0%) |
| 65 to 74 Years | 45 (50.6%) | 0 (0.0%) |
| 75 Years and over | 8 (30.8%) | 0 (0.0%) |
Technology Access in Granville
Computing Device Access in Granville
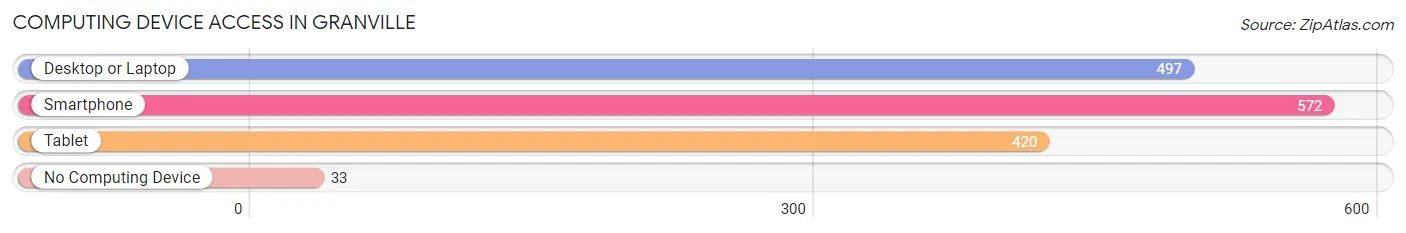
| Device Type | # Households | % Households |
| Desktop or Laptop | 497 | 79.1% |
| Smartphone | 572 | 91.1% |
| Tablet | 420 | 66.9% |
| No Computing Device | 33 | 5.2% |
| Total | 628 | 100.0% |
Internet Access in Granville
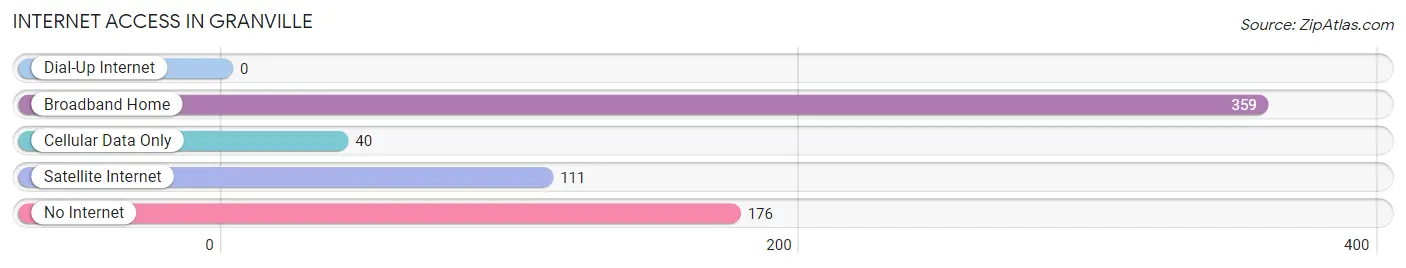
| Internet Type | # Households | % Households |
| Dial-Up Internet | 0 | 0.0% |
| Broadband Home | 359 | 57.2% |
| Cellular Data Only | 40 | 6.4% |
| Satellite Internet | 111 | 17.7% |
| No Internet | 176 | 28.0% |
| Total | 628 | 100.0% |
Granville Summary
Granville, West Virginia is a small town located in the northern part of the state, in Monongalia County. It is situated on the banks of the Monongahela River, and is part of the Morgantown Metropolitan Statistical Area. The town has a population of just over 1,000 people, and is known for its small-town charm and friendly atmosphere.
History
Granville was founded in 1817 by a group of settlers from Pennsylvania. The town was named after Granville, Massachusetts, the hometown of one of the settlers. The town was originally a farming community, and the settlers built a gristmill and a sawmill to help support the local economy.
In the late 19th century, the town began to grow and develop. The railroad came to town in 1881, and the town was incorporated in 1883. The railroad brought new industry to the area, and the town began to grow and prosper.
Geography
Granville is located in the northern part of West Virginia, in Monongalia County. It is situated on the banks of the Monongahela River, and is part of the Morgantown Metropolitan Statistical Area. The town is located in a hilly area, and is surrounded by forests and farmland.
The climate in Granville is humid continental, with hot summers and cold winters. The average annual temperature is around 50 degrees Fahrenheit, and the average annual precipitation is around 40 inches.
Economy
Granville’s economy is largely based on agriculture and tourism. The town is home to several farms, and the surrounding area is known for its production of apples, peaches, and other fruits and vegetables. The town also has several small businesses, including restaurants, shops, and other services.
Tourism is also an important part of the local economy. The town is home to several historic sites, including the Granville Historic District, which is listed on the National Register of Historic Places. The town also hosts several festivals and events throughout the year, including the Granville Apple Festival and the Granville Summer Festival.
Demographics
As of the 2010 census, Granville had a population of 1,039 people. The racial makeup of the town was 97.3% White, 0.7% African American, 0.3% Native American, 0.2% Asian, 0.1% Pacific Islander, and 1.4% from other races. The median household income was $37,917, and the median family income was $45,625.
Granville is a small town with a friendly atmosphere and a rich history. The town is home to several farms and businesses, and is a popular destination for tourists. The town has a diverse population, and is a great place to live and work.
Common Questions
What is Per Capita Income in Granville?
Per Capita income in Granville is $19,434.
What is the Median Family Income in Granville?
Median Family Income in Granville is $57,614.
What is the Median Household income in Granville?
Median Household Income in Granville is $29,000.
What is Inequality or Gini Index in Granville?
Inequality or Gini Index in Granville is 0.49.
What is the Total Population of Granville?
Total Population of Granville is 1,384.
What is the Total Male Population of Granville?
Total Male Population of Granville is 776.
What is the Total Female Population of Granville?
Total Female Population of Granville is 608.
What is the Ratio of Males per 100 Females in Granville?
There are 127.63 Males per 100 Females in Granville.
What is the Ratio of Females per 100 Males in Granville?
There are 78.35 Females per 100 Males in Granville.
What is the Median Population Age in Granville?
Median Population Age in Granville is 24.2 Years.
What is the Average Family Size in Granville
Average Family Size in Granville is 2.8 People.
What is the Average Household Size in Granville
Average Household Size in Granville is 2.2 People.
How Large is the Labor Force in Granville?
There are 771 People in the Labor Forcein in Granville.
What is the Percentage of People in the Labor Force in Granville?
60.1% of People are in the Labor Force in Granville.
What is the Unemployment Rate in Granville?
Unemployment Rate in Granville is 10.4%.