Ute vs Immigrants from England 3 or more Vehicles in Household
COMPARE
Ute
Immigrants from England
3 or more Vehicles in Household
3 or more Vehicles in Household Comparison
Ute
Immigrants from England
22.7%
3 OR MORE VEHICLES IN HOUSEHOLD
100.0/ 100
METRIC RATING
45th/ 347
METRIC RANK
20.7%
3 OR MORE VEHICLES IN HOUSEHOLD
96.2/ 100
METRIC RATING
113th/ 347
METRIC RANK
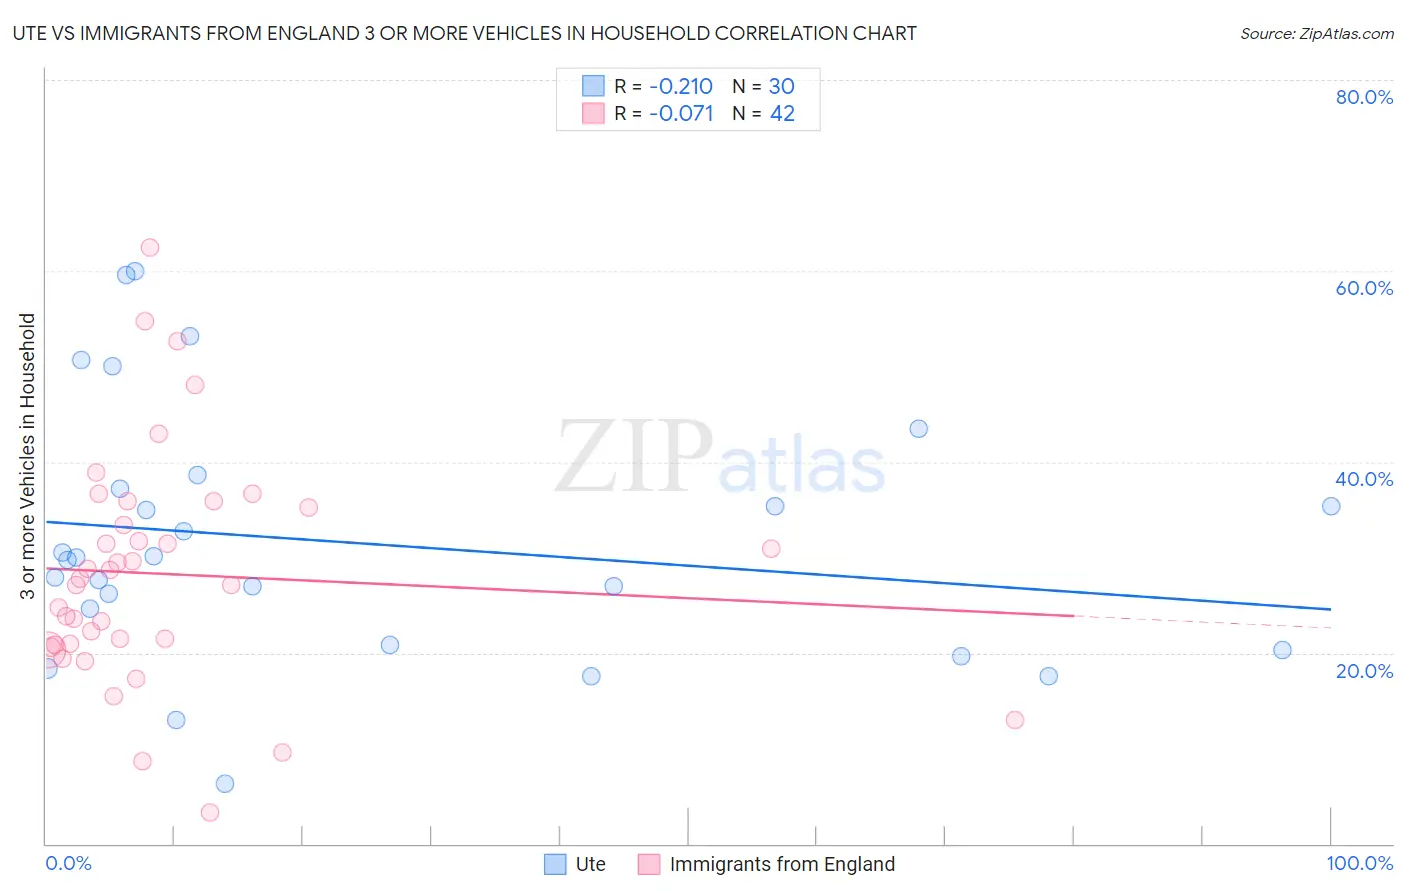
Ute vs Immigrants from England 3 or more Vehicles in Household Correlation Chart
The statistical analysis conducted on geographies consisting of 55,668,268 people shows a weak negative correlation between the proportion of Ute and percentage of households with 3 or more vehicles available in the United States with a correlation coefficient (R) of -0.210 and weighted average of 22.7%. Similarly, the statistical analysis conducted on geographies consisting of 391,649,997 people shows a slight negative correlation between the proportion of Immigrants from England and percentage of households with 3 or more vehicles available in the United States with a correlation coefficient (R) of -0.071 and weighted average of 20.7%, a difference of 9.6%.
3 or more Vehicles in Household Correlation Summary
| Measurement | Ute | Immigrants from England |
| Minimum | 6.3% | 3.3% |
| Maximum | 60.0% | 62.4% |
| Range | 53.7% | 59.1% |
| Mean | 31.5% | 28.2% |
| Median | 29.9% | 27.4% |
| Interquartile 25% (IQ1) | 20.8% | 20.8% |
| Interquartile 75% (IQ3) | 37.1% | 35.2% |
| Interquartile Range (IQR) | 16.3% | 14.4% |
| Standard Deviation (Sample) | 13.3% | 12.1% |
| Standard Deviation (Population) | 13.1% | 12.0% |
Similar Demographics by 3 or more Vehicles in Household
Demographics Similar to Ute by 3 or more Vehicles in Household
In terms of 3 or more vehicles in household, the demographic groups most similar to Ute are Cheyenne (22.7%, a difference of 0.10%), American (22.6%, a difference of 0.19%), Malaysian (22.6%, a difference of 0.20%), Scottish (22.6%, a difference of 0.21%), and Osage (22.7%, a difference of 0.23%).
| Demographics | Rating | Rank | 3 or more Vehicles in Household |
| Dutch | 100.0 /100 | #38 | Exceptional 22.9% |
| Yaqui | 100.0 /100 | #39 | Exceptional 22.9% |
| Europeans | 100.0 /100 | #40 | Exceptional 22.9% |
| Germans | 100.0 /100 | #41 | Exceptional 22.7% |
| Natives/Alaskans | 100.0 /100 | #42 | Exceptional 22.7% |
| Osage | 100.0 /100 | #43 | Exceptional 22.7% |
| Cheyenne | 100.0 /100 | #44 | Exceptional 22.7% |
| Ute | 100.0 /100 | #45 | Exceptional 22.7% |
| Americans | 100.0 /100 | #46 | Exceptional 22.6% |
| Malaysians | 100.0 /100 | #47 | Exceptional 22.6% |
| Scottish | 100.0 /100 | #48 | Exceptional 22.6% |
| Scotch-Irish | 100.0 /100 | #49 | Exceptional 22.6% |
| Sioux | 100.0 /100 | #50 | Exceptional 22.6% |
| Whites/Caucasians | 100.0 /100 | #51 | Exceptional 22.6% |
| Welsh | 100.0 /100 | #52 | Exceptional 22.6% |
Demographics Similar to Immigrants from England by 3 or more Vehicles in Household
In terms of 3 or more vehicles in household, the demographic groups most similar to Immigrants from England are Nicaraguan (20.7%, a difference of 0.010%), Burmese (20.6%, a difference of 0.18%), Immigrants from Micronesia (20.7%, a difference of 0.30%), Asian (20.8%, a difference of 0.33%), and Filipino (20.8%, a difference of 0.47%).
| Demographics | Rating | Rank | 3 or more Vehicles in Household |
| Bolivians | 97.4 /100 | #106 | Exceptional 20.8% |
| Immigrants | Germany | 97.4 /100 | #107 | Exceptional 20.8% |
| Immigrants | Scotland | 97.1 /100 | #108 | Exceptional 20.8% |
| Filipinos | 97.0 /100 | #109 | Exceptional 20.8% |
| Asians | 96.8 /100 | #110 | Exceptional 20.8% |
| Immigrants | Micronesia | 96.7 /100 | #111 | Exceptional 20.7% |
| Nicaraguans | 96.2 /100 | #112 | Exceptional 20.7% |
| Immigrants | England | 96.2 /100 | #113 | Exceptional 20.7% |
| Burmese | 95.8 /100 | #114 | Exceptional 20.6% |
| French Canadians | 95.0 /100 | #115 | Exceptional 20.6% |
| Italians | 94.9 /100 | #116 | Exceptional 20.6% |
| Croatians | 94.9 /100 | #117 | Exceptional 20.6% |
| Costa Ricans | 94.6 /100 | #118 | Exceptional 20.6% |
| Immigrants | Latin America | 94.5 /100 | #119 | Exceptional 20.5% |
| Maltese | 93.9 /100 | #120 | Exceptional 20.5% |