Ute College, Under 1 year
COMPARE
Ute
Select to Compare
College, Under 1 year
Ute College, Under 1 year
60.2%
COLLEGE, UNDER 1 YEAR
0.1/ 100
METRIC RATING
279th/ 347
METRIC RANK
Ute College, Under 1 year Correlation Chart
The statistical analysis conducted on geographies consisting of 55,668,599 people shows no correlation between the proportion of Ute and percentage of population with at least college, under 1 year education in the United States with a correlation coefficient (R) of 0.046 and weighted average of 60.2%. On average, for every 1% (one percent) increase in Ute within a typical geography, there is an increase of 0.028% in percentage of population with at least college, under 1 year education.
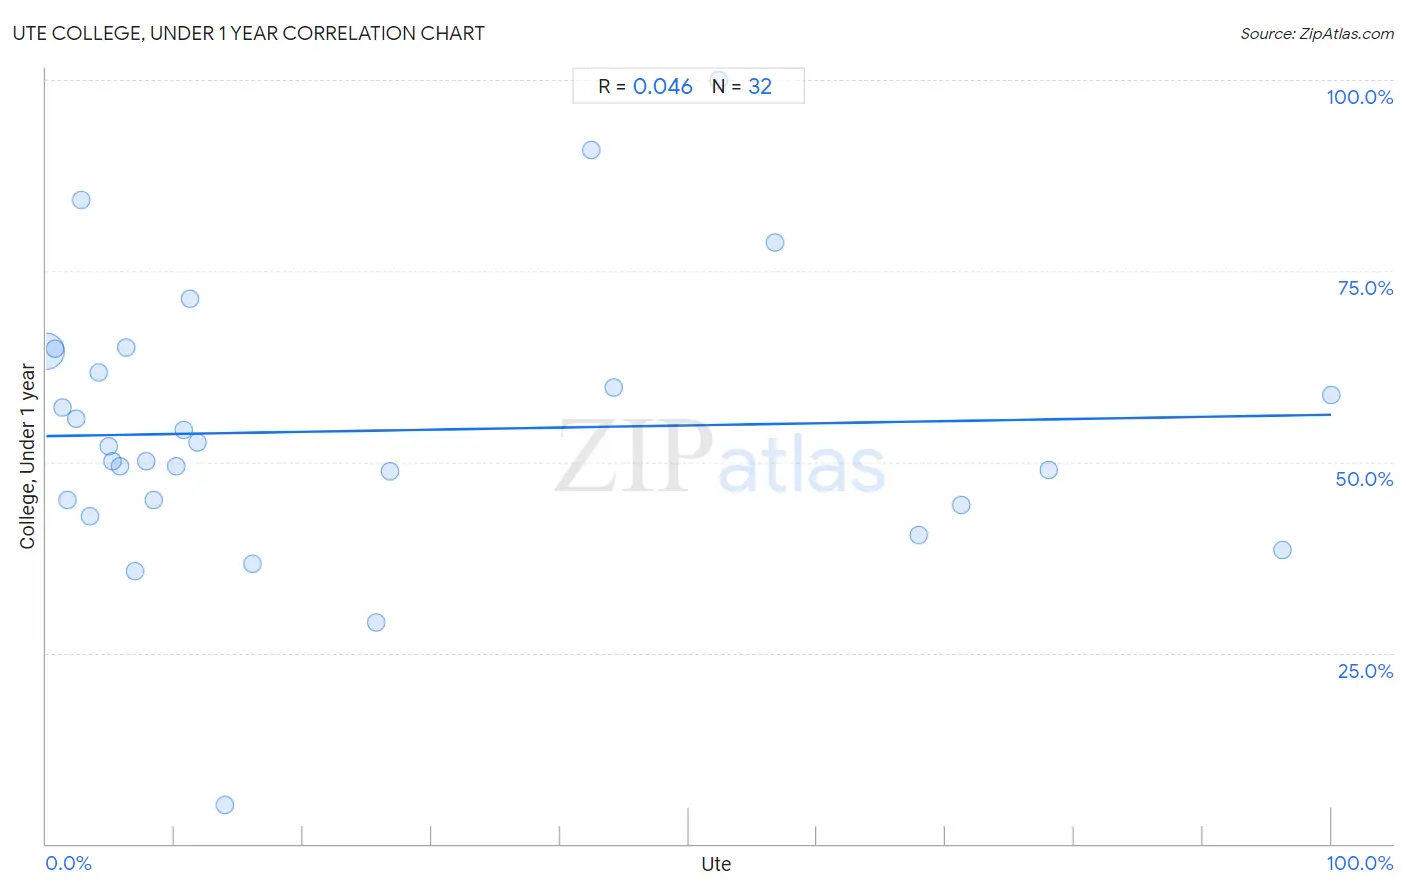
It is essential to understand that the correlation between the percentage of Ute and percentage of population with at least college, under 1 year education does not imply a direct cause-and-effect relationship. It remains uncertain whether the presence of Ute influences an upward or downward trend in the level of percentage of population with at least college, under 1 year education within an area, or if Ute simply ended up residing in those areas with higher or lower levels of percentage of population with at least college, under 1 year education due to other factors.
Demographics Similar to Ute by College, Under 1 year
In terms of college, under 1 year, the demographic groups most similar to Ute are Yaqui (60.2%, a difference of 0.010%), Bahamian (60.3%, a difference of 0.050%), Crow (60.2%, a difference of 0.090%), Arapaho (60.3%, a difference of 0.18%), and Cherokee (60.1%, a difference of 0.20%).
| Demographics | Rating | Rank | College, Under 1 year |
| Jamaicans | 0.1 /100 | #272 | Tragic 60.5% |
| Chickasaw | 0.1 /100 | #273 | Tragic 60.4% |
| Alaska Natives | 0.1 /100 | #274 | Tragic 60.4% |
| Immigrants from Barbados | 0.1 /100 | #275 | Tragic 60.4% |
| Arapaho | 0.1 /100 | #276 | Tragic 60.3% |
| Bahamians | 0.1 /100 | #277 | Tragic 60.3% |
| Yaqui | 0.1 /100 | #278 | Tragic 60.2% |
| Ute | 0.1 /100 | #279 | Tragic 60.2% |
| Crow | 0.1 /100 | #280 | Tragic 60.2% |
| Cherokee | 0.1 /100 | #281 | Tragic 60.1% |
| Belizeans | 0.1 /100 | #282 | Tragic 60.1% |
| Immigrants from Jamaica | 0.0 /100 | #283 | Tragic 59.7% |
| Immigrants from St. Vincent and the Grenadines | 0.0 /100 | #284 | Tragic 59.6% |
| Paiute | 0.0 /100 | #285 | Tragic 59.6% |
| British West Indians | 0.0 /100 | #286 | Tragic 59.5% |
Ute College, Under 1 year Correlation Summary
| Measurement | Ute Data | College, Under 1 year Data |
| Minimum | 0.028% | 5.1% |
| Maximum | 100.0% | 100.0% |
| Range | 100.0% | 94.9% |
| Mean | 24.9% | 54.1% |
| Median | 10.4% | 51.1% |
| Interquartile 25% (IQ1) | 4.5% | 44.6% |
| Interquartile 75% (IQ3) | 43.3% | 63.1% |
| Interquartile Range (IQR) | 38.8% | 18.5% |
| Standard Deviation (Sample) | 29.8% | 18.3% |
| Standard Deviation (Population) | 29.4% | 18.0% |
Correlation Details
| Ute Percentile | Sample Size | College, Under 1 year |
[ 0.0% - 0.5% ] 0.028% | 55,248,495 | 64.5% |
[ 0.5% - 1.0% ] 0.68% | 249,344 | 64.9% |
[ 1.0% - 1.5% ] 1.22% | 56,635 | 57.2% |
[ 1.5% - 2.0% ] 1.67% | 10,159 | 45.0% |
[ 2.0% - 2.5% ] 2.33% | 50,998 | 55.6% |
[ 2.5% - 3.0% ] 2.75% | 8,458 | 84.3% |
[ 3.0% - 3.5% ] 3.36% | 387 | 42.9% |
[ 4.0% - 4.5% ] 4.09% | 2,004 | 61.6% |
[ 4.5% - 5.0% ] 4.86% | 8,830 | 52.1% |
[ 5.0% - 5.5% ] 5.13% | 1,151 | 50.1% |
[ 5.5% - 6.0% ] 5.71% | 14,894 | 49.5% |
[ 6.0% - 6.5% ] 6.22% | 498 | 64.9% |
[ 6.5% - 7.0% ] 6.87% | 771 | 35.6% |
[ 7.5% - 8.0% ] 7.81% | 1,754 | 50.1% |
[ 8.0% - 8.5% ] 8.33% | 1,285 | 45.0% |
[ 10.0% - 10.5% ] 10.13% | 158 | 49.4% |
[ 10.5% - 11.0% ] 10.75% | 577 | 54.2% |
[ 11.0% - 11.5% ] 11.16% | 484 | 71.3% |
[ 11.5% - 12.0% ] 11.76% | 5,495 | 52.6% |
[ 13.5% - 14.0% ] 13.93% | 244 | 5.1% |
[ 16.0% - 16.5% ] 16.07% | 616 | 36.6% |
[ 25.5% - 26.0% ] 25.71% | 140 | 28.9% |
[ 26.5% - 27.0% ] 26.77% | 310 | 48.7% |
[ 42.0% - 42.5% ] 42.40% | 283 | 90.8% |
[ 44.0% - 44.5% ] 44.12% | 136 | 59.8% |
[ 52.0% - 52.5% ] 52.36% | 191 | 100.0% |
[ 56.5% - 57.0% ] 56.67% | 60 | 78.7% |
[ 67.5% - 68.0% ] 67.87% | 831 | 40.5% |
[ 71.0% - 71.5% ] 71.25% | 1,186 | 44.3% |
[ 78.0% - 78.5% ] 78.06% | 1,691 | 48.9% |
[ 96.0% - 96.5% ] 96.19% | 472 | 38.4% |
[ 99.5% - 100.0% ] 100.00% | 62 | 58.7% |