Alsatian 1 or more Vehicles in Household
COMPARE
Alsatian
Select to Compare
1 or more Vehicles in Household
Alsatian 1 or more Vehicles in Household
87.1%
1+ VEHICLES AVAILABLE
0.1/ 100
METRIC RATING
277th/ 347
METRIC RANK
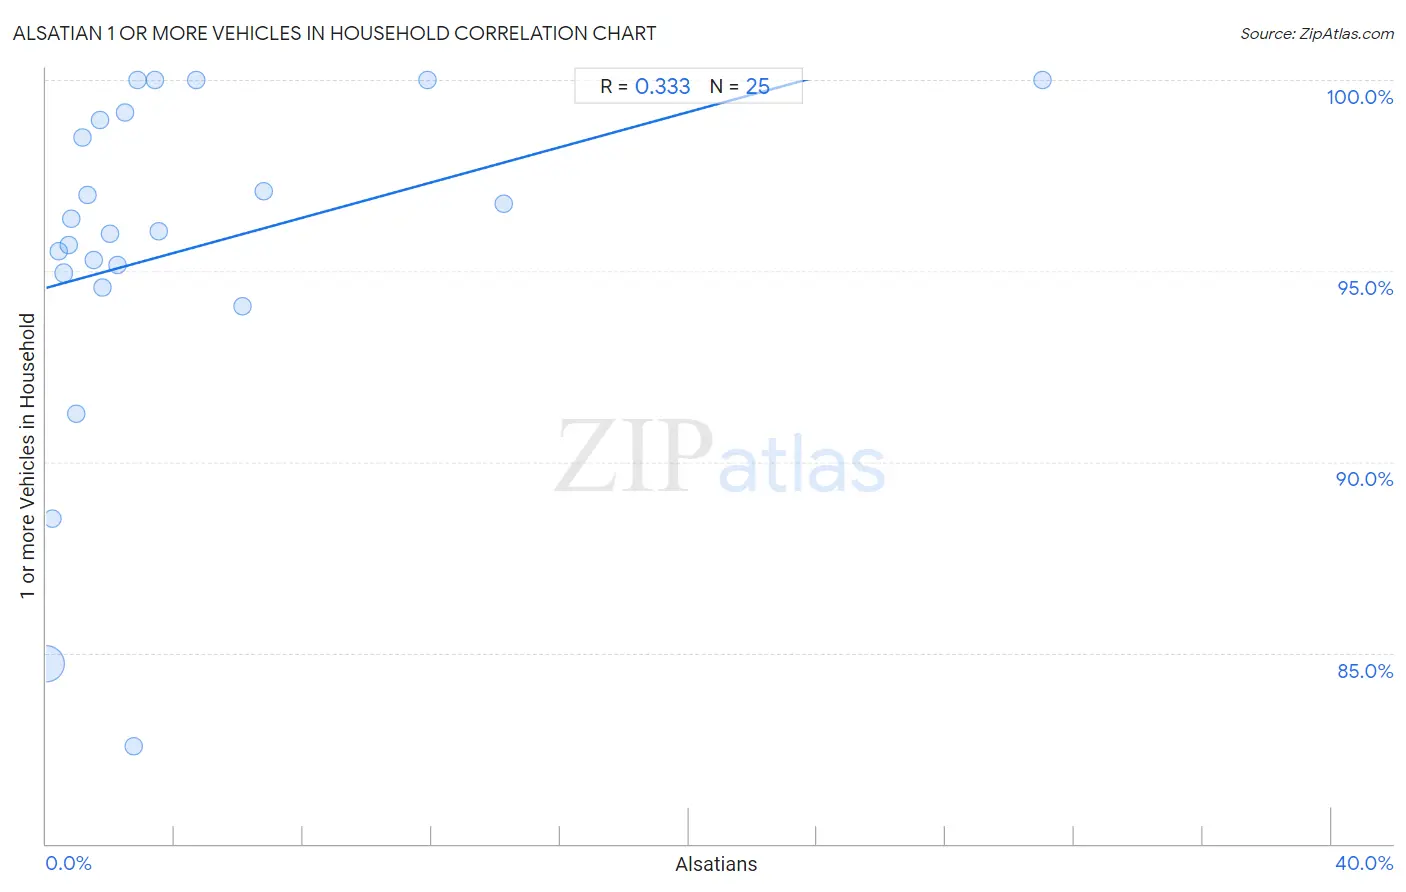
Alsatian 1 or more Vehicles in Household Correlation Chart
The statistical analysis conducted on geographies consisting of 82,680,020 people shows a mild positive correlation between the proportion of Alsatians and percentage of households with 1 or more vehicles available in the United States with a correlation coefficient (R) of 0.333 and weighted average of 87.1%. On average, for every 1% (one percent) increase in Alsatians within a typical geography, there is an increase of 0.23% in percentage of households with 1 or more vehicles available.
It is essential to understand that the correlation between the percentage of Alsatians and percentage of households with 1 or more vehicles available does not imply a direct cause-and-effect relationship. It remains uncertain whether the presence of Alsatians influences an upward or downward trend in the level of percentage of households with 1 or more vehicles available within an area, or if Alsatians simply ended up residing in those areas with higher or lower levels of percentage of households with 1 or more vehicles available due to other factors.
Demographics Similar to Alsatians by 1 or more Vehicles in Household
In terms of 1 or more vehicles in household, the demographic groups most similar to Alsatians are Immigrants from Southern Europe (87.1%, a difference of 0.040%), Immigrants from Albania (87.1%, a difference of 0.040%), Immigrants from France (87.1%, a difference of 0.060%), Immigrants from Croatia (87.0%, a difference of 0.070%), and Immigrants from Singapore (87.2%, a difference of 0.13%).
| Demographics | Rating | Rank | 1 or more Vehicles in Household |
| Panamanians | 0.2 /100 | #270 | Tragic 87.5% |
| Bermudans | 0.2 /100 | #271 | Tragic 87.5% |
| Aleuts | 0.2 /100 | #272 | Tragic 87.5% |
| Immigrants from Northern Africa | 0.2 /100 | #273 | Tragic 87.4% |
| Immigrants from Morocco | 0.1 /100 | #274 | Tragic 87.4% |
| Immigrants from Singapore | 0.1 /100 | #275 | Tragic 87.2% |
| Immigrants from France | 0.1 /100 | #276 | Tragic 87.1% |
| Alsatians | 0.1 /100 | #277 | Tragic 87.1% |
| Immigrants from Southern Europe | 0.1 /100 | #278 | Tragic 87.1% |
| Immigrants from Albania | 0.1 /100 | #279 | Tragic 87.1% |
| Immigrants from Croatia | 0.0 /100 | #280 | Tragic 87.0% |
| Mongolians | 0.0 /100 | #281 | Tragic 87.0% |
| Colville | 0.0 /100 | #282 | Tragic 86.8% |
| Immigrants from Eastern Europe | 0.0 /100 | #283 | Tragic 86.7% |
| Central American Indians | 0.0 /100 | #284 | Tragic 86.7% |
Alsatian 1 or more Vehicles in Household Correlation Summary
| Measurement | Alsatian Data | 1 or more Vehicles in Household Data |
| Minimum | 0.016% | 82.5% |
| Maximum | 31.0% | 100.0% |
| Range | 31.0% | 17.5% |
| Mean | 4.2% | 95.5% |
| Median | 2.0% | 96.0% |
| Interquartile 25% (IQ1) | 0.87% | 94.8% |
| Interquartile 75% (IQ3) | 4.1% | 99.0% |
| Interquartile Range (IQR) | 3.2% | 4.3% |
| Standard Deviation (Sample) | 6.6% | 4.6% |
| Standard Deviation (Population) | 6.5% | 4.5% |
Correlation Details
| Alsatian Percentile | Sample Size | 1 or more Vehicles in Household |
[ 0.0% - 0.5% ] 0.016% | 81,406,856 | 84.7% |
[ 0.0% - 0.5% ] 0.20% | 928,029 | 88.5% |
[ 0.0% - 0.5% ] 0.38% | 110,747 | 95.5% |
[ 0.5% - 1.0% ] 0.56% | 119,006 | 94.9% |
[ 0.5% - 1.0% ] 0.72% | 32,091 | 95.7% |
[ 0.5% - 1.0% ] 0.79% | 42,079 | 96.4% |
[ 0.5% - 1.0% ] 0.95% | 5,784 | 91.3% |
[ 1.0% - 1.5% ] 1.15% | 262 | 98.5% |
[ 1.0% - 1.5% ] 1.29% | 4,355 | 97.0% |
[ 1.0% - 1.5% ] 1.47% | 2,792 | 95.3% |
[ 1.5% - 2.0% ] 1.65% | 5,440 | 98.9% |
[ 1.5% - 2.0% ] 1.75% | 1,604 | 94.6% |
[ 1.5% - 2.0% ] 1.97% | 1,017 | 96.0% |
[ 2.0% - 2.5% ] 2.23% | 1,573 | 95.1% |
[ 2.0% - 2.5% ] 2.47% | 243 | 99.2% |
[ 2.5% - 3.0% ] 2.73% | 1,321 | 82.5% |
[ 2.5% - 3.0% ] 2.86% | 70 | 100.0% |
[ 3.0% - 3.5% ] 3.39% | 827 | 100.0% |
[ 3.5% - 4.0% ] 3.52% | 1,848 | 96.0% |
[ 4.5% - 5.0% ] 4.67% | 707 | 100.0% |
[ 6.0% - 6.5% ] 6.11% | 2,994 | 94.1% |
[ 6.5% - 7.0% ] 6.77% | 9,202 | 97.1% |
[ 11.5% - 12.0% ] 11.86% | 118 | 100.0% |
[ 14.0% - 14.5% ] 14.25% | 723 | 96.8% |
[ 31.0% - 31.5% ] 31.02% | 332 | 100.0% |