Alsatian vs Immigrants from Jordan 3 or more Vehicles in Household
COMPARE
Alsatian
Immigrants from Jordan
3 or more Vehicles in Household
3 or more Vehicles in Household Comparison
Alsatians
Immigrants from Jordan
18.0%
3 OR MORE VEHICLES IN HOUSEHOLD
1.5/ 100
METRIC RATING
251st/ 347
METRIC RANK
19.9%
3 OR MORE VEHICLES IN HOUSEHOLD
75.0/ 100
METRIC RATING
154th/ 347
METRIC RANK
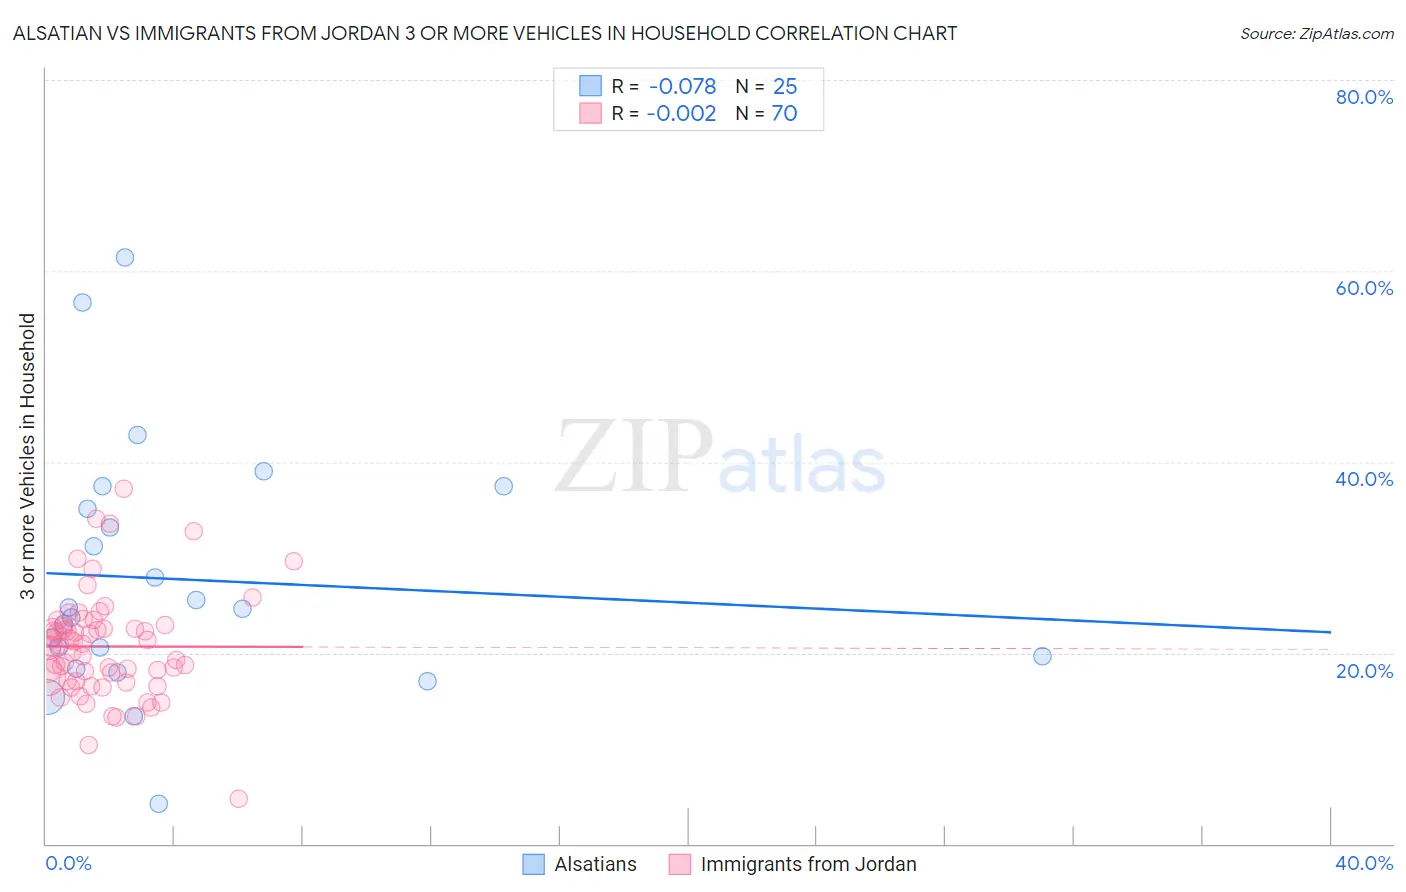
Alsatian vs Immigrants from Jordan 3 or more Vehicles in Household Correlation Chart
The statistical analysis conducted on geographies consisting of 82,678,763 people shows a slight negative correlation between the proportion of Alsatians and percentage of households with 3 or more vehicles available in the United States with a correlation coefficient (R) of -0.078 and weighted average of 18.0%. Similarly, the statistical analysis conducted on geographies consisting of 181,207,315 people shows no correlation between the proportion of Immigrants from Jordan and percentage of households with 3 or more vehicles available in the United States with a correlation coefficient (R) of -0.002 and weighted average of 19.9%, a difference of 10.8%.
3 or more Vehicles in Household Correlation Summary
| Measurement | Alsatian | Immigrants from Jordan |
| Minimum | 4.2% | 4.7% |
| Maximum | 61.3% | 37.1% |
| Range | 57.1% | 32.4% |
| Mean | 27.7% | 20.7% |
| Median | 24.6% | 20.8% |
| Interquartile 25% (IQ1) | 19.0% | 17.0% |
| Interquartile 75% (IQ3) | 36.3% | 22.8% |
| Interquartile Range (IQR) | 17.3% | 5.8% |
| Standard Deviation (Sample) | 13.1% | 5.5% |
| Standard Deviation (Population) | 12.8% | 5.5% |
Similar Demographics by 3 or more Vehicles in Household
Demographics Similar to Alsatians by 3 or more Vehicles in Household
In terms of 3 or more vehicles in household, the demographic groups most similar to Alsatians are Venezuelan (18.0%, a difference of 0.20%), Immigrants from Saudi Arabia (18.0%, a difference of 0.22%), Immigrants from Southern Europe (17.9%, a difference of 0.23%), Immigrants from Eastern Africa (18.0%, a difference of 0.28%), and Carpatho Rusyn (18.0%, a difference of 0.41%).
| Demographics | Rating | Rank | 3 or more Vehicles in Household |
| Mongolians | 2.3 /100 | #244 | Tragic 18.1% |
| Immigrants | Belize | 2.1 /100 | #245 | Tragic 18.1% |
| Immigrants | Australia | 2.0 /100 | #246 | Tragic 18.1% |
| Carpatho Rusyns | 1.9 /100 | #247 | Tragic 18.0% |
| Immigrants | Eastern Africa | 1.8 /100 | #248 | Tragic 18.0% |
| Immigrants | Saudi Arabia | 1.7 /100 | #249 | Tragic 18.0% |
| Venezuelans | 1.7 /100 | #250 | Tragic 18.0% |
| Alsatians | 1.5 /100 | #251 | Tragic 18.0% |
| Immigrants | Southern Europe | 1.4 /100 | #252 | Tragic 17.9% |
| Immigrants | Ethiopia | 1.3 /100 | #253 | Tragic 17.9% |
| Ethiopians | 1.2 /100 | #254 | Tragic 17.9% |
| Immigrants | Turkey | 1.2 /100 | #255 | Tragic 17.9% |
| Sub-Saharan Africans | 1.1 /100 | #256 | Tragic 17.9% |
| Immigrants | Eritrea | 1.1 /100 | #257 | Tragic 17.8% |
| Sudanese | 1.1 /100 | #258 | Tragic 17.8% |
Demographics Similar to Immigrants from Jordan by 3 or more Vehicles in Household
In terms of 3 or more vehicles in household, the demographic groups most similar to Immigrants from Jordan are Yuman (19.9%, a difference of 0.060%), Tlingit-Haida (19.9%, a difference of 0.15%), Thai (19.8%, a difference of 0.37%), Hungarian (19.8%, a difference of 0.42%), and Lebanese (20.0%, a difference of 0.51%).
| Demographics | Rating | Rank | 3 or more Vehicles in Household |
| Slovaks | 83.0 /100 | #147 | Excellent 20.1% |
| Guatemalans | 82.6 /100 | #148 | Excellent 20.1% |
| Immigrants | Iran | 80.9 /100 | #149 | Excellent 20.0% |
| Immigrants | Immigrants | 80.8 /100 | #150 | Excellent 20.0% |
| Taiwanese | 80.6 /100 | #151 | Excellent 20.0% |
| Lebanese | 79.8 /100 | #152 | Good 20.0% |
| Yuman | 75.6 /100 | #153 | Good 19.9% |
| Immigrants | Jordan | 75.0 /100 | #154 | Good 19.9% |
| Tlingit-Haida | 73.4 /100 | #155 | Good 19.9% |
| Thais | 71.1 /100 | #156 | Good 19.8% |
| Hungarians | 70.5 /100 | #157 | Good 19.8% |
| Armenians | 68.8 /100 | #158 | Good 19.8% |
| Immigrants | Pakistan | 68.2 /100 | #159 | Good 19.8% |
| Immigrants | Lebanon | 67.6 /100 | #160 | Good 19.8% |
| Immigrants | Guatemala | 65.6 /100 | #161 | Good 19.7% |