Alsatian vs Kiowa 3 or more Vehicles in Household
COMPARE
Alsatian
Kiowa
3 or more Vehicles in Household
3 or more Vehicles in Household Comparison
Alsatians
Kiowa
18.0%
3 OR MORE VEHICLES IN HOUSEHOLD
1.5/ 100
METRIC RATING
251st/ 347
METRIC RANK
19.5%
3 OR MORE VEHICLES IN HOUSEHOLD
50.9/ 100
METRIC RATING
172nd/ 347
METRIC RANK
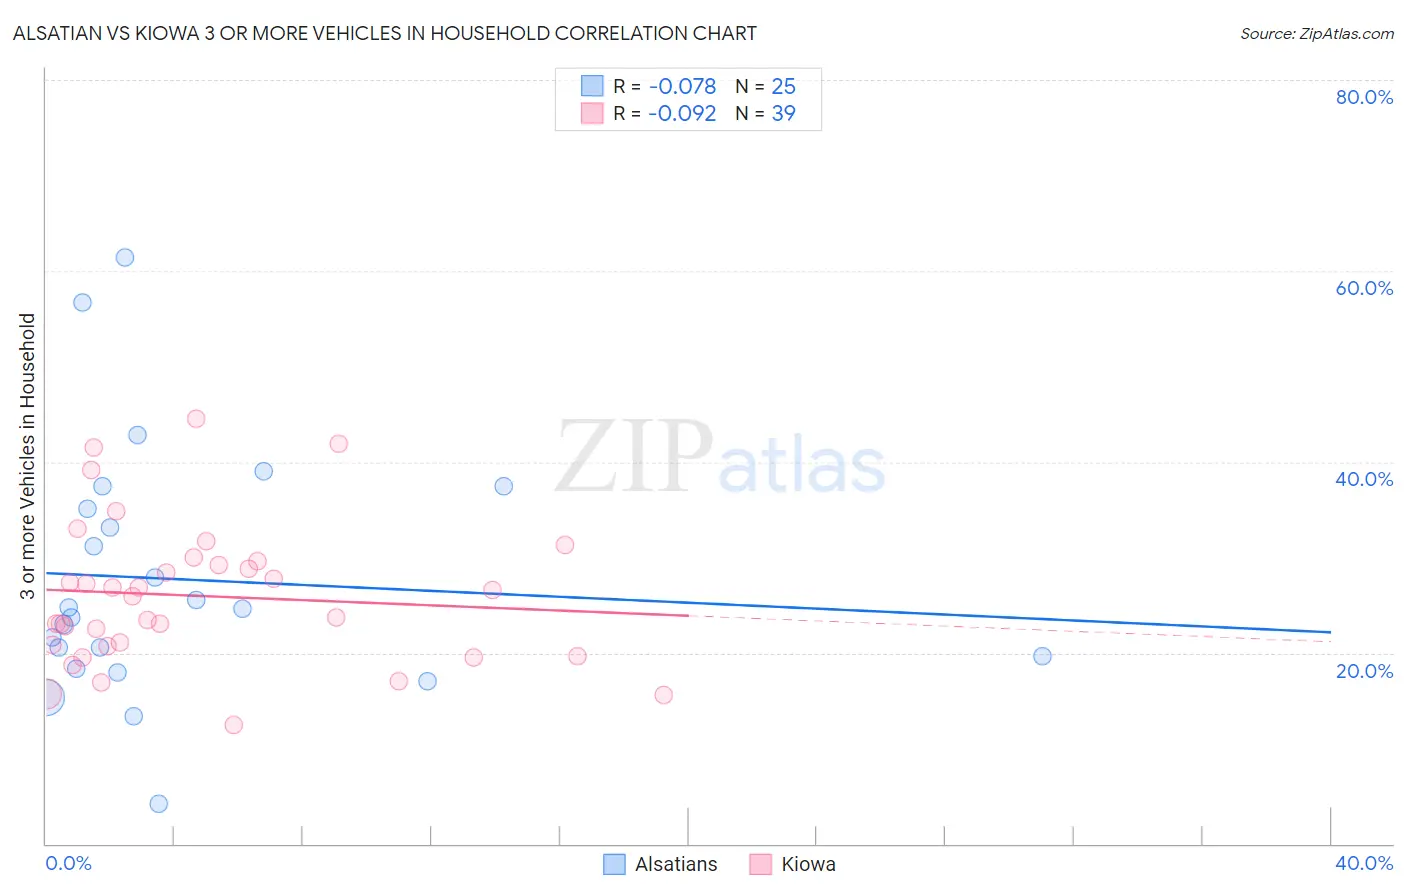
Alsatian vs Kiowa 3 or more Vehicles in Household Correlation Chart
The statistical analysis conducted on geographies consisting of 82,678,763 people shows a slight negative correlation between the proportion of Alsatians and percentage of households with 3 or more vehicles available in the United States with a correlation coefficient (R) of -0.078 and weighted average of 18.0%. Similarly, the statistical analysis conducted on geographies consisting of 56,098,357 people shows a slight negative correlation between the proportion of Kiowa and percentage of households with 3 or more vehicles available in the United States with a correlation coefficient (R) of -0.092 and weighted average of 19.5%, a difference of 8.6%.
3 or more Vehicles in Household Correlation Summary
| Measurement | Alsatian | Kiowa |
| Minimum | 4.2% | 12.5% |
| Maximum | 61.3% | 44.5% |
| Range | 57.1% | 32.0% |
| Mean | 27.7% | 25.9% |
| Median | 24.6% | 26.0% |
| Interquartile 25% (IQ1) | 19.0% | 20.6% |
| Interquartile 75% (IQ3) | 36.3% | 29.5% |
| Interquartile Range (IQR) | 17.3% | 8.9% |
| Standard Deviation (Sample) | 13.1% | 7.5% |
| Standard Deviation (Population) | 12.8% | 7.4% |
Similar Demographics by 3 or more Vehicles in Household
Demographics Similar to Alsatians by 3 or more Vehicles in Household
In terms of 3 or more vehicles in household, the demographic groups most similar to Alsatians are Venezuelan (18.0%, a difference of 0.20%), Immigrants from Saudi Arabia (18.0%, a difference of 0.22%), Immigrants from Southern Europe (17.9%, a difference of 0.23%), Immigrants from Eastern Africa (18.0%, a difference of 0.28%), and Carpatho Rusyn (18.0%, a difference of 0.41%).
| Demographics | Rating | Rank | 3 or more Vehicles in Household |
| Mongolians | 2.3 /100 | #244 | Tragic 18.1% |
| Immigrants | Belize | 2.1 /100 | #245 | Tragic 18.1% |
| Immigrants | Australia | 2.0 /100 | #246 | Tragic 18.1% |
| Carpatho Rusyns | 1.9 /100 | #247 | Tragic 18.0% |
| Immigrants | Eastern Africa | 1.8 /100 | #248 | Tragic 18.0% |
| Immigrants | Saudi Arabia | 1.7 /100 | #249 | Tragic 18.0% |
| Venezuelans | 1.7 /100 | #250 | Tragic 18.0% |
| Alsatians | 1.5 /100 | #251 | Tragic 18.0% |
| Immigrants | Southern Europe | 1.4 /100 | #252 | Tragic 17.9% |
| Immigrants | Ethiopia | 1.3 /100 | #253 | Tragic 17.9% |
| Ethiopians | 1.2 /100 | #254 | Tragic 17.9% |
| Immigrants | Turkey | 1.2 /100 | #255 | Tragic 17.9% |
| Sub-Saharan Africans | 1.1 /100 | #256 | Tragic 17.9% |
| Immigrants | Eritrea | 1.1 /100 | #257 | Tragic 17.8% |
| Sudanese | 1.1 /100 | #258 | Tragic 17.8% |
Demographics Similar to Kiowa by 3 or more Vehicles in Household
In terms of 3 or more vehicles in household, the demographic groups most similar to Kiowa are Immigrants from Northern Europe (19.5%, a difference of 0.050%), Immigrants from South Africa (19.5%, a difference of 0.070%), Immigrants from Western Europe (19.5%, a difference of 0.18%), Syrian (19.5%, a difference of 0.30%), and Iroquois (19.4%, a difference of 0.37%).
| Demographics | Rating | Rank | 3 or more Vehicles in Household |
| Immigrants | Costa Rica | 61.9 /100 | #165 | Good 19.7% |
| Immigrants | Cameroon | 60.9 /100 | #166 | Good 19.7% |
| Ukrainians | 58.9 /100 | #167 | Average 19.6% |
| Peruvians | 58.8 /100 | #168 | Average 19.6% |
| Immigrants | Denmark | 57.6 /100 | #169 | Average 19.6% |
| Iraqis | 56.0 /100 | #170 | Average 19.6% |
| Immigrants | Western Europe | 53.2 /100 | #171 | Average 19.5% |
| Kiowa | 50.9 /100 | #172 | Average 19.5% |
| Immigrants | Northern Europe | 50.2 /100 | #173 | Average 19.5% |
| Immigrants | South Africa | 50.0 /100 | #174 | Average 19.5% |
| Syrians | 47.0 /100 | #175 | Average 19.5% |
| Iroquois | 46.0 /100 | #176 | Average 19.4% |
| Immigrants | Peru | 41.1 /100 | #177 | Average 19.4% |
| Immigrants | Syria | 40.3 /100 | #178 | Average 19.4% |
| Immigrants | South Central Asia | 38.9 /100 | #179 | Fair 19.3% |