Alsatian 2 or more Vehicles in Household
COMPARE
Alsatian
Select to Compare
2 or more Vehicles in Household
Alsatian 2 or more Vehicles in Household
52.5%
2+ VEHICLES AVAILABLE
0.6/ 100
METRIC RATING
259th/ 347
METRIC RANK
Alsatian 2 or more Vehicles in Household Correlation Chart
The statistical analysis conducted on geographies consisting of 82,680,020 people shows a moderate positive correlation between the proportion of Alsatians and percentage of households with 2 or more vehicles available in the United States with a correlation coefficient (R) of 0.401 and weighted average of 52.5%. On average, for every 1% (one percent) increase in Alsatians within a typical geography, there is an increase of 0.92% in percentage of households with 2 or more vehicles available.
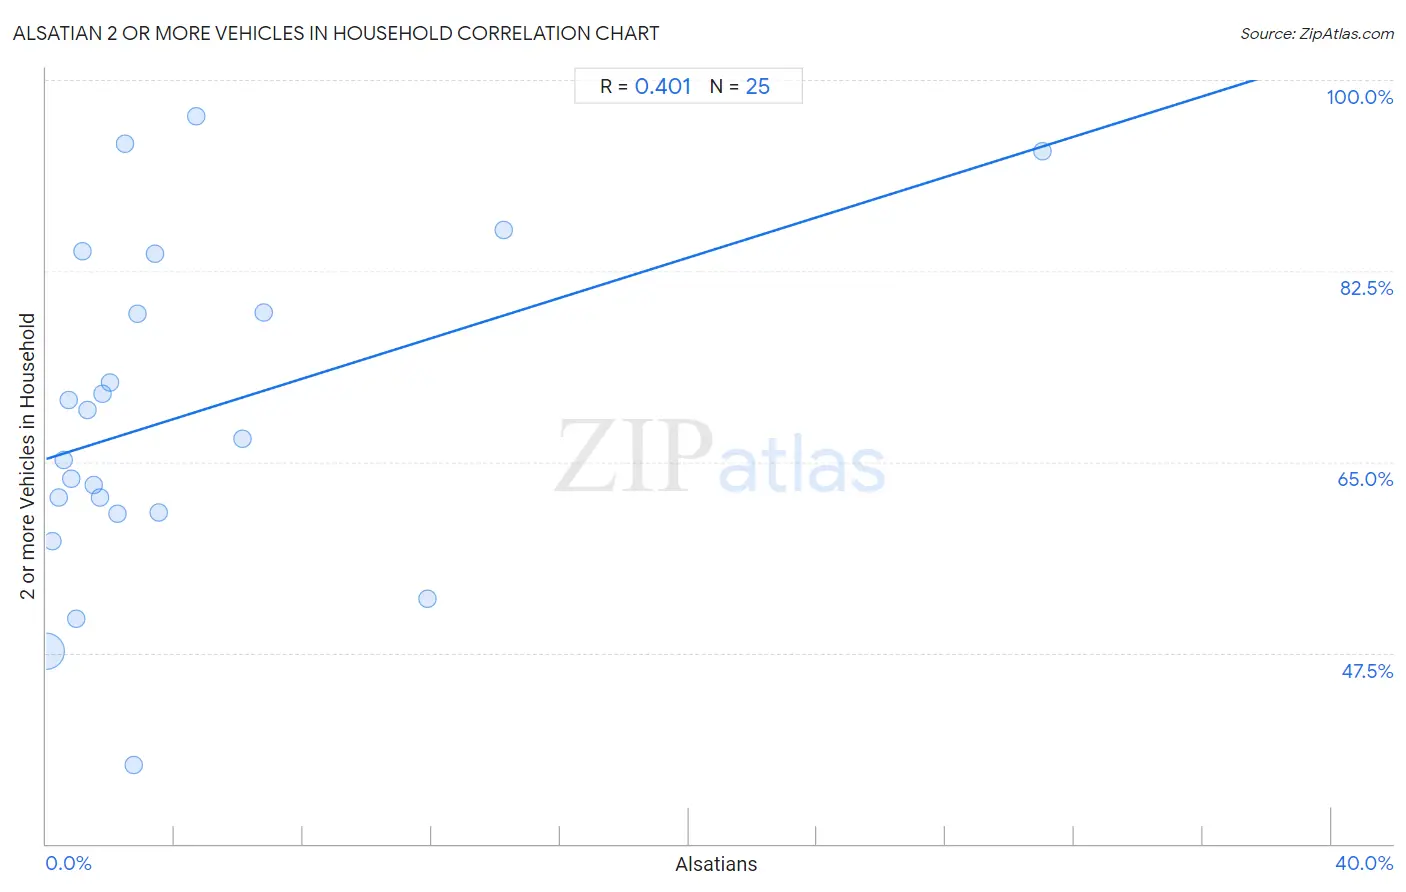
It is essential to understand that the correlation between the percentage of Alsatians and percentage of households with 2 or more vehicles available does not imply a direct cause-and-effect relationship. It remains uncertain whether the presence of Alsatians influences an upward or downward trend in the level of percentage of households with 2 or more vehicles available within an area, or if Alsatians simply ended up residing in those areas with higher or lower levels of percentage of households with 2 or more vehicles available due to other factors.
Demographics Similar to Alsatians by 2 or more Vehicles in Household
In terms of 2 or more vehicles in household, the demographic groups most similar to Alsatians are Central American Indian (52.5%, a difference of 0.040%), Immigrants from Bahamas (52.5%, a difference of 0.070%), Immigrants from Australia (52.4%, a difference of 0.10%), Immigrants from Hong Kong (52.6%, a difference of 0.14%), and Immigrants from Eritrea (52.6%, a difference of 0.28%).
| Demographics | Rating | Rank | 2 or more Vehicles in Household |
| Immigrants from Portugal | 1.0 /100 | #252 | Tragic 52.8% |
| Nigerians | 0.9 /100 | #253 | Tragic 52.8% |
| Immigrants from Malaysia | 0.8 /100 | #254 | Tragic 52.7% |
| Uruguayans | 0.7 /100 | #255 | Tragic 52.7% |
| Immigrants from Eritrea | 0.7 /100 | #256 | Tragic 52.6% |
| Immigrants from Hong Kong | 0.6 /100 | #257 | Tragic 52.6% |
| Central American Indians | 0.6 /100 | #258 | Tragic 52.5% |
| Alsatians | 0.6 /100 | #259 | Tragic 52.5% |
| Immigrants from Bahamas | 0.5 /100 | #260 | Tragic 52.5% |
| Immigrants from Australia | 0.5 /100 | #261 | Tragic 52.4% |
| Immigrants from Northern Africa | 0.4 /100 | #262 | Tragic 52.3% |
| Immigrants from Southern Europe | 0.4 /100 | #263 | Tragic 52.3% |
| Immigrants from Latvia | 0.4 /100 | #264 | Tragic 52.2% |
| Immigrants from Congo | 0.3 /100 | #265 | Tragic 52.1% |
| Immigrants from France | 0.2 /100 | #266 | Tragic 52.0% |
Alsatian 2 or more Vehicles in Household Correlation Summary
| Measurement | Alsatian Data | 2 or more Vehicles in Household Data |
| Minimum | 0.016% | 37.2% |
| Maximum | 31.0% | 96.6% |
| Range | 31.0% | 59.4% |
| Mean | 4.2% | 69.1% |
| Median | 2.0% | 67.1% |
| Interquartile 25% (IQ1) | 0.87% | 60.3% |
| Interquartile 75% (IQ3) | 4.1% | 81.4% |
| Interquartile Range (IQR) | 3.2% | 21.1% |
| Standard Deviation (Sample) | 6.6% | 15.1% |
| Standard Deviation (Population) | 6.5% | 14.8% |
Correlation Details
| Alsatian Percentile | Sample Size | 2 or more Vehicles in Household |
[ 0.0% - 0.5% ] 0.016% | 81,406,856 | 47.6% |
[ 0.0% - 0.5% ] 0.20% | 928,029 | 57.7% |
[ 0.0% - 0.5% ] 0.38% | 110,747 | 61.8% |
[ 0.5% - 1.0% ] 0.56% | 119,006 | 65.2% |
[ 0.5% - 1.0% ] 0.72% | 32,091 | 70.7% |
[ 0.5% - 1.0% ] 0.79% | 42,079 | 63.5% |
[ 0.5% - 1.0% ] 0.95% | 5,784 | 50.6% |
[ 1.0% - 1.5% ] 1.15% | 262 | 84.3% |
[ 1.0% - 1.5% ] 1.29% | 4,355 | 69.7% |
[ 1.0% - 1.5% ] 1.47% | 2,792 | 62.9% |
[ 1.5% - 2.0% ] 1.65% | 5,440 | 61.7% |
[ 1.5% - 2.0% ] 1.75% | 1,604 | 71.3% |
[ 1.5% - 2.0% ] 1.97% | 1,017 | 72.3% |
[ 2.0% - 2.5% ] 2.23% | 1,573 | 60.2% |
[ 2.0% - 2.5% ] 2.47% | 243 | 94.1% |
[ 2.5% - 3.0% ] 2.73% | 1,321 | 37.2% |
[ 2.5% - 3.0% ] 2.86% | 70 | 78.6% |
[ 3.0% - 3.5% ] 3.39% | 827 | 84.1% |
[ 3.5% - 4.0% ] 3.52% | 1,848 | 60.4% |
[ 4.5% - 5.0% ] 4.67% | 707 | 96.6% |
[ 6.0% - 6.5% ] 6.11% | 2,994 | 67.1% |
[ 6.5% - 7.0% ] 6.77% | 9,202 | 78.7% |
[ 11.5% - 12.0% ] 11.86% | 118 | 52.4% |
[ 14.0% - 14.5% ] 14.25% | 723 | 86.3% |
[ 31.0% - 31.5% ] 31.02% | 332 | 93.4% |