Alsatian Married-couple Households
COMPARE
Alsatian
Select to Compare
Married-couple Households
Alsatian Married-couple Households
44.8%
MARRIED-COUPLE HOUSEHOLDS
2.3/ 100
METRIC RATING
226th/ 347
METRIC RANK
Alsatian Married-couple Households Correlation Chart
The statistical analysis conducted on geographies consisting of 82,680,020 people shows a significant positive correlation between the proportion of Alsatians and percentage of married-couple family households in the United States with a correlation coefficient (R) of 0.643 and weighted average of 44.8%. On average, for every 1% (one percent) increase in Alsatians within a typical geography, there is an increase of 1.5% in percentage of married-couple family households.
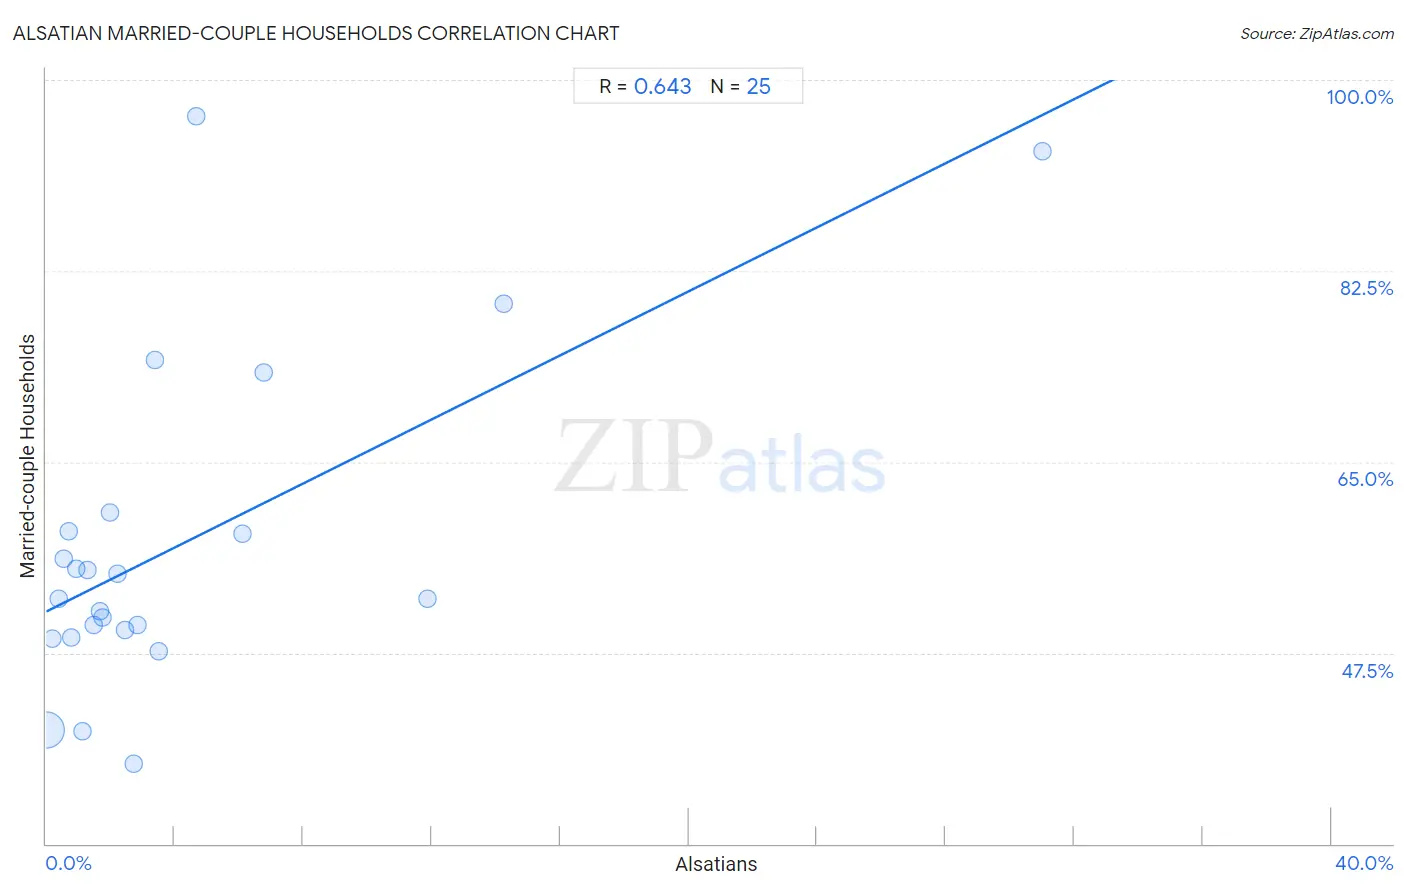
It is essential to understand that the correlation between the percentage of Alsatians and percentage of married-couple family households does not imply a direct cause-and-effect relationship. It remains uncertain whether the presence of Alsatians influences an upward or downward trend in the level of percentage of married-couple family households within an area, or if Alsatians simply ended up residing in those areas with higher or lower levels of percentage of married-couple family households due to other factors.
Demographics Similar to Alsatians by Married-couple Households
In terms of married-couple households, the demographic groups most similar to Alsatians are Dutch West Indian (44.9%, a difference of 0.10%), Immigrants from Micronesia (44.9%, a difference of 0.12%), Immigrants from Cambodia (44.9%, a difference of 0.14%), Salvadoran (44.7%, a difference of 0.19%), and Kenyan (44.7%, a difference of 0.32%).
| Demographics | Rating | Rank | Married-couple Households |
| Nicaraguans | 5.3 /100 | #219 | Tragic 45.2% |
| Immigrants from Thailand | 5.1 /100 | #220 | Tragic 45.2% |
| Tlingit-Haida | 4.9 /100 | #221 | Tragic 45.1% |
| Immigrants from Laos | 4.6 /100 | #222 | Tragic 45.1% |
| Immigrants from Cambodia | 2.7 /100 | #223 | Tragic 44.9% |
| Immigrants from Micronesia | 2.6 /100 | #224 | Tragic 44.9% |
| Dutch West Indians | 2.6 /100 | #225 | Tragic 44.9% |
| Alsatians | 2.3 /100 | #226 | Tragic 44.8% |
| Salvadorans | 1.9 /100 | #227 | Tragic 44.7% |
| Kenyans | 1.7 /100 | #228 | Tragic 44.7% |
| Immigrants from Latin America | 1.6 /100 | #229 | Tragic 44.7% |
| Soviet Union | 1.6 /100 | #230 | Tragic 44.6% |
| Houma | 1.5 /100 | #231 | Tragic 44.6% |
| Marshallese | 1.5 /100 | #232 | Tragic 44.6% |
| Immigrants from Uganda | 1.5 /100 | #233 | Tragic 44.6% |
Alsatian Married-couple Households Correlation Summary
| Measurement | Alsatian Data | Married-couple Households Data |
| Minimum | 0.016% | 37.3% |
| Maximum | 31.0% | 96.6% |
| Range | 31.0% | 59.3% |
| Mean | 4.2% | 57.4% |
| Median | 2.0% | 52.4% |
| Interquartile 25% (IQ1) | 0.87% | 49.3% |
| Interquartile 75% (IQ3) | 4.1% | 59.5% |
| Interquartile Range (IQR) | 3.2% | 10.2% |
| Standard Deviation (Sample) | 6.6% | 15.0% |
| Standard Deviation (Population) | 6.5% | 14.7% |
Correlation Details
| Alsatian Percentile | Sample Size | Married-couple Households |
[ 0.0% - 0.5% ] 0.016% | 81,406,856 | 40.4% |
[ 0.0% - 0.5% ] 0.20% | 928,029 | 48.8% |
[ 0.0% - 0.5% ] 0.38% | 110,747 | 52.4% |
[ 0.5% - 1.0% ] 0.56% | 119,006 | 56.2% |
[ 0.5% - 1.0% ] 0.72% | 32,091 | 58.6% |
[ 0.5% - 1.0% ] 0.79% | 42,079 | 49.0% |
[ 0.5% - 1.0% ] 0.95% | 5,784 | 55.2% |
[ 1.0% - 1.5% ] 1.15% | 262 | 40.3% |
[ 1.0% - 1.5% ] 1.29% | 4,355 | 55.1% |
[ 1.0% - 1.5% ] 1.47% | 2,792 | 50.1% |
[ 1.5% - 2.0% ] 1.65% | 5,440 | 51.4% |
[ 1.5% - 2.0% ] 1.75% | 1,604 | 50.7% |
[ 1.5% - 2.0% ] 1.97% | 1,017 | 60.4% |
[ 2.0% - 2.5% ] 2.23% | 1,573 | 54.8% |
[ 2.0% - 2.5% ] 2.47% | 243 | 49.6% |
[ 2.5% - 3.0% ] 2.73% | 1,321 | 37.3% |
[ 2.5% - 3.0% ] 2.86% | 70 | 50.0% |
[ 3.0% - 3.5% ] 3.39% | 827 | 74.3% |
[ 3.5% - 4.0% ] 3.52% | 1,848 | 47.7% |
[ 4.5% - 5.0% ] 4.67% | 707 | 96.6% |
[ 6.0% - 6.5% ] 6.11% | 2,994 | 58.4% |
[ 6.5% - 7.0% ] 6.77% | 9,202 | 73.1% |
[ 11.5% - 12.0% ] 11.86% | 118 | 52.4% |
[ 14.0% - 14.5% ] 14.25% | 723 | 79.4% |
[ 31.0% - 31.5% ] 31.02% | 332 | 93.4% |