Alsatian GED/Equivalency
COMPARE
Alsatian
Select to Compare
GED/Equivalency
Alsatian GED/Equivalency
86.0%
GED/EQUIVALENCY
64.3/ 100
METRIC RATING
165th/ 347
METRIC RANK
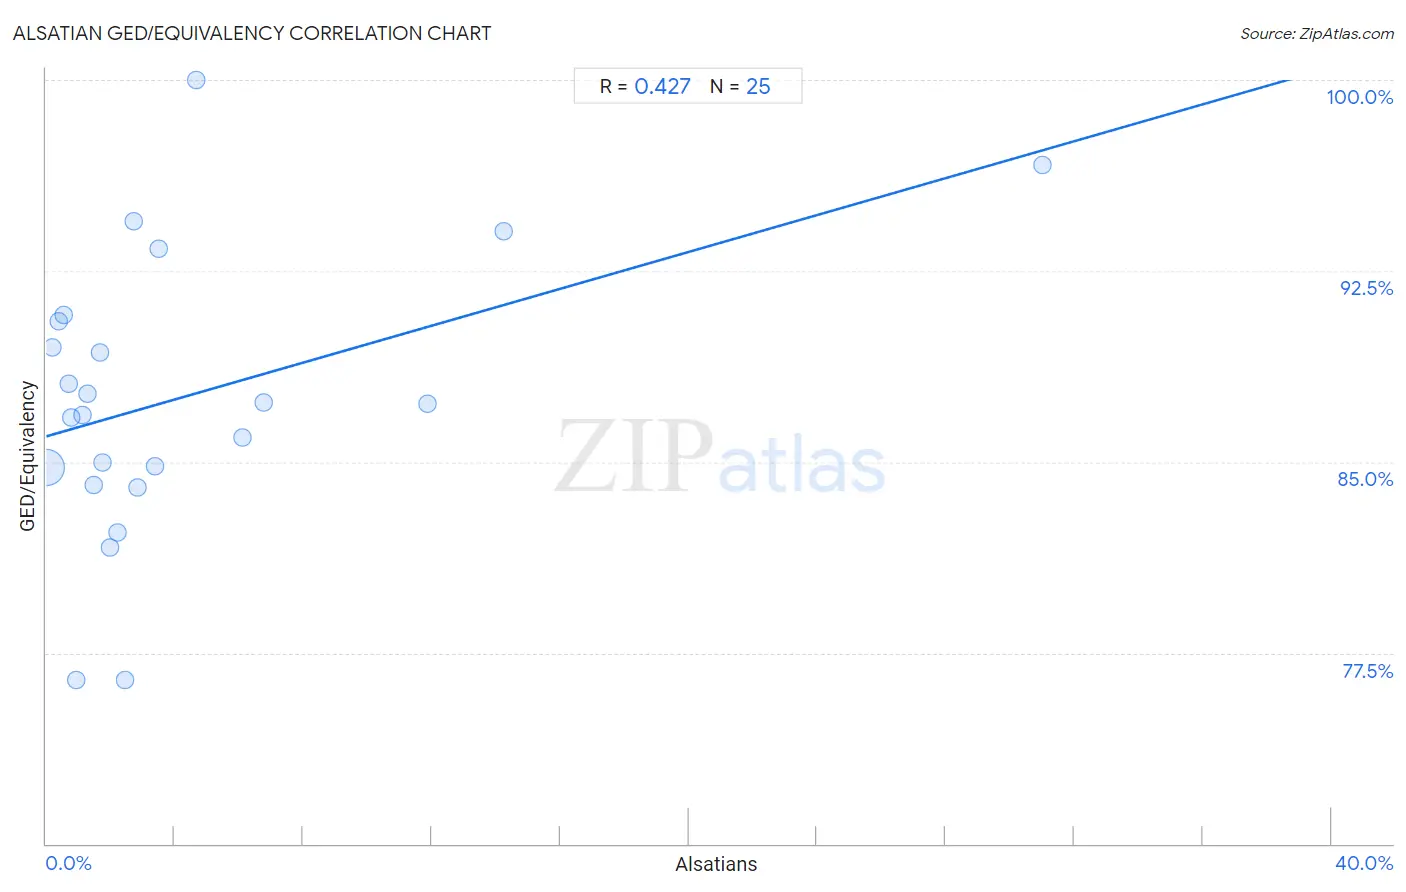
Alsatian GED/Equivalency Correlation Chart
The statistical analysis conducted on geographies consisting of 82,682,365 people shows a moderate positive correlation between the proportion of Alsatians and percentage of population with at least ged/equivalency education in the United States with a correlation coefficient (R) of 0.427 and weighted average of 86.0%. On average, for every 1% (one percent) increase in Alsatians within a typical geography, there is an increase of 0.36% in percentage of population with at least ged/equivalency education.
It is essential to understand that the correlation between the percentage of Alsatians and percentage of population with at least ged/equivalency education does not imply a direct cause-and-effect relationship. It remains uncertain whether the presence of Alsatians influences an upward or downward trend in the level of percentage of population with at least ged/equivalency education within an area, or if Alsatians simply ended up residing in those areas with higher or lower levels of percentage of population with at least ged/equivalency education due to other factors.
Demographics Similar to Alsatians by GED/Equivalency
In terms of ged/equivalency, the demographic groups most similar to Alsatians are Immigrants from Albania (86.0%, a difference of 0.0%), Ethiopian (86.0%, a difference of 0.010%), Venezuelan (86.0%, a difference of 0.030%), Ugandan (86.1%, a difference of 0.040%), and Sierra Leonean (86.0%, a difference of 0.050%).
| Demographics | Rating | Rank | GED/Equivalency |
| German Russians | 72.1 /100 | #158 | Good 86.2% |
| Immigrants from Kenya | 71.8 /100 | #159 | Good 86.2% |
| Immigrants from Morocco | 69.5 /100 | #160 | Good 86.1% |
| Immigrants from Syria | 69.3 /100 | #161 | Good 86.1% |
| Immigrants from Iraq | 68.1 /100 | #162 | Good 86.1% |
| Ugandans | 66.3 /100 | #163 | Good 86.1% |
| Venezuelans | 65.5 /100 | #164 | Good 86.0% |
| Alsatians | 64.3 /100 | #165 | Good 86.0% |
| Immigrants from Albania | 64.2 /100 | #166 | Good 86.0% |
| Ethiopians | 63.7 /100 | #167 | Good 86.0% |
| Sierra Leoneans | 61.8 /100 | #168 | Good 86.0% |
| Immigrants from Ethiopia | 61.2 /100 | #169 | Good 86.0% |
| Afghans | 59.7 /100 | #170 | Average 85.9% |
| Immigrants from Chile | 57.3 /100 | #171 | Average 85.9% |
| Bermudans | 55.1 /100 | #172 | Average 85.8% |
Alsatian GED/Equivalency Correlation Summary
| Measurement | Alsatian Data | GED/Equivalency Data |
| Minimum | 0.016% | 76.4% |
| Maximum | 31.0% | 100.0% |
| Range | 31.0% | 23.6% |
| Mean | 4.2% | 87.5% |
| Median | 2.0% | 87.3% |
| Interquartile 25% (IQ1) | 0.87% | 84.5% |
| Interquartile 75% (IQ3) | 4.1% | 90.6% |
| Interquartile Range (IQR) | 3.2% | 6.2% |
| Standard Deviation (Sample) | 6.6% | 5.6% |
| Standard Deviation (Population) | 6.5% | 5.5% |
Correlation Details
| Alsatian Percentile | Sample Size | GED/Equivalency |
[ 0.0% - 0.5% ] 0.016% | 81,406,856 | 84.8% |
[ 0.0% - 0.5% ] 0.20% | 928,029 | 89.5% |
[ 0.0% - 0.5% ] 0.38% | 113,092 | 90.5% |
[ 0.5% - 1.0% ] 0.56% | 119,006 | 90.7% |
[ 0.5% - 1.0% ] 0.72% | 32,091 | 88.1% |
[ 0.5% - 1.0% ] 0.79% | 42,079 | 86.7% |
[ 0.5% - 1.0% ] 0.95% | 5,784 | 76.4% |
[ 1.0% - 1.5% ] 1.15% | 262 | 86.9% |
[ 1.0% - 1.5% ] 1.29% | 4,355 | 87.7% |
[ 1.0% - 1.5% ] 1.47% | 2,792 | 84.1% |
[ 1.5% - 2.0% ] 1.65% | 5,440 | 89.3% |
[ 1.5% - 2.0% ] 1.75% | 1,604 | 85.0% |
[ 1.5% - 2.0% ] 1.97% | 1,017 | 81.6% |
[ 2.0% - 2.5% ] 2.23% | 1,573 | 82.2% |
[ 2.0% - 2.5% ] 2.47% | 243 | 76.4% |
[ 2.5% - 3.0% ] 2.73% | 1,321 | 94.5% |
[ 2.5% - 3.0% ] 2.86% | 70 | 84.0% |
[ 3.0% - 3.5% ] 3.39% | 827 | 84.8% |
[ 3.5% - 4.0% ] 3.52% | 1,848 | 93.4% |
[ 4.5% - 5.0% ] 4.67% | 707 | 100.0% |
[ 6.0% - 6.5% ] 6.11% | 2,994 | 86.0% |
[ 6.5% - 7.0% ] 6.77% | 9,202 | 87.3% |
[ 11.5% - 12.0% ] 11.86% | 118 | 87.3% |
[ 14.0% - 14.5% ] 14.25% | 723 | 94.1% |
[ 31.0% - 31.5% ] 31.02% | 332 | 96.7% |