Alsatian 4 or more Vehicles in Household

COMPARE

Alsatian
Race
Ancestry
AfghanAfricanAlaska NativeAlaskan AthabascanAlbanianAleutAlsatianAmericanApacheArabArapahoArgentineanArmenianAssyrian/Chaldean/SyriacAustralianAustrianBahamianBangladeshiBarbadianBasqueBelgianBelizeanBermudanBhutaneseBlackfeetBolivianBrazilianBritishBritish West IndianBulgarianBurmeseCajunCambodianCanadianCape VerdeanCarpatho RusynCelticCentral AmericanCentral American IndianCherokeeCheyenneChickasawChileanChineseChippewaChoctawColombianColvilleComancheCosta RicanCreeCreekCroatianCrowCubanCypriotCzechCzechoslovakianDanishDelawareDominicanDutchDutch West IndianEastern EuropeanEcuadorianEgyptianEnglishEstonianEthiopianEuropeanFijianFilipinoFinnishFrenchFrench American IndianFrench CanadianGermanGerman RussianGhanaianGreekGuamanian/ChamorroGuatemalanGuyaneseHaitianHmongHonduranHopiHoumaHungarianIcelanderIndian (Asian)IndonesianInupiatIranianIraqiIrishIroquoisIsraeliItalianJamaicanJapaneseJordanianKenyanKiowaKoreanLaotianLatvianLebaneseLiberianLithuanianLumbeeLuxembourgerMacedonianMalaysianMalteseMarshalleseMenomineeMexicanMexican American IndianMongolianMoroccanNative HawaiianNavajoNepaleseNew ZealanderNicaraguanNigerianNorthern EuropeanNorwegianOkinawanOsageOttawaPaiutePakistaniPalestinianPanamanianParaguayanPennsylvania GermanPeruvianPimaPolishPortuguesePotawatomiPuebloPuerto RicanPuget Sound SalishRomanianRussianSalvadoranSamoanScandinavianScotch-IrishScottishSeminoleSenegaleseSerbianShoshoneSierra LeoneanSiouxSlavicSlovakSloveneSomaliSouth AfricanSouth AmericanSouth American IndianSoviet UnionSpaniardSpanishSpanish AmericanSpanish American IndianSri LankanSubsaharan AfricanSudaneseSwedishSwissSyrianTaiwaneseThaiTlingit-HaidaTohono O'OdhamTonganTrinidadian and TobagonianTsimshianTurkishU.S. Virgin IslanderUgandanUkrainianUruguayanUteVenezuelanVietnameseWelshWest IndianYakamaYaquiYugoslavianYumanYup'ikZimbabwean
Immigration
NonimmigrantsImmigrantsAfghanistanAfricaAlbaniaArgentinaArmeniaAsiaAustraliaAustriaBahamasBangladeshBarbadosBelarusBelgiumBelizeBoliviaBosnia and HerzegovinaBrazilBulgariaBurma/MyanmarCabo VerdeCambodiaCameroonCanadaCaribbeanCentral AmericaChileChinaColombiaCongoCosta RicaCroatiaCubaCzechoslovakiaDenmarkDominicaDominican RepublicEastern AfricaEastern AsiaEastern EuropeEcuadorEgyptEl SalvadorEnglandEritreaEthiopiaEuropeFijiFranceGermanyGhanaGreeceGrenadaGuatemalaGuyanaHaitiHondurasHong KongHungaryIndiaIndonesiaIranIraqIrelandIsraelItalyJamaicaJapanJordanKazakhstanKenyaKoreaKuwaitLaosLatin AmericaLatviaLebanonLiberiaLithuaniaMalaysiaMexicoMicronesiaMiddle AfricaMoldovaMoroccoNepalNetherlandsNicaraguaNigeriaNorth AmericaNorth MacedoniaNorthern AfricaNorthern EuropeNorwayOceaniaPakistanPanamaPeruPhilippinesPolandPortugalRomaniaRussiaSaudi ArabiaScotlandSenegalSerbiaSierra LeoneSingaporeSomaliaSouth AfricaSouth AmericaSouth Central AsiaSouth Eastern AsiaSouthern EuropeSpainSri LankaSt. Vincent and the GrenadinesSudanSwedenSwitzerlandSyriaTaiwanThailandTrinidad and TobagoTurkeyUgandaUkraineUruguayUzbekistanVenezuelaVietnamWest IndiesWestern AfricaWestern AsiaWestern EuropeYemenZaireZimbabweAzores
Select to Compare
Race
Ancestry
AfghanAfricanAlaska NativeAlaskan AthabascanAlbanianAleutAmericanApacheArabArapahoArgentineanArmenianAssyrian/Chaldean/SyriacAustralianAustrianBahamianBangladeshiBarbadianBasqueBelgianBelizeanBermudanBhutaneseBlackfeetBolivianBrazilianBritishBritish West IndianBulgarianBurmeseCajunCambodianCanadianCape VerdeanCarpatho RusynCelticCentral AmericanCentral American IndianCherokeeCheyenneChickasawChileanChineseChippewaChoctawColombianColvilleComancheCosta RicanCreeCreekCroatianCrowCubanCypriotCzechCzechoslovakianDanishDelawareDominicanDutchDutch West IndianEastern EuropeanEcuadorianEgyptianEnglishEstonianEthiopianEuropeanFijianFilipinoFinnishFrenchFrench American IndianFrench CanadianGermanGerman RussianGhanaianGreekGuamanian/ChamorroGuatemalanGuyaneseHaitianHmongHonduranHopiHoumaHungarianIcelanderIndian (Asian)IndonesianInupiatIranianIraqiIrishIroquoisIsraeliItalianJamaicanJapaneseJordanianKenyanKiowaKoreanLaotianLatvianLebaneseLiberianLithuanianLumbeeLuxembourgerMacedonianMalaysianMalteseMarshalleseMenomineeMexicanMexican American IndianMongolianMoroccanNative HawaiianNavajoNepaleseNew ZealanderNicaraguanNigerianNorthern EuropeanNorwegianOkinawanOsageOttawaPaiutePakistaniPalestinianPanamanianParaguayanPennsylvania GermanPeruvianPimaPolishPortuguesePotawatomiPuebloPuerto RicanPuget Sound SalishRomanianRussianSalvadoranSamoanScandinavianScotch-IrishScottishSeminoleSenegaleseSerbianShoshoneSierra LeoneanSiouxSlavicSlovakSloveneSomaliSouth AfricanSouth AmericanSouth American IndianSoviet UnionSpaniardSpanishSpanish AmericanSpanish American IndianSri LankanSubsaharan AfricanSudaneseSwedishSwissSyrianTaiwaneseThaiTlingit-HaidaTohono O'OdhamTonganTrinidadian and TobagonianTsimshianTurkishU.S. Virgin IslanderUgandanUkrainianUruguayanUteVenezuelanVietnameseWelshWest IndianYakamaYaquiYugoslavianYumanYup'ikZimbabwean
Immigration
NonimmigrantsImmigrantsAfghanistanAfricaAlbaniaArgentinaArmeniaAsiaAustraliaAustriaBahamasBangladeshBarbadosBelarusBelgiumBelizeBoliviaBosnia and HerzegovinaBrazilBulgariaBurma/MyanmarCabo VerdeCambodiaCameroonCanadaCaribbeanCentral AmericaChileChinaColombiaCongoCosta RicaCroatiaCubaCzechoslovakiaDenmarkDominicaDominican RepublicEastern AfricaEastern AsiaEastern EuropeEcuadorEgyptEl SalvadorEnglandEritreaEthiopiaEuropeFijiFranceGermanyGhanaGreeceGrenadaGuatemalaGuyanaHaitiHondurasHong KongHungaryIndiaIndonesiaIranIraqIrelandIsraelItalyJamaicaJapanJordanKazakhstanKenyaKoreaKuwaitLaosLatin AmericaLatviaLebanonLiberiaLithuaniaMalaysiaMexicoMicronesiaMiddle AfricaMoldovaMoroccoNepalNetherlandsNicaraguaNigeriaNorth AmericaNorth MacedoniaNorthern AfricaNorthern EuropeNorwayOceaniaPakistanPanamaPeruPhilippinesPolandPortugalRomaniaRussiaSaudi ArabiaScotlandSenegalSerbiaSierra LeoneSingaporeSomaliaSouth AfricaSouth AmericaSouth Central AsiaSouth Eastern AsiaSouthern EuropeSpainSri LankaSt. Vincent and the GrenadinesSudanSwedenSwitzerlandSyriaTaiwanThailandTrinidad and TobagoTurkeyUgandaUkraineUruguayUzbekistanVenezuelaVietnamWest IndiesWestern AfricaWestern AsiaWestern EuropeYemenZaireZimbabweAzores
4 or more Vehicles in Household
Income
Poverty
Unemployment
Labor Participation
Family Structure
Vehicle Availability
Education Level
Disability

Alsatian 4 or more Vehicles in Household
Tragic

5.4%
4+ VEHICLES AVAILABLE
0.3/ 100
METRIC RATING
280th/ 347
METRIC RANK

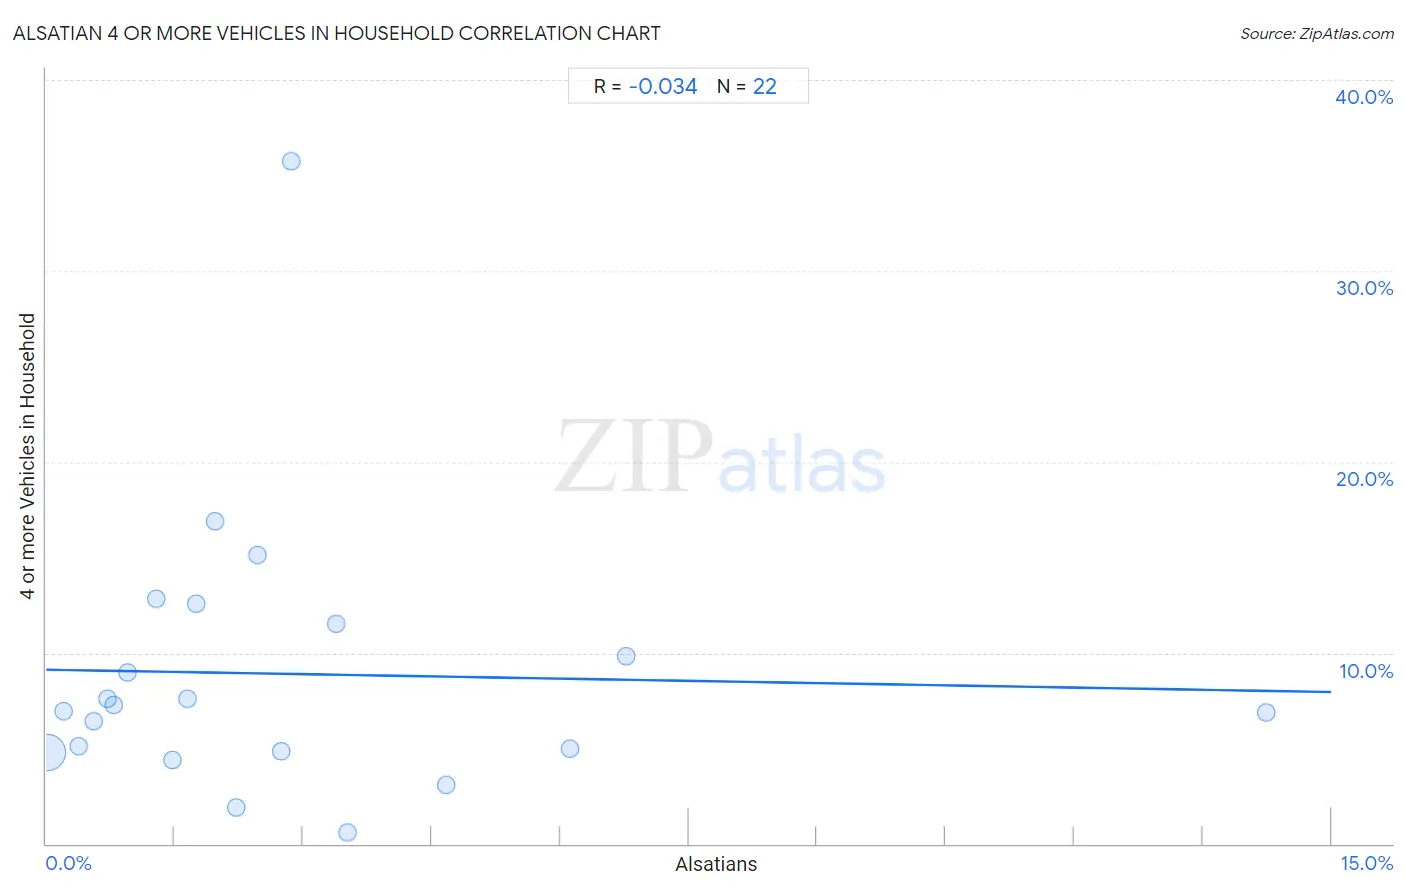
Alsatian 4 or more Vehicles in Household Correlation Chart

The statistical analysis conducted on geographies consisting of 82,502,049 people shows no correlation between the proportion of Alsatians and percentage of households with 4 or more vehicles available in the United States with a correlation coefficient (R) of -0.034 and weighted average of 5.4%. On average, for every 1% (one percent) increase in Alsatians within a typical geography, there is a decrease of 0.078% in percentage of households with 4 or more vehicles available.
Alsatian 4 or more Vehicles in Household
It is essential to understand that the correlation between the percentage of Alsatians and percentage of households with 4 or more vehicles available does not imply a direct cause-and-effect relationship. It remains uncertain whether the presence of Alsatians influences an upward or downward trend in the level of percentage of households with 4 or more vehicles available within an area, or if Alsatians simply ended up residing in those areas with higher or lower levels of percentage of households with 4 or more vehicles available due to other factors.

Demographics Similar to Alsatians by 4 or more Vehicles in Household

In terms of 4 or more vehicles in household, the demographic groups most similar to Alsatians are Immigrants from Uruguay (5.4%, a difference of 0.010%), Immigrants from Western Africa (5.4%, a difference of 0.070%), Immigrants from Spain (5.4%, a difference of 0.24%), Immigrants from Ireland (5.4%, a difference of 0.32%), and Immigrants from Eastern Europe (5.4%, a difference of 0.47%).
DemographicsRating | Rank4 or more Vehicles in Household
Macedonians
0.6
/100
|
#273
Tragic
5.5%
Blacks/African Americans
0.6
/100
|
#274
Tragic
5.5%
Cambodians
0.5
/100
|
#275
Tragic
5.5%
Immigrants from Latvia
0.5
/100
|
#276
Tragic
5.5%
Immigrants from Bulgaria
0.5
/100
|
#277
Tragic
5.5%
Immigrants from Eastern Europe
0.4
/100
|
#278
Tragic
5.4%
Immigrants from Uruguay
0.3
/100
|
#279
Tragic
5.4%
Alsatians
0.3
/100
|
#280
Tragic
5.4%
Immigrants from Western Africa
0.3
/100
|
#281
Tragic
5.4%
Immigrants from Spain
0.3
/100
|
#282
Tragic
5.4%
Immigrants from Ireland
0.3
/100
|
#283
Tragic
5.4%
Brazilians
0.3
/100
|
#284
Tragic
5.4%
Immigrants from Liberia
0.2
/100
|
#285
Tragic
5.4%
Immigrants from Colombia
0.2
/100
|
#286
Tragic
5.4%
Immigrants from Croatia
0.2
/100
|
#287
Tragic
5.4%

Alsatian 4 or more Vehicles in Household Correlation Summary

MeasurementAlsatian Data4 or more Vehicles in Household Data
Minimum0.016%0.60%
Maximum14.2%35.7%
Range14.2%35.1%
Mean2.8%8.9%
Median1.9%7.1%
Interquartile 25% (IQ1)0.79%4.8%
Interquartile 75% (IQ3)3.4%11.5%
Interquartile Range (IQR)2.6%6.7%
Standard Deviation (Sample)3.1%7.3%
Standard Deviation (Population)3.1%7.1%

Correlation Details

Alsatian PercentileSample Size4 or more Vehicles in Household
[
0.0%
-
0.5%
]
0.016%
81,246,7604.8%
[
0.0%
-
0.5%
]
0.20%
918,0017.0%
[
0.0%
-
0.5%
]
0.38%
109,4765.1%
[
0.5%
-
1.0%
]
0.56%
113,9166.4%
[
0.5%
-
1.0%
]
0.72%
32,0917.6%
[
0.5%
-
1.0%
]
0.79%
42,0797.3%
[
0.5%
-
1.0%
]
0.95%
5,7848.9%
[
1.0%
-
1.5%
]
1.29%
4,35512.9%
[
1.0%
-
1.5%
]
1.47%
2,7924.4%
[
1.5%
-
2.0%
]
1.65%
5,4407.6%
[
1.5%
-
2.0%
]
1.75%
1,60412.6%
[
1.5%
-
2.0%
]
1.97%
1,01716.9%
[
2.0%
-
2.5%
]
2.23%
1,5731.9%
[
2.0%
-
2.5%
]
2.47%
24315.1%
[
2.5%
-
3.0%
]
2.74%
5474.8%
[
2.5%
-
3.0%
]
2.86%
7035.7%
[
3.0%
-
3.5%
]
3.39%
82711.5%
[
3.5%
-
4.0%
]
3.52%
1,8480.60%
[
4.5%
-
5.0%
]
4.67%
7073.1%
[
6.0%
-
6.5%
]
6.11%
2,9945.0%
[
6.5%
-
7.0%
]
6.77%
9,2029.8%
[
14.0%
-
14.5%
]
14.25%
7236.9%