Alsatian vs Dominican 3 or more Vehicles in Household
COMPARE
Alsatian
Dominican
3 or more Vehicles in Household
3 or more Vehicles in Household Comparison
Alsatians
Dominicans
18.0%
3 OR MORE VEHICLES IN HOUSEHOLD
1.5/ 100
METRIC RATING
251st/ 347
METRIC RANK
11.2%
3 OR MORE VEHICLES IN HOUSEHOLD
0.0/ 100
METRIC RATING
344th/ 347
METRIC RANK
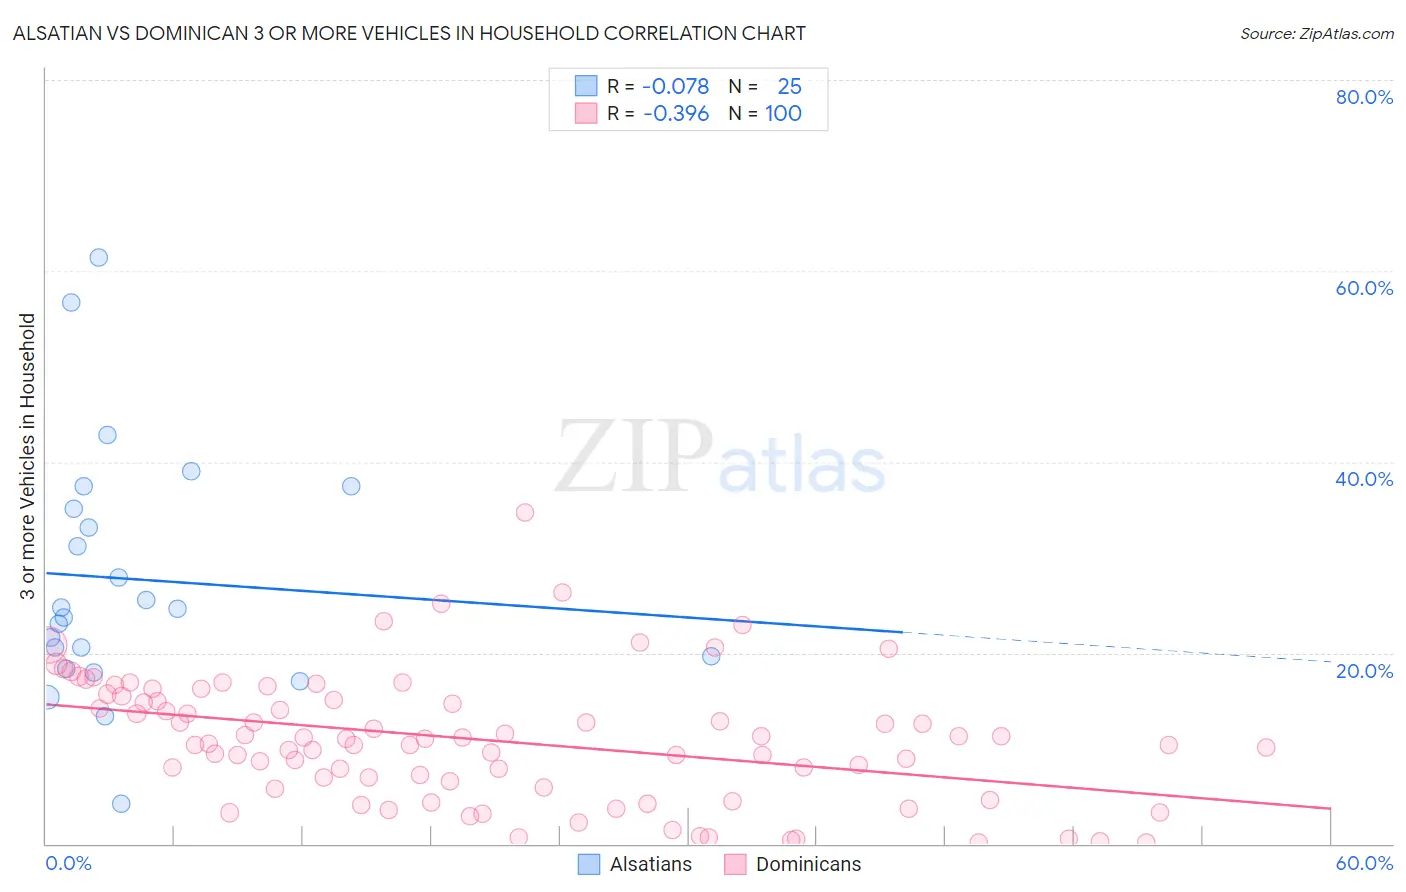
Alsatian vs Dominican 3 or more Vehicles in Household Correlation Chart
The statistical analysis conducted on geographies consisting of 82,678,763 people shows a slight negative correlation between the proportion of Alsatians and percentage of households with 3 or more vehicles available in the United States with a correlation coefficient (R) of -0.078 and weighted average of 18.0%. Similarly, the statistical analysis conducted on geographies consisting of 354,643,903 people shows a mild negative correlation between the proportion of Dominicans and percentage of households with 3 or more vehicles available in the United States with a correlation coefficient (R) of -0.396 and weighted average of 11.2%, a difference of 60.1%.
3 or more Vehicles in Household Correlation Summary
| Measurement | Alsatian | Dominican |
| Minimum | 4.2% | 0.12% |
| Maximum | 61.3% | 34.8% |
| Range | 57.1% | 34.6% |
| Mean | 27.7% | 10.9% |
| Median | 24.6% | 10.7% |
| Interquartile 25% (IQ1) | 19.0% | 6.2% |
| Interquartile 75% (IQ3) | 36.3% | 15.3% |
| Interquartile Range (IQR) | 17.3% | 9.1% |
| Standard Deviation (Sample) | 13.1% | 6.7% |
| Standard Deviation (Population) | 12.8% | 6.6% |
Similar Demographics by 3 or more Vehicles in Household
Demographics Similar to Alsatians by 3 or more Vehicles in Household
In terms of 3 or more vehicles in household, the demographic groups most similar to Alsatians are Venezuelan (18.0%, a difference of 0.20%), Immigrants from Saudi Arabia (18.0%, a difference of 0.22%), Immigrants from Southern Europe (17.9%, a difference of 0.23%), Immigrants from Eastern Africa (18.0%, a difference of 0.28%), and Carpatho Rusyn (18.0%, a difference of 0.41%).
| Demographics | Rating | Rank | 3 or more Vehicles in Household |
| Mongolians | 2.3 /100 | #244 | Tragic 18.1% |
| Immigrants | Belize | 2.1 /100 | #245 | Tragic 18.1% |
| Immigrants | Australia | 2.0 /100 | #246 | Tragic 18.1% |
| Carpatho Rusyns | 1.9 /100 | #247 | Tragic 18.0% |
| Immigrants | Eastern Africa | 1.8 /100 | #248 | Tragic 18.0% |
| Immigrants | Saudi Arabia | 1.7 /100 | #249 | Tragic 18.0% |
| Venezuelans | 1.7 /100 | #250 | Tragic 18.0% |
| Alsatians | 1.5 /100 | #251 | Tragic 18.0% |
| Immigrants | Southern Europe | 1.4 /100 | #252 | Tragic 17.9% |
| Immigrants | Ethiopia | 1.3 /100 | #253 | Tragic 17.9% |
| Ethiopians | 1.2 /100 | #254 | Tragic 17.9% |
| Immigrants | Turkey | 1.2 /100 | #255 | Tragic 17.9% |
| Sub-Saharan Africans | 1.1 /100 | #256 | Tragic 17.9% |
| Immigrants | Eritrea | 1.1 /100 | #257 | Tragic 17.8% |
| Sudanese | 1.1 /100 | #258 | Tragic 17.8% |
Demographics Similar to Dominicans by 3 or more Vehicles in Household
In terms of 3 or more vehicles in household, the demographic groups most similar to Dominicans are Immigrants from Guyana (11.2%, a difference of 0.15%), British West Indian (11.4%, a difference of 2.0%), Guyanese (11.5%, a difference of 2.0%), Immigrants from Barbados (11.7%, a difference of 4.4%), and Immigrants from Uzbekistan (12.0%, a difference of 6.8%).
| Demographics | Rating | Rank | 3 or more Vehicles in Household |
| Immigrants | Cabo Verde | 0.0 /100 | #333 | Tragic 13.6% |
| Immigrants | Ecuador | 0.0 /100 | #334 | Tragic 13.4% |
| Immigrants | Trinidad and Tobago | 0.0 /100 | #335 | Tragic 13.3% |
| Barbadians | 0.0 /100 | #336 | Tragic 12.6% |
| Immigrants | Bangladesh | 0.0 /100 | #337 | Tragic 12.5% |
| Vietnamese | 0.0 /100 | #338 | Tragic 12.5% |
| Immigrants | Uzbekistan | 0.0 /100 | #339 | Tragic 12.0% |
| Immigrants | Barbados | 0.0 /100 | #340 | Tragic 11.7% |
| Guyanese | 0.0 /100 | #341 | Tragic 11.5% |
| British West Indians | 0.0 /100 | #342 | Tragic 11.4% |
| Immigrants | Guyana | 0.0 /100 | #343 | Tragic 11.2% |
| Dominicans | 0.0 /100 | #344 | Tragic 11.2% |
| Immigrants | Dominican Republic | 0.0 /100 | #345 | Tragic 10.4% |
| Immigrants | St. Vincent and the Grenadines | 0.0 /100 | #346 | Tragic 10.1% |
| Immigrants | Grenada | 0.0 /100 | #347 | Tragic 9.1% |