Alsatian vs Pima 3 or more Vehicles in Household
COMPARE
Alsatian
Pima
3 or more Vehicles in Household
3 or more Vehicles in Household Comparison
Alsatians
Pima
18.0%
3 OR MORE VEHICLES IN HOUSEHOLD
1.5/ 100
METRIC RATING
251st/ 347
METRIC RANK
22.0%
3 OR MORE VEHICLES IN HOUSEHOLD
99.9/ 100
METRIC RATING
65th/ 347
METRIC RANK
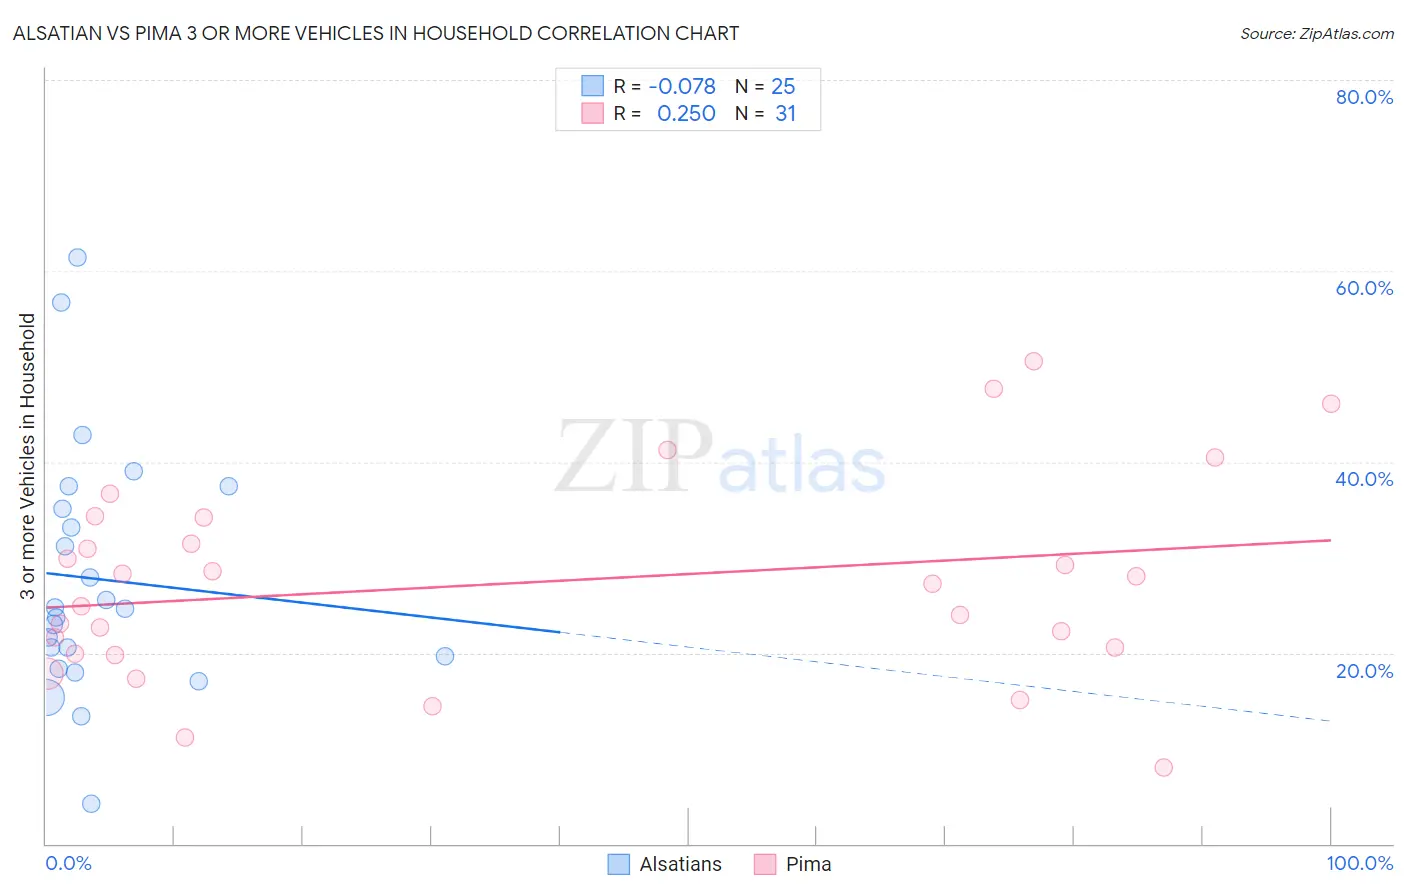
Alsatian vs Pima 3 or more Vehicles in Household Correlation Chart
The statistical analysis conducted on geographies consisting of 82,678,763 people shows a slight negative correlation between the proportion of Alsatians and percentage of households with 3 or more vehicles available in the United States with a correlation coefficient (R) of -0.078 and weighted average of 18.0%. Similarly, the statistical analysis conducted on geographies consisting of 61,538,722 people shows a weak positive correlation between the proportion of Pima and percentage of households with 3 or more vehicles available in the United States with a correlation coefficient (R) of 0.250 and weighted average of 22.0%, a difference of 22.6%.
3 or more Vehicles in Household Correlation Summary
| Measurement | Alsatian | Pima |
| Minimum | 4.2% | 8.0% |
| Maximum | 61.3% | 50.5% |
| Range | 57.1% | 42.6% |
| Mean | 27.7% | 27.3% |
| Median | 24.6% | 27.3% |
| Interquartile 25% (IQ1) | 19.0% | 20.0% |
| Interquartile 75% (IQ3) | 36.3% | 34.1% |
| Interquartile Range (IQR) | 17.3% | 14.2% |
| Standard Deviation (Sample) | 13.1% | 10.5% |
| Standard Deviation (Population) | 12.8% | 10.3% |
Similar Demographics by 3 or more Vehicles in Household
Demographics Similar to Alsatians by 3 or more Vehicles in Household
In terms of 3 or more vehicles in household, the demographic groups most similar to Alsatians are Venezuelan (18.0%, a difference of 0.20%), Immigrants from Saudi Arabia (18.0%, a difference of 0.22%), Immigrants from Southern Europe (17.9%, a difference of 0.23%), Immigrants from Eastern Africa (18.0%, a difference of 0.28%), and Carpatho Rusyn (18.0%, a difference of 0.41%).
| Demographics | Rating | Rank | 3 or more Vehicles in Household |
| Mongolians | 2.3 /100 | #244 | Tragic 18.1% |
| Immigrants | Belize | 2.1 /100 | #245 | Tragic 18.1% |
| Immigrants | Australia | 2.0 /100 | #246 | Tragic 18.1% |
| Carpatho Rusyns | 1.9 /100 | #247 | Tragic 18.0% |
| Immigrants | Eastern Africa | 1.8 /100 | #248 | Tragic 18.0% |
| Immigrants | Saudi Arabia | 1.7 /100 | #249 | Tragic 18.0% |
| Venezuelans | 1.7 /100 | #250 | Tragic 18.0% |
| Alsatians | 1.5 /100 | #251 | Tragic 18.0% |
| Immigrants | Southern Europe | 1.4 /100 | #252 | Tragic 17.9% |
| Immigrants | Ethiopia | 1.3 /100 | #253 | Tragic 17.9% |
| Ethiopians | 1.2 /100 | #254 | Tragic 17.9% |
| Immigrants | Turkey | 1.2 /100 | #255 | Tragic 17.9% |
| Sub-Saharan Africans | 1.1 /100 | #256 | Tragic 17.9% |
| Immigrants | Eritrea | 1.1 /100 | #257 | Tragic 17.8% |
| Sudanese | 1.1 /100 | #258 | Tragic 17.8% |
Demographics Similar to Pima by 3 or more Vehicles in Household
In terms of 3 or more vehicles in household, the demographic groups most similar to Pima are Northern European (22.0%, a difference of 0.14%), Alaskan Athabascan (21.9%, a difference of 0.40%), Immigrants from Taiwan (22.1%, a difference of 0.42%), British (21.9%, a difference of 0.55%), and Creek (21.9%, a difference of 0.58%).
| Demographics | Rating | Rank | 3 or more Vehicles in Household |
| Spaniards | 100.0 /100 | #58 | Exceptional 22.3% |
| Navajo | 100.0 /100 | #59 | Exceptional 22.3% |
| Finns | 99.9 /100 | #60 | Exceptional 22.3% |
| Bhutanese | 99.9 /100 | #61 | Exceptional 22.2% |
| Fijians | 99.9 /100 | #62 | Exceptional 22.2% |
| Chickasaw | 99.9 /100 | #63 | Exceptional 22.2% |
| Immigrants | Taiwan | 99.9 /100 | #64 | Exceptional 22.1% |
| Pima | 99.9 /100 | #65 | Exceptional 22.0% |
| Northern Europeans | 99.9 /100 | #66 | Exceptional 22.0% |
| Alaskan Athabascans | 99.9 /100 | #67 | Exceptional 21.9% |
| British | 99.9 /100 | #68 | Exceptional 21.9% |
| Creek | 99.9 /100 | #69 | Exceptional 21.9% |
| Bangladeshis | 99.8 /100 | #70 | Exceptional 21.9% |
| Potawatomi | 99.8 /100 | #71 | Exceptional 21.9% |
| Portuguese | 99.8 /100 | #72 | Exceptional 21.8% |