Alsatian vs Austrian 3 or more Vehicles in Household
COMPARE
Alsatian
Austrian
3 or more Vehicles in Household
3 or more Vehicles in Household Comparison
Alsatians
Austrians
18.0%
3 OR MORE VEHICLES IN HOUSEHOLD
1.5/ 100
METRIC RATING
251st/ 347
METRIC RANK
20.9%
3 OR MORE VEHICLES IN HOUSEHOLD
97.5/ 100
METRIC RATING
105th/ 347
METRIC RANK
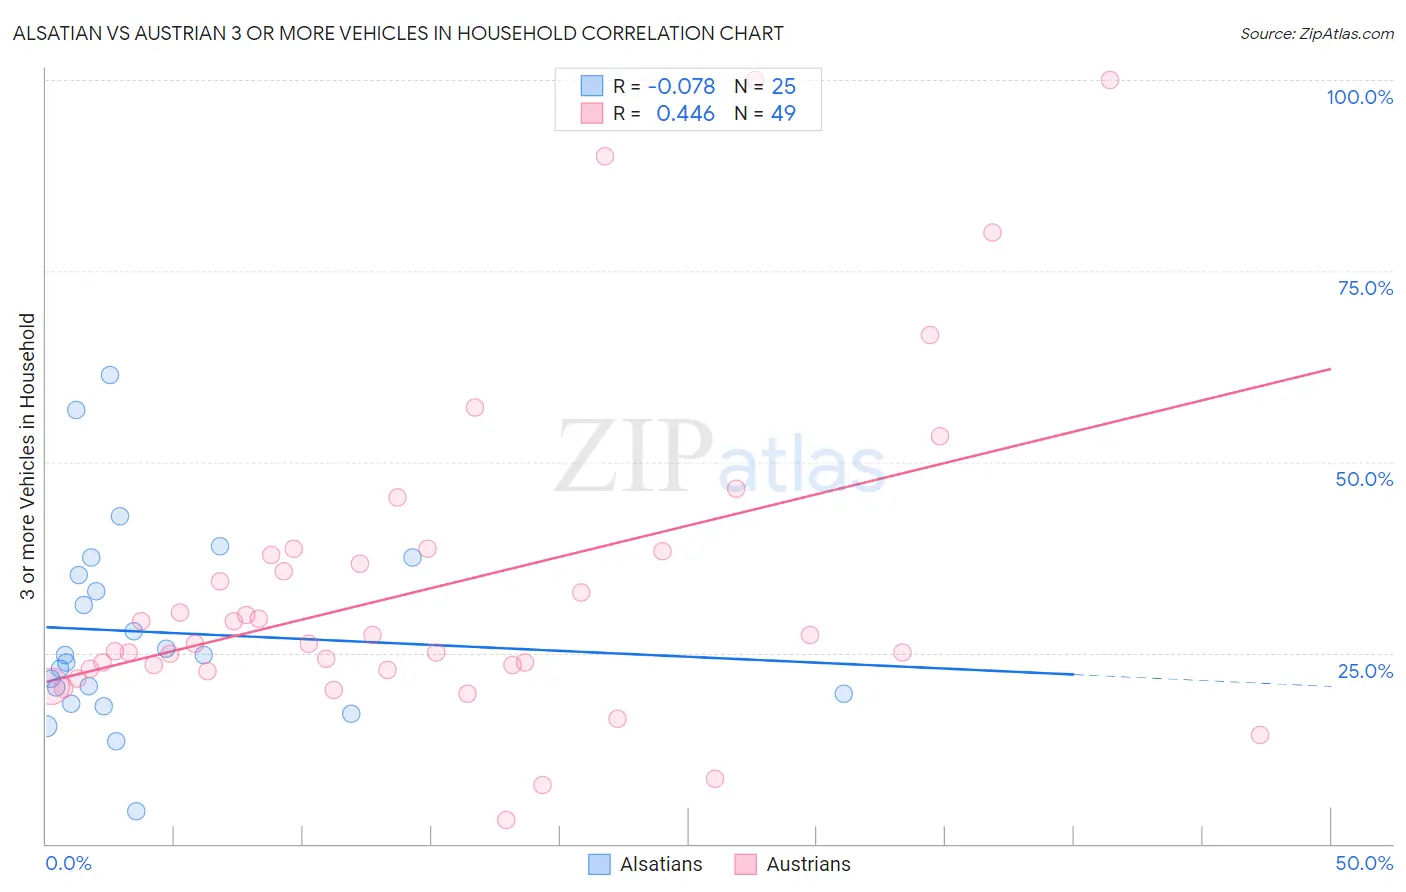
Alsatian vs Austrian 3 or more Vehicles in Household Correlation Chart
The statistical analysis conducted on geographies consisting of 82,678,763 people shows a slight negative correlation between the proportion of Alsatians and percentage of households with 3 or more vehicles available in the United States with a correlation coefficient (R) of -0.078 and weighted average of 18.0%. Similarly, the statistical analysis conducted on geographies consisting of 451,648,303 people shows a moderate positive correlation between the proportion of Austrians and percentage of households with 3 or more vehicles available in the United States with a correlation coefficient (R) of 0.446 and weighted average of 20.9%, a difference of 16.1%.
3 or more Vehicles in Household Correlation Summary
| Measurement | Alsatian | Austrian |
| Minimum | 4.2% | 3.1% |
| Maximum | 61.3% | 100.0% |
| Range | 57.1% | 96.9% |
| Mean | 27.7% | 33.7% |
| Median | 24.6% | 26.2% |
| Interquartile 25% (IQ1) | 19.0% | 22.8% |
| Interquartile 75% (IQ3) | 36.3% | 38.0% |
| Interquartile Range (IQR) | 17.3% | 15.2% |
| Standard Deviation (Sample) | 13.1% | 21.3% |
| Standard Deviation (Population) | 12.8% | 21.1% |
Similar Demographics by 3 or more Vehicles in Household
Demographics Similar to Alsatians by 3 or more Vehicles in Household
In terms of 3 or more vehicles in household, the demographic groups most similar to Alsatians are Venezuelan (18.0%, a difference of 0.20%), Immigrants from Saudi Arabia (18.0%, a difference of 0.22%), Immigrants from Southern Europe (17.9%, a difference of 0.23%), Immigrants from Eastern Africa (18.0%, a difference of 0.28%), and Carpatho Rusyn (18.0%, a difference of 0.41%).
| Demographics | Rating | Rank | 3 or more Vehicles in Household |
| Mongolians | 2.3 /100 | #244 | Tragic 18.1% |
| Immigrants | Belize | 2.1 /100 | #245 | Tragic 18.1% |
| Immigrants | Australia | 2.0 /100 | #246 | Tragic 18.1% |
| Carpatho Rusyns | 1.9 /100 | #247 | Tragic 18.0% |
| Immigrants | Eastern Africa | 1.8 /100 | #248 | Tragic 18.0% |
| Immigrants | Saudi Arabia | 1.7 /100 | #249 | Tragic 18.0% |
| Venezuelans | 1.7 /100 | #250 | Tragic 18.0% |
| Alsatians | 1.5 /100 | #251 | Tragic 18.0% |
| Immigrants | Southern Europe | 1.4 /100 | #252 | Tragic 17.9% |
| Immigrants | Ethiopia | 1.3 /100 | #253 | Tragic 17.9% |
| Ethiopians | 1.2 /100 | #254 | Tragic 17.9% |
| Immigrants | Turkey | 1.2 /100 | #255 | Tragic 17.9% |
| Sub-Saharan Africans | 1.1 /100 | #256 | Tragic 17.9% |
| Immigrants | Eritrea | 1.1 /100 | #257 | Tragic 17.8% |
| Sudanese | 1.1 /100 | #258 | Tragic 17.8% |
Demographics Similar to Austrians by 3 or more Vehicles in Household
In terms of 3 or more vehicles in household, the demographic groups most similar to Austrians are Bolivian (20.8%, a difference of 0.090%), Luxembourger (20.9%, a difference of 0.10%), Immigrants from Germany (20.8%, a difference of 0.13%), Dutch West Indian (20.9%, a difference of 0.19%), and Seminole (20.9%, a difference of 0.23%).
| Demographics | Rating | Rank | 3 or more Vehicles in Household |
| Hmong | 98.2 /100 | #98 | Exceptional 21.0% |
| Alaska Natives | 98.2 /100 | #99 | Exceptional 21.0% |
| Comanche | 98.2 /100 | #100 | Exceptional 21.0% |
| Blackfeet | 97.9 /100 | #101 | Exceptional 20.9% |
| Seminole | 97.8 /100 | #102 | Exceptional 20.9% |
| Dutch West Indians | 97.8 /100 | #103 | Exceptional 20.9% |
| Luxembourgers | 97.7 /100 | #104 | Exceptional 20.9% |
| Austrians | 97.5 /100 | #105 | Exceptional 20.9% |
| Bolivians | 97.4 /100 | #106 | Exceptional 20.8% |
| Immigrants | Germany | 97.4 /100 | #107 | Exceptional 20.8% |
| Immigrants | Scotland | 97.1 /100 | #108 | Exceptional 20.8% |
| Filipinos | 97.0 /100 | #109 | Exceptional 20.8% |
| Asians | 96.8 /100 | #110 | Exceptional 20.8% |
| Immigrants | Micronesia | 96.7 /100 | #111 | Exceptional 20.7% |
| Nicaraguans | 96.2 /100 | #112 | Exceptional 20.7% |