Alsatian Disability Age Over 75

COMPARE

Alsatian
Race
Ancestry
AfghanAfricanAlaska NativeAlaskan AthabascanAlbanianAleutAlsatianAmericanApacheArabArapahoArgentineanArmenianAssyrian/Chaldean/SyriacAustralianAustrianBahamianBangladeshiBarbadianBasqueBelgianBelizeanBermudanBhutaneseBlackfeetBolivianBrazilianBritishBritish West IndianBulgarianBurmeseCajunCambodianCanadianCape VerdeanCarpatho RusynCelticCentral AmericanCentral American IndianCherokeeCheyenneChickasawChileanChineseChippewaChoctawColombianColvilleComancheCosta RicanCreeCreekCroatianCrowCubanCypriotCzechCzechoslovakianDanishDelawareDominicanDutchDutch West IndianEastern EuropeanEcuadorianEgyptianEnglishEstonianEthiopianEuropeanFijianFilipinoFinnishFrenchFrench American IndianFrench CanadianGermanGerman RussianGhanaianGreekGuamanian/ChamorroGuatemalanGuyaneseHaitianHmongHonduranHopiHoumaHungarianIcelanderIndian (Asian)IndonesianInupiatIranianIraqiIrishIroquoisIsraeliItalianJamaicanJapaneseJordanianKenyanKiowaKoreanLaotianLatvianLebaneseLiberianLithuanianLumbeeLuxembourgerMacedonianMalaysianMalteseMarshalleseMenomineeMexicanMexican American IndianMongolianMoroccanNative HawaiianNavajoNepaleseNew ZealanderNicaraguanNigerianNorthern EuropeanNorwegianOkinawanOsageOttawaPaiutePakistaniPalestinianPanamanianParaguayanPennsylvania GermanPeruvianPimaPolishPortuguesePotawatomiPuebloPuerto RicanPuget Sound SalishRomanianRussianSalvadoranSamoanScandinavianScotch-IrishScottishSeminoleSenegaleseSerbianShoshoneSierra LeoneanSiouxSlavicSlovakSloveneSomaliSouth AfricanSouth AmericanSouth American IndianSoviet UnionSpaniardSpanishSpanish AmericanSpanish American IndianSri LankanSubsaharan AfricanSudaneseSwedishSwissSyrianTaiwaneseThaiTlingit-HaidaTohono O'OdhamTonganTrinidadian and TobagonianTsimshianTurkishU.S. Virgin IslanderUgandanUkrainianUruguayanUteVenezuelanVietnameseWelshWest IndianYakamaYaquiYugoslavianYumanYup'ikZimbabwean
Immigration
NonimmigrantsImmigrantsAfghanistanAfricaAlbaniaArgentinaArmeniaAsiaAustraliaAustriaBahamasBangladeshBarbadosBelarusBelgiumBelizeBoliviaBosnia and HerzegovinaBrazilBulgariaBurma/MyanmarCabo VerdeCambodiaCameroonCanadaCaribbeanCentral AmericaChileChinaColombiaCongoCosta RicaCroatiaCubaCzechoslovakiaDenmarkDominicaDominican RepublicEastern AfricaEastern AsiaEastern EuropeEcuadorEgyptEl SalvadorEnglandEritreaEthiopiaEuropeFijiFranceGermanyGhanaGreeceGrenadaGuatemalaGuyanaHaitiHondurasHong KongHungaryIndiaIndonesiaIranIraqIrelandIsraelItalyJamaicaJapanJordanKazakhstanKenyaKoreaKuwaitLaosLatin AmericaLatviaLebanonLiberiaLithuaniaMalaysiaMexicoMicronesiaMiddle AfricaMoldovaMoroccoNepalNetherlandsNicaraguaNigeriaNorth AmericaNorth MacedoniaNorthern AfricaNorthern EuropeNorwayOceaniaPakistanPanamaPeruPhilippinesPolandPortugalRomaniaRussiaSaudi ArabiaScotlandSenegalSerbiaSierra LeoneSingaporeSomaliaSouth AfricaSouth AmericaSouth Central AsiaSouth Eastern AsiaSouthern EuropeSpainSri LankaSt. Vincent and the GrenadinesSudanSwedenSwitzerlandSyriaTaiwanThailandTrinidad and TobagoTurkeyUgandaUkraineUruguayUzbekistanVenezuelaVietnamWest IndiesWestern AfricaWestern AsiaWestern EuropeYemenZaireZimbabweAzores
Select to Compare
Race
Ancestry
AfghanAfricanAlaska NativeAlaskan AthabascanAlbanianAleutAmericanApacheArabArapahoArgentineanArmenianAssyrian/Chaldean/SyriacAustralianAustrianBahamianBangladeshiBarbadianBasqueBelgianBelizeanBermudanBhutaneseBlackfeetBolivianBrazilianBritishBritish West IndianBulgarianBurmeseCajunCambodianCanadianCape VerdeanCarpatho RusynCelticCentral AmericanCentral American IndianCherokeeCheyenneChickasawChileanChineseChippewaChoctawColombianColvilleComancheCosta RicanCreeCreekCroatianCrowCubanCypriotCzechCzechoslovakianDanishDelawareDominicanDutchDutch West IndianEastern EuropeanEcuadorianEgyptianEnglishEstonianEthiopianEuropeanFijianFilipinoFinnishFrenchFrench American IndianFrench CanadianGermanGerman RussianGhanaianGreekGuamanian/ChamorroGuatemalanGuyaneseHaitianHmongHonduranHopiHoumaHungarianIcelanderIndian (Asian)IndonesianInupiatIranianIraqiIrishIroquoisIsraeliItalianJamaicanJapaneseJordanianKenyanKiowaKoreanLaotianLatvianLebaneseLiberianLithuanianLumbeeLuxembourgerMacedonianMalaysianMalteseMarshalleseMenomineeMexicanMexican American IndianMongolianMoroccanNative HawaiianNavajoNepaleseNew ZealanderNicaraguanNigerianNorthern EuropeanNorwegianOkinawanOsageOttawaPaiutePakistaniPalestinianPanamanianParaguayanPennsylvania GermanPeruvianPimaPolishPortuguesePotawatomiPuebloPuerto RicanPuget Sound SalishRomanianRussianSalvadoranSamoanScandinavianScotch-IrishScottishSeminoleSenegaleseSerbianShoshoneSierra LeoneanSiouxSlavicSlovakSloveneSomaliSouth AfricanSouth AmericanSouth American IndianSoviet UnionSpaniardSpanishSpanish AmericanSpanish American IndianSri LankanSubsaharan AfricanSudaneseSwedishSwissSyrianTaiwaneseThaiTlingit-HaidaTohono O'OdhamTonganTrinidadian and TobagonianTsimshianTurkishU.S. Virgin IslanderUgandanUkrainianUruguayanUteVenezuelanVietnameseWelshWest IndianYakamaYaquiYugoslavianYumanYup'ikZimbabwean
Immigration
NonimmigrantsImmigrantsAfghanistanAfricaAlbaniaArgentinaArmeniaAsiaAustraliaAustriaBahamasBangladeshBarbadosBelarusBelgiumBelizeBoliviaBosnia and HerzegovinaBrazilBulgariaBurma/MyanmarCabo VerdeCambodiaCameroonCanadaCaribbeanCentral AmericaChileChinaColombiaCongoCosta RicaCroatiaCubaCzechoslovakiaDenmarkDominicaDominican RepublicEastern AfricaEastern AsiaEastern EuropeEcuadorEgyptEl SalvadorEnglandEritreaEthiopiaEuropeFijiFranceGermanyGhanaGreeceGrenadaGuatemalaGuyanaHaitiHondurasHong KongHungaryIndiaIndonesiaIranIraqIrelandIsraelItalyJamaicaJapanJordanKazakhstanKenyaKoreaKuwaitLaosLatin AmericaLatviaLebanonLiberiaLithuaniaMalaysiaMexicoMicronesiaMiddle AfricaMoldovaMoroccoNepalNetherlandsNicaraguaNigeriaNorth AmericaNorth MacedoniaNorthern AfricaNorthern EuropeNorwayOceaniaPakistanPanamaPeruPhilippinesPolandPortugalRomaniaRussiaSaudi ArabiaScotlandSenegalSerbiaSierra LeoneSingaporeSomaliaSouth AfricaSouth AmericaSouth Central AsiaSouth Eastern AsiaSouthern EuropeSpainSri LankaSt. Vincent and the GrenadinesSudanSwedenSwitzerlandSyriaTaiwanThailandTrinidad and TobagoTurkeyUgandaUkraineUruguayUzbekistanVenezuelaVietnamWest IndiesWestern AfricaWestern AsiaWestern EuropeYemenZaireZimbabweAzores
Disability Age Over 75
Income
Poverty
Unemployment
Labor Participation
Family Structure
Vehicle Availability
Education Level
Disability

Alsatian Disability Age Over 75
Average

47.3%
DISABILITY | AGE OVER 75
51.9/ 100
METRIC RATING
173rd/ 347
METRIC RANK

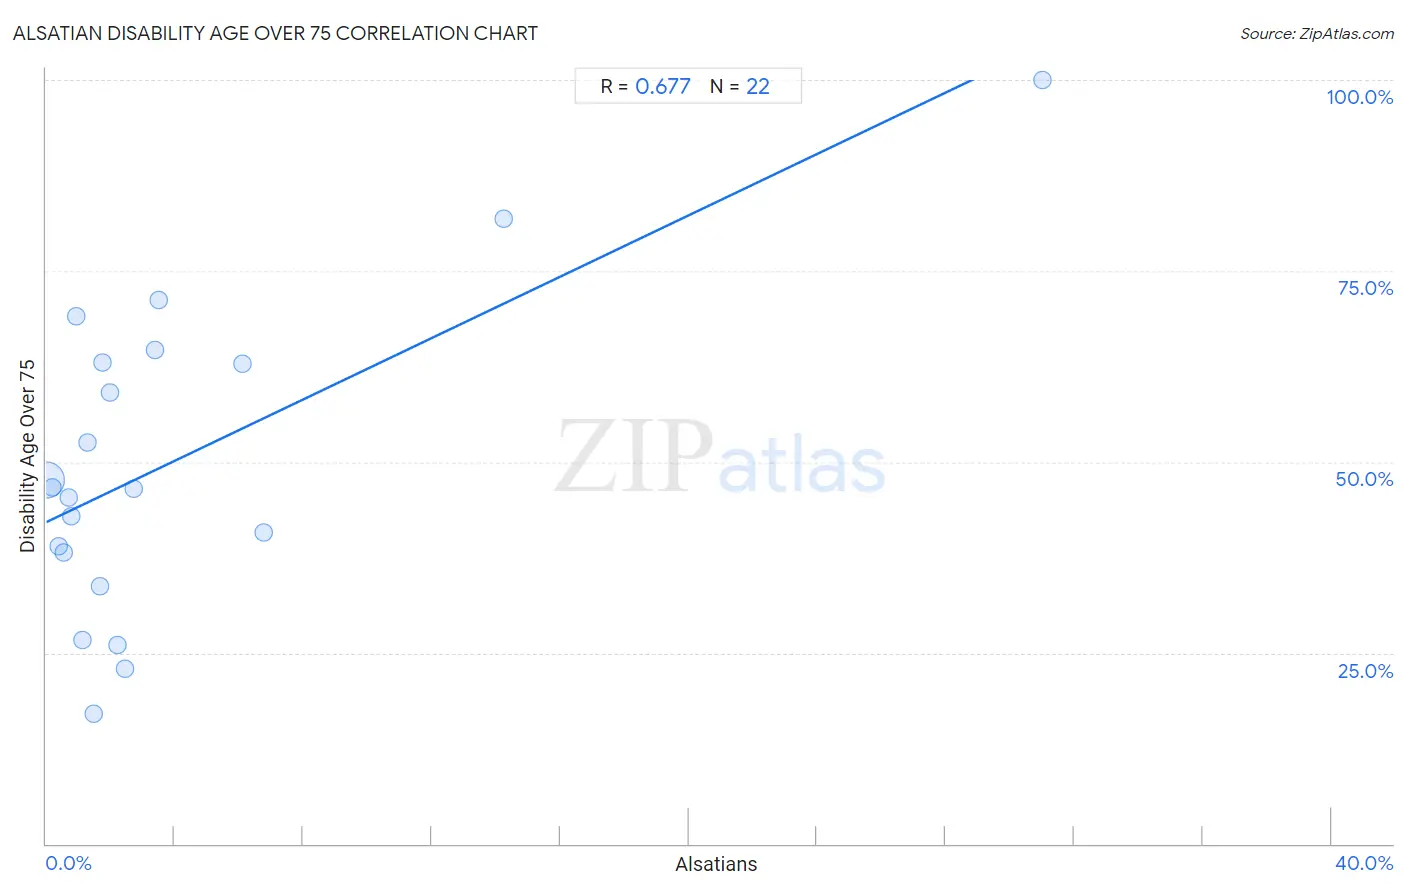
Alsatian Disability Age Over 75 Correlation Chart

The statistical analysis conducted on geographies consisting of 82,676,036 people shows a significant positive correlation between the proportion of Alsatians and percentage of population with a disability over the age of 75 in the United States with a correlation coefficient (R) of 0.677 and weighted average of 47.3%. On average, for every 1% (one percent) increase in Alsatians within a typical geography, there is an increase of 2.0% in percentage of population with a disability over the age of 75.
Alsatian Disability Age Over 75
It is essential to understand that the correlation between the percentage of Alsatians and percentage of population with a disability over the age of 75 does not imply a direct cause-and-effect relationship. It remains uncertain whether the presence of Alsatians influences an upward or downward trend in the level of percentage of population with a disability over the age of 75 within an area, or if Alsatians simply ended up residing in those areas with higher or lower levels of percentage of population with a disability over the age of 75 due to other factors.

Demographics Similar to Alsatians by Disability Age Over 75

In terms of disability age over 75, the demographic groups most similar to Alsatians are Scotch-Irish (47.3%, a difference of 0.010%), Immigrants from Africa (47.3%, a difference of 0.040%), White/Caucasian (47.3%, a difference of 0.040%), Immigrants from Haiti (47.3%, a difference of 0.050%), and German Russian (47.3%, a difference of 0.10%).
DemographicsRating | RankDisability Age Over 75
Immigrants from Sierra Leone
64.4
/100
|
#166
Good
47.2%
Moroccans
62.9
/100
|
#167
Good
47.2%
Kenyans
58.8
/100
|
#168
Average
47.2%
Celtics
58.7
/100
|
#169
Average
47.2%
German Russians
56.2
/100
|
#170
Average
47.3%
Immigrants from Africa
53.6
/100
|
#171
Average
47.3%
Scotch-Irish
52.5
/100
|
#172
Average
47.3%
Alsatians
51.9
/100
|
#173
Average
47.3%
Whites/Caucasians
50.0
/100
|
#174
Average
47.3%
Immigrants from Haiti
49.7
/100
|
#175
Average
47.3%
Ecuadorians
46.7
/100
|
#176
Average
47.4%
Haitians
44.6
/100
|
#177
Average
47.4%
Cubans
42.1
/100
|
#178
Average
47.4%
Sierra Leoneans
41.7
/100
|
#179
Average
47.4%
Immigrants from Ecuador
41.7
/100
|
#180
Average
47.4%

Alsatian Disability Age Over 75 Correlation Summary

MeasurementAlsatian DataDisability Age Over 75 Data
Minimum0.016%17.1%
Maximum31.0%100.0%
Range31.0%82.9%
Mean3.9%49.9%
Median1.7%46.6%
Interquartile 25% (IQ1)0.79%38.2%
Interquartile 75% (IQ3)3.4%63.0%
Interquartile Range (IQR)2.6%24.8%
Standard Deviation (Sample)6.8%20.2%
Standard Deviation (Population)6.7%19.8%

Correlation Details

Alsatian PercentileSample SizeDisability Age Over 75
[
0.0%
-
0.5%
]
0.016%
81,405,59947.6%
[
0.0%
-
0.5%
]
0.20%
928,02946.7%
[
0.0%
-
0.5%
]
0.38%
110,74739.0%
[
0.5%
-
1.0%
]
0.56%
119,00638.2%
[
0.5%
-
1.0%
]
0.72%
32,09145.4%
[
0.5%
-
1.0%
]
0.79%
42,07942.9%
[
0.5%
-
1.0%
]
0.95%
5,78469.1%
[
1.0%
-
1.5%
]
1.15%
26226.7%
[
1.0%
-
1.5%
]
1.29%
3,40852.5%
[
1.0%
-
1.5%
]
1.47%
2,79217.1%
[
1.5%
-
2.0%
]
1.67%
4,55533.7%
[
1.5%
-
2.0%
]
1.75%
1,60463.0%
[
1.5%
-
2.0%
]
1.97%
1,01759.1%
[
2.0%
-
2.5%
]
2.23%
1,57326.1%
[
2.0%
-
2.5%
]
2.47%
24322.9%
[
2.5%
-
3.0%
]
2.73%
1,32146.5%
[
3.0%
-
3.5%
]
3.39%
82764.6%
[
3.5%
-
4.0%
]
3.52%
1,84871.2%
[
6.0%
-
6.5%
]
6.11%
2,99462.9%
[
6.5%
-
7.0%
]
6.77%
9,20240.8%
[
14.0%
-
14.5%
]
14.25%
72381.8%
[
31.0%
-
31.5%
]
31.02%
332100.0%