Zip Codes with the Highest Percentage of Population with a Degree in Literature and Languages in Chattanooga, TN

RELATED REPORTS & OPTIONS

Literature and Languages
Population
Families and Households
Female Fertility
Female Fertility (Unmarried)
Race (Community Size)
Race (Percentage)
Ancestry (Community Size)
AfricanAmericanArabArgentineanArmenianAustralianAustrianBelgianBhutaneseBlackfeetBrazilianBritishBurmeseCajunCanadianCelticCentral AmericanCherokeeChileanChippewaChoctawColombianCreekCroatianCubanCzechCzechoslovakianDanishDominicanDutchDutch West IndianEastern EuropeanEgyptianEnglishEthiopianEuropeanFilipinoFinnishFrenchFrench American IndianFrench CanadianGermanGreekGuamanian / ChamorroGuatemalanHaitianHonduranHungarianIcelanderIndian (Asian)IranianIrishIsraeliItalianJamaicanJapaneseKoreanLaotianLebaneseLithuanianLuxembourgerMalaysianMalteseMexicanMexican American IndianMoroccanNative HawaiianNew ZealanderNicaraguanNigerianNorthern EuropeanNorwegianPakistaniPalestinianPanamanianPennsylvania GermanPeruvianPolishPortuguesePuerto RicanRomanianRussianSalvadoranSamoanScandinavianScotch-IrishScottishSerbianSiouxSlovakSloveneSouth AfricanSouth AmericanSpaniardSpanishSri LankanSubsaharan AfricanSudaneseSwedishSwissSyrianThaiTurkishUkrainianUruguayanVenezuelanWelshYugoslavian
Ancestry (Percentage)
AfricanAmericanArabArgentineanArmenianAustralianAustrianBelgianBhutaneseBlackfeetBrazilianBritishBurmeseCajunCanadianCelticCentral AmericanCherokeeChileanChippewaChoctawColombianCreekCroatianCubanCzechCzechoslovakianDanishDominicanDutchDutch West IndianEastern EuropeanEgyptianEnglishEthiopianEuropeanFilipinoFinnishFrenchFrench American IndianFrench CanadianGermanGreekGuamanian / ChamorroGuatemalanHaitianHonduranHungarianIcelanderIndian (Asian)IranianIrishIsraeliItalianJamaicanJapaneseKoreanLaotianLebaneseLithuanianLuxembourgerMalaysianMalteseMexicanMexican American IndianMoroccanNative HawaiianNew ZealanderNicaraguanNigerianNorthern EuropeanNorwegianPakistaniPalestinianPanamanianPennsylvania GermanPeruvianPolishPortuguesePuerto RicanRomanianRussianSalvadoranSamoanScandinavianScotch-IrishScottishSerbianSiouxSlovakSloveneSouth AfricanSouth AmericanSpaniardSpanishSri LankanSubsaharan AfricanSudaneseSwedishSwissSyrianThaiTurkishUkrainianUruguayanVenezuelanWelshYugoslavian
Immigrant Origin (Total)
Immigrant Origin (Percentage)
Income
Income (Families)
Income (Households)
Poverty
Poverty (Families)
Unemployment
Employment Occupations
Employment Industries
Employer Class
Commute Time
Commute Means
School Enrollment
Education by Degree Field
Occupancy
Finances
Physical Characteristics
Chattanooga
Compare Zip Codes
Comparison Subject

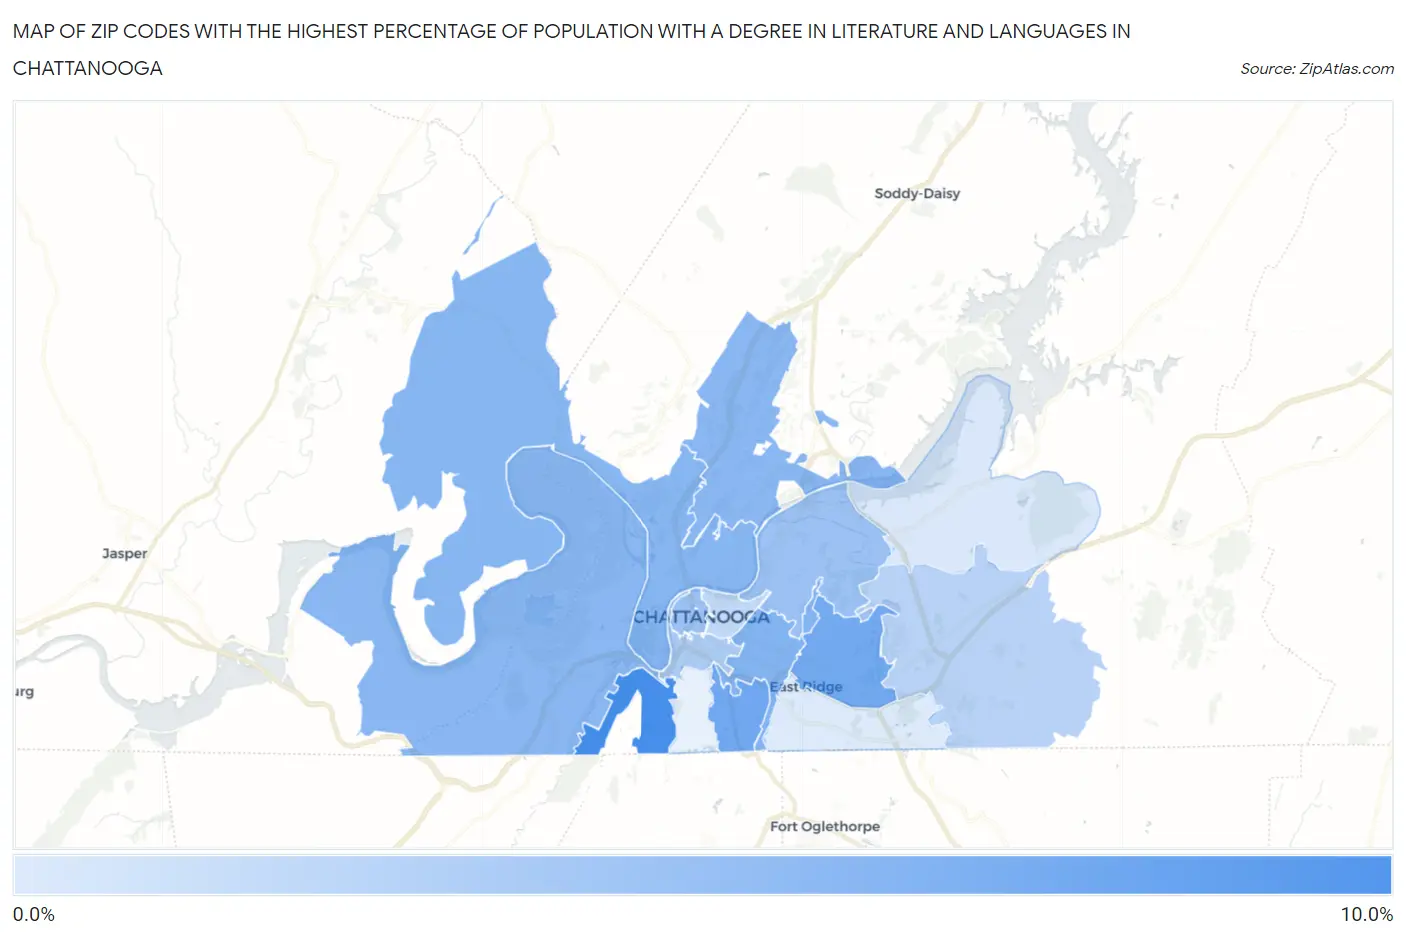
Map of Zip Codes with the Highest Percentage of Population with a Degree in Literature and Languages in Chattanooga

0.0%
10.0%
Zip Codes with the Highest Percentage of Population with a Degree in Literature and Languages in Chattanooga Map

Zip Codes with the Highest Percentage of Population with a Degree in Literature and Languages in Chattanooga, TN

Zip Code % Graduates vs State vs National
1.374099.3%3.6%(+5.71)#284.4%(+4.91)#2,138
2.374076.9%3.6%(+3.29)#544.4%(+2.50)#4,101
3.374116.8%3.6%(+3.18)#574.4%(+2.38)#4,255
4.374045.9%3.6%(+2.27)#824.4%(+1.47)#5,615
5.374055.7%3.6%(+2.09)#854.4%(+1.29)#5,946
6.374155.6%3.6%(+1.98)#904.4%(+1.19)#6,137
7.374195.5%3.6%(+1.90)#934.4%(+1.10)#6,289
8.374024.5%3.6%(+0.891)#1324.4%(+0.093)#8,709
9.374064.5%3.6%(+0.869)#1344.4%(+0.071)#8,760
10.374083.7%3.6%(+0.054)#1714.4%(-0.743)#11,279
11.374213.0%3.6%(-0.585)#2214.4%(-1.38)#13,491
12.374032.5%3.6%(-1.07)#2504.4%(-1.87)#15,166
13.374161.2%3.6%(-2.45)#3584.4%(-3.25)#19,696
14.374121.0%3.6%(-2.58)#3654.4%(-3.38)#20,046

Common Questions

What are the Top 10 Zip Codes with the Highest Percentage of Population with a Degree in Literature and Languages in Chattanooga, TN?
Top 10 Zip Codes with the Highest Percentage of Population with a Degree in Literature and Languages in Chattanooga, TN are:
#1
9.3%
#2
6.9%
#3
6.8%
#4
5.9%
#5
5.7%
#6
5.6%
#7
5.5%
#8
4.5%
#9
4.5%
#10
3.7%
What zip code has the Highest Percentage of Population with a Degree in Literature and Languages in Chattanooga, TN?
37409 has the Highest Percentage of Population with a Degree in Literature and Languages in Chattanooga, TN with 9.3%.
What is the Percentage of Population with a Degree in Literature and Languages in Chattanooga, TN?
Percentage of Population with a Degree in Literature and Languages in Chattanooga is 4.4%.
What is the Percentage of Population with a Degree in Literature and Languages in Tennessee?
Percentage of Population with a Degree in Literature and Languages in Tennessee is 3.6%.
What is the Percentage of Population with a Degree in Literature and Languages in the United States?
Percentage of Population with a Degree in Literature and Languages in the United States is 4.4%.