Zip Codes with the Highest Percentage of Population with a Degree in Literature and Languages in Clarksville, TN

RELATED REPORTS & OPTIONS

Literature and Languages
Population
Families and Households
Female Fertility
Female Fertility (Unmarried)
Race (Community Size)
Race (Percentage)
Ancestry (Community Size)
AfricanAmericanArabArgentineanAustrianBangladeshiBelgianBhutaneseBlackfeetBrazilianBritishBritish West IndianBurmeseCajunCanadianCelticCentral AmericanCentral American IndianCherokeeCheyenneChickasawChileanChippewaChoctawColombianCreekCroatianCubanCzechCzechoslovakianDanishDominicanDutchEastern EuropeanEgyptianEnglishEthiopianEuropeanFinnishFrenchFrench CanadianGermanGreekGuamanian / ChamorroGuatemalanGuyaneseHonduranHungarianIndian (Asian)InupiatIranianIrishItalianJamaicanJapaneseKoreanLatvianLebaneseLiberianLithuanianMexicanMexican American IndianNative HawaiianNavajoNigerianNorthern EuropeanNorwegianPakistaniPanamanianPeruvianPolishPortuguesePuerto RicanRomanianRussianSalvadoranSamoanScandinavianScotch-IrishScottishSlavicSlovakSouth AmericanSpaniardSpanishSri LankanSubsaharan AfricanSwedishSwissSyrianThaiUkrainianWelshWest Indian
Ancestry (Percentage)
AfricanAmericanArabArgentineanAustrianBangladeshiBelgianBhutaneseBlackfeetBrazilianBritishBritish West IndianBurmeseCajunCanadianCelticCentral AmericanCentral American IndianCherokeeCheyenneChickasawChileanChippewaChoctawColombianCreekCroatianCubanCzechCzechoslovakianDanishDominicanDutchEastern EuropeanEgyptianEnglishEthiopianEuropeanFinnishFrenchFrench CanadianGermanGreekGuamanian / ChamorroGuatemalanGuyaneseHonduranHungarianIndian (Asian)InupiatIranianIrishItalianJamaicanJapaneseKoreanLatvianLebaneseLiberianLithuanianMexicanMexican American IndianNative HawaiianNavajoNigerianNorthern EuropeanNorwegianPakistaniPanamanianPeruvianPolishPortuguesePuerto RicanRomanianRussianSalvadoranSamoanScandinavianScotch-IrishScottishSlavicSlovakSouth AmericanSpaniardSpanishSri LankanSubsaharan AfricanSwedishSwissSyrianThaiUkrainianWelshWest Indian
Immigrant Origin (Total)
Immigrant Origin (Percentage)
Income
Income (Families)
Income (Households)
Poverty
Poverty (Families)
Unemployment
Employment Occupations
Employment Industries
Employer Class
Commute Time
Commute Means
School Enrollment
Education by Degree Field
Occupancy
Finances
Physical Characteristics
Clarksville
Compare Zip Codes
Comparison Subject

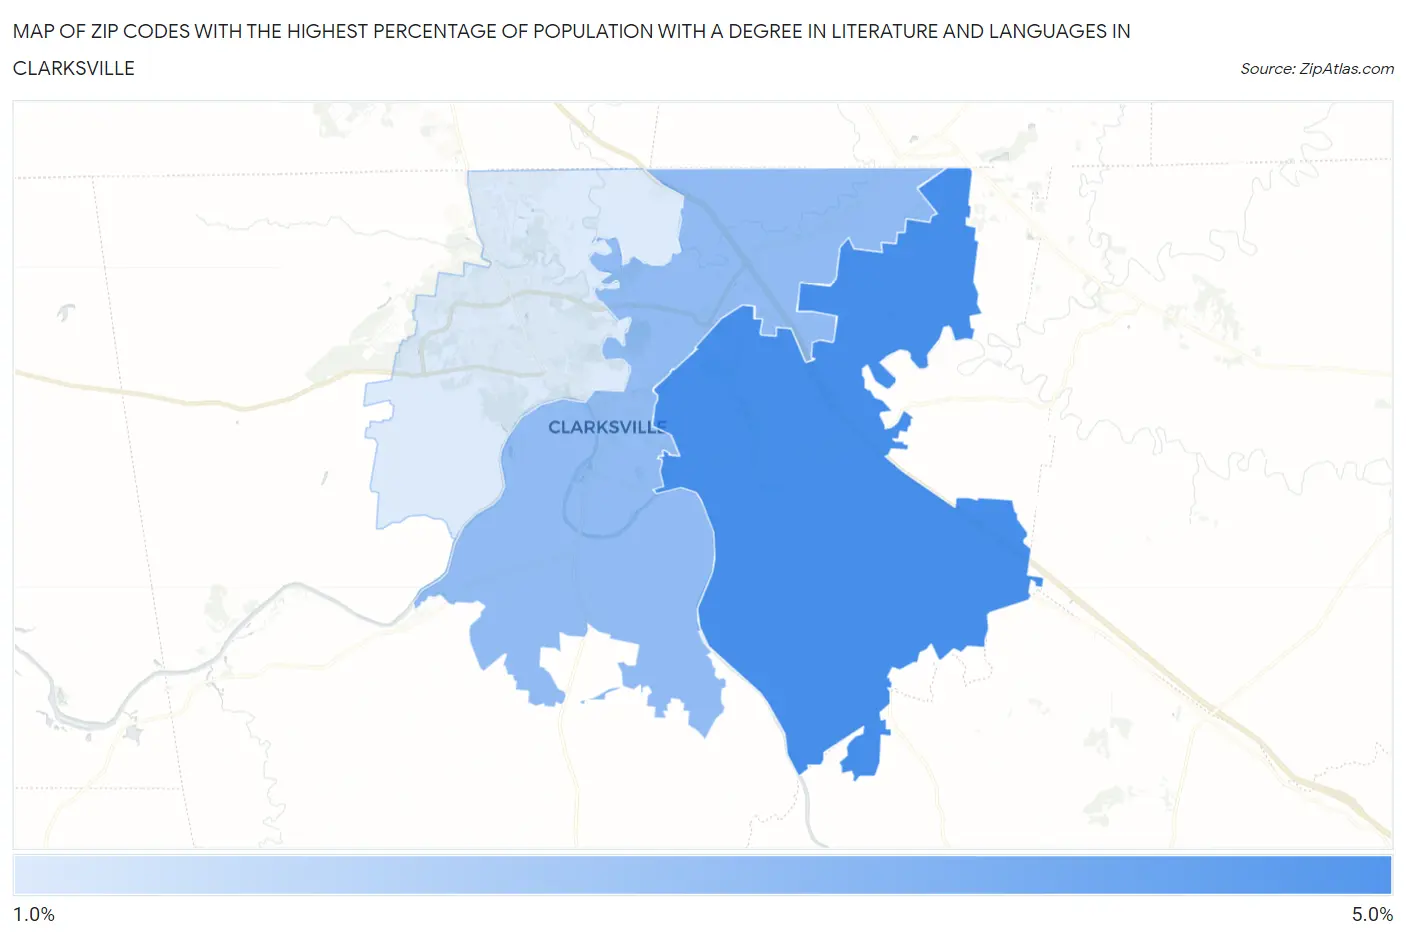
Map of Zip Codes with the Highest Percentage of Population with a Degree in Literature and Languages in Clarksville

0.0%
5.0%
Zip Codes with the Highest Percentage of Population with a Degree in Literature and Languages in Clarksville Map

Zip Codes with the Highest Percentage of Population with a Degree in Literature and Languages in Clarksville, TN

Zip Code % Graduates vs State vs National
1.370434.7%3.6%(+1.05)#1234.4%(+0.253)#8,254
2.370403.2%3.6%(-0.432)#2094.4%(-1.23)#12,971
3.370421.7%3.6%(-1.94)#3194.4%(-2.73)#18,096

Common Questions

What are the Top Zip Codes with the Highest Percentage of Population with a Degree in Literature and Languages in Clarksville, TN?
Top Zip Codes with the Highest Percentage of Population with a Degree in Literature and Languages in Clarksville, TN are:
#1
4.7%
#2
3.2%
#3
1.7%
What zip code has the Highest Percentage of Population with a Degree in Literature and Languages in Clarksville, TN?
37043 has the Highest Percentage of Population with a Degree in Literature and Languages in Clarksville, TN with 4.7%.
What is the Percentage of Population with a Degree in Literature and Languages in Clarksville, TN?
Percentage of Population with a Degree in Literature and Languages in Clarksville is 3.1%.
What is the Percentage of Population with a Degree in Literature and Languages in Tennessee?
Percentage of Population with a Degree in Literature and Languages in Tennessee is 3.6%.
What is the Percentage of Population with a Degree in Literature and Languages in the United States?
Percentage of Population with a Degree in Literature and Languages in the United States is 4.4%.