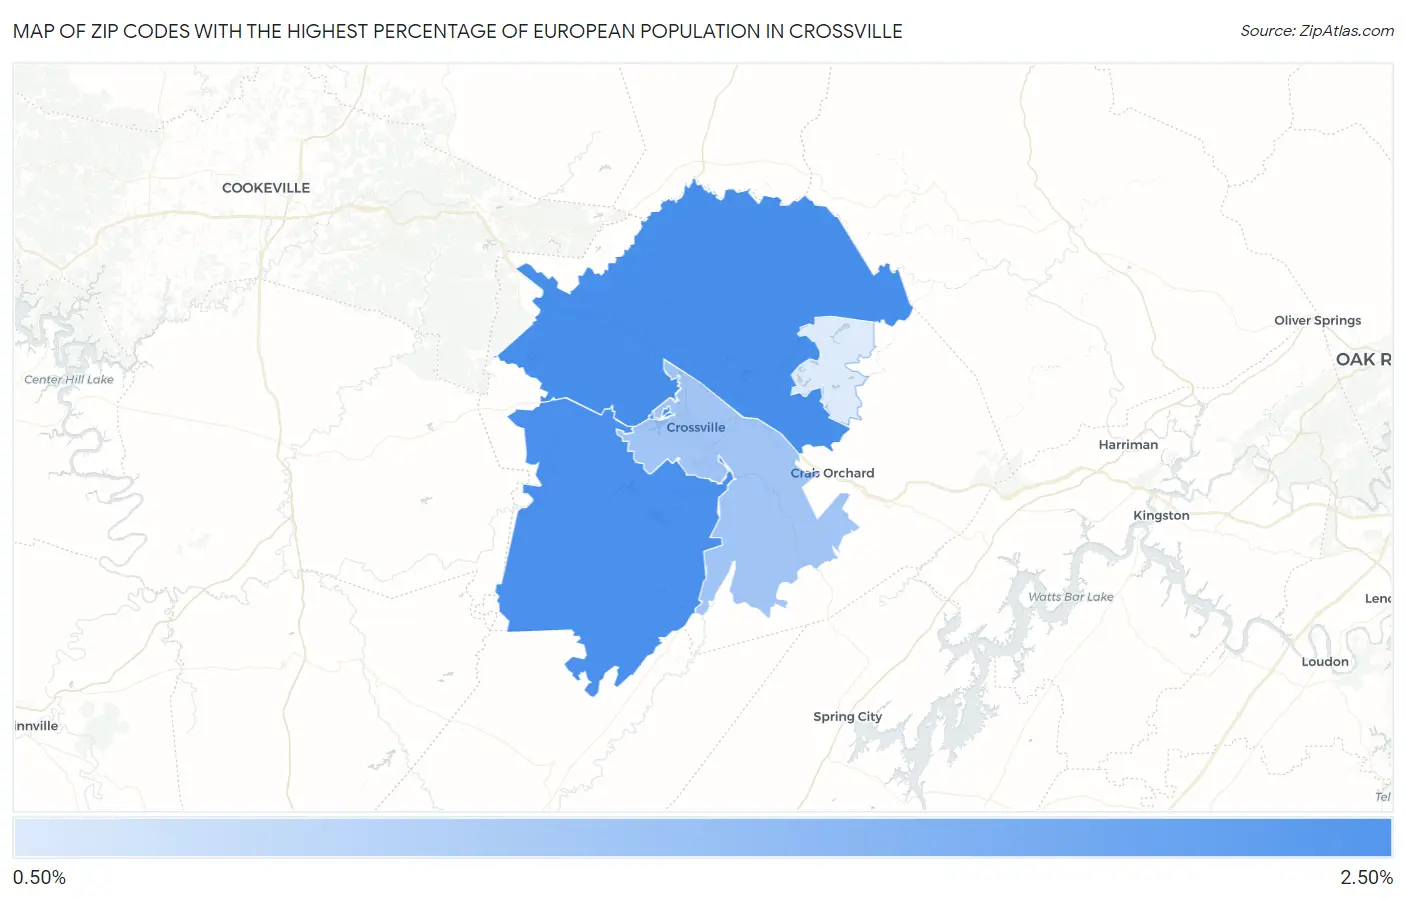
Zip Codes with the Highest Percentage of European Population in Crossville, TN
RELATED REPORTS & OPTIONS
European
Crossville
Compare Zip Codes
Map of Zip Codes with the Highest Percentage of European Population in Crossville
0.81%
2.35%
Zip Codes with the Highest Percentage of European Population in Crossville, TN
| Zip Code | European | vs State | vs National | |
| 1. | 38571 | 2.35% | 2.09%(+0.254)#169 | 1.67%(+0.675)#6,797 |
| 2. | 38572 | 2.34% | 2.09%(+0.241)#170 | 1.67%(+0.662)#6,860 |
| 3. | 38555 | 1.42% | 2.09%(-0.671)#279 | 1.67%(-0.250)#12,017 |
| 4. | 38558 | 0.81% | 2.09%(-1.28)#398 | 1.67%(-0.861)#17,287 |
1
Common Questions
What are the Top 3 Zip Codes with the Highest Percentage of European Population in Crossville, TN?
Top 3 Zip Codes with the Highest Percentage of European Population in Crossville, TN are:
What zip code has the Highest Percentage of European Population in Crossville, TN?
38571 has the Highest Percentage of European Population in Crossville, TN with 2.35%.
What is the Percentage of European Population in Crossville, TN?
Percentage of European Population in Crossville is 1.05%.
What is the Percentage of European Population in Tennessee?
Percentage of European Population in Tennessee is 2.09%.
What is the Percentage of European Population in the United States?
Percentage of European Population in the United States is 1.67%.