Vivian, SD Map & Demographics
Vivian Map
Vivian Overview
$40,018
PER CAPITA INCOME
$55,500
AVG HOUSEHOLD INCOME
0.41
INEQUALITY / GINI INDEX
50
TOTAL POPULATION
26
MALE POPULATION
24
FEMALE POPULATION
108.33
MALES / 100 FEMALES
92.31
FEMALES / 100 MALES
60.4
MEDIAN AGE
2.4
AVG FAMILY SIZE
2.1
AVG HOUSEHOLD SIZE
29
LABOR FORCE [ PEOPLE ]
58.0%
PERCENT IN LABOR FORCE
Vivian Zip Codes
Vivian Area Codes
Income in Vivian
Income Overview in Vivian
| Characteristic | Number | Measure |
| Per Capita Income | 50 | $40,018 |
| Median Family Income | 18 | $0 |
| Mean Family Income | 18 | $70,828 |
| Median Household Income | 24 | $55,500 |
| Mean Household Income | 24 | $60,800 |
| Income Deficit | 18 | $0 |
| Wage / Income Gap (%) | 50 | 0.00% |
| Wage / Income Gap ($) | 50 | 100.00¢ per $1 |
| Gini / Inequality Index | 50 | 0.41 |
Earnings by Sex in Vivian
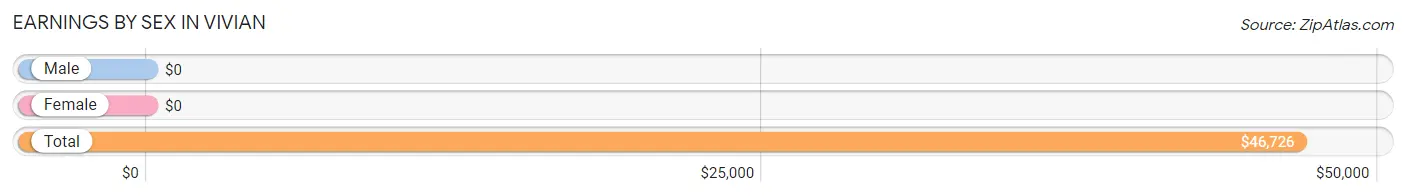
| Sex | Number | Average Earnings |
| Male | 22 (75.9%) | $0 |
| Female | 7 (24.1%) | $0 |
| Total | 29 (100.0%) | $46,726 |
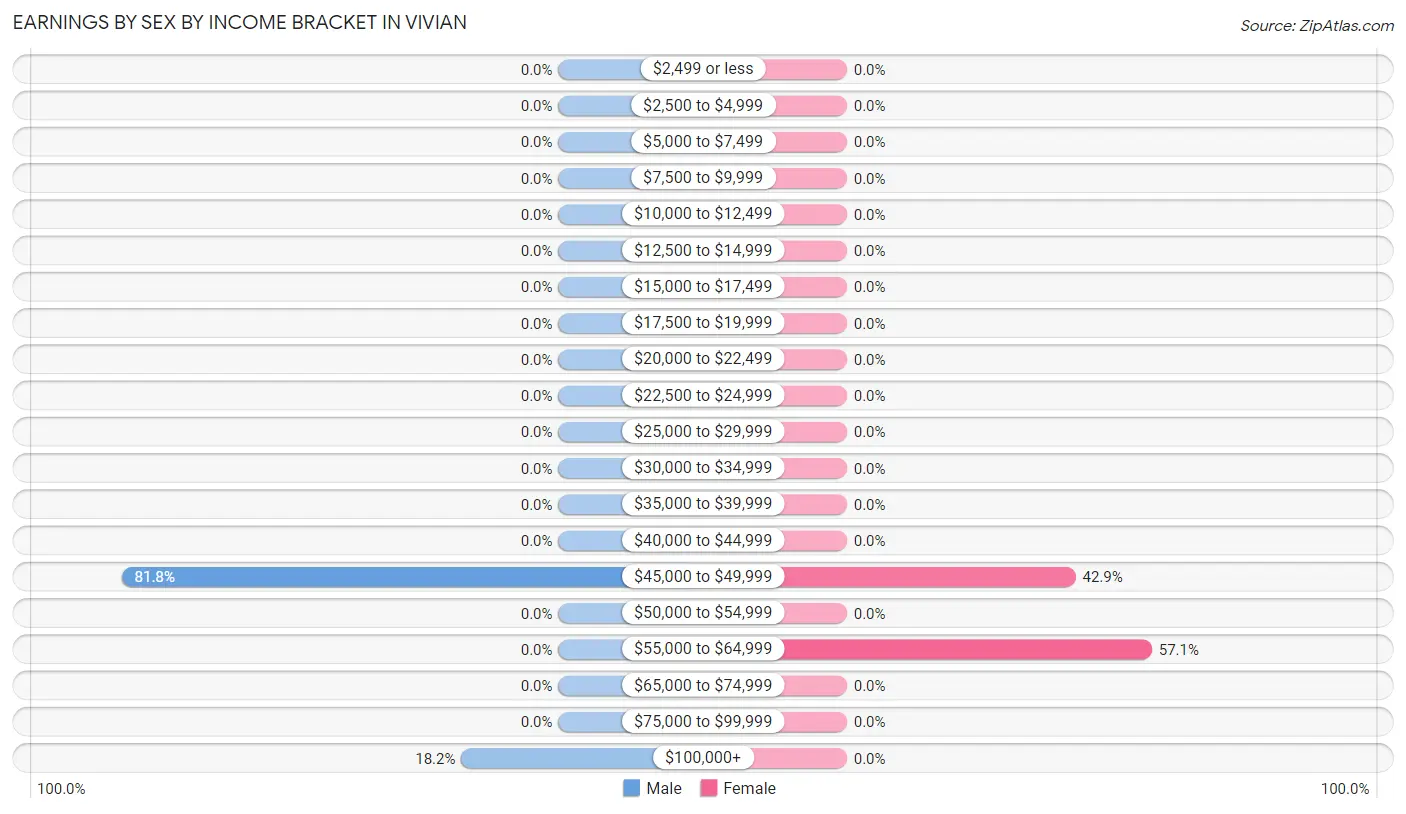
Earnings by Sex by Income Bracket in Vivian
The most common earnings brackets in Vivian are $45,000 to $49,999 for men (18 | 81.8%) and $55,000 to $64,999 for women (4 | 57.1%).
| Income | Male | Female |
| $2,499 or less | 0 (0.0%) | 0 (0.0%) |
| $2,500 to $4,999 | 0 (0.0%) | 0 (0.0%) |
| $5,000 to $7,499 | 0 (0.0%) | 0 (0.0%) |
| $7,500 to $9,999 | 0 (0.0%) | 0 (0.0%) |
| $10,000 to $12,499 | 0 (0.0%) | 0 (0.0%) |
| $12,500 to $14,999 | 0 (0.0%) | 0 (0.0%) |
| $15,000 to $17,499 | 0 (0.0%) | 0 (0.0%) |
| $17,500 to $19,999 | 0 (0.0%) | 0 (0.0%) |
| $20,000 to $22,499 | 0 (0.0%) | 0 (0.0%) |
| $22,500 to $24,999 | 0 (0.0%) | 0 (0.0%) |
| $25,000 to $29,999 | 0 (0.0%) | 0 (0.0%) |
| $30,000 to $34,999 | 0 (0.0%) | 0 (0.0%) |
| $35,000 to $39,999 | 0 (0.0%) | 0 (0.0%) |
| $40,000 to $44,999 | 0 (0.0%) | 0 (0.0%) |
| $45,000 to $49,999 | 18 (81.8%) | 3 (42.9%) |
| $50,000 to $54,999 | 0 (0.0%) | 0 (0.0%) |
| $55,000 to $64,999 | 0 (0.0%) | 4 (57.1%) |
| $65,000 to $74,999 | 0 (0.0%) | 0 (0.0%) |
| $75,000 to $99,999 | 0 (0.0%) | 0 (0.0%) |
| $100,000+ | 4 (18.2%) | 0 (0.0%) |
| Total | 22 (100.0%) | 7 (100.0%) |
Earnings by Sex by Educational Attainment in Vivian
| Educational Attainment | Male Income | Female Income |
| Less than High School | - | - |
| High School Diploma | - | - |
| College or Associate's Degree | - | - |
| Bachelor's Degree | - | - |
| Graduate Degree | - | - |
| Total | - | - |
Family Income in Vivian
Family Income Brackets in Vivian
According to the Vivian family income data, there are 10 families falling into the $50,000 to $74,999 income range, which is the most common income bracket and makes up 55.6% of all families.
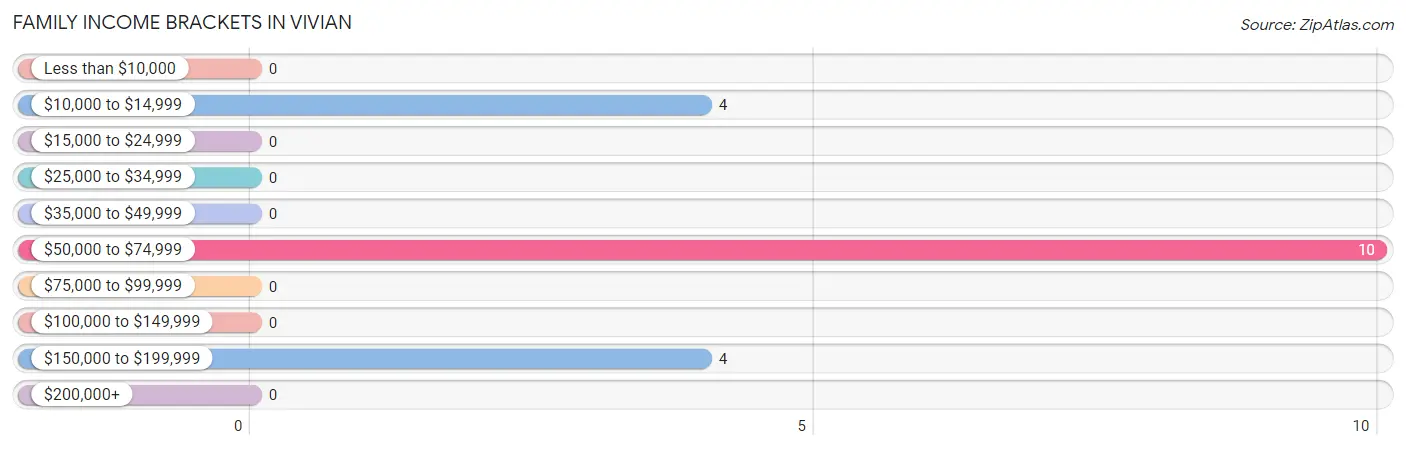
| Income Bracket | # Families | % Families |
| Less than $10,000 | 0 | 0.0% |
| $10,000 to $14,999 | 4 | 22.2% |
| $15,000 to $24,999 | 0 | 0.0% |
| $25,000 to $34,999 | 0 | 0.0% |
| $35,000 to $49,999 | 0 | 0.0% |
| $50,000 to $74,999 | 10 | 55.6% |
| $75,000 to $99,999 | 0 | 0.0% |
| $100,000 to $149,999 | 0 | 0.0% |
| $150,000 to $199,999 | 4 | 22.2% |
| $200,000+ | 0 | 0.0% |
Family Income by Famaliy Size in Vivian
| Income Bracket | # Families | Median Income |
| 2-Person Families | 18 (100.0%) | $0 |
| 3-Person Families | 0 (0.0%) | $0 |
| 4-Person Families | 0 (0.0%) | $0 |
| 5-Person Families | 0 (0.0%) | $0 |
| 6-Person Families | 0 (0.0%) | $0 |
| 7+ Person Families | 0 (0.0%) | $0 |
| Total | 18 (100.0%) | $0 |
Family Income by Number of Earners in Vivian
| Number of Earners | # Families | Median Income |
| No Earners | 4 (22.2%) | $0 |
| 1 Earner | 10 (55.6%) | $0 |
| 2 Earners | 4 (22.2%) | $0 |
| 3+ Earners | 0 (0.0%) | $0 |
| Total | 18 (100.0%) | $0 |
Household Income in Vivian
Household Income Brackets in Vivian
With 10 households falling in the category, the $50,000 to $74,999 income range is the most frequent in Vivian, accounting for 41.7% of all households.
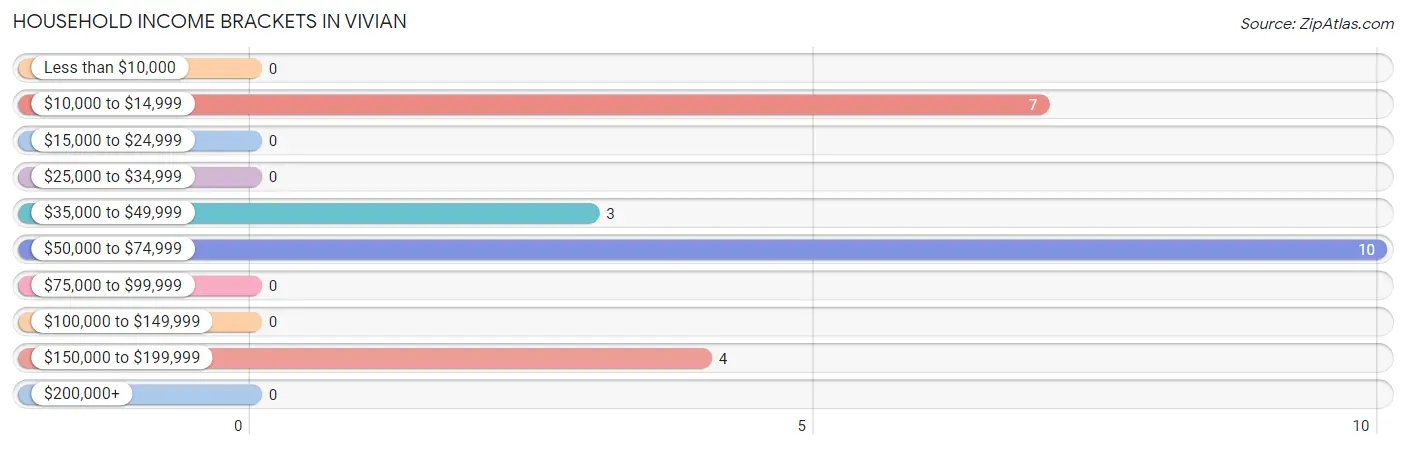
| Income Bracket | # Households | % Households |
| Less than $10,000 | 0 | 0.0% |
| $10,000 to $14,999 | 7 | 29.2% |
| $15,000 to $24,999 | 0 | 0.0% |
| $25,000 to $34,999 | 0 | 0.0% |
| $35,000 to $49,999 | 3 | 12.5% |
| $50,000 to $74,999 | 10 | 41.7% |
| $75,000 to $99,999 | 0 | 0.0% |
| $100,000 to $149,999 | 0 | 0.0% |
| $150,000 to $199,999 | 4 | 16.7% |
| $200,000+ | 0 | 0.0% |
Household Income by Householder Age in Vivian
| Income Bracket | # Households | Median Income |
| 15 to 24 Years | 0 (0.0%) | $0 |
| 25 to 44 Years | 3 (12.5%) | $0 |
| 45 to 64 Years | 14 (58.3%) | $0 |
| 65+ Years | 7 (29.2%) | $0 |
| Total | 24 (100.0%) | $55,500 |
Poverty in Vivian
Income Below Poverty by Sex and Age in Vivian
With 15.4% poverty level for males and 29.2% for females among the residents of Vivian, 75 year old and over males and 75 year old and over females are the most vulnerable to poverty, with 4 males (100.0%) and 7 females (100.0%) in their respective age groups living below the poverty level.
| Age Bracket | Male | Female |
| Under 5 Years | 0 (0.0%) | 0 (0.0%) |
| 5 Years | 0 (0.0%) | 0 (0.0%) |
| 6 to 11 Years | 0 (0.0%) | 0 (0.0%) |
| 12 to 14 Years | 0 (0.0%) | 0 (0.0%) |
| 15 Years | 0 (0.0%) | 0 (0.0%) |
| 16 and 17 Years | 0 (0.0%) | 0 (0.0%) |
| 18 to 24 Years | 0 (0.0%) | 0 (0.0%) |
| 25 to 34 Years | 0 (0.0%) | 0 (0.0%) |
| 35 to 44 Years | 0 (0.0%) | 0 (0.0%) |
| 45 to 54 Years | 0 (0.0%) | 0 (0.0%) |
| 55 to 64 Years | 0 (0.0%) | 0 (0.0%) |
| 65 to 74 Years | 0 (0.0%) | 0 (0.0%) |
| 75 Years and over | 4 (100.0%) | 7 (100.0%) |
| Total | 4 (15.4%) | 7 (29.2%) |
Income Above Poverty by Sex and Age in Vivian
According to the poverty statistics in Vivian, males aged 55 to 64 years and females aged 25 to 34 years are the age groups that are most secure financially, with 100.0% of males and 100.0% of females in these age groups living above the poverty line.
| Age Bracket | Male | Female |
| Under 5 Years | 0 (0.0%) | 0 (0.0%) |
| 5 Years | 0 (0.0%) | 0 (0.0%) |
| 6 to 11 Years | 0 (0.0%) | 0 (0.0%) |
| 12 to 14 Years | 0 (0.0%) | 0 (0.0%) |
| 15 Years | 0 (0.0%) | 0 (0.0%) |
| 16 and 17 Years | 0 (0.0%) | 0 (0.0%) |
| 18 to 24 Years | 0 (0.0%) | 0 (0.0%) |
| 25 to 34 Years | 0 (0.0%) | 3 (100.0%) |
| 35 to 44 Years | 0 (0.0%) | 0 (0.0%) |
| 45 to 54 Years | 0 (0.0%) | 10 (100.0%) |
| 55 to 64 Years | 22 (100.0%) | 4 (100.0%) |
| 65 to 74 Years | 0 (0.0%) | 0 (0.0%) |
| 75 Years and over | 0 (0.0%) | 0 (0.0%) |
| Total | 22 (84.6%) | 17 (70.8%) |
Income Below Poverty Among Married-Couple Families in Vivian
The poverty statistics for married-couple families in Vivian show that 22.2% or 4 of the total 18 families live below the poverty line. Families with no children have the highest poverty rate of 22.2%, comprising of 4 families. On the other hand, families with no children have the lowest poverty rate of 22.2%, which includes 4 families.
| Children | Above Poverty | Below Poverty |
| No Children | 14 (77.8%) | 4 (22.2%) |
| 1 or 2 Children | 0 (0.0%) | 0 (0.0%) |
| 3 or 4 Children | 0 (0.0%) | 0 (0.0%) |
| 5 or more Children | 0 (0.0%) | 0 (0.0%) |
| Total | 14 (77.8%) | 4 (22.2%) |
Income Below Poverty Among Single-Parent Households in Vivian
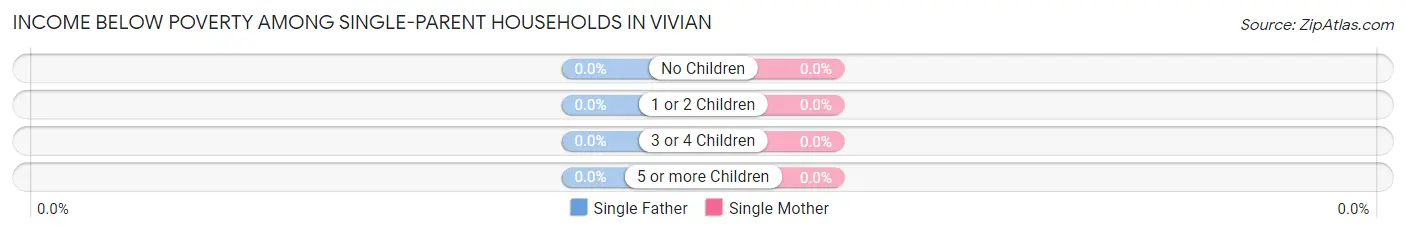
| Children | Single Father | Single Mother |
| No Children | 0 (0.0%) | 0 (0.0%) |
| 1 or 2 Children | 0 (0.0%) | 0 (0.0%) |
| 3 or 4 Children | 0 (0.0%) | 0 (0.0%) |
| 5 or more Children | 0 (0.0%) | 0 (0.0%) |
| Total | 0 (0.0%) | 0 (0.0%) |
Income Below Poverty Among Married-Couple vs Single-Parent Households in Vivian
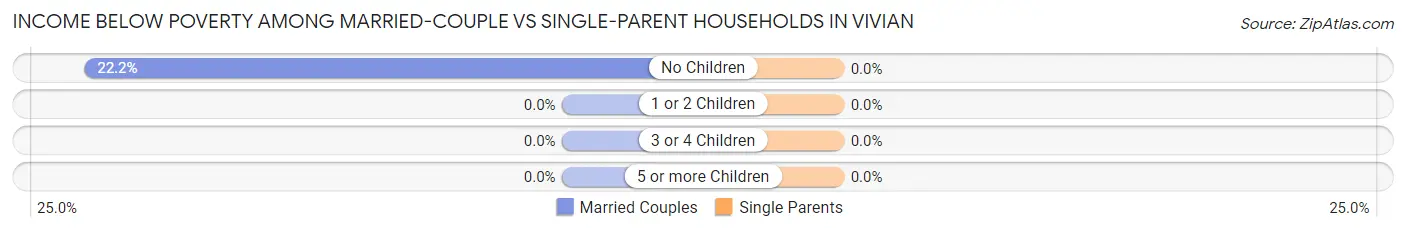
| Children | Married-Couple Families | Single-Parent Households |
| No Children | 4 (22.2%) | 0 (0.0%) |
| 1 or 2 Children | 0 (0.0%) | 0 (0.0%) |
| 3 or 4 Children | 0 (0.0%) | 0 (0.0%) |
| 5 or more Children | 0 (0.0%) | 0 (0.0%) |
| Total | 4 (22.2%) | 0 (0.0%) |
Race in Vivian
The most populous races in Vivian are , and White / Caucasian (50 | 100.0%).
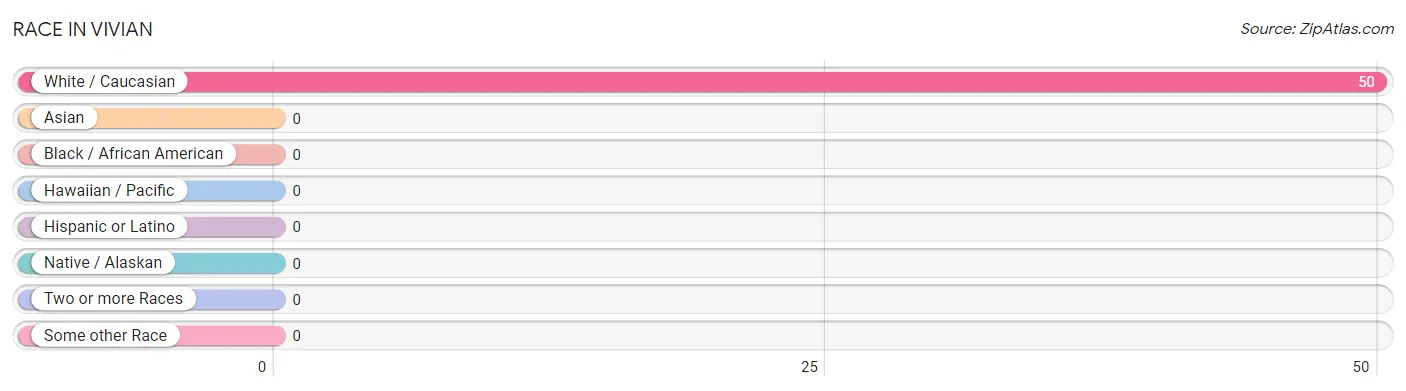
| Race | # Population | % Population |
| Asian | 0 | 0.0% |
| Black / African American | 0 | 0.0% |
| Hawaiian / Pacific | 0 | 0.0% |
| Hispanic or Latino | 0 | 0.0% |
| Native / Alaskan | 0 | 0.0% |
| White / Caucasian | 50 | 100.0% |
| Two or more Races | 0 | 0.0% |
| Some other Race | 0 | 0.0% |
| Total | 50 | 100.0% |
Ancestry in Vivian
The most populous ancestries reported in Vivian are German (7 | 14.0%), Irish (4 | 8.0%), Norwegian (4 | 8.0%), and Scandinavian (4 | 8.0%), together accounting for 38.0% of all Vivian residents.
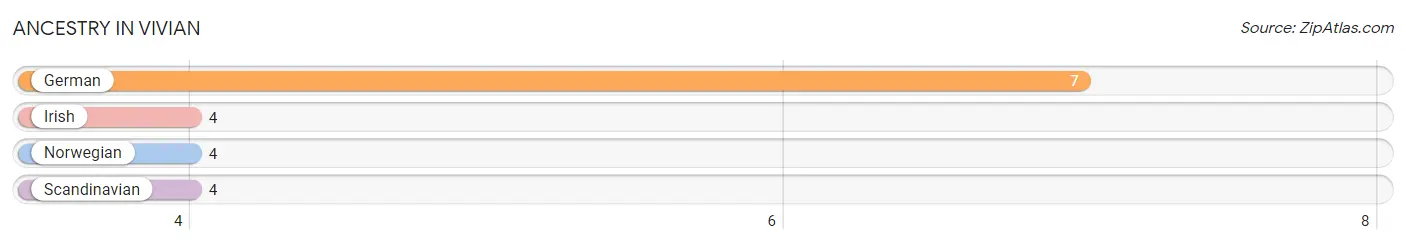
| Ancestry | # Population | % Population |
| German | 7 | 14.0% |
| Irish | 4 | 8.0% |
| Norwegian | 4 | 8.0% |
| Scandinavian | 4 | 8.0% | View All 4 Rows |
Immigrants in Vivian

| Immigration Origin | # Population | % Population | View All 0 Rows |
Sex and Age in Vivian
Sex and Age in Vivian
The most populous age groups in Vivian are 60 to 64 Years (22 | 84.6%) for men and 50 to 54 Years (10 | 41.7%) for women.
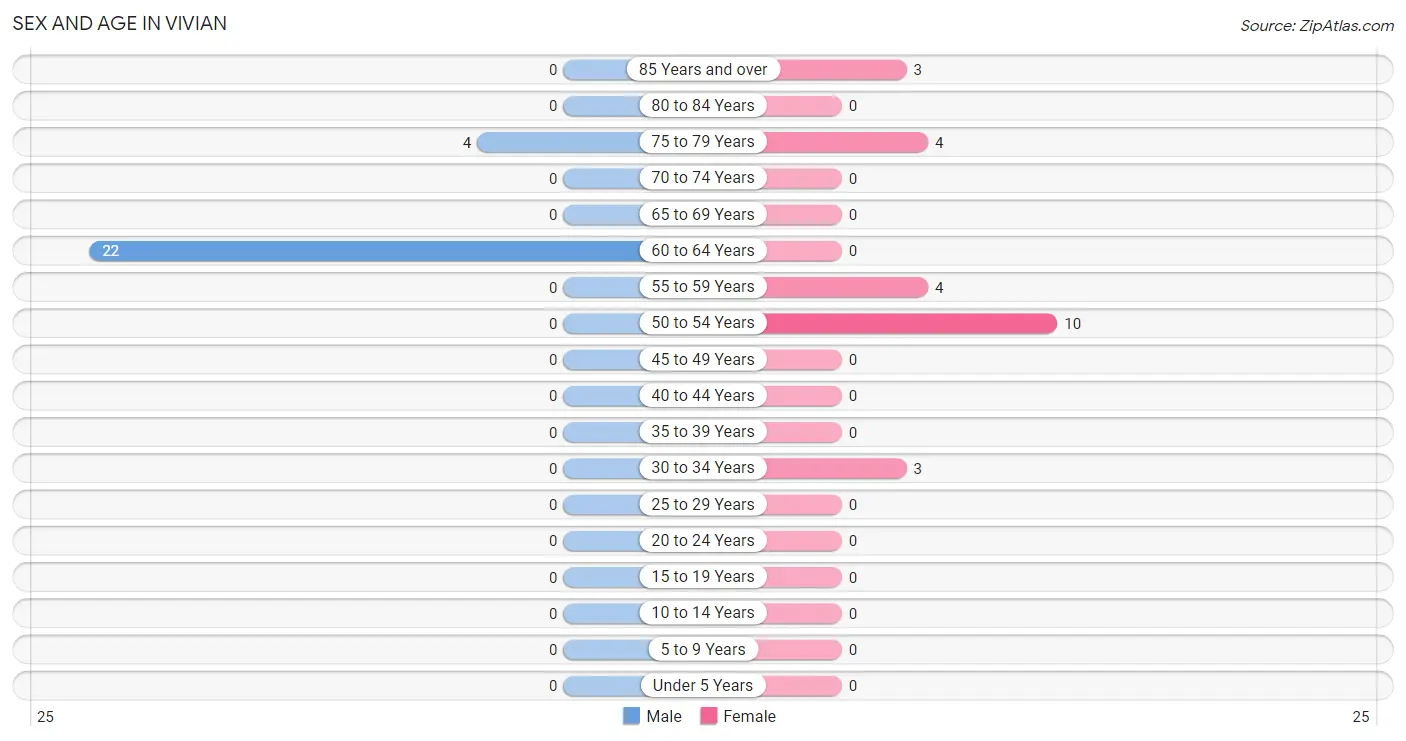
| Age Bracket | Male | Female |
| Under 5 Years | 0 (0.0%) | 0 (0.0%) |
| 5 to 9 Years | 0 (0.0%) | 0 (0.0%) |
| 10 to 14 Years | 0 (0.0%) | 0 (0.0%) |
| 15 to 19 Years | 0 (0.0%) | 0 (0.0%) |
| 20 to 24 Years | 0 (0.0%) | 0 (0.0%) |
| 25 to 29 Years | 0 (0.0%) | 0 (0.0%) |
| 30 to 34 Years | 0 (0.0%) | 3 (12.5%) |
| 35 to 39 Years | 0 (0.0%) | 0 (0.0%) |
| 40 to 44 Years | 0 (0.0%) | 0 (0.0%) |
| 45 to 49 Years | 0 (0.0%) | 0 (0.0%) |
| 50 to 54 Years | 0 (0.0%) | 10 (41.7%) |
| 55 to 59 Years | 0 (0.0%) | 4 (16.7%) |
| 60 to 64 Years | 22 (84.6%) | 0 (0.0%) |
| 65 to 69 Years | 0 (0.0%) | 0 (0.0%) |
| 70 to 74 Years | 0 (0.0%) | 0 (0.0%) |
| 75 to 79 Years | 4 (15.4%) | 4 (16.7%) |
| 80 to 84 Years | 0 (0.0%) | 0 (0.0%) |
| 85 Years and over | 0 (0.0%) | 3 (12.5%) |
| Total | 26 (100.0%) | 24 (100.0%) |
Families and Households in Vivian
Median Family Size in Vivian
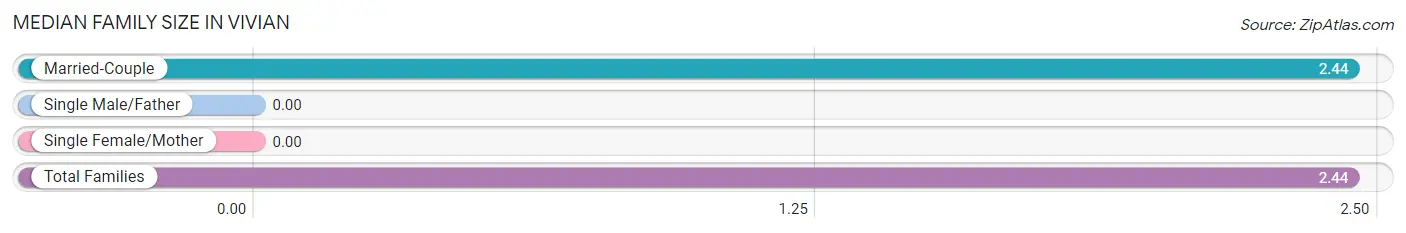
| Family Type | # Families | Family Size |
| Married-Couple | 18 (100.0%) | 2.44 |
| Single Male/Father | 0 (0.0%) | - |
| Single Female/Mother | 0 (0.0%) | - |
| Total Families | 18 (100.0%) | 2.44 |
Median Household Size in Vivian
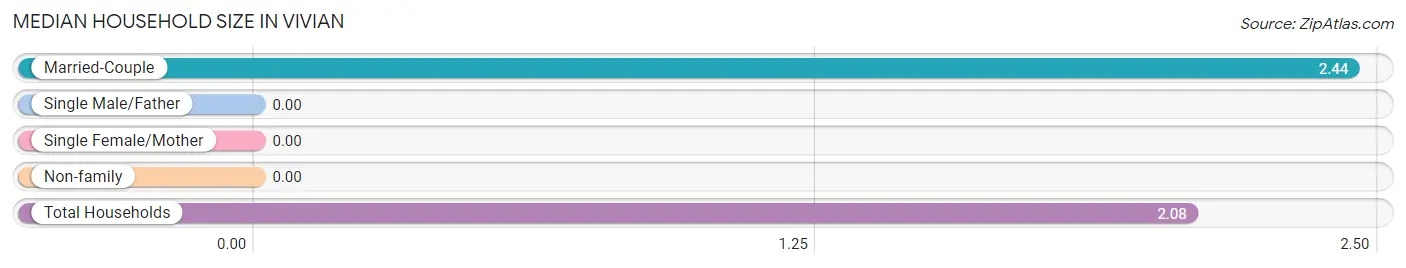
| Household Type | # Households | Household Size |
| Married-Couple | 18 (75.0%) | 2.44 |
| Single Male/Father | 0 (0.0%) | - |
| Single Female/Mother | 0 (0.0%) | - |
| Non-family | 6 (25.0%) | - |
| Total Households | 24 (100.0%) | 2.08 |
Household Size by Marriage Status in Vivian
Out of a total of 24 households in Vivian, 18 (75.0%) are family households, while 6 (25.0%) are nonfamily households. The most numerous type of family households are 2-person households, comprising 18, and the most common type of nonfamily households are 1-person households, comprising 6.
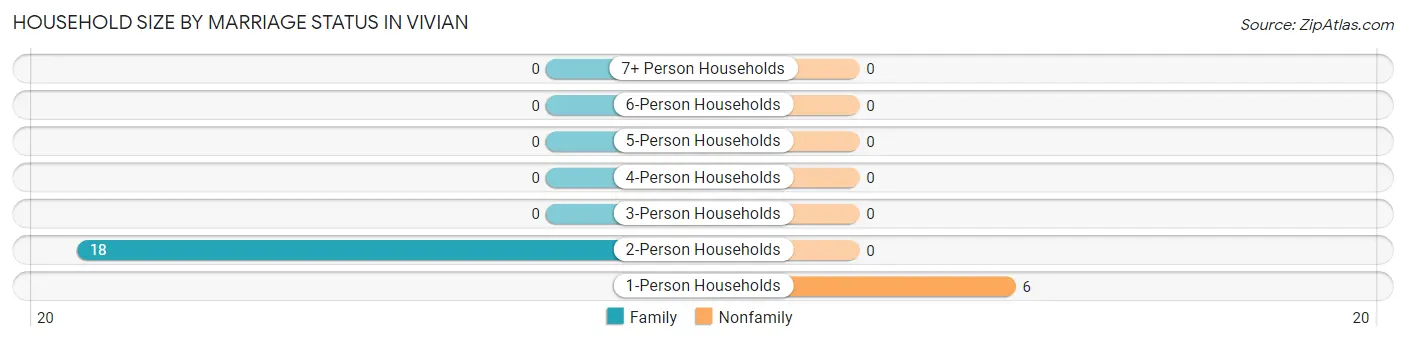
| Household Size | Family Households | Nonfamily Households |
| 1-Person Households | - | 6 (25.0%) |
| 2-Person Households | 18 (75.0%) | 0 (0.0%) |
| 3-Person Households | 0 (0.0%) | 0 (0.0%) |
| 4-Person Households | 0 (0.0%) | 0 (0.0%) |
| 5-Person Households | 0 (0.0%) | 0 (0.0%) |
| 6-Person Households | 0 (0.0%) | 0 (0.0%) |
| 7+ Person Households | 0 (0.0%) | 0 (0.0%) |
| Total | 18 (75.0%) | 6 (25.0%) |
Female Fertility in Vivian
Fertility by Age in Vivian
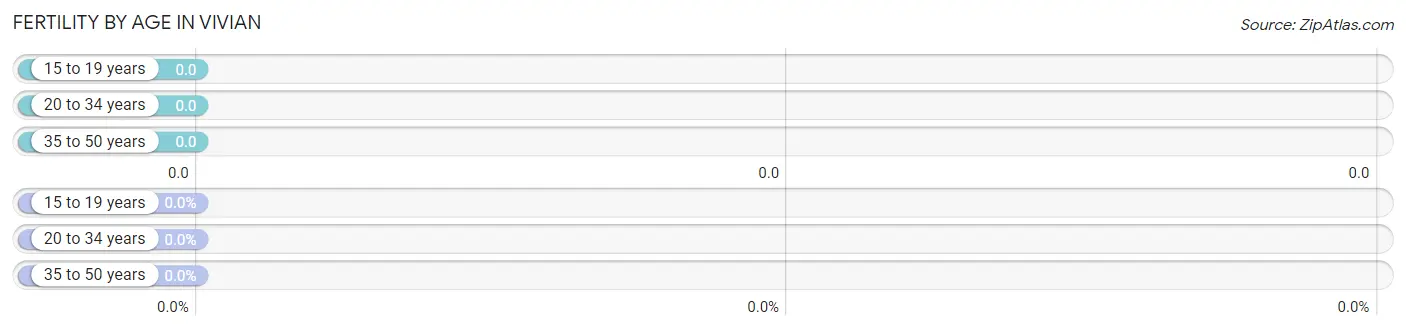
| Age Bracket | Women with Births | Births / 1,000 Women |
| 15 to 19 years | 0 (0.0%) | 0.0 |
| 20 to 34 years | 0 (0.0%) | 0.0 |
| 35 to 50 years | 0 (0.0%) | 0.0 |
| Total | 0 (0.0%) | 0.0 |
Fertility by Age by Marriage Status in Vivian
| Age Bracket | Married | Unmarried |
| 15 to 19 years | 0 (0.0%) | 0 (0.0%) |
| 20 to 34 years | 0 (0.0%) | 0 (0.0%) |
| 35 to 50 years | 0 (0.0%) | 0 (0.0%) |
| Total | 0 (0.0%) | 0 (0.0%) |
Fertility by Education in Vivian
| Educational Attainment | Women with Births | Births / 1,000 Women |
| Less than High School | 0 (0.0%) | 0.0 |
| High School Diploma | 0 (0.0%) | 0.0 |
| College or Associate's Degree | 0 (0.0%) | 0.0 |
| Bachelor's Degree | 0 (0.0%) | 0.0 |
| Graduate Degree | 0 (0.0%) | 0.0 |
| Total | 0 (0.0%) | 0.0 |
Fertility by Education by Marriage Status in Vivian
| Educational Attainment | Married | Unmarried |
| Less than High School | 0 (0.0%) | 0 (0.0%) |
| High School Diploma | 0 (0.0%) | 0 (0.0%) |
| College or Associate's Degree | 0 (0.0%) | 0 (0.0%) |
| Bachelor's Degree | 0 (0.0%) | 0 (0.0%) |
| Graduate Degree | 0 (0.0%) | 0 (0.0%) |
| Total | 0 (0.0%) | 0 (0.0%) |
Employment Characteristics in Vivian
Employment by Class of Employer in Vivian
Among the 29 employed individuals in Vivian, private company employees (22 | 75.9%), self-employed (not incorporated) (4 | 13.8%), and local government employees (3 | 10.3%) make up the most common classes of employment.
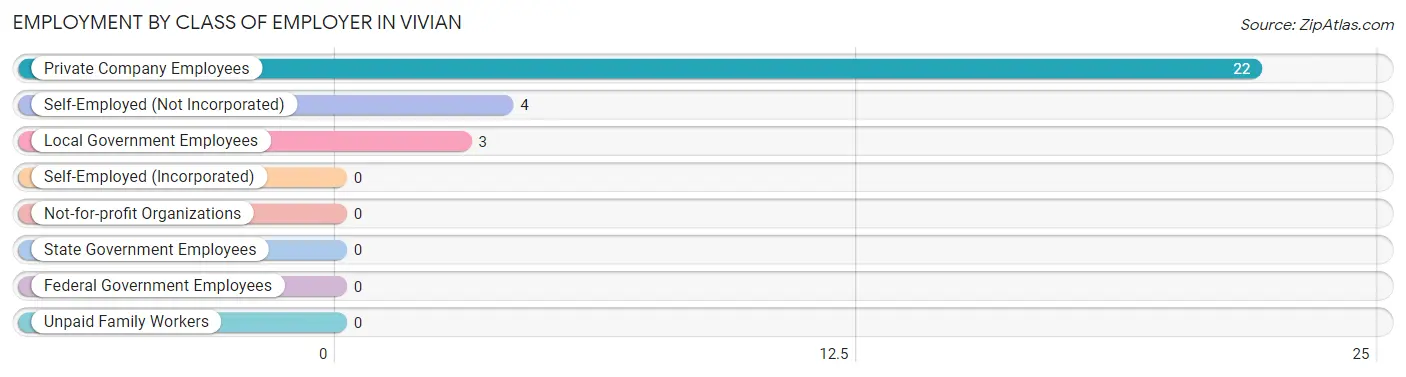
| Employer Class | # Employees | % Employees |
| Private Company Employees | 22 | 75.9% |
| Self-Employed (Incorporated) | 0 | 0.0% |
| Self-Employed (Not Incorporated) | 4 | 13.8% |
| Not-for-profit Organizations | 0 | 0.0% |
| Local Government Employees | 3 | 10.3% |
| State Government Employees | 0 | 0.0% |
| Federal Government Employees | 0 | 0.0% |
| Unpaid Family Workers | 0 | 0.0% |
| Total | 29 | 100.0% |
Employment Status by Age in Vivian
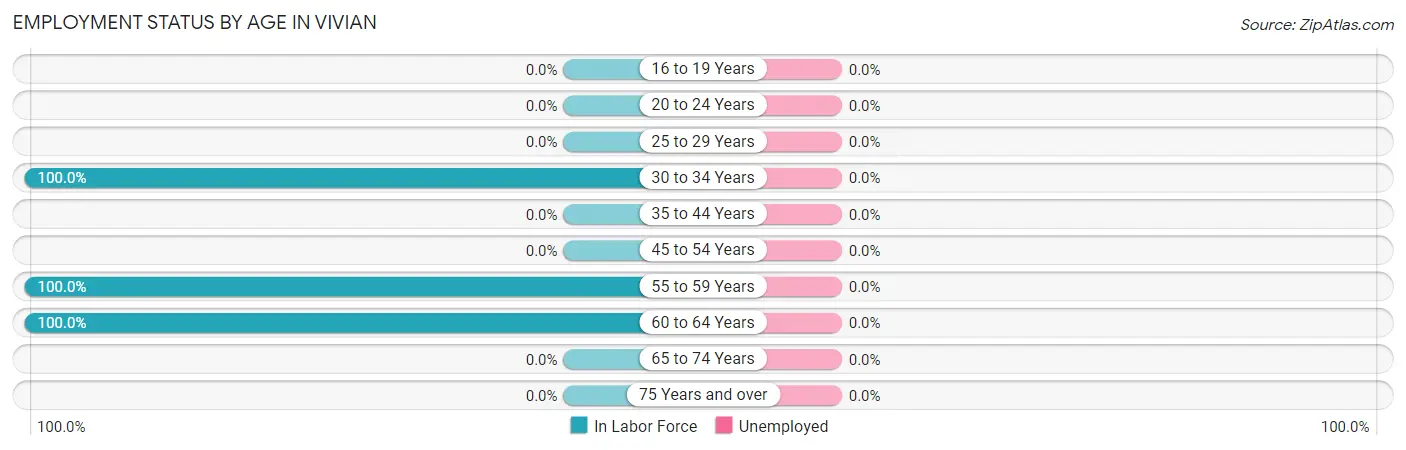
| Age Bracket | In Labor Force | Unemployed |
| 16 to 19 Years | 0 (0.0%) | 0 (0.0%) |
| 20 to 24 Years | 0 (0.0%) | 0 (0.0%) |
| 25 to 29 Years | 0 (0.0%) | 0 (0.0%) |
| 30 to 34 Years | 3 (100.0%) | 0 (0.0%) |
| 35 to 44 Years | 0 (0.0%) | 0 (0.0%) |
| 45 to 54 Years | 0 (0.0%) | 0 (0.0%) |
| 55 to 59 Years | 4 (100.0%) | 0 (0.0%) |
| 60 to 64 Years | 22 (100.0%) | 0 (0.0%) |
| 65 to 74 Years | 0 (0.0%) | 0 (0.0%) |
| 75 Years and over | 0 (0.0%) | 0 (0.0%) |
| Total | 29 (58.0%) | 0 (0.0%) |
Employment Status by Educational Attainment in Vivian
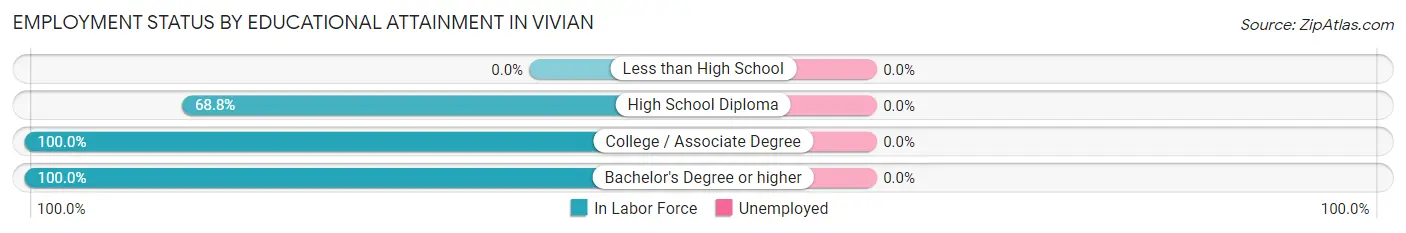
| Educational Attainment | In Labor Force | Unemployed |
| Less than High School | 0 (0.0%) | 0 (0.0%) |
| High School Diploma | 22 (68.8%) | 0 (0.0%) |
| College / Associate Degree | 4 (100.0%) | 0 (0.0%) |
| Bachelor's Degree or higher | 3 (100.0%) | 0 (0.0%) |
| Total | 29 (74.4%) | 0 (0.0%) |
Employment Occupations by Sex in Vivian
Management, Business, Science and Arts Occupations
The most common Management, Business, Science and Arts occupations in Vivian are Community & Social Service (3 | 10.3%), and Education Instruction & Library (3 | 10.3%).
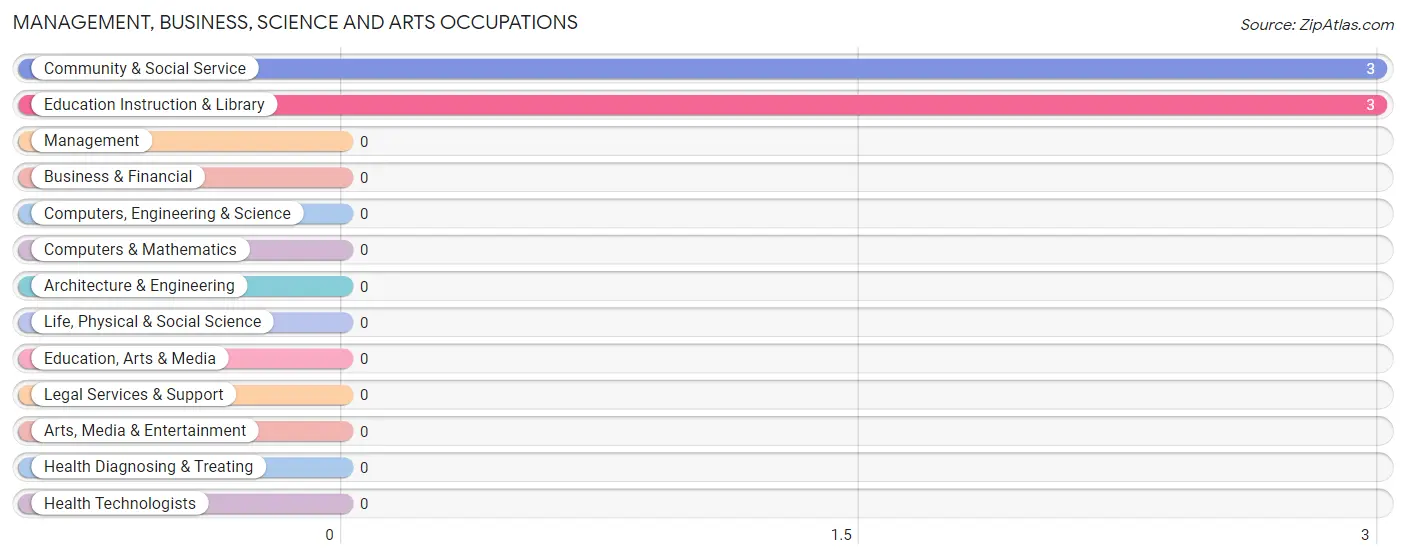
Management, Business, Science and Arts Occupations by Sex
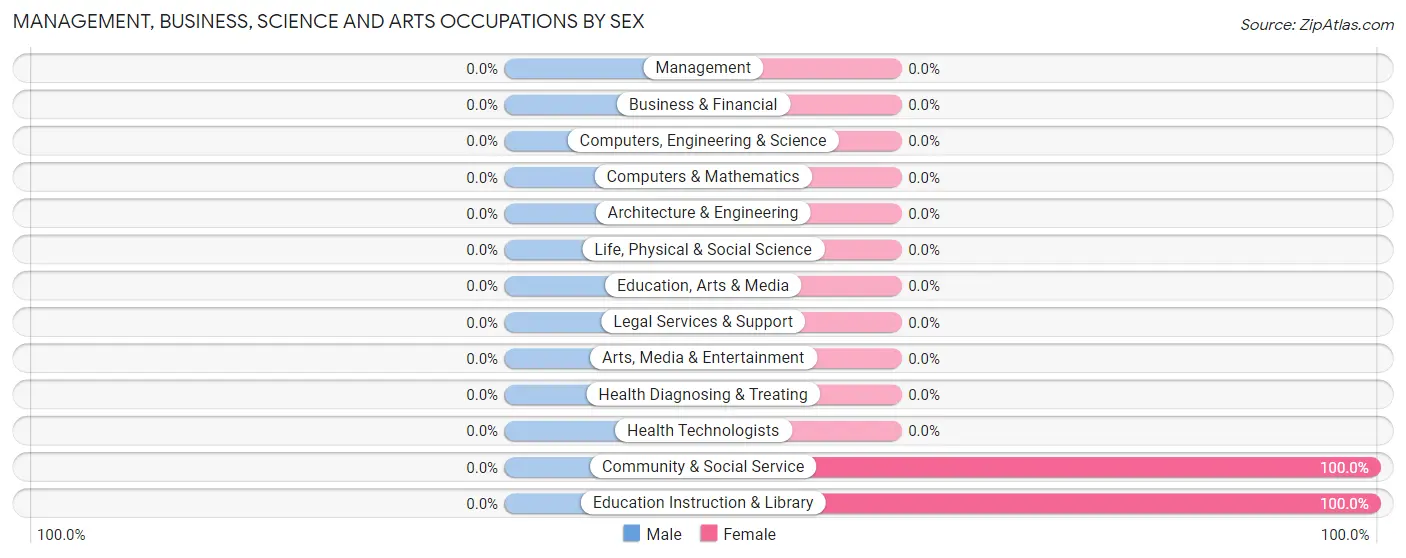
| Occupation | Male | Female |
| Management | 0 (0.0%) | 0 (0.0%) |
| Business & Financial | 0 (0.0%) | 0 (0.0%) |
| Computers, Engineering & Science | 0 (0.0%) | 0 (0.0%) |
| Computers & Mathematics | 0 (0.0%) | 0 (0.0%) |
| Architecture & Engineering | 0 (0.0%) | 0 (0.0%) |
| Life, Physical & Social Science | 0 (0.0%) | 0 (0.0%) |
| Community & Social Service | 0 (0.0%) | 3 (100.0%) |
| Education, Arts & Media | 0 (0.0%) | 0 (0.0%) |
| Legal Services & Support | 0 (0.0%) | 0 (0.0%) |
| Education Instruction & Library | 0 (0.0%) | 3 (100.0%) |
| Arts, Media & Entertainment | 0 (0.0%) | 0 (0.0%) |
| Health Diagnosing & Treating | 0 (0.0%) | 0 (0.0%) |
| Health Technologists | 0 (0.0%) | 0 (0.0%) |
| Total (Category) | 0 (0.0%) | 3 (100.0%) |
| Total (Overall) | 22 (75.9%) | 7 (24.1%) |
Services Occupations
Services Occupations by Sex
| Occupation | Male | Female |
| Healthcare Support | 0 (0.0%) | 0 (0.0%) |
| Security & Protection | 0 (0.0%) | 0 (0.0%) |
| Firefighting & Prevention | 0 (0.0%) | 0 (0.0%) |
| Law Enforcement | 0 (0.0%) | 0 (0.0%) |
| Food Preparation & Serving | 0 (0.0%) | 0 (0.0%) |
| Cleaning & Maintenance | 0 (0.0%) | 0 (0.0%) |
| Personal Care & Service | 0 (0.0%) | 0 (0.0%) |
| Total (Category) | 0 (0.0%) | 0 (0.0%) |
| Total (Overall) | 22 (75.9%) | 7 (24.1%) |
Sales and Office Occupations
The most common Sales and Office occupations in Vivian are , and Sales & Related (4 | 13.8%).
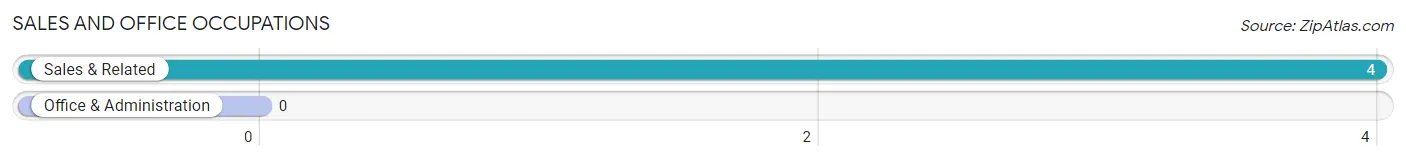
Sales and Office Occupations by Sex
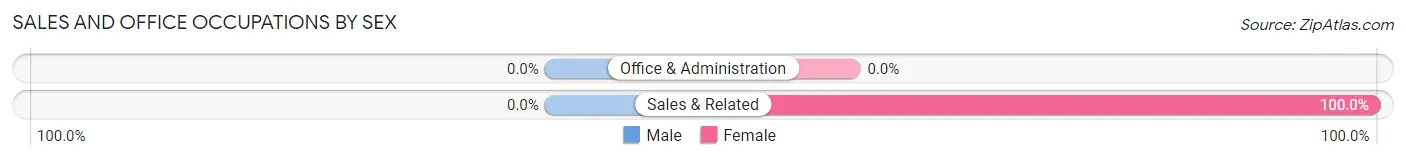
| Occupation | Male | Female |
| Sales & Related | 0 (0.0%) | 4 (100.0%) |
| Office & Administration | 0 (0.0%) | 0 (0.0%) |
| Total (Category) | 0 (0.0%) | 4 (100.0%) |
| Total (Overall) | 22 (75.9%) | 7 (24.1%) |
Natural Resources, Construction and Maintenance Occupations
The most common Natural Resources, Construction and Maintenance occupations in Vivian are , and Construction & Extraction (18 | 62.1%).
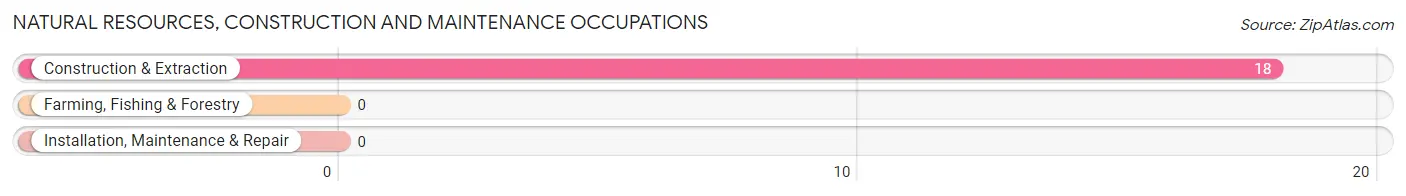
Natural Resources, Construction and Maintenance Occupations by Sex
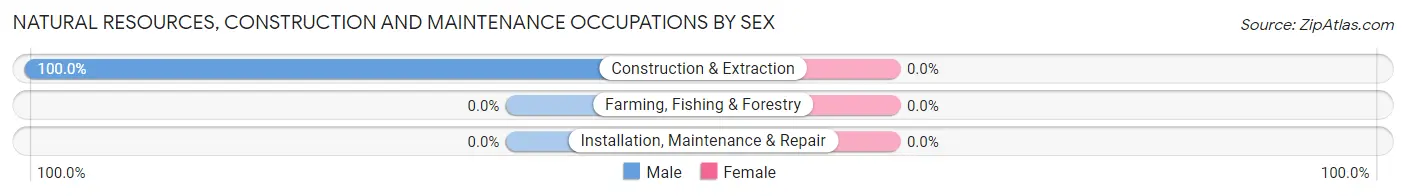
| Occupation | Male | Female |
| Farming, Fishing & Forestry | 0 (0.0%) | 0 (0.0%) |
| Construction & Extraction | 18 (100.0%) | 0 (0.0%) |
| Installation, Maintenance & Repair | 0 (0.0%) | 0 (0.0%) |
| Total (Category) | 18 (100.0%) | 0 (0.0%) |
| Total (Overall) | 22 (75.9%) | 7 (24.1%) |
Production, Transportation and Moving Occupations
The most common Production, Transportation and Moving occupations in Vivian are , and Transportation (4 | 13.8%).
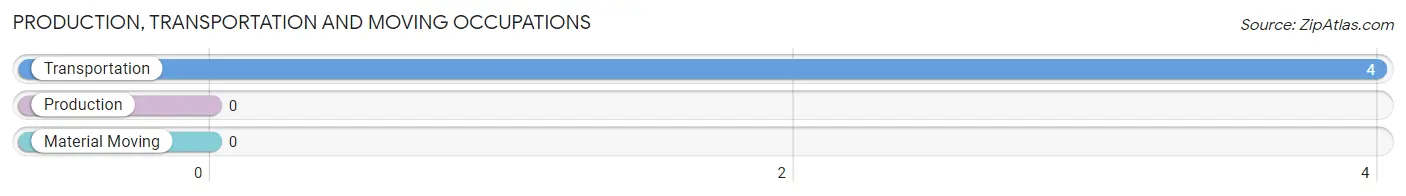
Production, Transportation and Moving Occupations by Sex
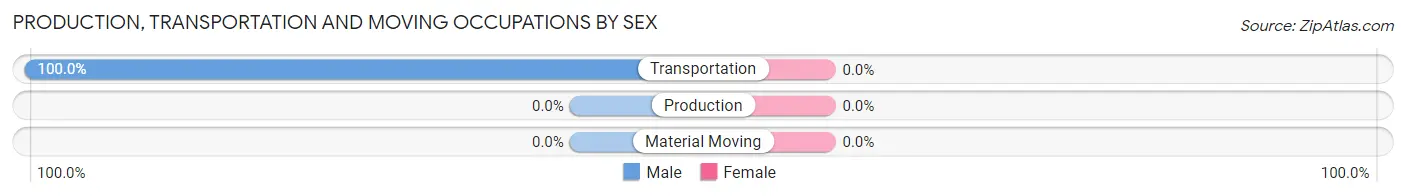
| Occupation | Male | Female |
| Production | 0 (0.0%) | 0 (0.0%) |
| Transportation | 4 (100.0%) | 0 (0.0%) |
| Material Moving | 0 (0.0%) | 0 (0.0%) |
| Total (Category) | 4 (100.0%) | 0 (0.0%) |
| Total (Overall) | 22 (75.9%) | 7 (24.1%) |
Employment Industries by Sex in Vivian
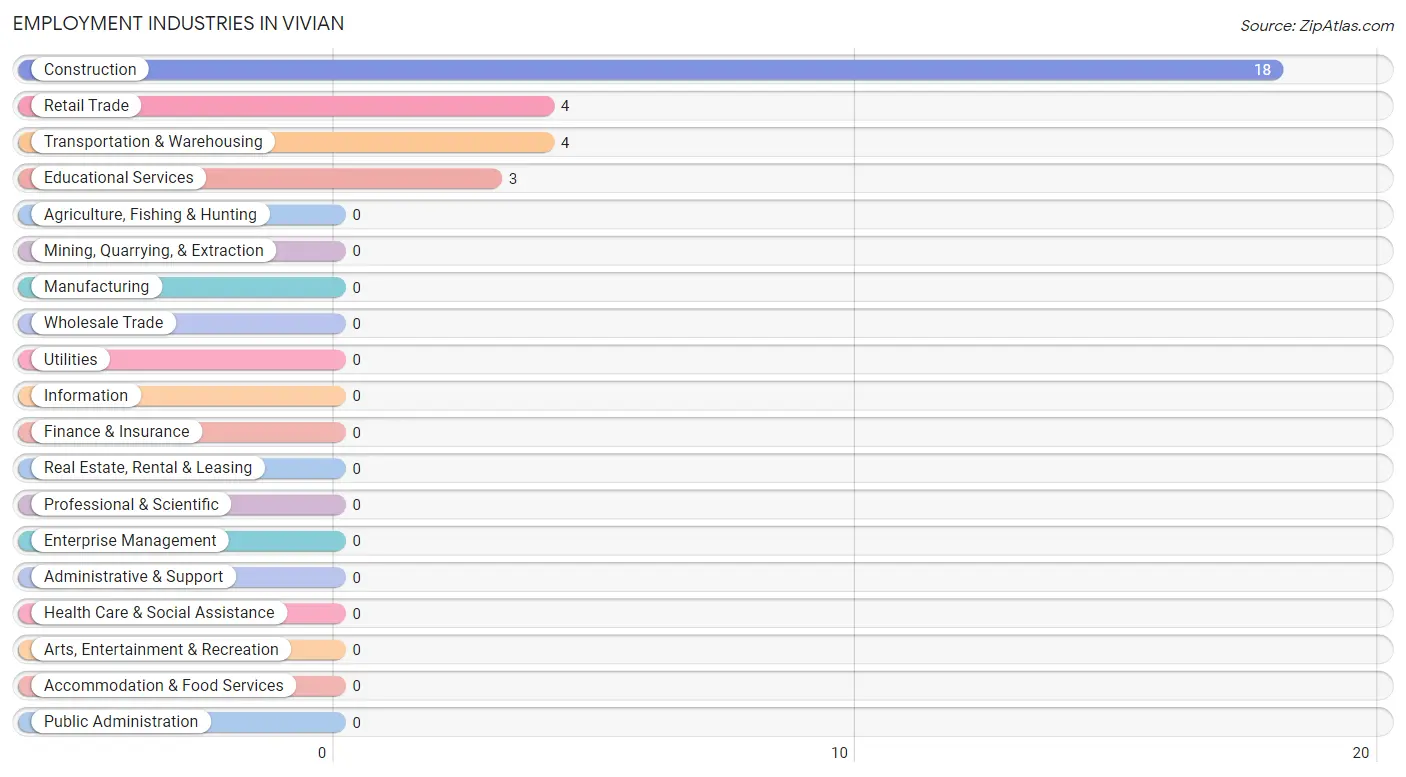
Employment Industries in Vivian
The major employment industries in Vivian include Construction (18 | 62.1%), Retail Trade (4 | 13.8%), Transportation & Warehousing (4 | 13.8%), and Educational Services (3 | 10.3%).
Employment Industries by Sex in Vivian
The Vivian industries that see more men than women are Construction (100.0%), and Transportation & Warehousing (100.0%), whereas the industries that tend to have a higher number of women are Retail Trade (100.0%), and Educational Services (100.0%).
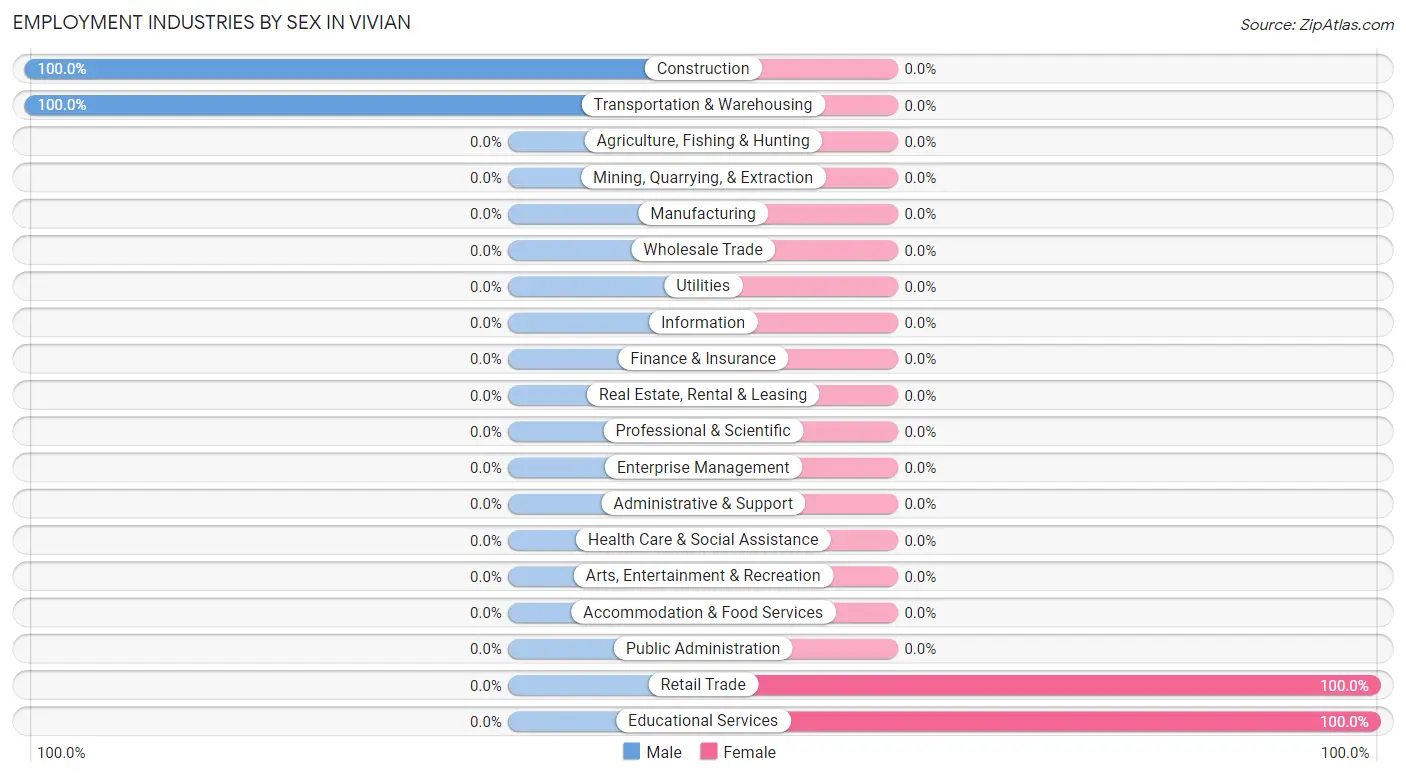
| Industry | Male | Female |
| Agriculture, Fishing & Hunting | 0 (0.0%) | 0 (0.0%) |
| Mining, Quarrying, & Extraction | 0 (0.0%) | 0 (0.0%) |
| Construction | 18 (100.0%) | 0 (0.0%) |
| Manufacturing | 0 (0.0%) | 0 (0.0%) |
| Wholesale Trade | 0 (0.0%) | 0 (0.0%) |
| Retail Trade | 0 (0.0%) | 4 (100.0%) |
| Transportation & Warehousing | 4 (100.0%) | 0 (0.0%) |
| Utilities | 0 (0.0%) | 0 (0.0%) |
| Information | 0 (0.0%) | 0 (0.0%) |
| Finance & Insurance | 0 (0.0%) | 0 (0.0%) |
| Real Estate, Rental & Leasing | 0 (0.0%) | 0 (0.0%) |
| Professional & Scientific | 0 (0.0%) | 0 (0.0%) |
| Enterprise Management | 0 (0.0%) | 0 (0.0%) |
| Administrative & Support | 0 (0.0%) | 0 (0.0%) |
| Educational Services | 0 (0.0%) | 3 (100.0%) |
| Health Care & Social Assistance | 0 (0.0%) | 0 (0.0%) |
| Arts, Entertainment & Recreation | 0 (0.0%) | 0 (0.0%) |
| Accommodation & Food Services | 0 (0.0%) | 0 (0.0%) |
| Public Administration | 0 (0.0%) | 0 (0.0%) |
| Total | 22 (75.9%) | 7 (24.1%) |
Education in Vivian
School Enrollment in Vivian
| School Level | # Students | % Students |
| Nursery / Preschool | 0 | 0.0% |
| Kindergarten | 0 | 0.0% |
| Elementary School | 0 | 0.0% |
| Middle School | 0 | 0.0% |
| High School | 0 | 0.0% |
| College / Undergraduate | 0 | 0.0% |
| Graduate / Professional | 0 | 0.0% |
| Total | 0 | 0.0% |
School Enrollment by Age by Funding Source in Vivian
| Age Bracket | Public School | Private School |
| 3 to 4 Year Olds | 0 (0.0%) | 0 (0.0%) |
| 5 to 9 Year Old | 0 (0.0%) | 0 (0.0%) |
| 10 to 14 Year Olds | 0 (0.0%) | 0 (0.0%) |
| 15 to 17 Year Olds | 0 (0.0%) | 0 (0.0%) |
| 18 to 19 Year Olds | 0 (0.0%) | 0 (0.0%) |
| 20 to 24 Year Olds | 0 (0.0%) | 0 (0.0%) |
| 25 to 34 Year Olds | 0 (0.0%) | 0 (0.0%) |
| 35 Years and over | 0 (0.0%) | 0 (0.0%) |
| Total | 0 (0.0%) | 0 (0.0%) |
Educational Attainment by Field of Study in Vivian
Education (7 | 70.0%), and science & technology (3 | 30.0%) are the most common fields of study among 10 individuals in Vivian who have obtained a bachelor's degree or higher.
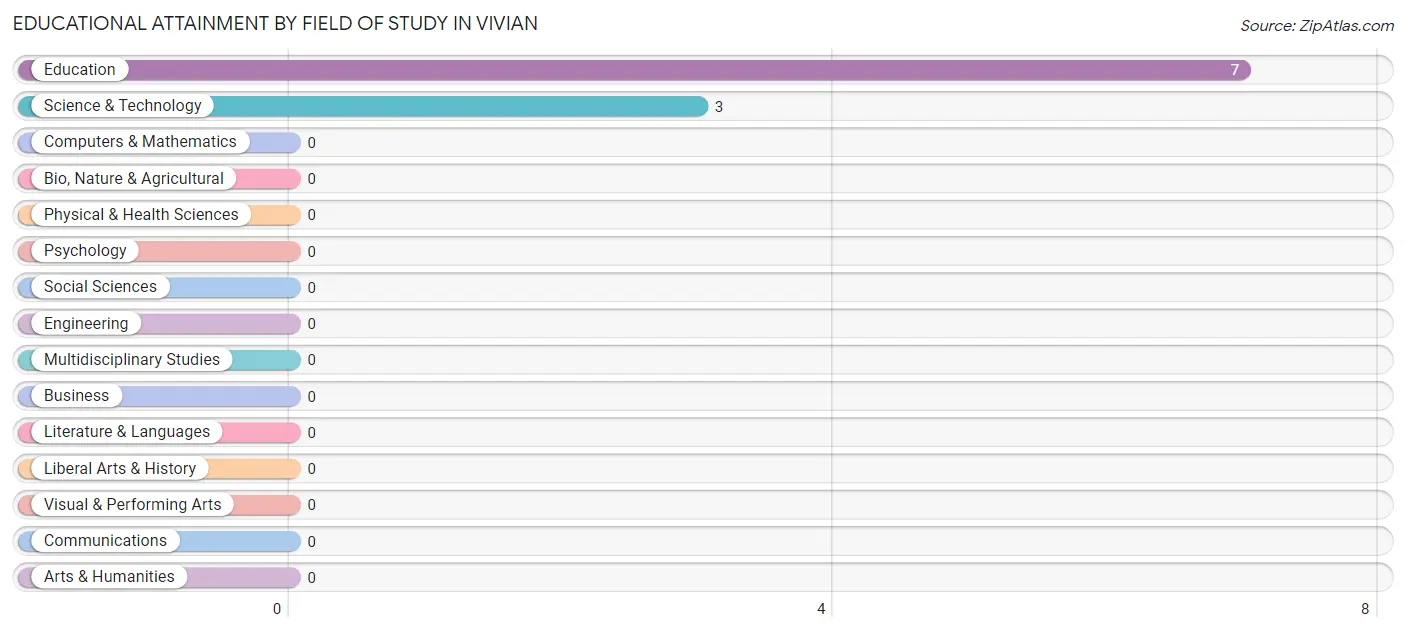
| Field of Study | # Graduates | % Graduates |
| Computers & Mathematics | 0 | 0.0% |
| Bio, Nature & Agricultural | 0 | 0.0% |
| Physical & Health Sciences | 0 | 0.0% |
| Psychology | 0 | 0.0% |
| Social Sciences | 0 | 0.0% |
| Engineering | 0 | 0.0% |
| Multidisciplinary Studies | 0 | 0.0% |
| Science & Technology | 3 | 30.0% |
| Business | 0 | 0.0% |
| Education | 7 | 70.0% |
| Literature & Languages | 0 | 0.0% |
| Liberal Arts & History | 0 | 0.0% |
| Visual & Performing Arts | 0 | 0.0% |
| Communications | 0 | 0.0% |
| Arts & Humanities | 0 | 0.0% |
| Total | 10 | 100.0% |
Transportation & Commute in Vivian
Vehicle Availability by Sex in Vivian
The most prevalent vehicle ownership categories in Vivian are males with 2 vehicles (22, accounting for 100.0%) and females with 2 vehicles (4, making up 314.3%).
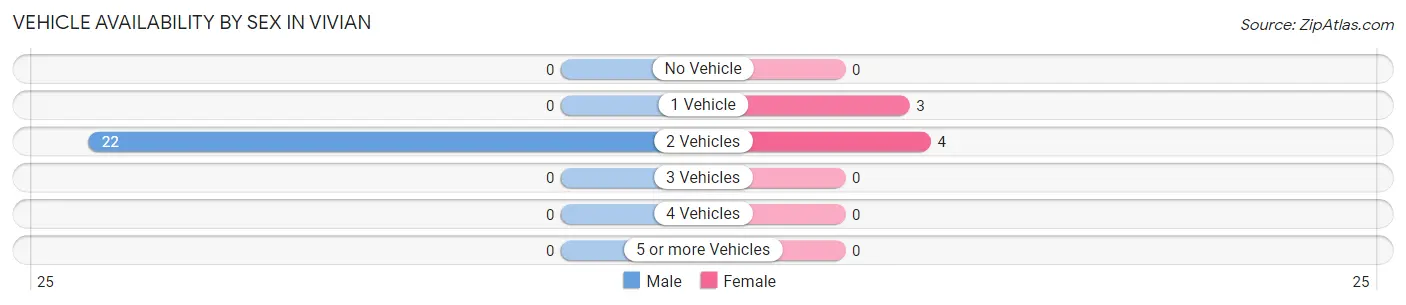
| Vehicles Available | Male | Female |
| No Vehicle | 0 (0.0%) | 0 (0.0%) |
| 1 Vehicle | 0 (0.0%) | 3 (42.9%) |
| 2 Vehicles | 22 (100.0%) | 4 (57.1%) |
| 3 Vehicles | 0 (0.0%) | 0 (0.0%) |
| 4 Vehicles | 0 (0.0%) | 0 (0.0%) |
| 5 or more Vehicles | 0 (0.0%) | 0 (0.0%) |
| Total | 22 (100.0%) | 7 (100.0%) |
Commute Time in Vivian
The most frequently occuring commute durations in Vivian are 5 to 9 minutes (18 commuters, 62.1%), less than 5 minutes (8 commuters, 27.6%), and 60 to 89 minutes (3 commuters, 10.3%).
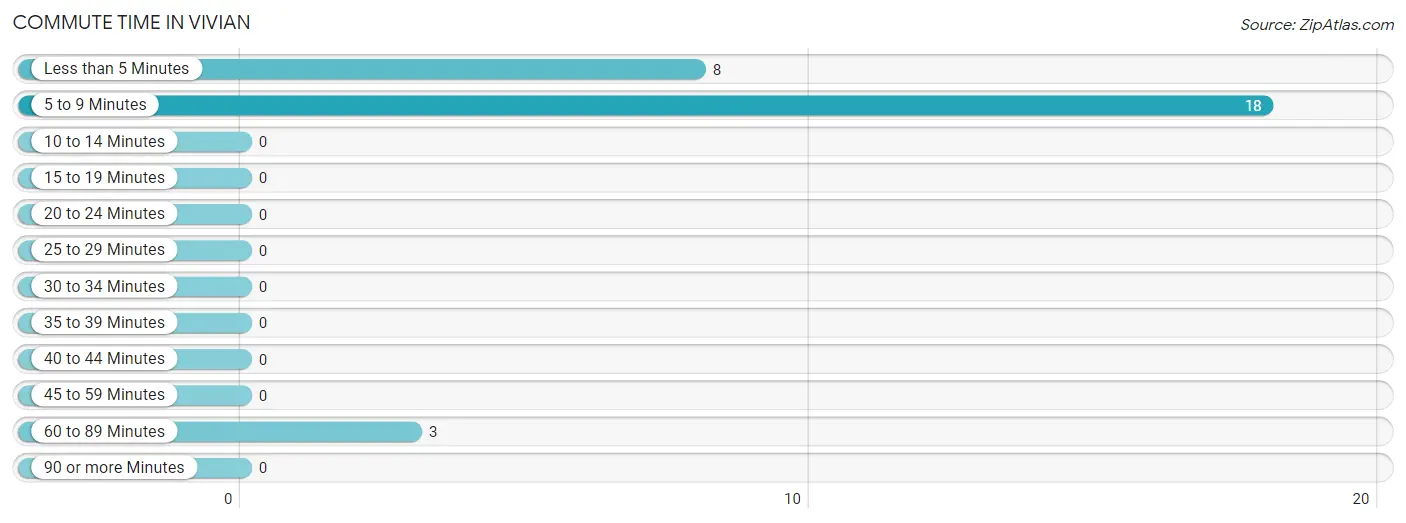
| Commute Time | # Commuters | % Commuters |
| Less than 5 Minutes | 8 | 27.6% |
| 5 to 9 Minutes | 18 | 62.1% |
| 10 to 14 Minutes | 0 | 0.0% |
| 15 to 19 Minutes | 0 | 0.0% |
| 20 to 24 Minutes | 0 | 0.0% |
| 25 to 29 Minutes | 0 | 0.0% |
| 30 to 34 Minutes | 0 | 0.0% |
| 35 to 39 Minutes | 0 | 0.0% |
| 40 to 44 Minutes | 0 | 0.0% |
| 45 to 59 Minutes | 0 | 0.0% |
| 60 to 89 Minutes | 3 | 10.3% |
| 90 or more Minutes | 0 | 0.0% |
Commute Time by Sex in Vivian
The most common commute times in Vivian are 5 to 9 minutes (18 commuters, 81.8%) for males and less than 5 minutes (4 commuters, 57.1%) for females.
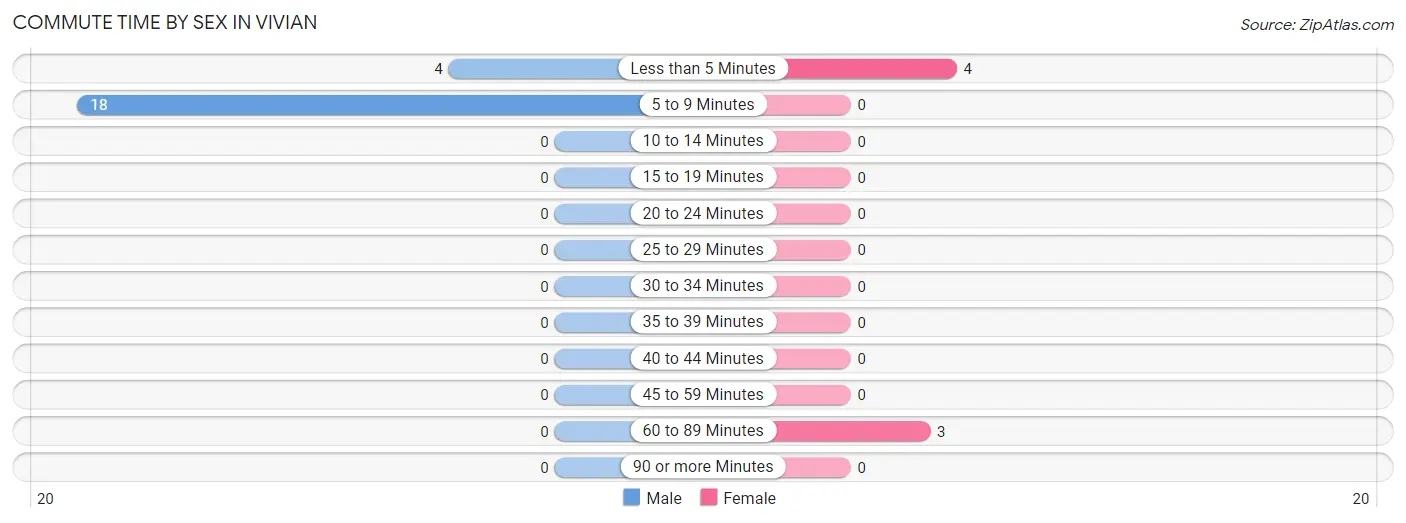
| Commute Time | Male | Female |
| Less than 5 Minutes | 4 (18.2%) | 4 (57.1%) |
| 5 to 9 Minutes | 18 (81.8%) | 0 (0.0%) |
| 10 to 14 Minutes | 0 (0.0%) | 0 (0.0%) |
| 15 to 19 Minutes | 0 (0.0%) | 0 (0.0%) |
| 20 to 24 Minutes | 0 (0.0%) | 0 (0.0%) |
| 25 to 29 Minutes | 0 (0.0%) | 0 (0.0%) |
| 30 to 34 Minutes | 0 (0.0%) | 0 (0.0%) |
| 35 to 39 Minutes | 0 (0.0%) | 0 (0.0%) |
| 40 to 44 Minutes | 0 (0.0%) | 0 (0.0%) |
| 45 to 59 Minutes | 0 (0.0%) | 0 (0.0%) |
| 60 to 89 Minutes | 0 (0.0%) | 3 (42.9%) |
| 90 or more Minutes | 0 (0.0%) | 0 (0.0%) |
Time of Departure to Work by Sex in Vivian
The most frequent times of departure to work in Vivian are 8:00 AM to 8:29 AM (18, 81.8%) for males and 7:00 AM to 7:29 AM (4, 57.1%) for females.
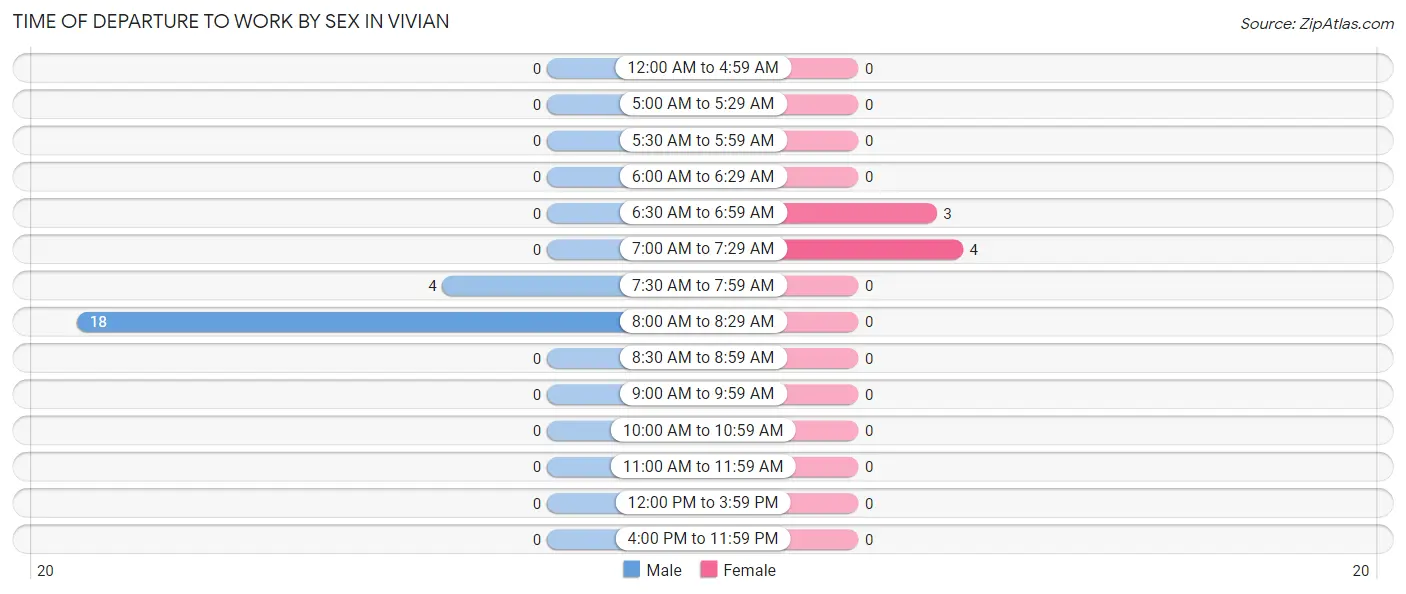
| Time of Departure | Male | Female |
| 12:00 AM to 4:59 AM | 0 (0.0%) | 0 (0.0%) |
| 5:00 AM to 5:29 AM | 0 (0.0%) | 0 (0.0%) |
| 5:30 AM to 5:59 AM | 0 (0.0%) | 0 (0.0%) |
| 6:00 AM to 6:29 AM | 0 (0.0%) | 0 (0.0%) |
| 6:30 AM to 6:59 AM | 0 (0.0%) | 3 (42.9%) |
| 7:00 AM to 7:29 AM | 0 (0.0%) | 4 (57.1%) |
| 7:30 AM to 7:59 AM | 4 (18.2%) | 0 (0.0%) |
| 8:00 AM to 8:29 AM | 18 (81.8%) | 0 (0.0%) |
| 8:30 AM to 8:59 AM | 0 (0.0%) | 0 (0.0%) |
| 9:00 AM to 9:59 AM | 0 (0.0%) | 0 (0.0%) |
| 10:00 AM to 10:59 AM | 0 (0.0%) | 0 (0.0%) |
| 11:00 AM to 11:59 AM | 0 (0.0%) | 0 (0.0%) |
| 12:00 PM to 3:59 PM | 0 (0.0%) | 0 (0.0%) |
| 4:00 PM to 11:59 PM | 0 (0.0%) | 0 (0.0%) |
| Total | 22 (100.0%) | 7 (100.0%) |
Housing Occupancy in Vivian
Occupancy by Ownership in Vivian
Of the total 24 dwellings in Vivian, owner-occupied units account for 21 (87.5%), while renter-occupied units make up 3 (12.5%).
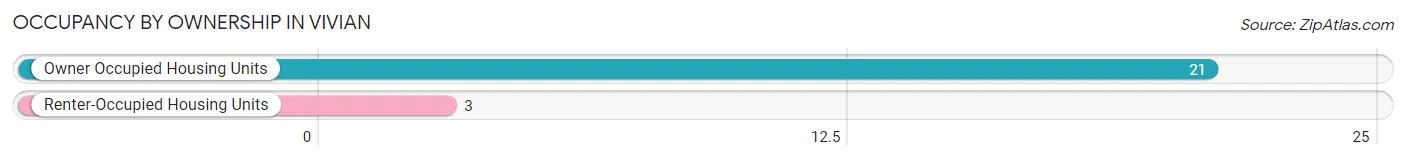
| Occupancy | # Housing Units | % Housing Units |
| Owner Occupied Housing Units | 21 | 87.5% |
| Renter-Occupied Housing Units | 3 | 12.5% |
| Total Occupied Housing Units | 24 | 100.0% |
Occupancy by Household Size in Vivian
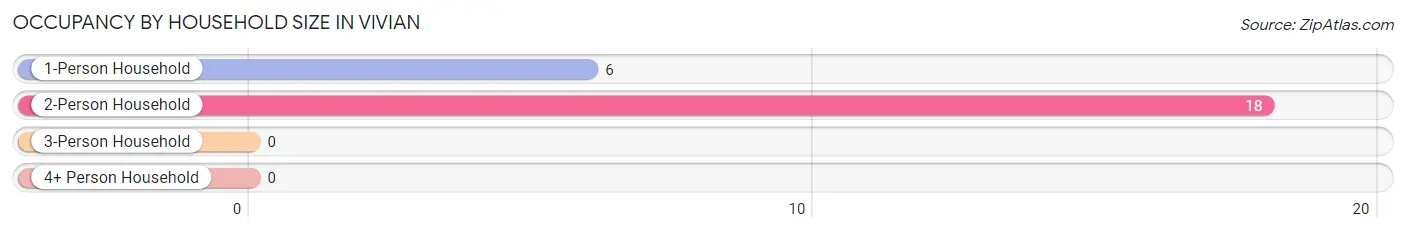
| Household Size | # Housing Units | % Housing Units |
| 1-Person Household | 6 | 25.0% |
| 2-Person Household | 18 | 75.0% |
| 3-Person Household | 0 | 0.0% |
| 4+ Person Household | 0 | 0.0% |
| Total Housing Units | 24 | 100.0% |
Occupancy by Ownership by Household Size in Vivian
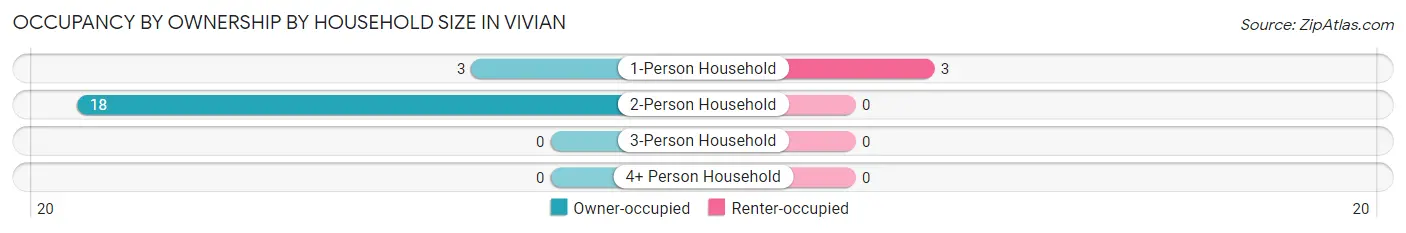
| Household Size | Owner-occupied | Renter-occupied |
| 1-Person Household | 3 (50.0%) | 3 (50.0%) |
| 2-Person Household | 18 (100.0%) | 0 (0.0%) |
| 3-Person Household | 0 (0.0%) | 0 (0.0%) |
| 4+ Person Household | 0 (0.0%) | 0 (0.0%) |
| Total Housing Units | 21 (87.5%) | 3 (12.5%) |
Occupancy by Educational Attainment in Vivian
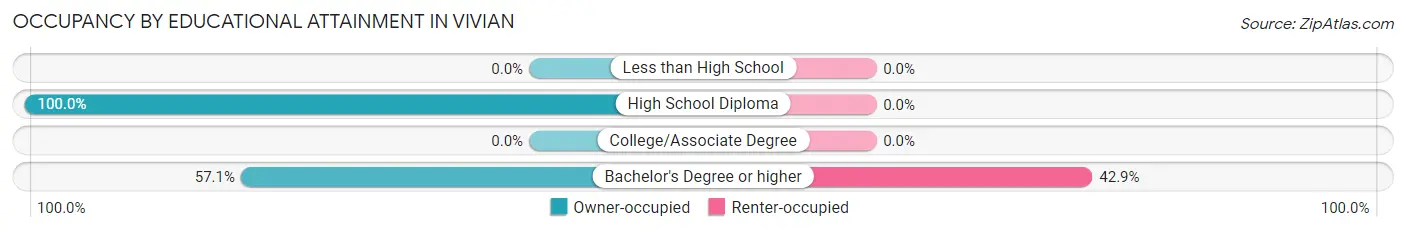
| Household Size | Owner-occupied | Renter-occupied |
| Less than High School | 0 (0.0%) | 0 (0.0%) |
| High School Diploma | 17 (100.0%) | 0 (0.0%) |
| College/Associate Degree | 0 (0.0%) | 0 (0.0%) |
| Bachelor's Degree or higher | 4 (57.1%) | 3 (42.9%) |
Occupancy by Age of Householder in Vivian
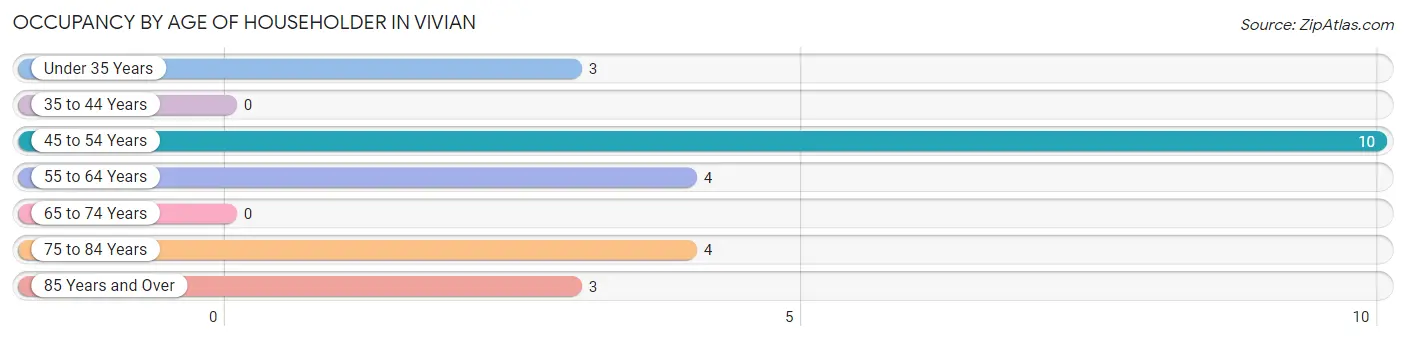
| Age Bracket | # Households | % Households |
| Under 35 Years | 3 | 12.5% |
| 35 to 44 Years | 0 | 0.0% |
| 45 to 54 Years | 10 | 41.7% |
| 55 to 64 Years | 4 | 16.7% |
| 65 to 74 Years | 0 | 0.0% |
| 75 to 84 Years | 4 | 16.7% |
| 85 Years and Over | 3 | 12.5% |
| Total | 24 | 100.0% |
Housing Finances in Vivian
Median Income by Occupancy in Vivian
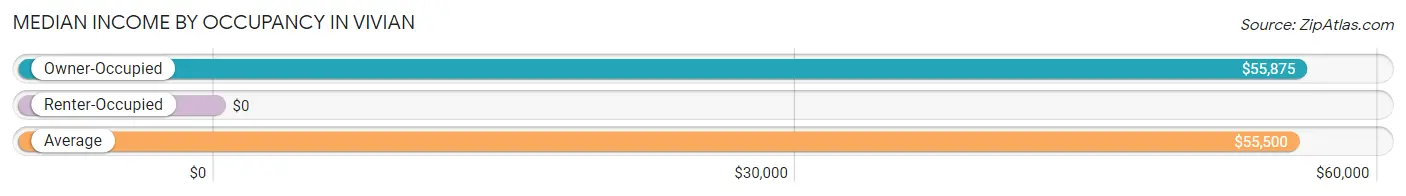
| Occupancy Type | # Households | Median Income |
| Owner-Occupied | 21 (87.5%) | $55,875 |
| Renter-Occupied | 3 (12.5%) | $0 |
| Average | 24 (100.0%) | $55,500 |
Occupancy by Householder Income Bracket in Vivian
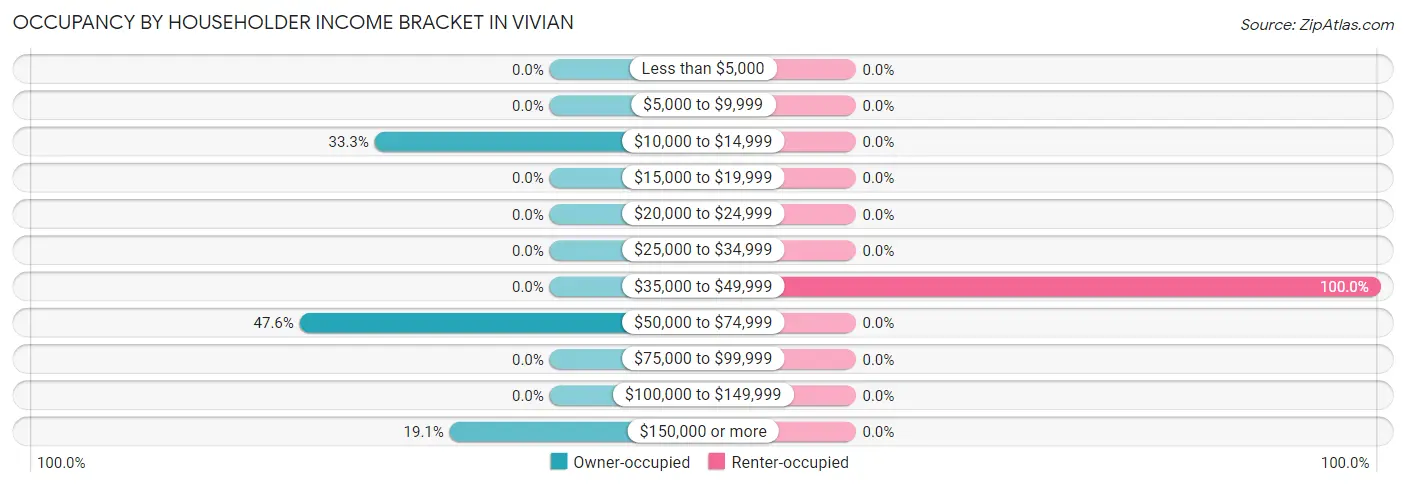
| Income Bracket | Owner-occupied | Renter-occupied |
| Less than $5,000 | 0 (0.0%) | 0 (0.0%) |
| $5,000 to $9,999 | 0 (0.0%) | 0 (0.0%) |
| $10,000 to $14,999 | 7 (33.3%) | 0 (0.0%) |
| $15,000 to $19,999 | 0 (0.0%) | 0 (0.0%) |
| $20,000 to $24,999 | 0 (0.0%) | 0 (0.0%) |
| $25,000 to $34,999 | 0 (0.0%) | 0 (0.0%) |
| $35,000 to $49,999 | 0 (0.0%) | 3 (100.0%) |
| $50,000 to $74,999 | 10 (47.6%) | 0 (0.0%) |
| $75,000 to $99,999 | 0 (0.0%) | 0 (0.0%) |
| $100,000 to $149,999 | 0 (0.0%) | 0 (0.0%) |
| $150,000 or more | 4 (19.1%) | 0 (0.0%) |
| Total | 21 (100.0%) | 3 (100.0%) |
Monthly Housing Cost Tiers in Vivian
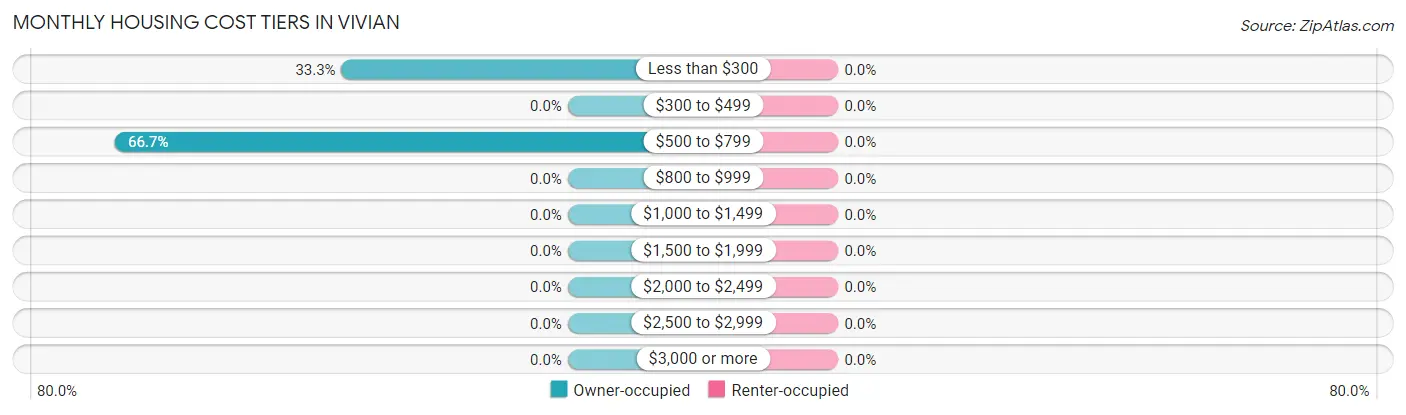
| Monthly Cost | Owner-occupied | Renter-occupied |
| Less than $300 | 7 (33.3%) | 0 (0.0%) |
| $300 to $499 | 0 (0.0%) | 0 (0.0%) |
| $500 to $799 | 14 (66.7%) | 0 (0.0%) |
| $800 to $999 | 0 (0.0%) | 0 (0.0%) |
| $1,000 to $1,499 | 0 (0.0%) | 0 (0.0%) |
| $1,500 to $1,999 | 0 (0.0%) | 0 (0.0%) |
| $2,000 to $2,499 | 0 (0.0%) | 0 (0.0%) |
| $2,500 to $2,999 | 0 (0.0%) | 0 (0.0%) |
| $3,000 or more | 0 (0.0%) | 0 (0.0%) |
| Total | 21 (100.0%) | 3 (100.0%) |
Physical Housing Characteristics in Vivian
Housing Structures in Vivian
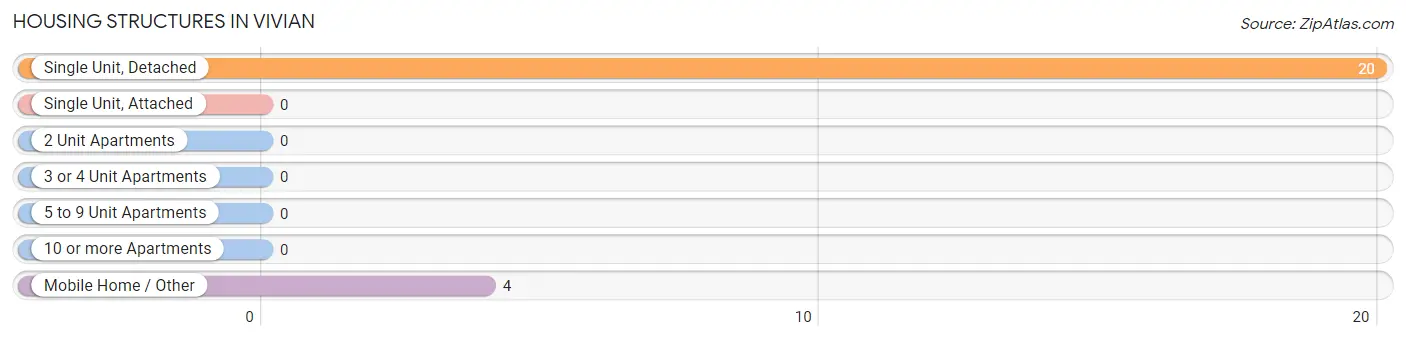
| Structure Type | # Housing Units | % Housing Units |
| Single Unit, Detached | 20 | 83.3% |
| Single Unit, Attached | 0 | 0.0% |
| 2 Unit Apartments | 0 | 0.0% |
| 3 or 4 Unit Apartments | 0 | 0.0% |
| 5 to 9 Unit Apartments | 0 | 0.0% |
| 10 or more Apartments | 0 | 0.0% |
| Mobile Home / Other | 4 | 16.7% |
| Total | 24 | 100.0% |
Housing Structures by Occupancy in Vivian
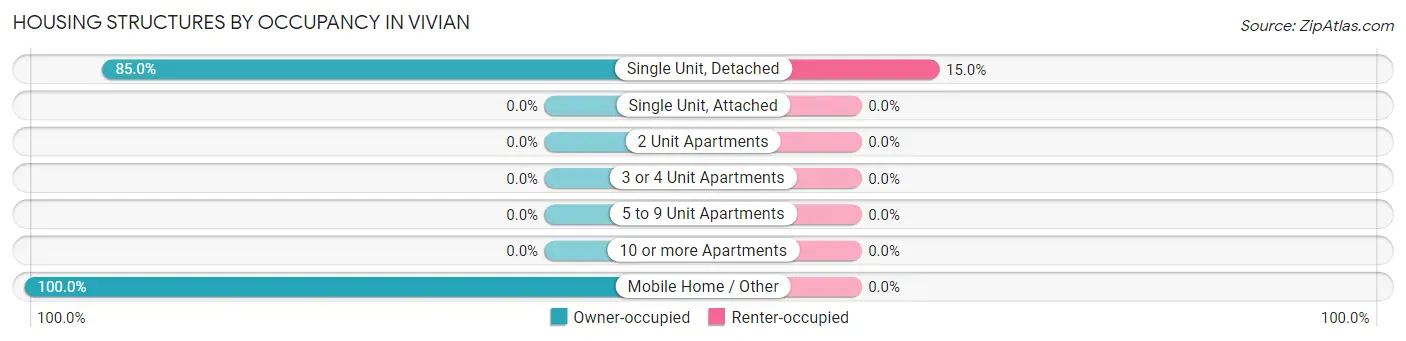
| Structure Type | Owner-occupied | Renter-occupied |
| Single Unit, Detached | 17 (85.0%) | 3 (15.0%) |
| Single Unit, Attached | 0 (0.0%) | 0 (0.0%) |
| 2 Unit Apartments | 0 (0.0%) | 0 (0.0%) |
| 3 or 4 Unit Apartments | 0 (0.0%) | 0 (0.0%) |
| 5 to 9 Unit Apartments | 0 (0.0%) | 0 (0.0%) |
| 10 or more Apartments | 0 (0.0%) | 0 (0.0%) |
| Mobile Home / Other | 4 (100.0%) | 0 (0.0%) |
| Total | 21 (87.5%) | 3 (12.5%) |
Housing Structures by Number of Rooms in Vivian
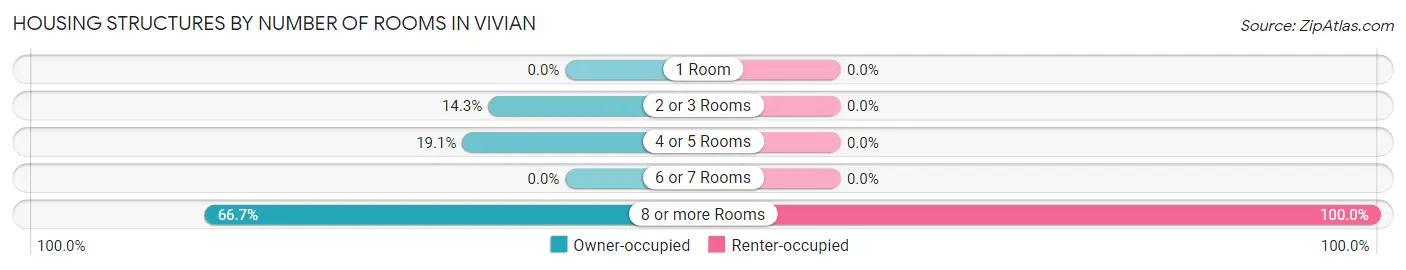
| Number of Rooms | Owner-occupied | Renter-occupied |
| 1 Room | 0 (0.0%) | 0 (0.0%) |
| 2 or 3 Rooms | 3 (14.3%) | 0 (0.0%) |
| 4 or 5 Rooms | 4 (19.1%) | 0 (0.0%) |
| 6 or 7 Rooms | 0 (0.0%) | 0 (0.0%) |
| 8 or more Rooms | 14 (66.7%) | 3 (100.0%) |
| Total | 21 (100.0%) | 3 (100.0%) |
Housing Structure by Heating Type in Vivian
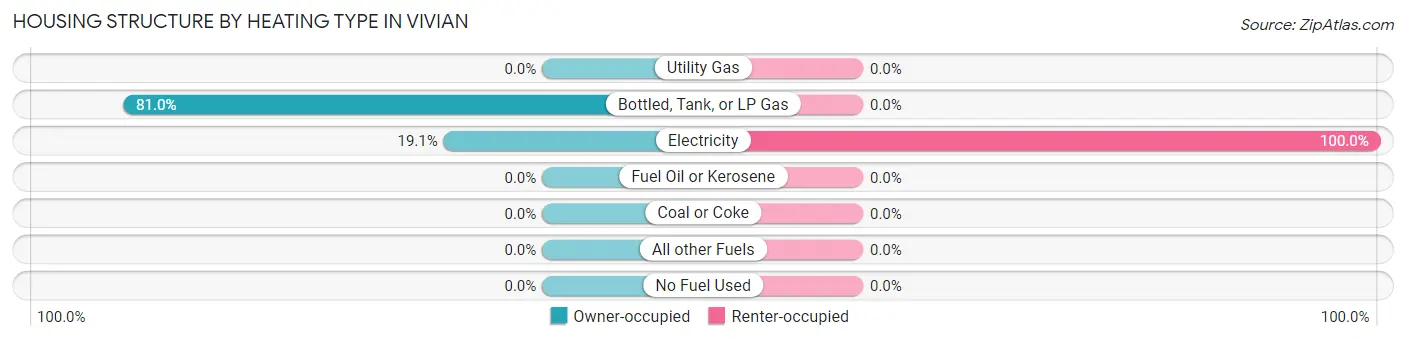
| Heating Type | Owner-occupied | Renter-occupied |
| Utility Gas | 0 (0.0%) | 0 (0.0%) |
| Bottled, Tank, or LP Gas | 17 (80.9%) | 0 (0.0%) |
| Electricity | 4 (19.1%) | 3 (100.0%) |
| Fuel Oil or Kerosene | 0 (0.0%) | 0 (0.0%) |
| Coal or Coke | 0 (0.0%) | 0 (0.0%) |
| All other Fuels | 0 (0.0%) | 0 (0.0%) |
| No Fuel Used | 0 (0.0%) | 0 (0.0%) |
| Total | 21 (100.0%) | 3 (100.0%) |
Household Vehicle Usage in Vivian
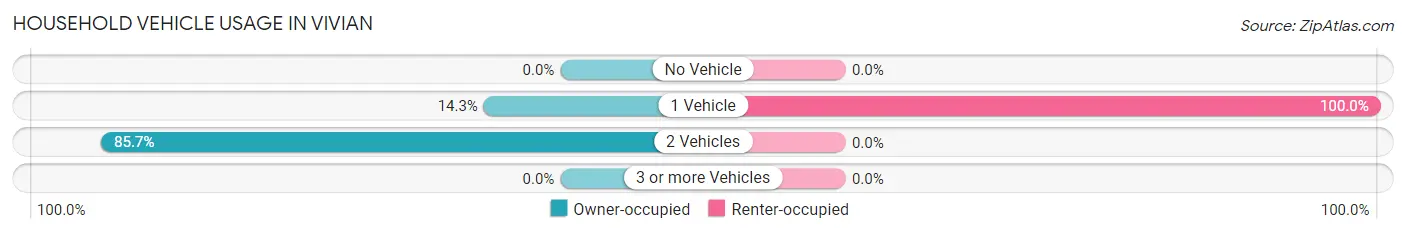
| Vehicles per Household | Owner-occupied | Renter-occupied |
| No Vehicle | 0 (0.0%) | 0 (0.0%) |
| 1 Vehicle | 3 (14.3%) | 3 (100.0%) |
| 2 Vehicles | 18 (85.7%) | 0 (0.0%) |
| 3 or more Vehicles | 0 (0.0%) | 0 (0.0%) |
| Total | 21 (100.0%) | 3 (100.0%) |
Real Estate & Mortgages in Vivian
Real Estate and Mortgage Overview in Vivian
| Characteristic | Without Mortgage | With Mortgage |
| Housing Units | 21 | 0 |
| Median Property Value | $121,900 | $0 |
| Median Household Income | $55,875 | $0 |
| Monthly Housing Costs | $588 | $0 |
| Real Estate Taxes | - | - |
Property Value by Mortgage Status in Vivian
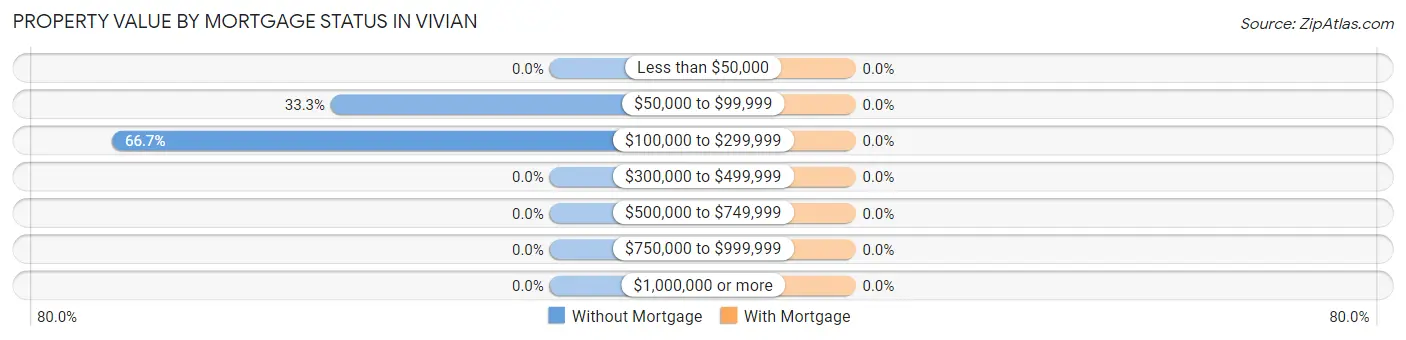
| Property Value | Without Mortgage | With Mortgage |
| Less than $50,000 | 0 (0.0%) | 0 (0.0%) |
| $50,000 to $99,999 | 7 (33.3%) | 0 (0.0%) |
| $100,000 to $299,999 | 14 (66.7%) | 0 (0.0%) |
| $300,000 to $499,999 | 0 (0.0%) | 0 (0.0%) |
| $500,000 to $749,999 | 0 (0.0%) | 0 (0.0%) |
| $750,000 to $999,999 | 0 (0.0%) | 0 (0.0%) |
| $1,000,000 or more | 0 (0.0%) | 0 (0.0%) |
| Total | 21 (100.0%) | 0 (0.0%) |
Household Income by Mortgage Status in Vivian
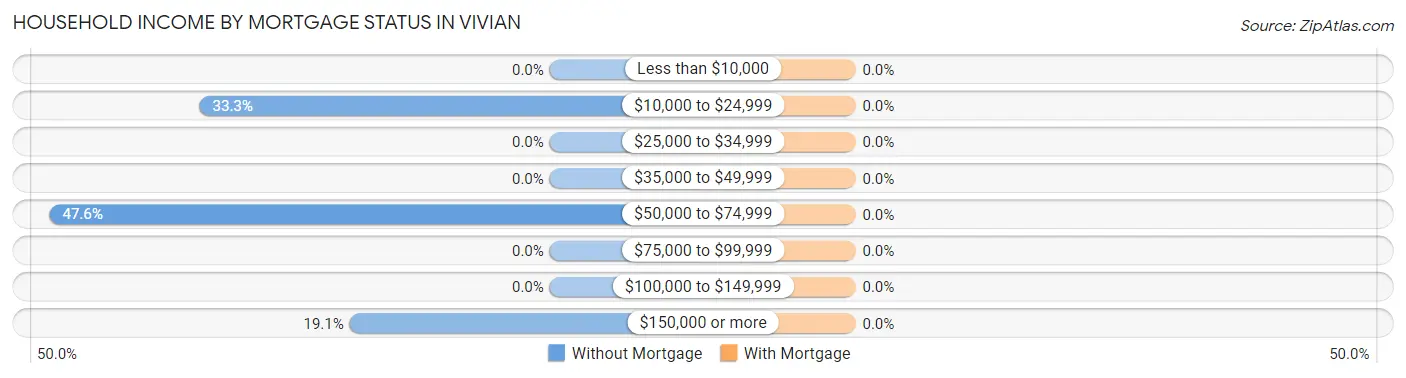
| Household Income | Without Mortgage | With Mortgage |
| Less than $10,000 | 0 (0.0%) | 0 (0.0%) |
| $10,000 to $24,999 | 7 (33.3%) | 0 (0.0%) |
| $25,000 to $34,999 | 0 (0.0%) | 0 (0.0%) |
| $35,000 to $49,999 | 0 (0.0%) | 0 (0.0%) |
| $50,000 to $74,999 | 10 (47.6%) | 0 (0.0%) |
| $75,000 to $99,999 | 0 (0.0%) | 0 (0.0%) |
| $100,000 to $149,999 | 0 (0.0%) | 0 (0.0%) |
| $150,000 or more | 4 (19.1%) | 0 (0.0%) |
| Total | 21 (100.0%) | 0 (0.0%) |
Property Value to Household Income Ratio in Vivian
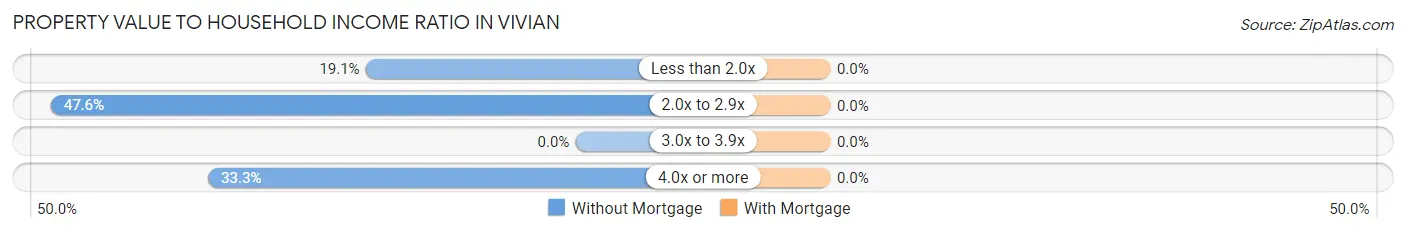
| Value-to-Income Ratio | Without Mortgage | With Mortgage |
| Less than 2.0x | 4 (19.1%) | 0 (0.0%) |
| 2.0x to 2.9x | 10 (47.6%) | 0 (0.0%) |
| 3.0x to 3.9x | 0 (0.0%) | 0 (0.0%) |
| 4.0x or more | 7 (33.3%) | 0 (0.0%) |
| Total | 21 (100.0%) | 0 (0.0%) |
Real Estate Taxes by Mortgage Status in Vivian
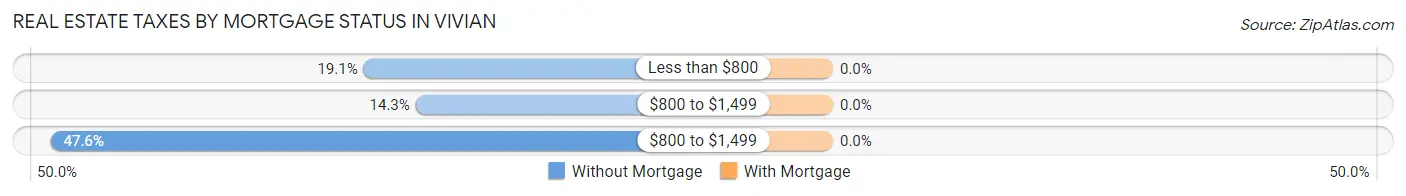
| Property Taxes | Without Mortgage | With Mortgage |
| Less than $800 | 4 (19.1%) | 0 (0.0%) |
| $800 to $1,499 | 3 (14.3%) | 0 (0.0%) |
| $800 to $1,499 | 10 (47.6%) | 0 (0.0%) |
| Total | 21 (100.0%) | 0 (0.0%) |
Health & Disability in Vivian
Health Insurance Coverage by Age in Vivian
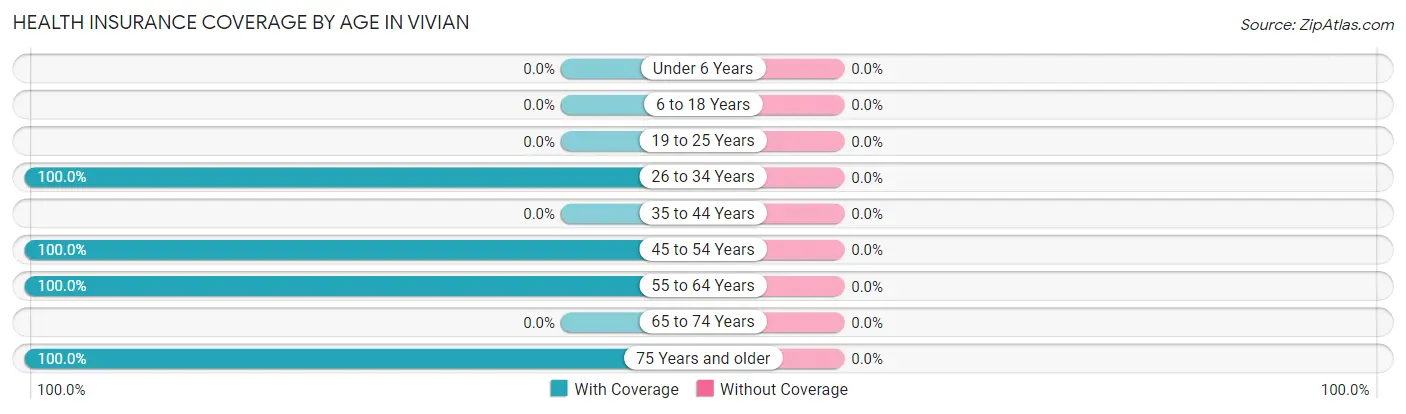
| Age Bracket | With Coverage | Without Coverage |
| Under 6 Years | 0 (0.0%) | 0 (0.0%) |
| 6 to 18 Years | 0 (0.0%) | 0 (0.0%) |
| 19 to 25 Years | 0 (0.0%) | 0 (0.0%) |
| 26 to 34 Years | 3 (100.0%) | 0 (0.0%) |
| 35 to 44 Years | 0 (0.0%) | 0 (0.0%) |
| 45 to 54 Years | 10 (100.0%) | 0 (0.0%) |
| 55 to 64 Years | 26 (100.0%) | 0 (0.0%) |
| 65 to 74 Years | 0 (0.0%) | 0 (0.0%) |
| 75 Years and older | 11 (100.0%) | 0 (0.0%) |
| Total | 50 (100.0%) | 0 (0.0%) |
Health Insurance Coverage by Citizenship Status in Vivian
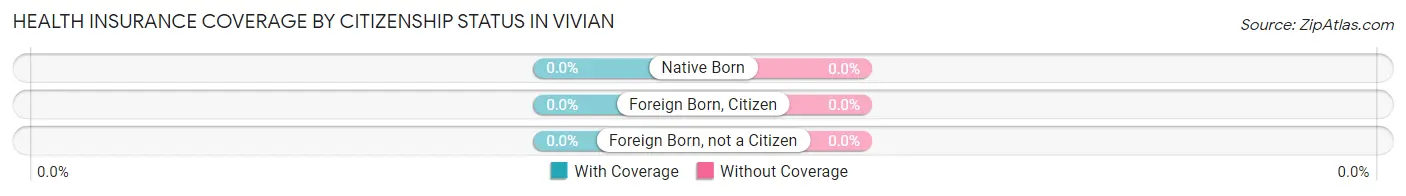
| Citizenship Status | With Coverage | Without Coverage |
| Native Born | 0 (0.0%) | 0 (0.0%) |
| Foreign Born, Citizen | 0 (0.0%) | 0 (0.0%) |
| Foreign Born, not a Citizen | 0 (0.0%) | 0 (0.0%) |
Health Insurance Coverage by Household Income in Vivian
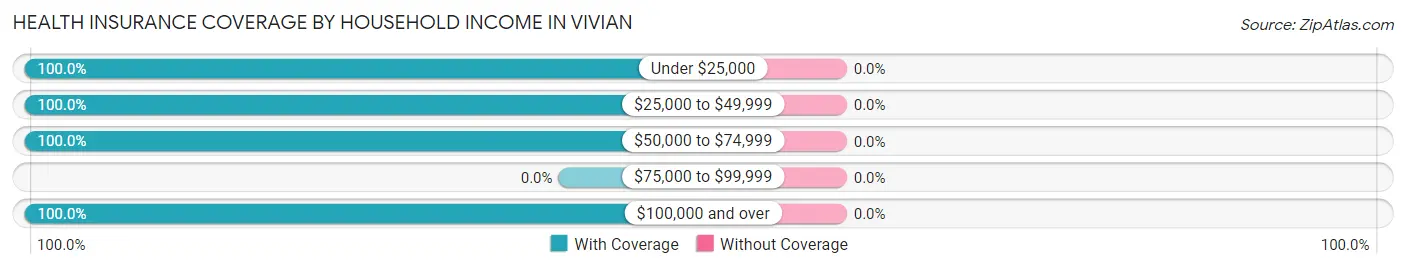
| Household Income | With Coverage | Without Coverage |
| Under $25,000 | 11 (100.0%) | 0 (0.0%) |
| $25,000 to $49,999 | 3 (100.0%) | 0 (0.0%) |
| $50,000 to $74,999 | 28 (100.0%) | 0 (0.0%) |
| $75,000 to $99,999 | 0 (0.0%) | 0 (0.0%) |
| $100,000 and over | 8 (100.0%) | 0 (0.0%) |
Public vs Private Health Insurance Coverage by Age in Vivian
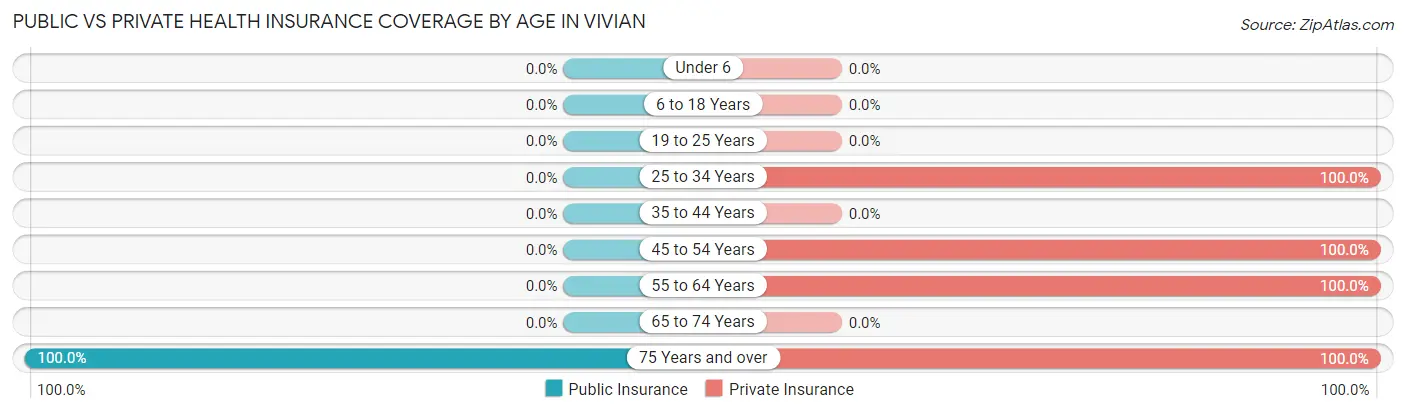
| Age Bracket | Public Insurance | Private Insurance |
| Under 6 | 0 (0.0%) | 0 (0.0%) |
| 6 to 18 Years | 0 (0.0%) | 0 (0.0%) |
| 19 to 25 Years | 0 (0.0%) | 0 (0.0%) |
| 25 to 34 Years | 0 (0.0%) | 3 (100.0%) |
| 35 to 44 Years | 0 (0.0%) | 0 (0.0%) |
| 45 to 54 Years | 0 (0.0%) | 10 (100.0%) |
| 55 to 64 Years | 0 (0.0%) | 26 (100.0%) |
| 65 to 74 Years | 0 (0.0%) | 0 (0.0%) |
| 75 Years and over | 11 (100.0%) | 11 (100.0%) |
| Total | 11 (22.0%) | 50 (100.0%) |
Disability Status by Sex by Age in Vivian
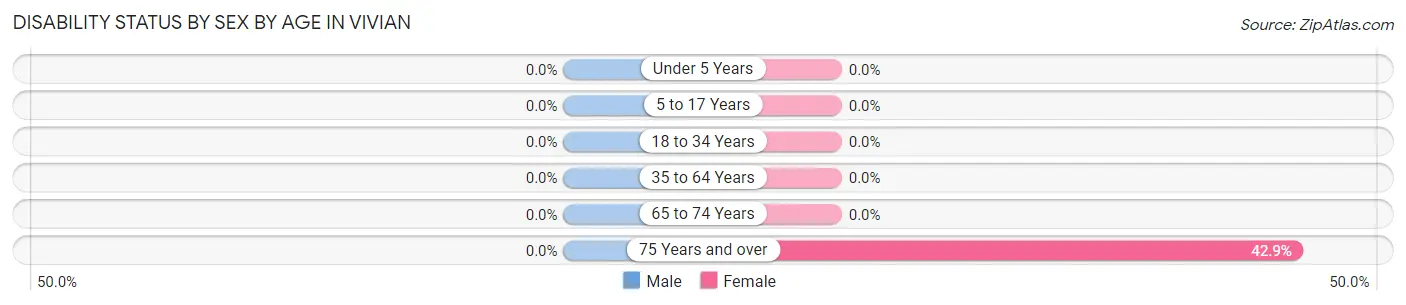
| Age Bracket | Male | Female |
| Under 5 Years | 0 (0.0%) | 0 (0.0%) |
| 5 to 17 Years | 0 (0.0%) | 0 (0.0%) |
| 18 to 34 Years | 0 (0.0%) | 0 (0.0%) |
| 35 to 64 Years | 0 (0.0%) | 0 (0.0%) |
| 65 to 74 Years | 0 (0.0%) | 0 (0.0%) |
| 75 Years and over | 0 (0.0%) | 3 (42.9%) |
Disability Class by Sex by Age in Vivian
Disability Class: Hearing Difficulty
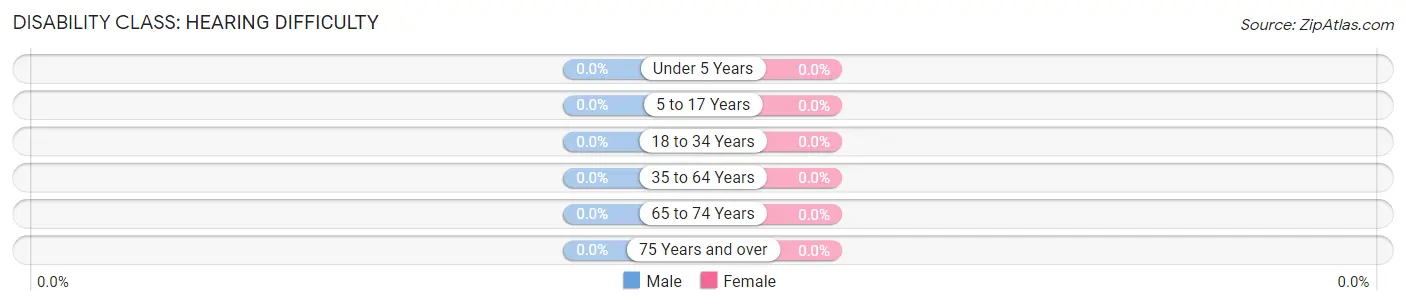
| Age Bracket | Male | Female |
| Under 5 Years | 0 (0.0%) | 0 (0.0%) |
| 5 to 17 Years | 0 (0.0%) | 0 (0.0%) |
| 18 to 34 Years | 0 (0.0%) | 0 (0.0%) |
| 35 to 64 Years | 0 (0.0%) | 0 (0.0%) |
| 65 to 74 Years | 0 (0.0%) | 0 (0.0%) |
| 75 Years and over | 0 (0.0%) | 0 (0.0%) |
Disability Class: Vision Difficulty
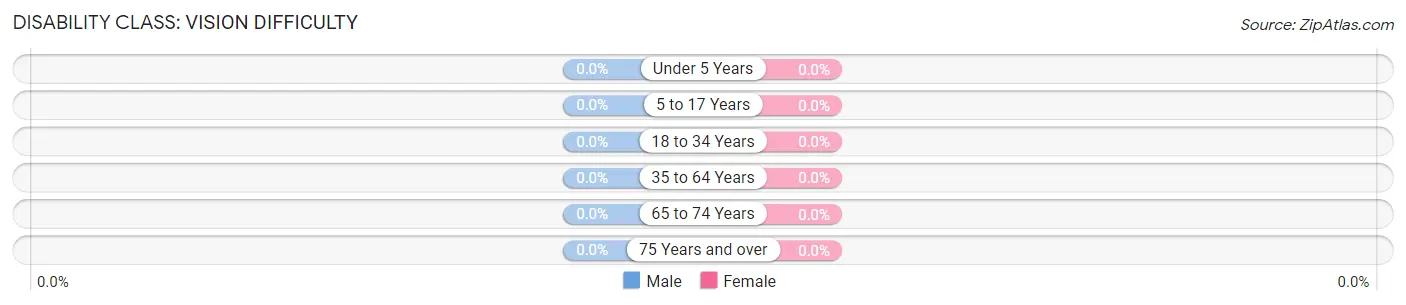
| Age Bracket | Male | Female |
| Under 5 Years | 0 (0.0%) | 0 (0.0%) |
| 5 to 17 Years | 0 (0.0%) | 0 (0.0%) |
| 18 to 34 Years | 0 (0.0%) | 0 (0.0%) |
| 35 to 64 Years | 0 (0.0%) | 0 (0.0%) |
| 65 to 74 Years | 0 (0.0%) | 0 (0.0%) |
| 75 Years and over | 0 (0.0%) | 0 (0.0%) |
Disability Class: Cognitive Difficulty
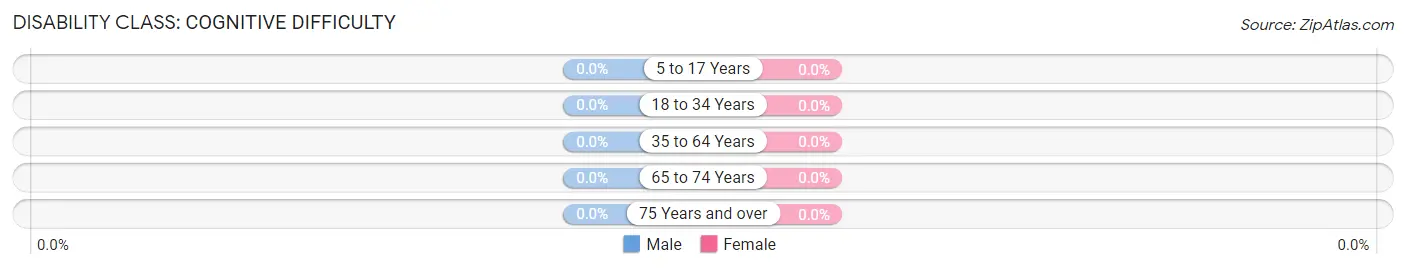
| Age Bracket | Male | Female |
| 5 to 17 Years | 0 (0.0%) | 0 (0.0%) |
| 18 to 34 Years | 0 (0.0%) | 0 (0.0%) |
| 35 to 64 Years | 0 (0.0%) | 0 (0.0%) |
| 65 to 74 Years | 0 (0.0%) | 0 (0.0%) |
| 75 Years and over | 0 (0.0%) | 0 (0.0%) |
Disability Class: Ambulatory Difficulty
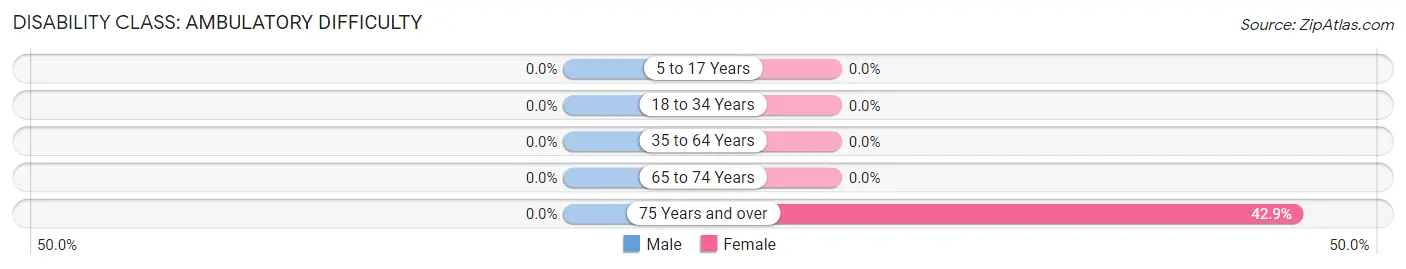
| Age Bracket | Male | Female |
| 5 to 17 Years | 0 (0.0%) | 0 (0.0%) |
| 18 to 34 Years | 0 (0.0%) | 0 (0.0%) |
| 35 to 64 Years | 0 (0.0%) | 0 (0.0%) |
| 65 to 74 Years | 0 (0.0%) | 0 (0.0%) |
| 75 Years and over | 0 (0.0%) | 3 (42.9%) |
Disability Class: Self-Care Difficulty
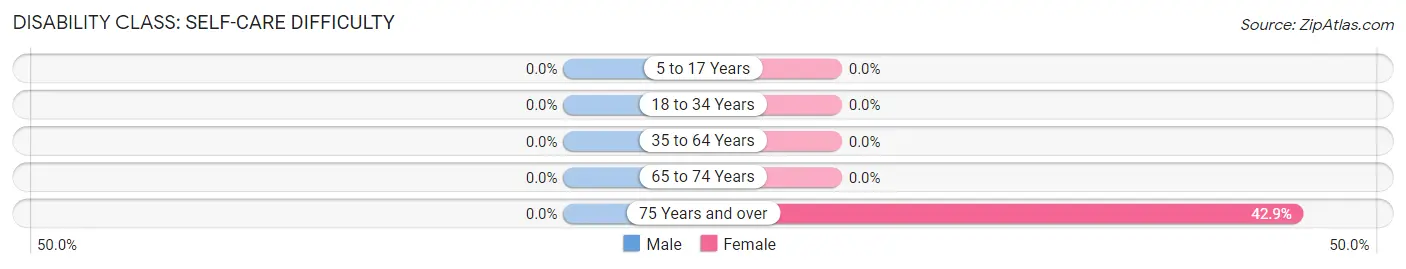
| Age Bracket | Male | Female |
| 5 to 17 Years | 0 (0.0%) | 0 (0.0%) |
| 18 to 34 Years | 0 (0.0%) | 0 (0.0%) |
| 35 to 64 Years | 0 (0.0%) | 0 (0.0%) |
| 65 to 74 Years | 0 (0.0%) | 0 (0.0%) |
| 75 Years and over | 0 (0.0%) | 3 (42.9%) |
Technology Access in Vivian
Computing Device Access in Vivian
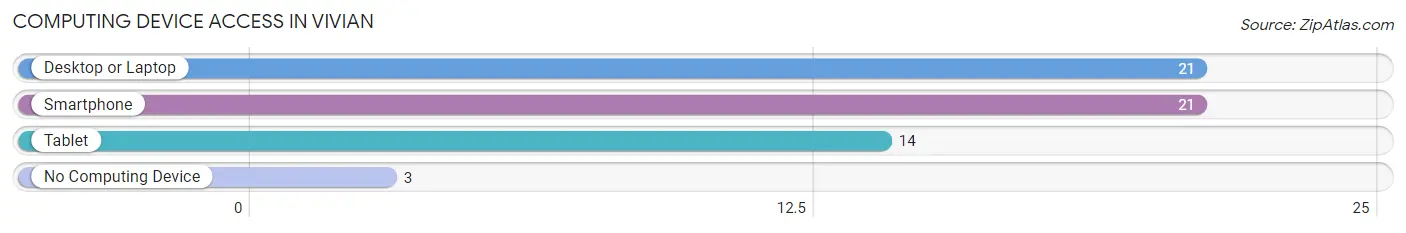
| Device Type | # Households | % Households |
| Desktop or Laptop | 21 | 87.5% |
| Smartphone | 21 | 87.5% |
| Tablet | 14 | 58.3% |
| No Computing Device | 3 | 12.5% |
| Total | 24 | 100.0% |
Internet Access in Vivian
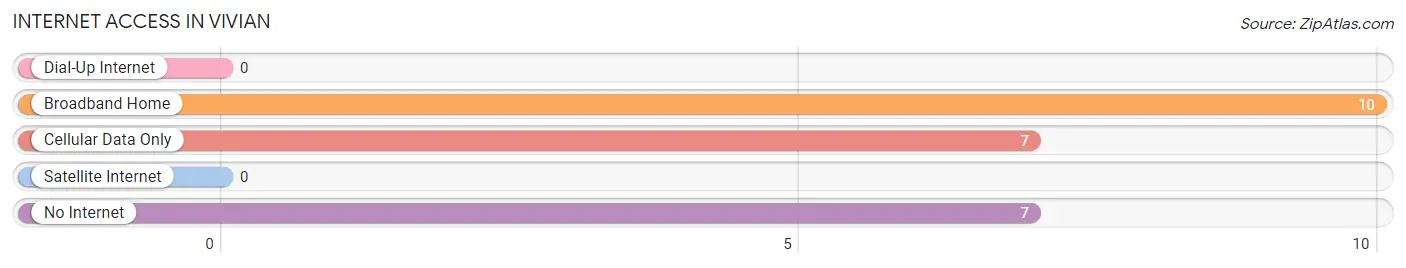
| Internet Type | # Households | % Households |
| Dial-Up Internet | 0 | 0.0% |
| Broadband Home | 10 | 41.7% |
| Cellular Data Only | 7 | 29.2% |
| Satellite Internet | 0 | 0.0% |
| No Internet | 7 | 29.2% |
| Total | 24 | 100.0% |
Vivian Summary
Vivian, South Dakota is a small town located in the southeastern corner of the state. It is situated in the rolling hills of the Missouri River Valley, and is surrounded by the vast prairies of the Great Plains. The town was founded in 1883 and has a population of just over 500 people.
Vivian is located in Lyman County, which is part of the larger South Dakota region known as the Glacial Lakes Region. The town is situated on the banks of the Missouri River, and is surrounded by the rolling hills of the Missouri River Valley. The town is located approximately 30 miles from the state capital of Pierre, and is within a two-hour drive of Sioux Falls, the largest city in the state.
The economy of Vivian is largely based on agriculture. The town is home to several large farms, as well as a number of smaller family-owned farms. The town is also home to a number of small businesses, including a grocery store, a hardware store, and a few restaurants. The town is also home to a small manufacturing plant, which produces a variety of products, including furniture and clothing.
The demographics of Vivian are largely homogeneous. The majority of the population is of European descent, with a small percentage of Native American and African American residents. The median household income in Vivian is approximately $35,000, and the median age is around 40 years old. The town is served by a single school district, which serves students from kindergarten through twelfth grade.
Vivian is a small town with a rich history and a strong sense of community. The town is home to a number of historic sites, including the Vivian Cemetery, which dates back to the late 1800s. The town is also home to a number of recreational activities, including fishing, hunting, and camping. The town is also home to a number of churches, which serve the spiritual needs of the community.
Vivian is a small town with a big heart. The town is home to a number of friendly and welcoming people, and is a great place to live and raise a family. The town is a great place to experience the beauty of the Great Plains, and to enjoy the peace and quiet of small-town life.
Common Questions
What is Per Capita Income in Vivian?
Per Capita income in Vivian is $40,018.
What is the Median Household income in Vivian?
Median Household Income in Vivian is $55,500.
What is Inequality or Gini Index in Vivian?
Inequality or Gini Index in Vivian is 0.41.
What is the Total Population of Vivian?
Total Population of Vivian is 50.
What is the Total Male Population of Vivian?
Total Male Population of Vivian is 26.
What is the Total Female Population of Vivian?
Total Female Population of Vivian is 24.
What is the Ratio of Males per 100 Females in Vivian?
There are 108.33 Males per 100 Females in Vivian.
What is the Ratio of Females per 100 Males in Vivian?
There are 92.31 Females per 100 Males in Vivian.
What is the Median Population Age in Vivian?
Median Population Age in Vivian is 60.4 Years.
What is the Average Family Size in Vivian
Average Family Size in Vivian is 2.4 People.
What is the Average Household Size in Vivian
Average Household Size in Vivian is 2.1 People.
How Large is the Labor Force in Vivian?
There are 29 People in the Labor Forcein in Vivian.
What is the Percentage of People in the Labor Force in Vivian?
58.0% of People are in the Labor Force in Vivian.