Zip Codes with the Highest Percentage of Households with Income Above $200,000 in South Dakota
RELATED REPORTS & OPTIONS
Household Income | $200k+
South Dakota
Compare Zip Codes
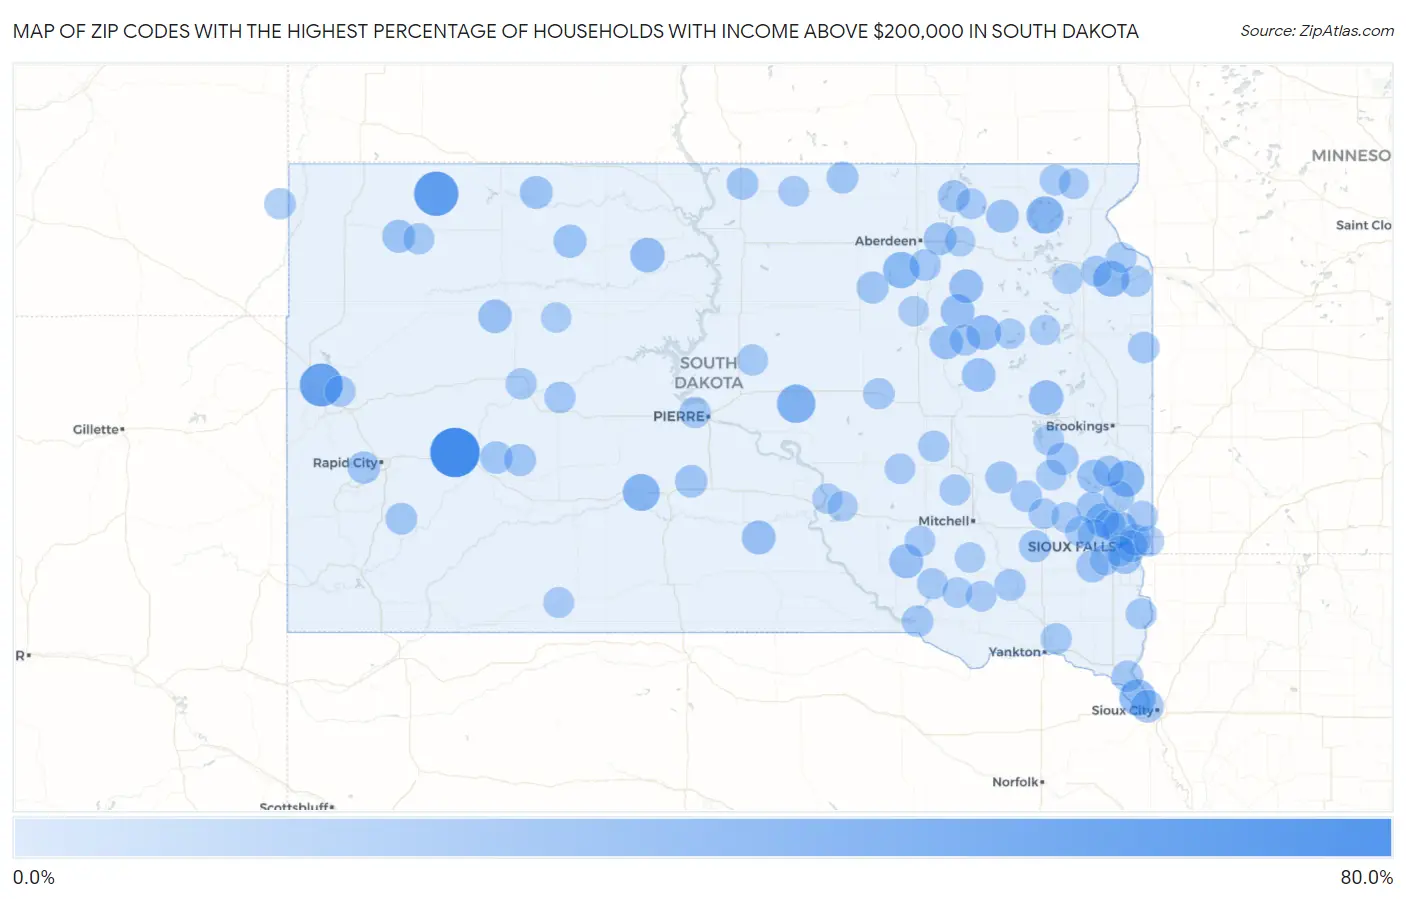
Map of Zip Codes with the Highest Percentage of Households with Income Above $200,000 in South Dakota
0.0%
80.0%
Zip Codes with the Highest Percentage of Households with Income Above $200,000 in South Dakota
| Zip Code | Households with Income > $200k | vs State | vs National | |
| 1. | 57767 | 66.3% | 6.5%(+59.8)#1 | 11.4%(+54.9)#70 |
| 2. | 57640 | 50.0% | 6.5%(+43.5)#2 | 11.4%(+38.6)#281 |
| 3. | 57779 | 45.7% | 6.5%(+39.2)#3 | 11.4%(+34.3)#404 |
| 4. | 57540 | 31.3% | 6.5%(+24.8)#4 | 11.4%(+19.9)#1,325 |
| 5. | 57232 | 27.9% | 6.5%(+21.4)#5 | 11.4%(+16.5)#1,752 |
| 6. | 57562 | 27.3% | 6.5%(+20.8)#6 | 11.4%(+15.9)#1,834 |
| 7. | 57038 | 25.3% | 6.5%(+18.8)#7 | 11.4%(+13.9)#2,137 |
| 8. | 57024 | 25.3% | 6.5%(+18.8)#8 | 11.4%(+13.9)#2,140 |
| 9. | 57460 | 25.2% | 6.5%(+18.7)#9 | 11.4%(+13.8)#2,163 |
| 10. | 57269 | 24.0% | 6.5%(+17.5)#10 | 11.4%(+12.6)#2,383 |
| 11. | 57258 | 20.6% | 6.5%(+14.1)#11 | 11.4%(+9.20)#3,145 |
| 12. | 57630 | 20.0% | 6.5%(+13.5)#12 | 11.4%(+8.60)#3,298 |
| 13. | 57233 | 19.7% | 6.5%(+13.2)#13 | 11.4%(+8.30)#3,384 |
| 14. | 57055 | 18.9% | 6.5%(+12.4)#14 | 11.4%(+7.50)#3,601 |
| 15. | 57344 | 18.3% | 6.5%(+11.8)#15 | 11.4%(+6.90)#3,769 |
| 16. | 57477 | 18.2% | 6.5%(+11.7)#16 | 11.4%(+6.80)#3,803 |
| 17. | 57541 | 17.9% | 6.5%(+11.4)#17 | 11.4%(+6.50)#3,894 |
| 18. | 57434 | 17.7% | 6.5%(+11.2)#18 | 11.4%(+6.30)#3,947 |
| 19. | 57626 | 17.4% | 6.5%(+10.9)#19 | 11.4%(+6.00)#4,053 |
| 20. | 57322 | 17.3% | 6.5%(+10.8)#20 | 11.4%(+5.90)#4,092 |
| 21. | 57041 | 17.0% | 6.5%(+10.5)#21 | 11.4%(+5.60)#4,208 |
| 22. | 57440 | 16.5% | 6.5%(+10.00)#22 | 11.4%(+5.10)#4,399 |
| 23. | 57075 | 15.9% | 6.5%(+9.40)#23 | 11.4%(+4.50)#4,626 |
| 24. | 57633 | 15.9% | 6.5%(+9.40)#24 | 11.4%(+4.50)#4,629 |
| 25. | 57651 | 15.4% | 6.5%(+8.90)#25 | 11.4%(+4.00)#4,834 |
| 26. | 57108 | 15.3% | 6.5%(+8.80)#26 | 11.4%(+3.90)#4,847 |
| 27. | 57634 | 15.2% | 6.5%(+8.70)#27 | 11.4%(+3.80)#4,925 |
| 28. | 57454 | 15.1% | 6.5%(+8.60)#28 | 11.4%(+3.70)#4,965 |
| 29. | 57049 | 14.7% | 6.5%(+8.20)#29 | 11.4%(+3.30)#5,140 |
| 30. | 57427 | 14.6% | 6.5%(+8.10)#30 | 11.4%(+3.20)#5,201 |
| 31. | 57790 | 13.9% | 6.5%(+7.40)#31 | 11.4%(+2.50)#5,545 |
| 32. | 57015 | 13.9% | 6.5%(+7.40)#32 | 11.4%(+2.50)#5,549 |
| 33. | 57531 | 13.9% | 6.5%(+7.40)#33 | 11.4%(+2.50)#5,554 |
| 34. | 57054 | 13.3% | 6.5%(+6.80)#34 | 11.4%(+1.90)#5,876 |
| 35. | 57702 | 13.1% | 6.5%(+6.60)#35 | 11.4%(+1.70)#5,952 |
| 36. | 57775 | 13.0% | 6.5%(+6.50)#36 | 11.4%(+1.60)#6,057 |
| 37. | 57435 | 12.8% | 6.5%(+6.30)#37 | 11.4%(+1.40)#6,184 |
| 38. | 57110 | 12.5% | 6.5%(+6.00)#38 | 11.4%(+1.10)#6,339 |
| 39. | 57449 | 12.3% | 6.5%(+5.80)#39 | 11.4%(+0.900)#6,519 |
| 40. | 57319 | 12.2% | 6.5%(+5.70)#40 | 11.4%(+0.800)#6,567 |
| 41. | 57018 | 12.0% | 6.5%(+5.50)#41 | 11.4%(+0.600)#6,698 |
| 42. | 57457 | 11.9% | 6.5%(+5.40)#42 | 11.4%(+0.500)#6,784 |
| 43. | 57337 | 11.8% | 6.5%(+5.30)#43 | 11.4%(+0.400)#6,842 |
| 44. | 57744 | 11.7% | 6.5%(+5.20)#44 | 11.4%(+0.300)#6,889 |
| 45. | 57632 | 11.7% | 6.5%(+5.20)#45 | 11.4%(+0.300)#6,911 |
| 46. | 57052 | 11.4% | 6.5%(+4.90)#46 | 11.4%(=0.000)#7,131 |
| 47. | 57321 | 11.4% | 6.5%(+4.90)#47 | 11.4%(=0.000)#7,132 |
| 48. | 57033 | 11.3% | 6.5%(+4.80)#48 | 11.4%(-0.100)#7,175 |
| 49. | 57479 | 11.3% | 6.5%(+4.80)#49 | 11.4%(-0.100)#7,203 |
| 50. | 57025 | 11.1% | 6.5%(+4.60)#50 | 11.4%(-0.300)#7,348 |
| 51. | 57367 | 11.1% | 6.5%(+4.60)#51 | 11.4%(-0.300)#7,372 |
| 52. | 57237 | 11.0% | 6.5%(+4.50)#52 | 11.4%(-0.400)#7,460 |
| 53. | 57020 | 10.8% | 6.5%(+4.30)#53 | 11.4%(-0.600)#7,570 |
| 54. | 57005 | 10.7% | 6.5%(+4.20)#54 | 11.4%(-0.700)#7,640 |
| 55. | 57724 | 10.6% | 6.5%(+4.10)#55 | 11.4%(-0.800)#7,765 |
| 56. | 57553 | 10.5% | 6.5%(+4.00)#56 | 11.4%(-0.900)#7,849 |
| 57. | 57252 | 10.4% | 6.5%(+3.90)#57 | 11.4%(-1.000)#7,901 |
| 58. | 57532 | 10.3% | 6.5%(+3.80)#58 | 11.4%(-1.10)#8,000 |
| 59. | 57022 | 10.2% | 6.5%(+3.70)#59 | 11.4%(-1.20)#8,084 |
| 60. | 57312 | 10.1% | 6.5%(+3.60)#60 | 11.4%(-1.30)#8,213 |
| 61. | 57373 | 10.1% | 6.5%(+3.60)#61 | 11.4%(-1.30)#8,218 |
| 62. | 57748 | 10.1% | 6.5%(+3.60)#62 | 11.4%(-1.30)#8,222 |
| 63. | 57649 | 10.1% | 6.5%(+3.60)#63 | 11.4%(-1.30)#8,225 |
| 64. | 57017 | 9.9% | 6.5%(+3.40)#64 | 11.4%(-1.50)#8,405 |
| 65. | 57564 | 9.9% | 6.5%(+3.40)#65 | 11.4%(-1.50)#8,413 |
| 66. | 57046 | 9.9% | 6.5%(+3.40)#66 | 11.4%(-1.50)#8,414 |
| 67. | 57793 | 9.8% | 6.5%(+3.30)#67 | 11.4%(-1.60)#8,498 |
| 68. | 57313 | 9.6% | 6.5%(+3.10)#68 | 11.4%(-1.80)#8,681 |
| 69. | 57034 | 9.6% | 6.5%(+3.10)#69 | 11.4%(-1.80)#8,687 |
| 70. | 57436 | 9.6% | 6.5%(+3.10)#70 | 11.4%(-1.80)#8,694 |
| 71. | 57359 | 9.5% | 6.5%(+3.00)#71 | 11.4%(-1.90)#8,803 |
| 72. | 57251 | 9.3% | 6.5%(+2.80)#72 | 11.4%(-2.10)#9,015 |
| 73. | 57270 | 9.1% | 6.5%(+2.60)#73 | 11.4%(-2.30)#9,183 |
| 74. | 57375 | 9.1% | 6.5%(+2.60)#74 | 11.4%(-2.30)#9,187 |
| 75. | 57051 | 8.9% | 6.5%(+2.40)#75 | 11.4%(-2.50)#9,405 |
| 76. | 57432 | 8.8% | 6.5%(+2.30)#76 | 11.4%(-2.60)#9,503 |
| 77. | 57064 | 8.7% | 6.5%(+2.20)#77 | 11.4%(-2.70)#9,565 |
| 78. | 57551 | 8.7% | 6.5%(+2.20)#78 | 11.4%(-2.70)#9,587 |
| 79. | 57068 | 8.7% | 6.5%(+2.20)#79 | 11.4%(-2.70)#9,591 |
| 80. | 57030 | 8.6% | 6.5%(+2.10)#80 | 11.4%(-2.80)#9,691 |
| 81. | 57224 | 8.6% | 6.5%(+2.10)#81 | 11.4%(-2.80)#9,737 |
| 82. | 57437 | 8.4% | 6.5%(+1.90)#82 | 11.4%(-3.00)#9,941 |
| 83. | 57076 | 8.4% | 6.5%(+1.90)#83 | 11.4%(-3.00)#9,968 |
| 84. | 57058 | 8.3% | 6.5%(+1.80)#84 | 11.4%(-3.10)#10,059 |
| 85. | 57376 | 8.3% | 6.5%(+1.80)#85 | 11.4%(-3.10)#10,084 |
| 86. | 57382 | 8.2% | 6.5%(+1.70)#86 | 11.4%(-3.20)#10,181 |
| 87. | 57256 | 8.2% | 6.5%(+1.70)#87 | 11.4%(-3.20)#10,205 |
| 88. | 57105 | 8.0% | 6.5%(+1.50)#88 | 11.4%(-3.40)#10,370 |
| 89. | 57048 | 8.0% | 6.5%(+1.50)#89 | 11.4%(-3.40)#10,440 |
| 90. | 57331 | 8.0% | 6.5%(+1.50)#90 | 11.4%(-3.40)#10,465 |
| 91. | 57325 | 7.9% | 6.5%(+1.40)#91 | 11.4%(-3.50)#10,547 |
| 92. | 57370 | 7.9% | 6.5%(+1.40)#92 | 11.4%(-3.50)#10,579 |
| 93. | 57330 | 7.9% | 6.5%(+1.40)#93 | 11.4%(-3.50)#10,586 |
| 94. | 57424 | 7.9% | 6.5%(+1.40)#94 | 11.4%(-3.50)#10,596 |
| 95. | 57225 | 7.8% | 6.5%(+1.30)#95 | 11.4%(-3.60)#10,701 |
| 96. | 57227 | 7.8% | 6.5%(+1.30)#96 | 11.4%(-3.60)#10,724 |
| 97. | 57623 | 7.6% | 6.5%(+1.10)#97 | 11.4%(-3.80)#11,003 |
| 98. | 57243 | 7.6% | 6.5%(+1.10)#98 | 11.4%(-3.80)#11,015 |
| 99. | 57445 | 7.5% | 6.5%(+1.000)#99 | 11.4%(-3.90)#11,114 |
| 100. | 57035 | 7.5% | 6.5%(+1.000)#100 | 11.4%(-3.90)#11,128 |
Common Questions
What are the Top 10 Zip Codes with the Highest Percentage of Households with Income Above $200,000 in South Dakota?
Top 10 Zip Codes with the Highest Percentage of Households with Income Above $200,000 in South Dakota are:
What zip code has the Highest Percentage of Households with Income Above $200,000 in South Dakota?
57767 has the Highest Percentage of Households with Income Above $200,000 in South Dakota with 66.3%.
What is the Percentage of Households with Income Above $200,000 in the State of South Dakota?
Percentage of Households with Income Above $200,000 in South Dakota is 6.5%.
What is the Percentage of Households with Income Above $200,000 in the United States?
Percentage of Households with Income Above $200,000 in the United States is 11.4%.