Zip Codes with the Highest Percentage of Population Employed in Sales & Related in Seneca, SC
RELATED REPORTS & OPTIONS
Sales & Related
Seneca
Compare Zip Codes
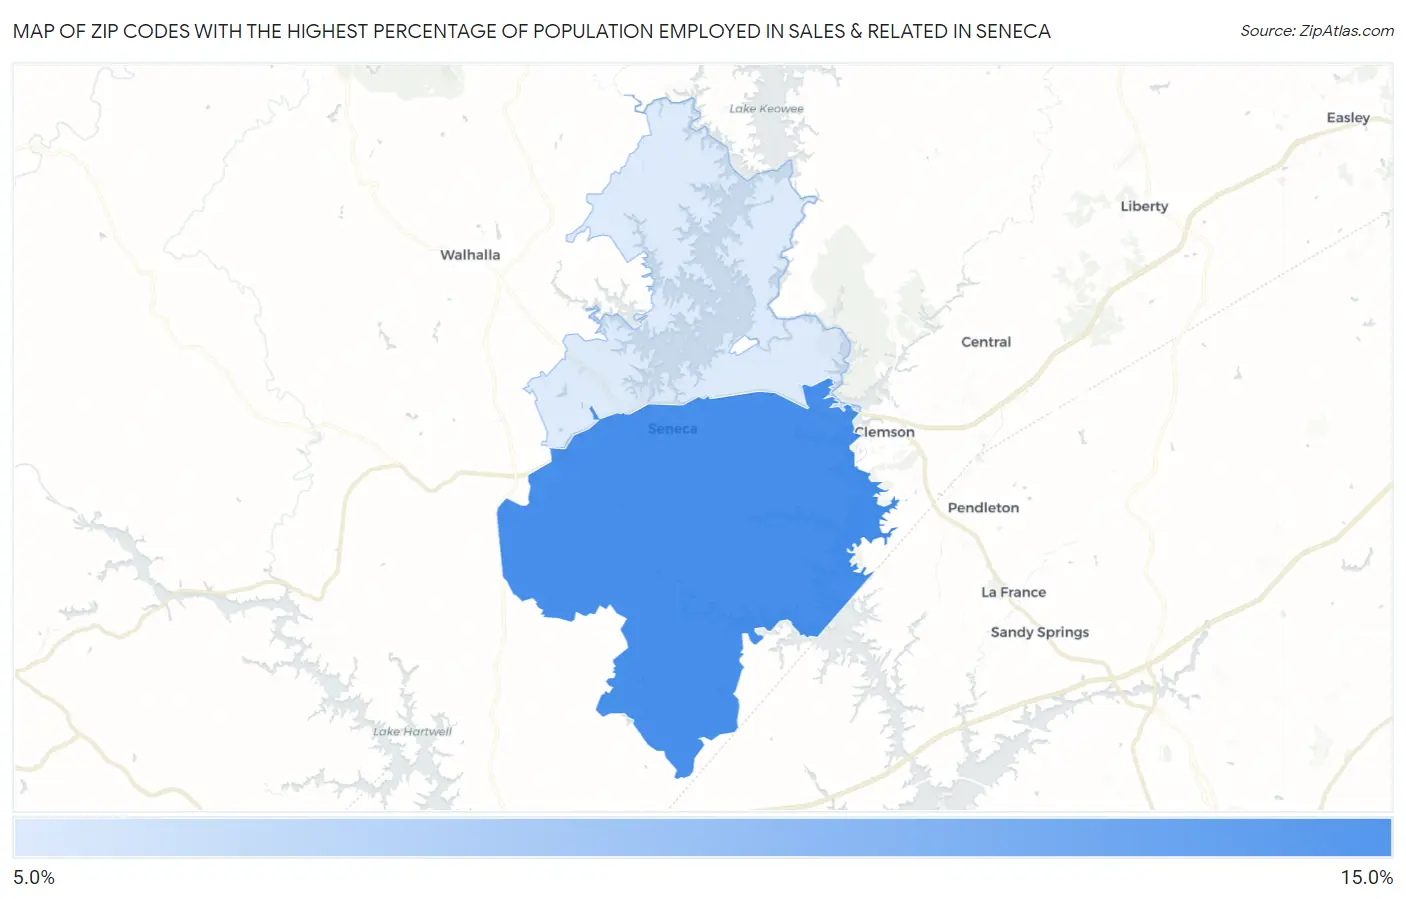
Map of Zip Codes with the Highest Percentage of Population Employed in Sales & Related in Seneca
9.2%
11.7%
Zip Codes with the Highest Percentage of Population Employed in Sales & Related in Seneca, SC
| Zip Code | % Employed | vs State | vs National | |
| 1. | 29678 | 11.7% | 10.4%(+1.36)#109 | 9.6%(+2.15)#6,507 |
| 2. | 29672 | 9.2% | 10.4%(-1.16)#214 | 9.6%(-0.378)#13,719 |
1
Common Questions
What are the Top Zip Codes with the Highest Percentage of Population Employed in Sales & Related in Seneca, SC?
Top Zip Codes with the Highest Percentage of Population Employed in Sales & Related in Seneca, SC are:
What zip code has the Highest Percentage of Population Employed in Sales & Related in Seneca, SC?
29678 has the Highest Percentage of Population Employed in Sales & Related in Seneca, SC with 11.7%.
What is the Percentage of Population Employed in Sales & Related in Seneca, SC?
Percentage of Population Employed in Sales & Related in Seneca is 9.3%.
What is the Percentage of Population Employed in Sales & Related in South Carolina?
Percentage of Population Employed in Sales & Related in South Carolina is 10.4%.
What is the Percentage of Population Employed in Sales & Related in the United States?
Percentage of Population Employed in Sales & Related in the United States is 9.6%.