Clara, MS Map & Demographics
Clara Map
Clara Overview
$25,437
PER CAPITA INCOME
0.51
INEQUALITY / GINI INDEX
597
TOTAL POPULATION
205
MALE POPULATION
392
FEMALE POPULATION
52.30
MALES / 100 FEMALES
191.22
FEMALES / 100 MALES
62.0
MEDIAN AGE
3.6
AVG FAMILY SIZE
2.1
AVG HOUSEHOLD SIZE
290
LABOR FORCE [ PEOPLE ]
49.2%
PERCENT IN LABOR FORCE
Clara Area Codes
Income in Clara
Income Overview in Clara
| Characteristic | Number | Measure |
| Per Capita Income | 597 | $25,437 |
| Median Family Income | 120 | $0 |
| Mean Family Income | 120 | $86,717 |
| Median Household Income | 279 | $0 |
| Mean Household Income | 279 | $46,257 |
| Income Deficit | 120 | $0 |
| Wage / Income Gap (%) | 597 | 0.00% |
| Wage / Income Gap ($) | 597 | 100.00¢ per $1 |
| Gini / Inequality Index | 597 | 0.51 |
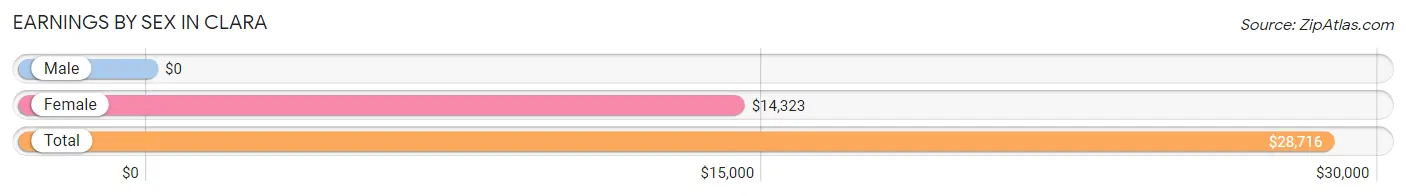
Earnings by Sex in Clara
| Sex | Number | Average Earnings |
| Male | 131 (45.2%) | $0 |
| Female | 159 (54.8%) | $14,323 |
| Total | 290 (100.0%) | $28,716 |
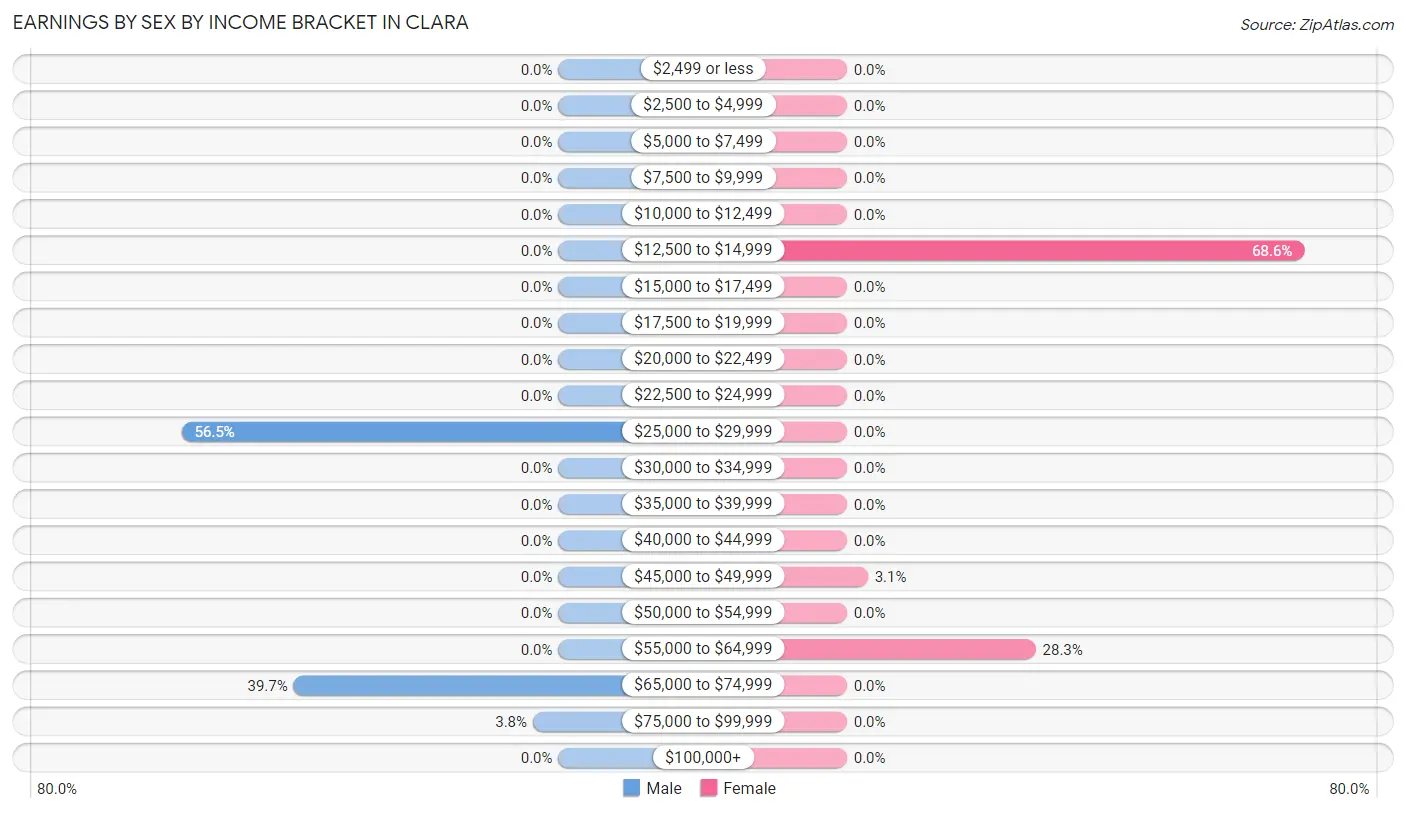
Earnings by Sex by Income Bracket in Clara
The most common earnings brackets in Clara are $25,000 to $29,999 for men (74 | 56.5%) and $12,500 to $14,999 for women (109 | 68.5%).
| Income | Male | Female |
| $2,499 or less | 0 (0.0%) | 0 (0.0%) |
| $2,500 to $4,999 | 0 (0.0%) | 0 (0.0%) |
| $5,000 to $7,499 | 0 (0.0%) | 0 (0.0%) |
| $7,500 to $9,999 | 0 (0.0%) | 0 (0.0%) |
| $10,000 to $12,499 | 0 (0.0%) | 0 (0.0%) |
| $12,500 to $14,999 | 0 (0.0%) | 109 (68.5%) |
| $15,000 to $17,499 | 0 (0.0%) | 0 (0.0%) |
| $17,500 to $19,999 | 0 (0.0%) | 0 (0.0%) |
| $20,000 to $22,499 | 0 (0.0%) | 0 (0.0%) |
| $22,500 to $24,999 | 0 (0.0%) | 0 (0.0%) |
| $25,000 to $29,999 | 74 (56.5%) | 0 (0.0%) |
| $30,000 to $34,999 | 0 (0.0%) | 0 (0.0%) |
| $35,000 to $39,999 | 0 (0.0%) | 0 (0.0%) |
| $40,000 to $44,999 | 0 (0.0%) | 0 (0.0%) |
| $45,000 to $49,999 | 0 (0.0%) | 5 (3.1%) |
| $50,000 to $54,999 | 0 (0.0%) | 0 (0.0%) |
| $55,000 to $64,999 | 0 (0.0%) | 45 (28.3%) |
| $65,000 to $74,999 | 52 (39.7%) | 0 (0.0%) |
| $75,000 to $99,999 | 5 (3.8%) | 0 (0.0%) |
| $100,000+ | 0 (0.0%) | 0 (0.0%) |
| Total | 131 (100.0%) | 159 (100.0%) |
Earnings by Sex by Educational Attainment in Clara
| Educational Attainment | Male Income | Female Income |
| Less than High School | - | - |
| High School Diploma | - | - |
| College or Associate's Degree | - | - |
| Bachelor's Degree | - | - |
| Graduate Degree | - | - |
| Total | - | - |
Family Income in Clara
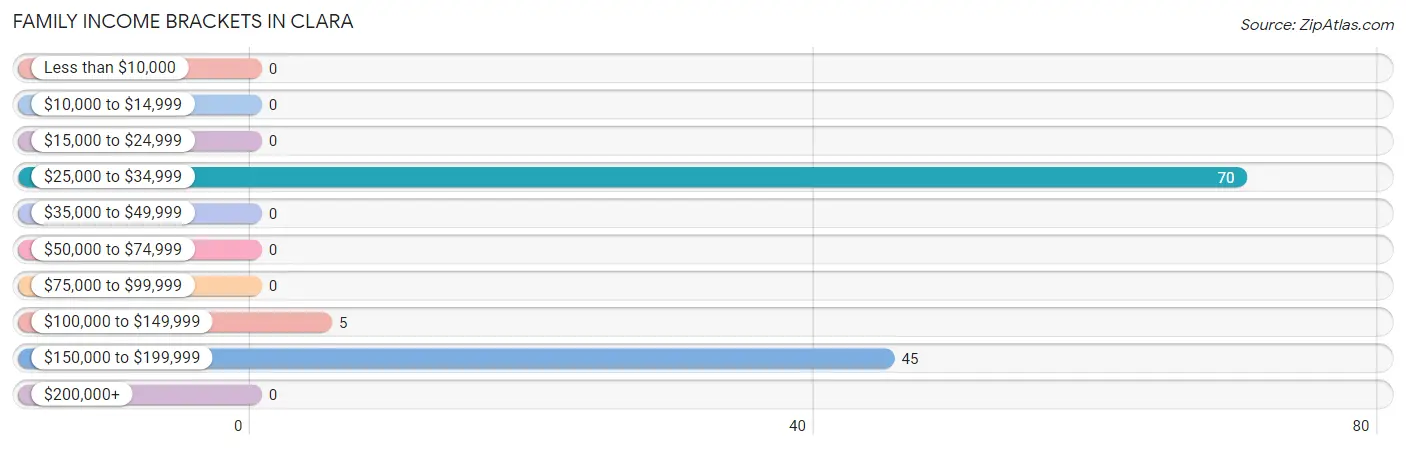
Family Income Brackets in Clara
According to the Clara family income data, there are 70 families falling into the $25,000 to $34,999 income range, which is the most common income bracket and makes up 58.3% of all families.
| Income Bracket | # Families | % Families |
| Less than $10,000 | 0 | 0.0% |
| $10,000 to $14,999 | 0 | 0.0% |
| $15,000 to $24,999 | 0 | 0.0% |
| $25,000 to $34,999 | 70 | 58.3% |
| $35,000 to $49,999 | 0 | 0.0% |
| $50,000 to $74,999 | 0 | 0.0% |
| $75,000 to $99,999 | 0 | 0.0% |
| $100,000 to $149,999 | 5 | 4.2% |
| $150,000 to $199,999 | 45 | 37.5% |
| $200,000+ | 0 | 0.0% |
Family Income by Famaliy Size in Clara
| Income Bracket | # Families | Median Income |
| 2-Person Families | 70 (58.3%) | $0 |
| 3-Person Families | 0 (0.0%) | $0 |
| 4-Person Families | 50 (41.7%) | $0 |
| 5-Person Families | 0 (0.0%) | $0 |
| 6-Person Families | 0 (0.0%) | $0 |
| 7+ Person Families | 0 (0.0%) | $0 |
| Total | 120 (100.0%) | $0 |
Family Income by Number of Earners in Clara
| Number of Earners | # Families | Median Income |
| No Earners | 70 (58.3%) | $0 |
| 1 Earner | 0 (0.0%) | $0 |
| 2 Earners | 5 (4.2%) | $0 |
| 3+ Earners | 45 (37.5%) | $0 |
| Total | 120 (100.0%) | $0 |
Household Income in Clara
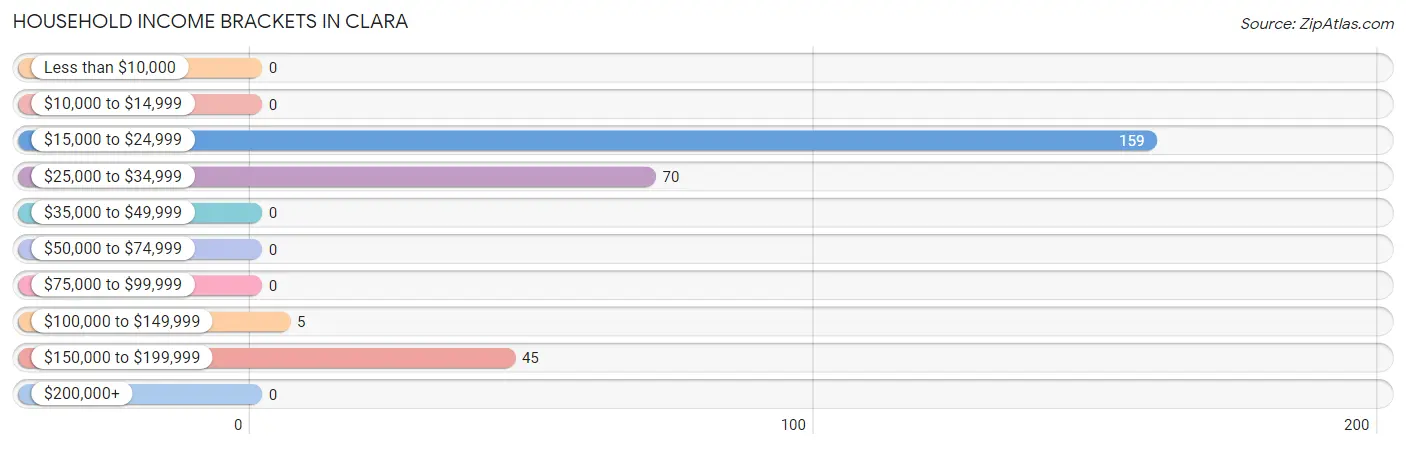
Household Income Brackets in Clara
With 159 households falling in the category, the $15,000 to $24,999 income range is the most frequent in Clara, accounting for 57.0% of all households.
| Income Bracket | # Households | % Households |
| Less than $10,000 | 0 | 0.0% |
| $10,000 to $14,999 | 0 | 0.0% |
| $15,000 to $24,999 | 159 | 57.0% |
| $25,000 to $34,999 | 70 | 25.1% |
| $35,000 to $49,999 | 0 | 0.0% |
| $50,000 to $74,999 | 0 | 0.0% |
| $75,000 to $99,999 | 0 | 0.0% |
| $100,000 to $149,999 | 5 | 1.8% |
| $150,000 to $199,999 | 45 | 16.1% |
| $200,000+ | 0 | 0.0% |
Household Income by Householder Age in Clara
| Income Bracket | # Households | Median Income |
| 15 to 24 Years | 0 (0.0%) | $0 |
| 25 to 44 Years | 0 (0.0%) | $0 |
| 45 to 64 Years | 50 (17.9%) | $0 |
| 65+ Years | 229 (82.1%) | $0 |
| Total | 279 (100.0%) | $0 |
Poverty in Clara
Income Below Poverty by Sex and Age in Clara
| Age Bracket | Male | Female |
| Under 5 Years | 0 (0.0%) | 0 (0.0%) |
| 5 Years | 0 (0.0%) | 0 (0.0%) |
| 6 to 11 Years | 0 (0.0%) | 0 (0.0%) |
| 12 to 14 Years | 0 (0.0%) | 0 (0.0%) |
| 15 Years | 0 (0.0%) | 0 (0.0%) |
| 16 and 17 Years | 0 (0.0%) | 0 (0.0%) |
| 18 to 24 Years | 0 (0.0%) | 0 (0.0%) |
| 25 to 34 Years | 0 (0.0%) | 0 (0.0%) |
| 35 to 44 Years | 0 (0.0%) | 0 (0.0%) |
| 45 to 54 Years | 0 (0.0%) | 0 (0.0%) |
| 55 to 64 Years | 0 (0.0%) | 0 (0.0%) |
| 65 to 74 Years | 0 (0.0%) | 0 (0.0%) |
| 75 Years and over | 0 (0.0%) | 0 (0.0%) |
| Total | 0 (0.0%) | 0 (0.0%) |
Income Above Poverty by Sex and Age in Clara
According to the poverty statistics in Clara, males aged 6 to 11 years and females aged 6 to 11 years are the age groups that are most secure financially, with 100.0% of males and 100.0% of females in these age groups living above the poverty line.
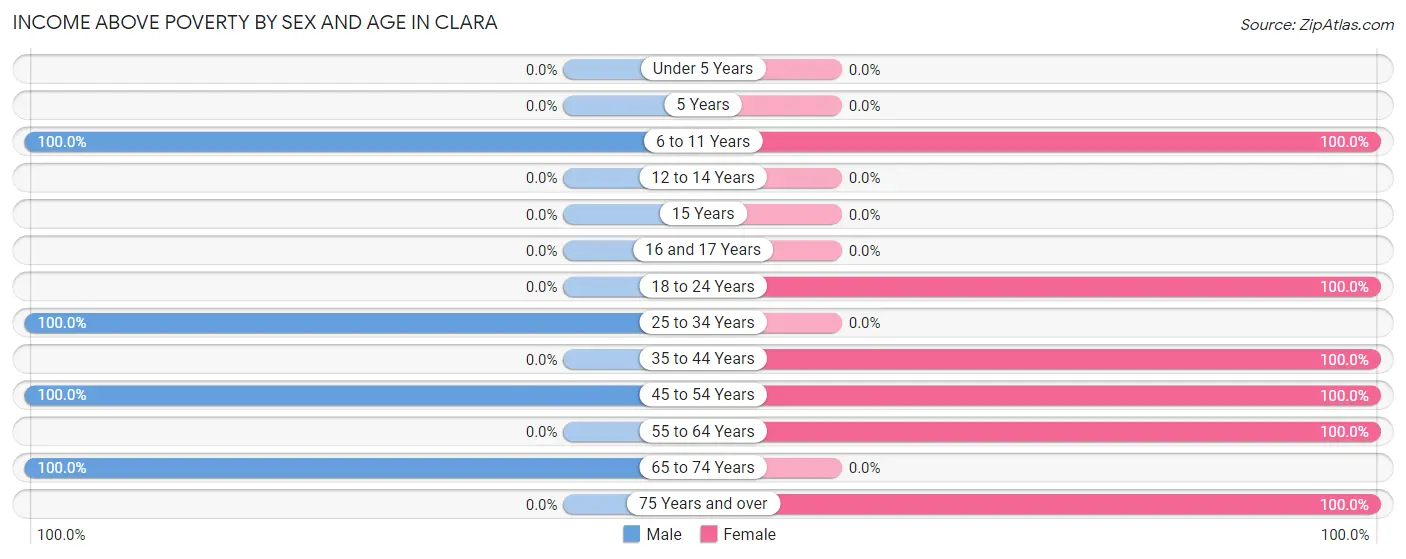
| Age Bracket | Male | Female |
| Under 5 Years | 0 (0.0%) | 0 (0.0%) |
| 5 Years | 0 (0.0%) | 0 (0.0%) |
| 6 to 11 Years | 4 (100.0%) | 4 (100.0%) |
| 12 to 14 Years | 0 (0.0%) | 0 (0.0%) |
| 15 Years | 0 (0.0%) | 0 (0.0%) |
| 16 and 17 Years | 0 (0.0%) | 0 (0.0%) |
| 18 to 24 Years | 0 (0.0%) | 109 (100.0%) |
| 25 to 34 Years | 74 (100.0%) | 0 (0.0%) |
| 35 to 44 Years | 0 (0.0%) | 5 (100.0%) |
| 45 to 54 Years | 57 (100.0%) | 45 (100.0%) |
| 55 to 64 Years | 0 (0.0%) | 70 (100.0%) |
| 65 to 74 Years | 70 (100.0%) | 0 (0.0%) |
| 75 Years and over | 0 (0.0%) | 159 (100.0%) |
| Total | 205 (100.0%) | 392 (100.0%) |
Income Below Poverty Among Married-Couple Families in Clara
| Children | Above Poverty | Below Poverty |
| No Children | 115 (100.0%) | 0 (0.0%) |
| 1 or 2 Children | 5 (100.0%) | 0 (0.0%) |
| 3 or 4 Children | 0 (0.0%) | 0 (0.0%) |
| 5 or more Children | 0 (0.0%) | 0 (0.0%) |
| Total | 120 (100.0%) | 0 (0.0%) |
Income Below Poverty Among Single-Parent Households in Clara
| Children | Single Father | Single Mother |
| No Children | 0 (0.0%) | 0 (0.0%) |
| 1 or 2 Children | 0 (0.0%) | 0 (0.0%) |
| 3 or 4 Children | 0 (0.0%) | 0 (0.0%) |
| 5 or more Children | 0 (0.0%) | 0 (0.0%) |
| Total | 0 (0.0%) | 0 (0.0%) |
Income Below Poverty Among Married-Couple vs Single-Parent Households in Clara
| Children | Married-Couple Families | Single-Parent Households |
| No Children | 0 (0.0%) | 0 (0.0%) |
| 1 or 2 Children | 0 (0.0%) | 0 (0.0%) |
| 3 or 4 Children | 0 (0.0%) | 0 (0.0%) |
| 5 or more Children | 0 (0.0%) | 0 (0.0%) |
| Total | 0 (0.0%) | 0 (0.0%) |
Race in Clara
The most populous races in Clara are , and White / Caucasian (597 | 100.0%).
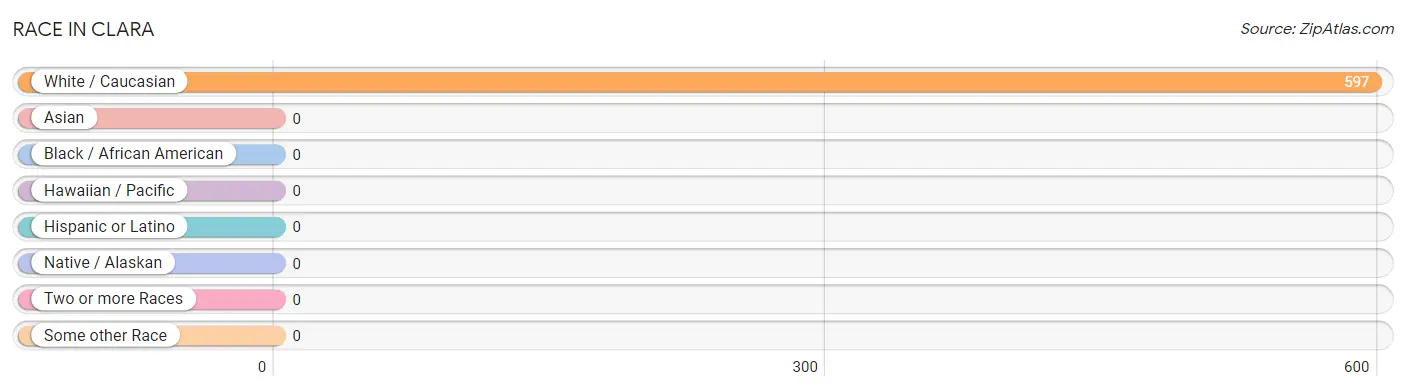
| Race | # Population | % Population |
| Asian | 0 | 0.0% |
| Black / African American | 0 | 0.0% |
| Hawaiian / Pacific | 0 | 0.0% |
| Hispanic or Latino | 0 | 0.0% |
| Native / Alaskan | 0 | 0.0% |
| White / Caucasian | 597 | 100.0% |
| Two or more Races | 0 | 0.0% |
| Some other Race | 0 | 0.0% |
| Total | 597 | 100.0% |
Ancestry in Clara
The most populous ancestries reported in Clara are American (229 | 38.4%), English (75 | 12.6%), and Irish (13 | 2.2%), together accounting for 53.1% of all Clara residents.
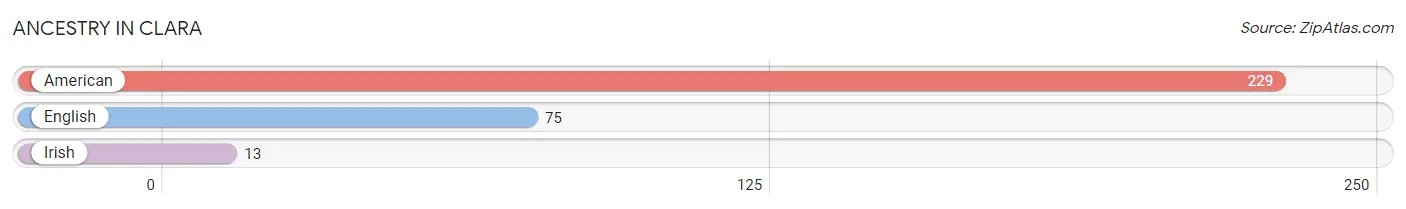
| Ancestry | # Population | % Population |
| American | 229 | 38.4% |
| English | 75 | 12.6% |
| Irish | 13 | 2.2% | View All 3 Rows |
Immigrants in Clara

| Immigration Origin | # Population | % Population | View All 0 Rows |
Sex and Age in Clara
Sex and Age in Clara
The most populous age groups in Clara are 25 to 29 Years (74 | 36.1%) for men and 75 to 79 Years (159 | 40.6%) for women.
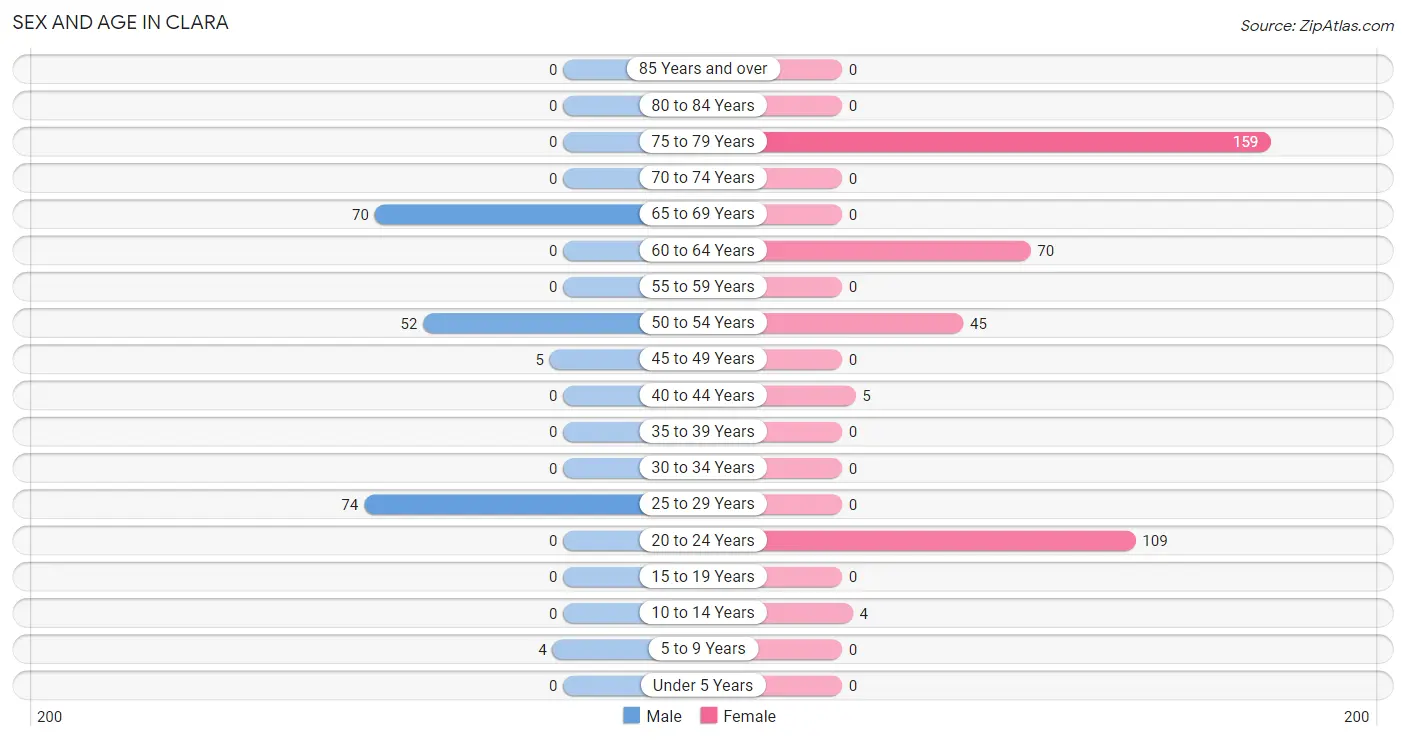
| Age Bracket | Male | Female |
| Under 5 Years | 0 (0.0%) | 0 (0.0%) |
| 5 to 9 Years | 4 (1.9%) | 0 (0.0%) |
| 10 to 14 Years | 0 (0.0%) | 4 (1.0%) |
| 15 to 19 Years | 0 (0.0%) | 0 (0.0%) |
| 20 to 24 Years | 0 (0.0%) | 109 (27.8%) |
| 25 to 29 Years | 74 (36.1%) | 0 (0.0%) |
| 30 to 34 Years | 0 (0.0%) | 0 (0.0%) |
| 35 to 39 Years | 0 (0.0%) | 0 (0.0%) |
| 40 to 44 Years | 0 (0.0%) | 5 (1.3%) |
| 45 to 49 Years | 5 (2.4%) | 0 (0.0%) |
| 50 to 54 Years | 52 (25.4%) | 45 (11.5%) |
| 55 to 59 Years | 0 (0.0%) | 0 (0.0%) |
| 60 to 64 Years | 0 (0.0%) | 70 (17.9%) |
| 65 to 69 Years | 70 (34.2%) | 0 (0.0%) |
| 70 to 74 Years | 0 (0.0%) | 0 (0.0%) |
| 75 to 79 Years | 0 (0.0%) | 159 (40.6%) |
| 80 to 84 Years | 0 (0.0%) | 0 (0.0%) |
| 85 Years and over | 0 (0.0%) | 0 (0.0%) |
| Total | 205 (100.0%) | 392 (100.0%) |
Families and Households in Clara
Median Family Size in Clara
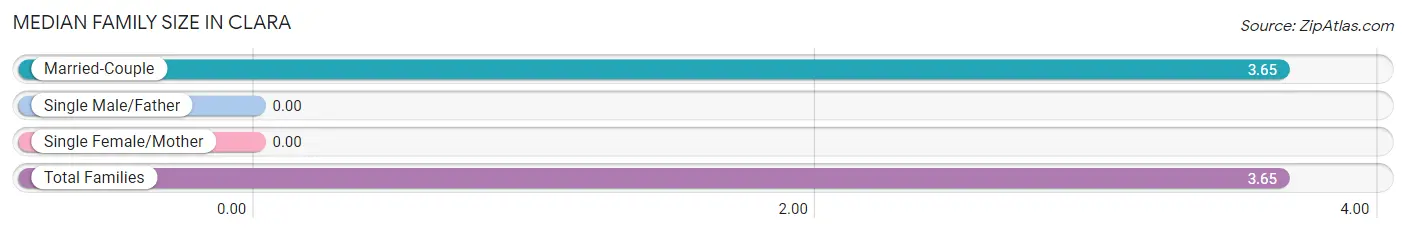
| Family Type | # Families | Family Size |
| Married-Couple | 120 (100.0%) | 3.65 |
| Single Male/Father | 0 (0.0%) | - |
| Single Female/Mother | 0 (0.0%) | - |
| Total Families | 120 (100.0%) | 3.65 |
Median Household Size in Clara
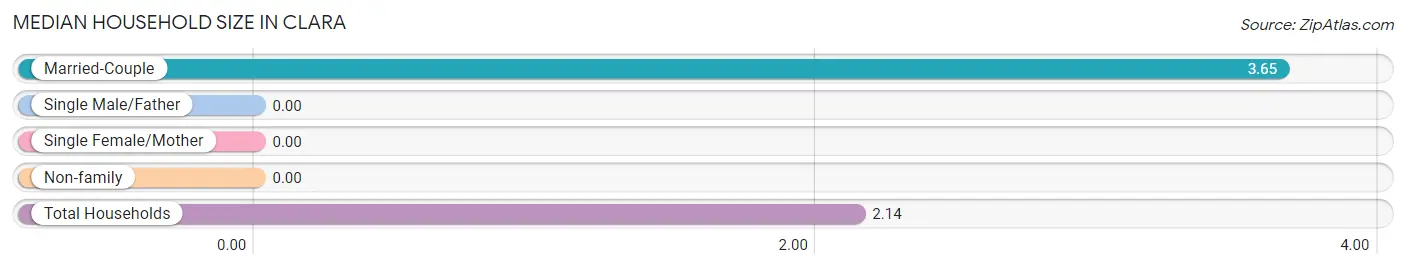
| Household Type | # Households | Household Size |
| Married-Couple | 120 (43.0%) | 3.65 |
| Single Male/Father | 0 (0.0%) | - |
| Single Female/Mother | 0 (0.0%) | - |
| Non-family | 159 (57.0%) | - |
| Total Households | 279 (100.0%) | 2.14 |
Household Size by Marriage Status in Clara
Out of a total of 279 households in Clara, 120 (43.0%) are family households, while 159 (57.0%) are nonfamily households. The most numerous type of family households are 2-person households, comprising 70, and the most common type of nonfamily households are 1-person households, comprising 159.
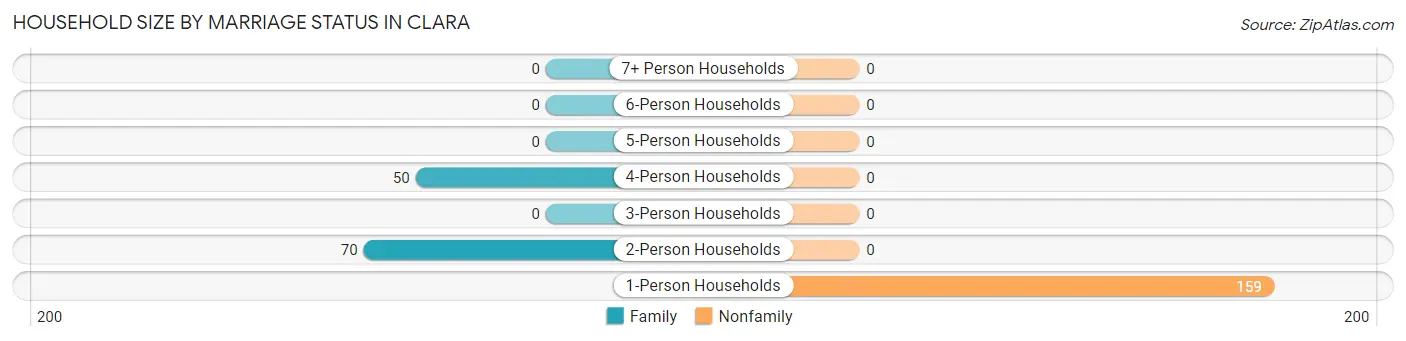
| Household Size | Family Households | Nonfamily Households |
| 1-Person Households | - | 159 (57.0%) |
| 2-Person Households | 70 (25.1%) | 0 (0.0%) |
| 3-Person Households | 0 (0.0%) | 0 (0.0%) |
| 4-Person Households | 50 (17.9%) | 0 (0.0%) |
| 5-Person Households | 0 (0.0%) | 0 (0.0%) |
| 6-Person Households | 0 (0.0%) | 0 (0.0%) |
| 7+ Person Households | 0 (0.0%) | 0 (0.0%) |
| Total | 120 (43.0%) | 159 (57.0%) |
Female Fertility in Clara
Fertility by Age in Clara
| Age Bracket | Women with Births | Births / 1,000 Women |
| 15 to 19 years | 0 (0.0%) | 0.0 |
| 20 to 34 years | 0 (0.0%) | 0.0 |
| 35 to 50 years | 0 (0.0%) | 0.0 |
| Total | 0 (0.0%) | 0.0 |
Fertility by Age by Marriage Status in Clara
| Age Bracket | Married | Unmarried |
| 15 to 19 years | 0 (0.0%) | 0 (0.0%) |
| 20 to 34 years | 0 (0.0%) | 0 (0.0%) |
| 35 to 50 years | 0 (0.0%) | 0 (0.0%) |
| Total | 0 (0.0%) | 0 (0.0%) |
Fertility by Education in Clara
| Educational Attainment | Women with Births | Births / 1,000 Women |
| Less than High School | 0 (0.0%) | 0.0 |
| High School Diploma | 0 (0.0%) | 0.0 |
| College or Associate's Degree | 0 (0.0%) | 0.0 |
| Bachelor's Degree | 0 (0.0%) | 0.0 |
| Graduate Degree | 0 (0.0%) | 0.0 |
| Total | 0 (0.0%) | 0.0 |
Fertility by Education by Marriage Status in Clara
| Educational Attainment | Married | Unmarried |
| Less than High School | 0 (0.0%) | 0 (0.0%) |
| High School Diploma | 0 (0.0%) | 0 (0.0%) |
| College or Associate's Degree | 0 (0.0%) | 0 (0.0%) |
| Bachelor's Degree | 0 (0.0%) | 0 (0.0%) |
| Graduate Degree | 0 (0.0%) | 0 (0.0%) |
| Total | 0 (0.0%) | 0 (0.0%) |
Employment Characteristics in Clara
Employment by Class of Employer in Clara
Among the 290 employed individuals in Clara, private company employees (171 | 59.0%), and state government employees (119 | 41.0%) make up the most common classes of employment.
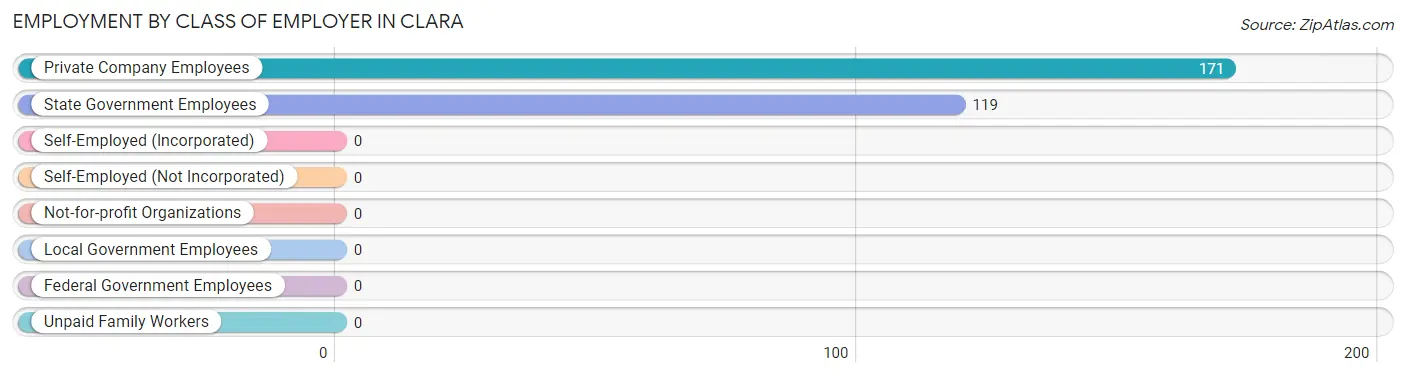
| Employer Class | # Employees | % Employees |
| Private Company Employees | 171 | 59.0% |
| Self-Employed (Incorporated) | 0 | 0.0% |
| Self-Employed (Not Incorporated) | 0 | 0.0% |
| Not-for-profit Organizations | 0 | 0.0% |
| Local Government Employees | 0 | 0.0% |
| State Government Employees | 119 | 41.0% |
| Federal Government Employees | 0 | 0.0% |
| Unpaid Family Workers | 0 | 0.0% |
| Total | 290 | 100.0% |
Employment Status by Age in Clara
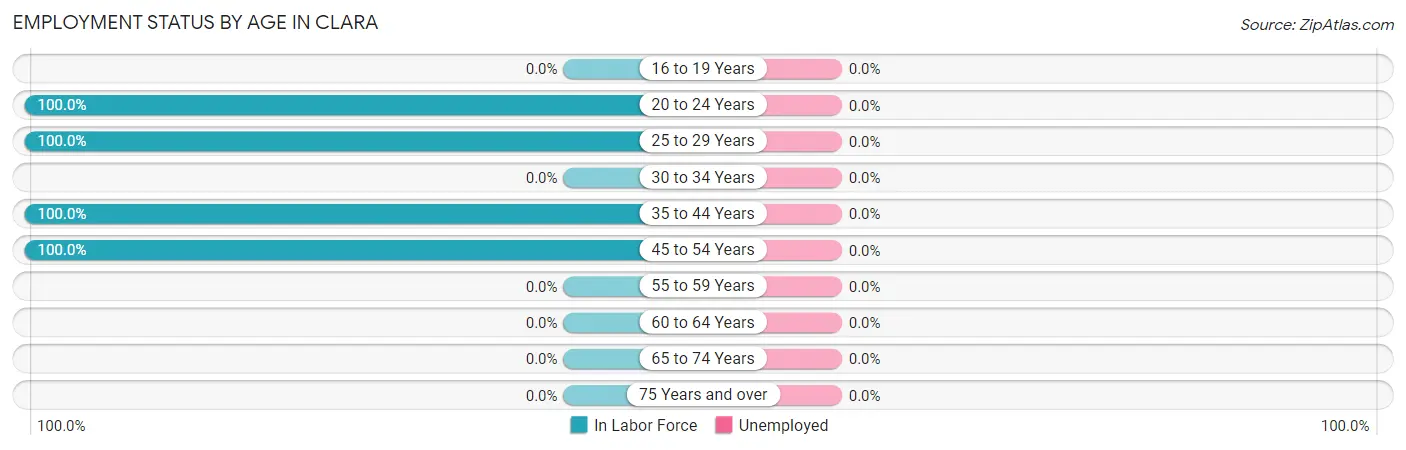
| Age Bracket | In Labor Force | Unemployed |
| 16 to 19 Years | 0 (0.0%) | 0 (0.0%) |
| 20 to 24 Years | 109 (100.0%) | 0 (0.0%) |
| 25 to 29 Years | 74 (100.0%) | 0 (0.0%) |
| 30 to 34 Years | 0 (0.0%) | 0 (0.0%) |
| 35 to 44 Years | 5 (100.0%) | 0 (0.0%) |
| 45 to 54 Years | 102 (100.0%) | 0 (0.0%) |
| 55 to 59 Years | 0 (0.0%) | 0 (0.0%) |
| 60 to 64 Years | 0 (0.0%) | 0 (0.0%) |
| 65 to 74 Years | 0 (0.0%) | 0 (0.0%) |
| 75 Years and over | 0 (0.0%) | 0 (0.0%) |
| Total | 290 (49.2%) | 0 (0.0%) |
Employment Status by Educational Attainment in Clara
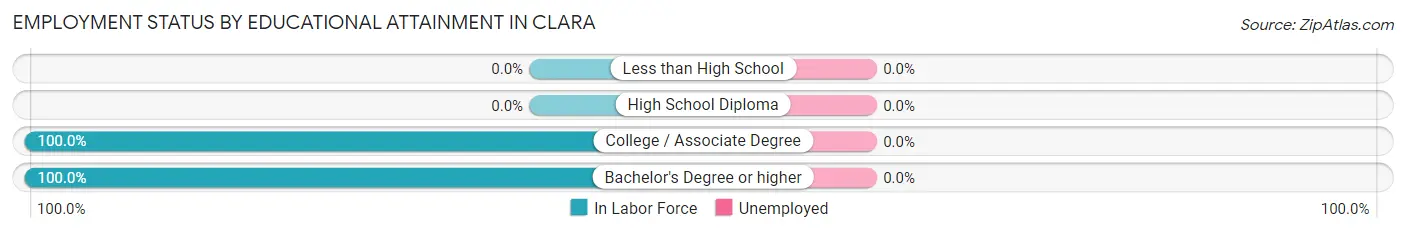
| Educational Attainment | In Labor Force | Unemployed |
| Less than High School | 0 (0.0%) | 0 (0.0%) |
| High School Diploma | 0 (0.0%) | 0 (0.0%) |
| College / Associate Degree | 52 (100.0%) | 0 (0.0%) |
| Bachelor's Degree or higher | 129 (100.0%) | 0 (0.0%) |
| Total | 181 (72.1%) | 0 (0.0%) |
Employment Occupations by Sex in Clara
Management, Business, Science and Arts Occupations
The most common Management, Business, Science and Arts occupations in Clara are Community & Social Service (45 | 15.5%), Education Instruction & Library (45 | 15.5%), Management (5 | 1.7%), Health Diagnosing & Treating (5 | 1.7%), and Health Technologists (5 | 1.7%).
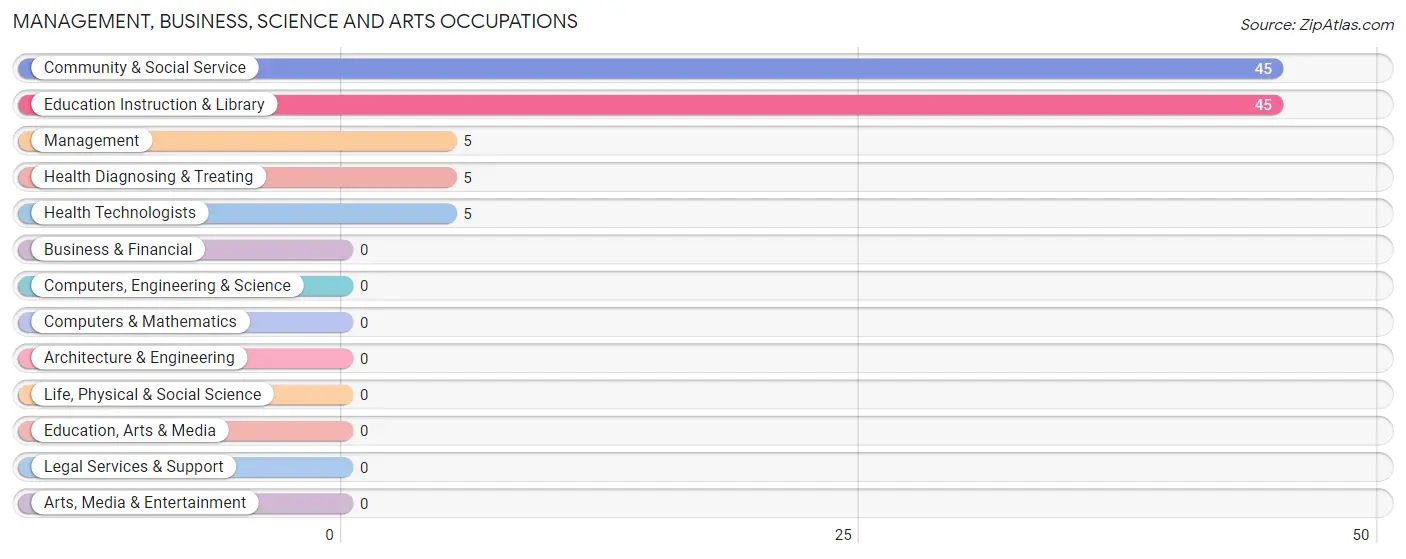
Management, Business, Science and Arts Occupations by Sex
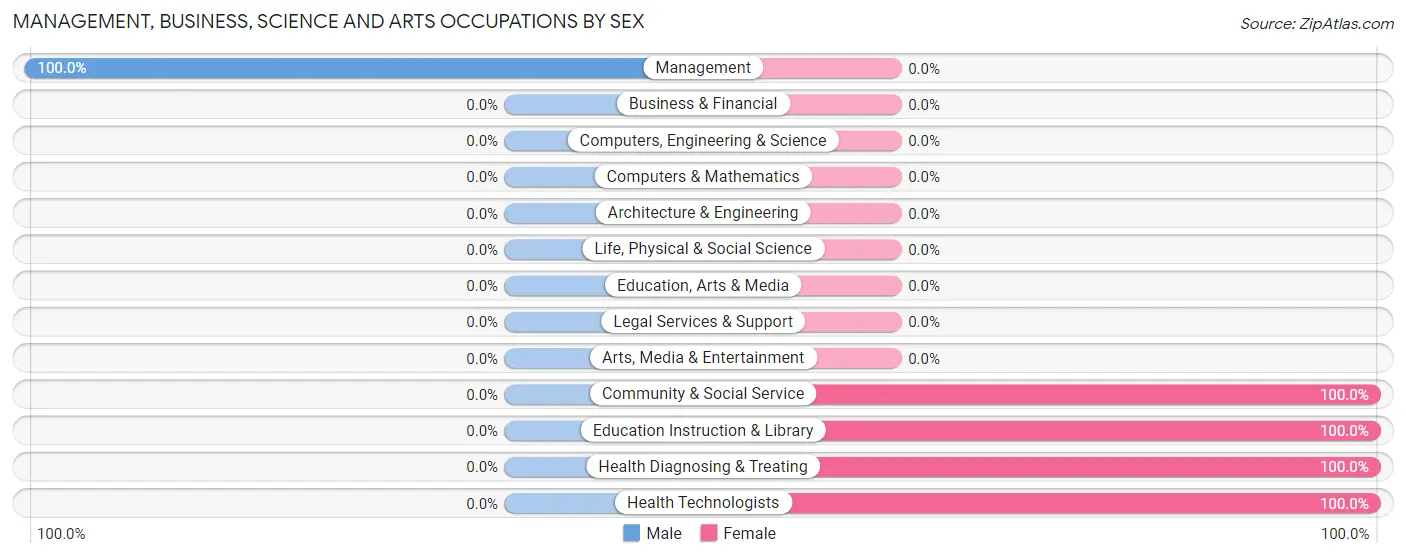
| Occupation | Male | Female |
| Management | 5 (100.0%) | 0 (0.0%) |
| Business & Financial | 0 (0.0%) | 0 (0.0%) |
| Computers, Engineering & Science | 0 (0.0%) | 0 (0.0%) |
| Computers & Mathematics | 0 (0.0%) | 0 (0.0%) |
| Architecture & Engineering | 0 (0.0%) | 0 (0.0%) |
| Life, Physical & Social Science | 0 (0.0%) | 0 (0.0%) |
| Community & Social Service | 0 (0.0%) | 45 (100.0%) |
| Education, Arts & Media | 0 (0.0%) | 0 (0.0%) |
| Legal Services & Support | 0 (0.0%) | 0 (0.0%) |
| Education Instruction & Library | 0 (0.0%) | 45 (100.0%) |
| Arts, Media & Entertainment | 0 (0.0%) | 0 (0.0%) |
| Health Diagnosing & Treating | 0 (0.0%) | 5 (100.0%) |
| Health Technologists | 0 (0.0%) | 5 (100.0%) |
| Total (Category) | 5 (9.1%) | 50 (90.9%) |
| Total (Overall) | 131 (45.2%) | 159 (54.8%) |
Services Occupations
Services Occupations by Sex
| Occupation | Male | Female |
| Healthcare Support | 0 (0.0%) | 0 (0.0%) |
| Security & Protection | 0 (0.0%) | 0 (0.0%) |
| Firefighting & Prevention | 0 (0.0%) | 0 (0.0%) |
| Law Enforcement | 0 (0.0%) | 0 (0.0%) |
| Food Preparation & Serving | 0 (0.0%) | 0 (0.0%) |
| Cleaning & Maintenance | 0 (0.0%) | 0 (0.0%) |
| Personal Care & Service | 0 (0.0%) | 0 (0.0%) |
| Total (Category) | 0 (0.0%) | 0 (0.0%) |
| Total (Overall) | 131 (45.2%) | 159 (54.8%) |
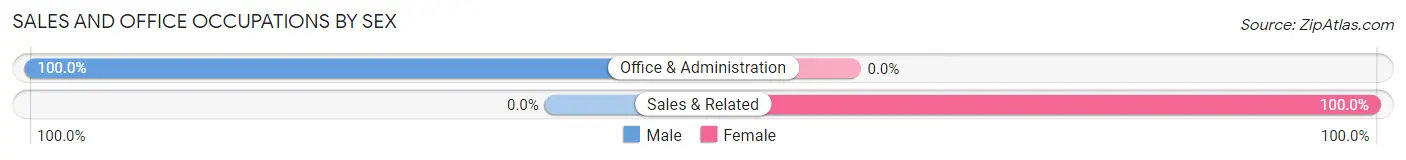
Sales and Office Occupations
The most common Sales and Office occupations in Clara are Office & Administration (126 | 43.4%), and Sales & Related (109 | 37.6%).
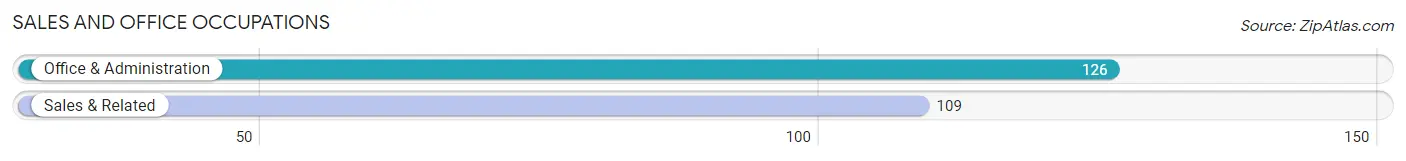
Sales and Office Occupations by Sex
| Occupation | Male | Female |
| Sales & Related | 0 (0.0%) | 109 (100.0%) |
| Office & Administration | 126 (100.0%) | 0 (0.0%) |
| Total (Category) | 126 (53.6%) | 109 (46.4%) |
| Total (Overall) | 131 (45.2%) | 159 (54.8%) |
Natural Resources, Construction and Maintenance Occupations
Natural Resources, Construction and Maintenance Occupations by Sex
| Occupation | Male | Female |
| Farming, Fishing & Forestry | 0 (0.0%) | 0 (0.0%) |
| Construction & Extraction | 0 (0.0%) | 0 (0.0%) |
| Installation, Maintenance & Repair | 0 (0.0%) | 0 (0.0%) |
| Total (Category) | 0 (0.0%) | 0 (0.0%) |
| Total (Overall) | 131 (45.2%) | 159 (54.8%) |
Production, Transportation and Moving Occupations
Production, Transportation and Moving Occupations by Sex
| Occupation | Male | Female |
| Production | 0 (0.0%) | 0 (0.0%) |
| Transportation | 0 (0.0%) | 0 (0.0%) |
| Material Moving | 0 (0.0%) | 0 (0.0%) |
| Total (Category) | 0 (0.0%) | 0 (0.0%) |
| Total (Overall) | 131 (45.2%) | 159 (54.8%) |
Employment Industries by Sex in Clara
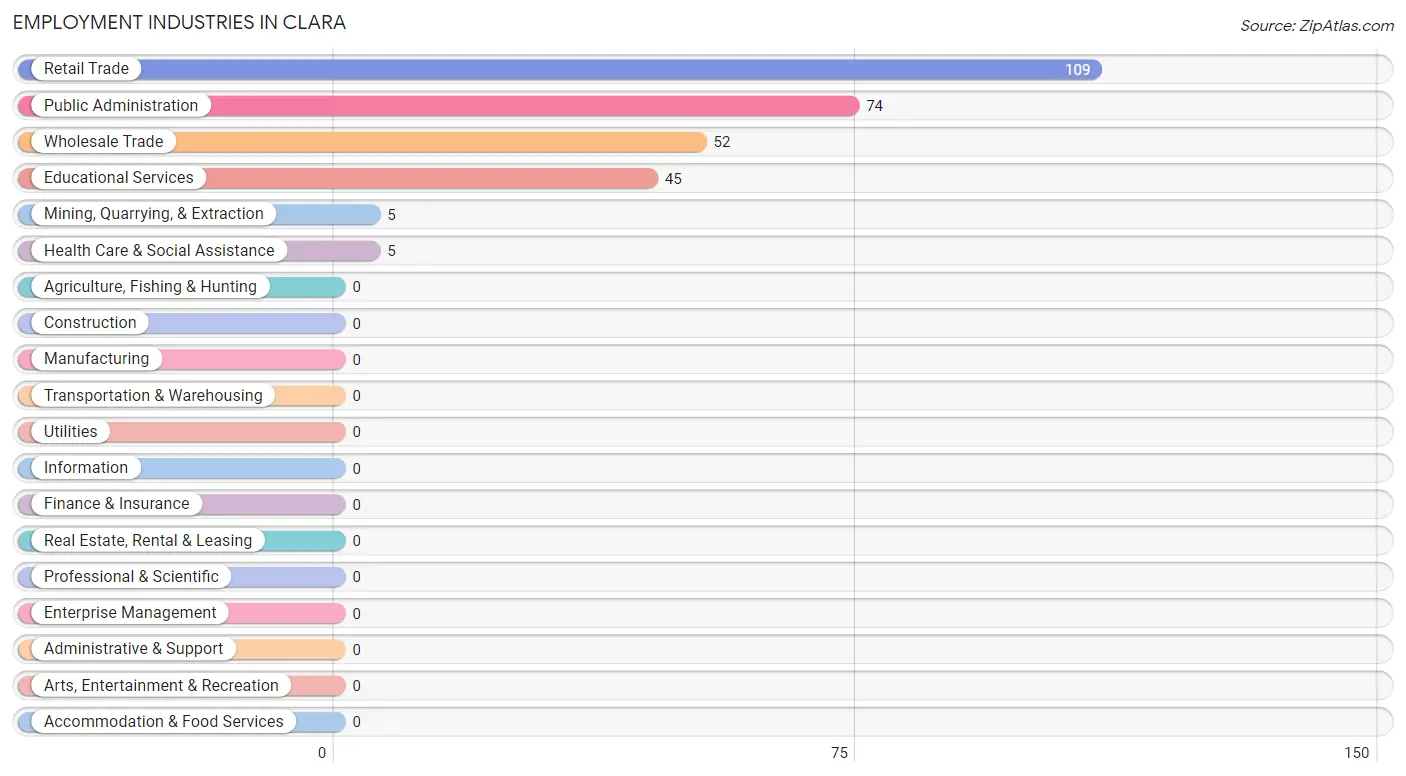
Employment Industries in Clara
The major employment industries in Clara include Retail Trade (109 | 37.6%), Public Administration (74 | 25.5%), Wholesale Trade (52 | 17.9%), Educational Services (45 | 15.5%), and Mining, Quarrying, & Extraction (5 | 1.7%).
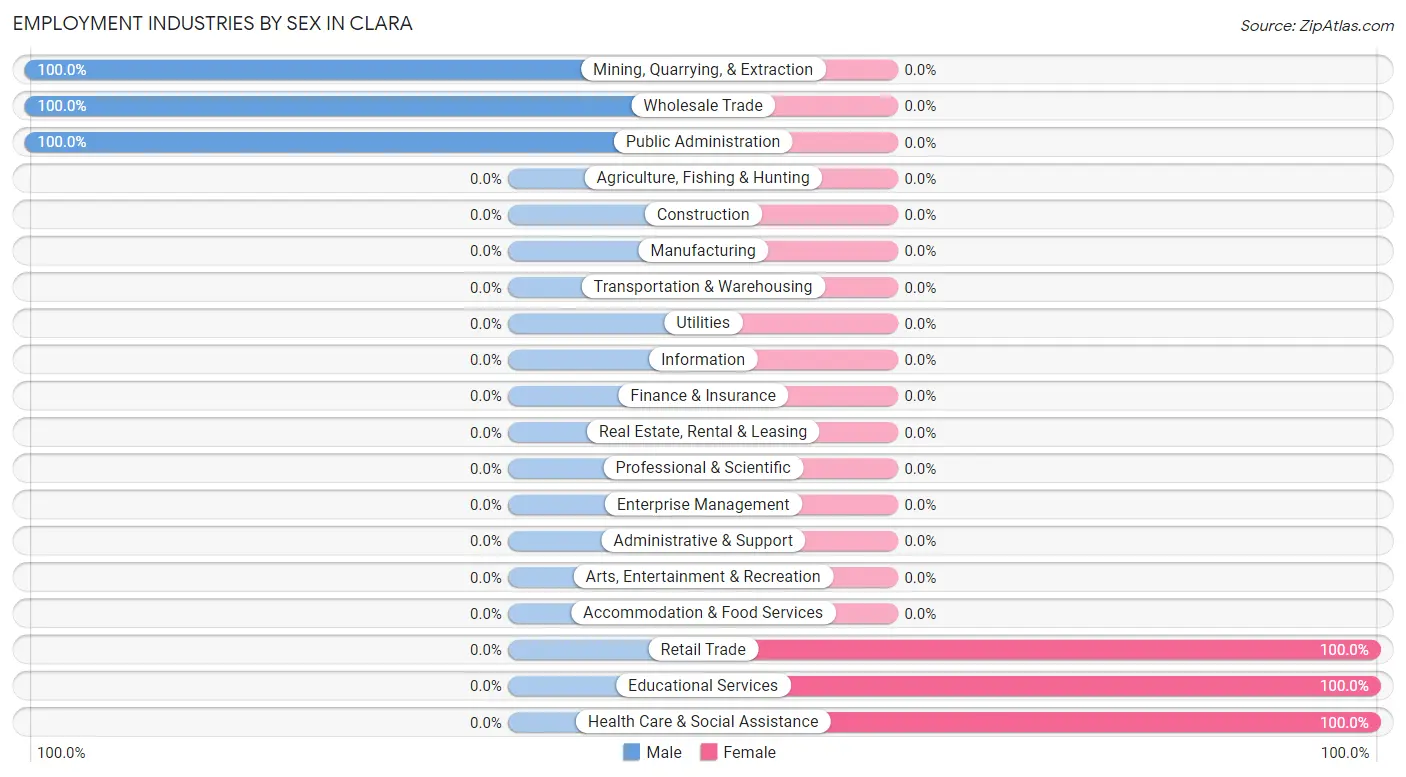
Employment Industries by Sex in Clara
The Clara industries that see more men than women are Mining, Quarrying, & Extraction (100.0%), Wholesale Trade (100.0%), and Public Administration (100.0%), whereas the industries that tend to have a higher number of women are Retail Trade (100.0%), Educational Services (100.0%), and Health Care & Social Assistance (100.0%).
| Industry | Male | Female |
| Agriculture, Fishing & Hunting | 0 (0.0%) | 0 (0.0%) |
| Mining, Quarrying, & Extraction | 5 (100.0%) | 0 (0.0%) |
| Construction | 0 (0.0%) | 0 (0.0%) |
| Manufacturing | 0 (0.0%) | 0 (0.0%) |
| Wholesale Trade | 52 (100.0%) | 0 (0.0%) |
| Retail Trade | 0 (0.0%) | 109 (100.0%) |
| Transportation & Warehousing | 0 (0.0%) | 0 (0.0%) |
| Utilities | 0 (0.0%) | 0 (0.0%) |
| Information | 0 (0.0%) | 0 (0.0%) |
| Finance & Insurance | 0 (0.0%) | 0 (0.0%) |
| Real Estate, Rental & Leasing | 0 (0.0%) | 0 (0.0%) |
| Professional & Scientific | 0 (0.0%) | 0 (0.0%) |
| Enterprise Management | 0 (0.0%) | 0 (0.0%) |
| Administrative & Support | 0 (0.0%) | 0 (0.0%) |
| Educational Services | 0 (0.0%) | 45 (100.0%) |
| Health Care & Social Assistance | 0 (0.0%) | 5 (100.0%) |
| Arts, Entertainment & Recreation | 0 (0.0%) | 0 (0.0%) |
| Accommodation & Food Services | 0 (0.0%) | 0 (0.0%) |
| Public Administration | 74 (100.0%) | 0 (0.0%) |
| Total | 131 (45.2%) | 159 (54.8%) |
Education in Clara
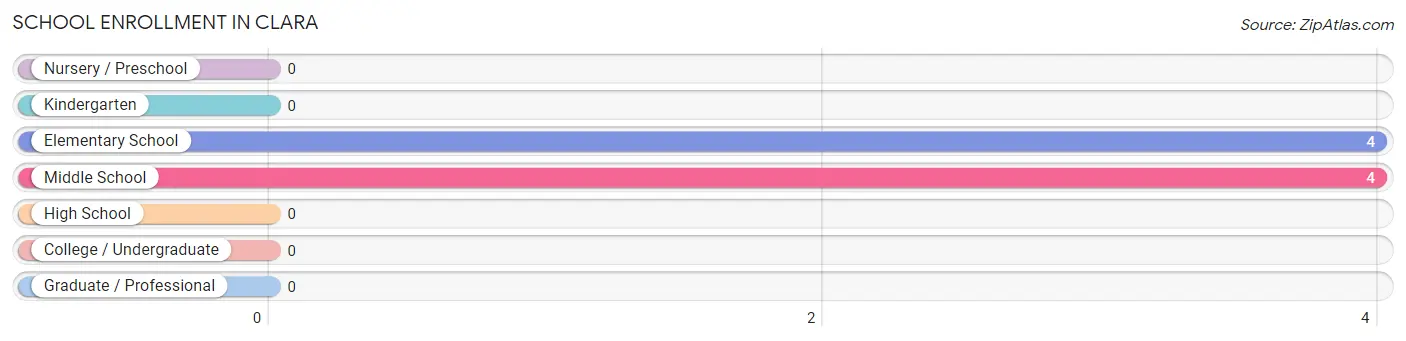
School Enrollment in Clara
The most common levels of schooling among the 8 students in Clara are elementary school (4 | 50.0%), and middle school (4 | 50.0%).
| School Level | # Students | % Students |
| Nursery / Preschool | 0 | 0.0% |
| Kindergarten | 0 | 0.0% |
| Elementary School | 4 | 50.0% |
| Middle School | 4 | 50.0% |
| High School | 0 | 0.0% |
| College / Undergraduate | 0 | 0.0% |
| Graduate / Professional | 0 | 0.0% |
| Total | 8 | 100.0% |
School Enrollment by Age by Funding Source in Clara
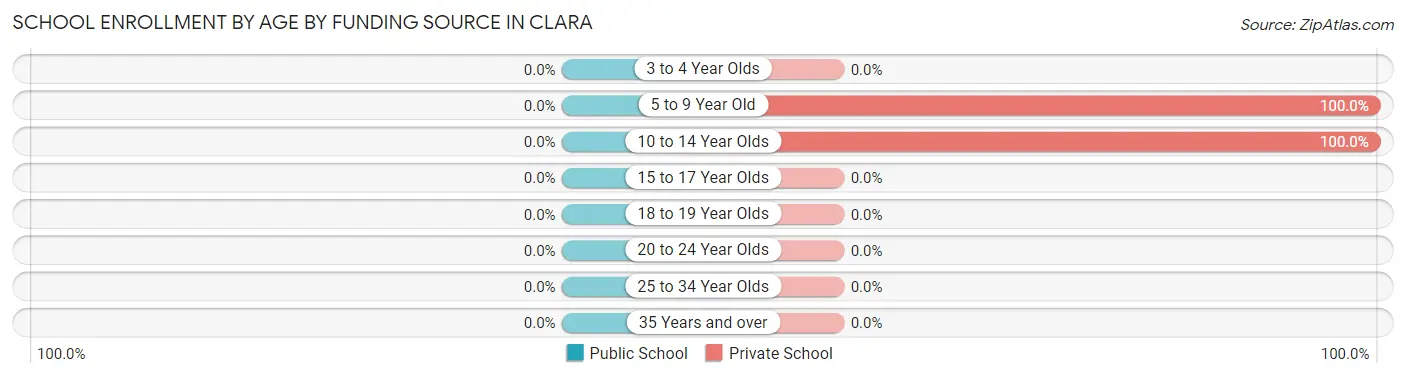
| Age Bracket | Public School | Private School |
| 3 to 4 Year Olds | 0 (0.0%) | 0 (0.0%) |
| 5 to 9 Year Old | 0 (0.0%) | 4 (100.0%) |
| 10 to 14 Year Olds | 0 (0.0%) | 4 (100.0%) |
| 15 to 17 Year Olds | 0 (0.0%) | 0 (0.0%) |
| 18 to 19 Year Olds | 0 (0.0%) | 0 (0.0%) |
| 20 to 24 Year Olds | 0 (0.0%) | 0 (0.0%) |
| 25 to 34 Year Olds | 0 (0.0%) | 0 (0.0%) |
| 35 Years and over | 0 (0.0%) | 0 (0.0%) |
| Total | 0 (0.0%) | 8 (100.0%) |
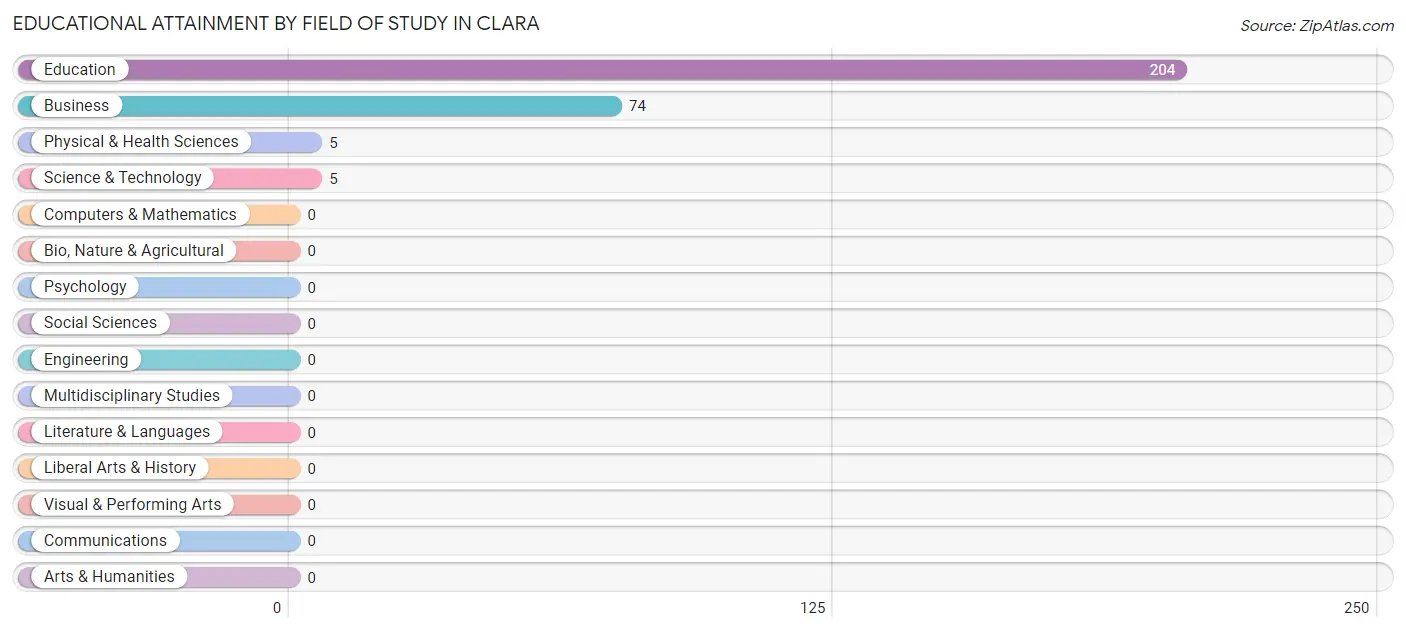
Educational Attainment by Field of Study in Clara
Education (204 | 70.8%), business (74 | 25.7%), physical & health sciences (5 | 1.7%), and science & technology (5 | 1.7%) are the most common fields of study among 288 individuals in Clara who have obtained a bachelor's degree or higher.
| Field of Study | # Graduates | % Graduates |
| Computers & Mathematics | 0 | 0.0% |
| Bio, Nature & Agricultural | 0 | 0.0% |
| Physical & Health Sciences | 5 | 1.7% |
| Psychology | 0 | 0.0% |
| Social Sciences | 0 | 0.0% |
| Engineering | 0 | 0.0% |
| Multidisciplinary Studies | 0 | 0.0% |
| Science & Technology | 5 | 1.7% |
| Business | 74 | 25.7% |
| Education | 204 | 70.8% |
| Literature & Languages | 0 | 0.0% |
| Liberal Arts & History | 0 | 0.0% |
| Visual & Performing Arts | 0 | 0.0% |
| Communications | 0 | 0.0% |
| Arts & Humanities | 0 | 0.0% |
| Total | 288 | 100.0% |
Transportation & Commute in Clara
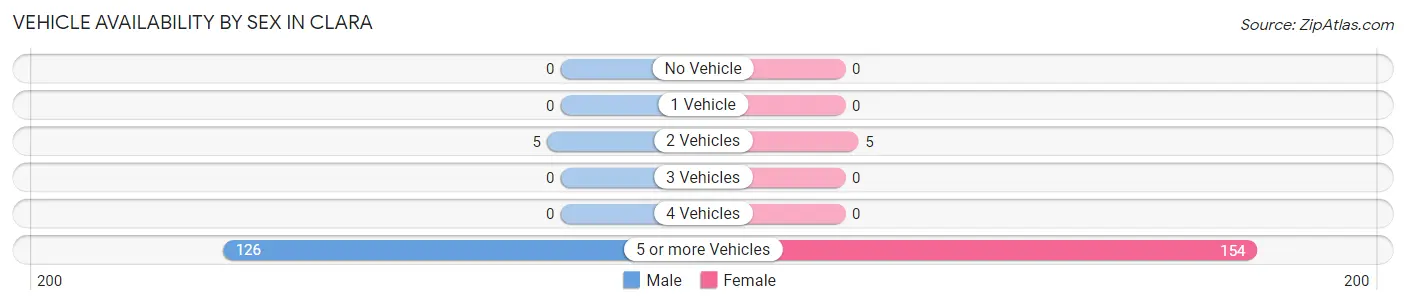
Vehicle Availability by Sex in Clara
The most prevalent vehicle ownership categories in Clara are males with 5 or more vehicles (126, accounting for 96.2%) and females with 5 or more vehicles (154, making up 79.2%).
| Vehicles Available | Male | Female |
| No Vehicle | 0 (0.0%) | 0 (0.0%) |
| 1 Vehicle | 0 (0.0%) | 0 (0.0%) |
| 2 Vehicles | 5 (3.8%) | 5 (3.1%) |
| 3 Vehicles | 0 (0.0%) | 0 (0.0%) |
| 4 Vehicles | 0 (0.0%) | 0 (0.0%) |
| 5 or more Vehicles | 126 (96.2%) | 154 (96.9%) |
| Total | 131 (100.0%) | 159 (100.0%) |
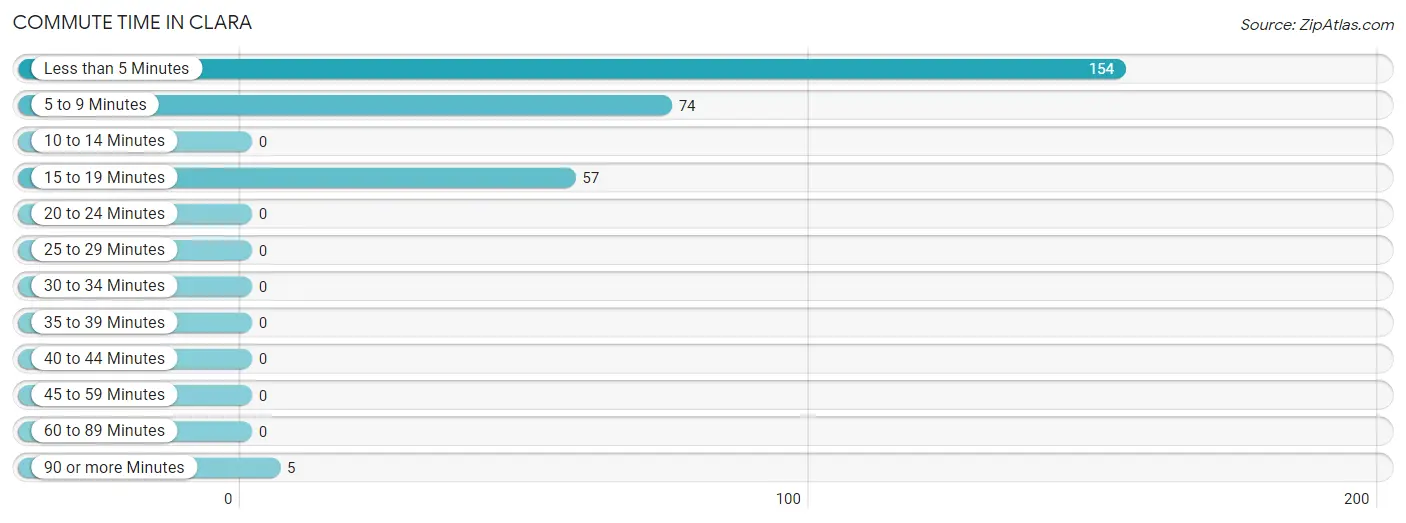
Commute Time in Clara
The most frequently occuring commute durations in Clara are less than 5 minutes (154 commuters, 53.1%), 5 to 9 minutes (74 commuters, 25.5%), and 15 to 19 minutes (57 commuters, 19.7%).
| Commute Time | # Commuters | % Commuters |
| Less than 5 Minutes | 154 | 53.1% |
| 5 to 9 Minutes | 74 | 25.5% |
| 10 to 14 Minutes | 0 | 0.0% |
| 15 to 19 Minutes | 57 | 19.7% |
| 20 to 24 Minutes | 0 | 0.0% |
| 25 to 29 Minutes | 0 | 0.0% |
| 30 to 34 Minutes | 0 | 0.0% |
| 35 to 39 Minutes | 0 | 0.0% |
| 40 to 44 Minutes | 0 | 0.0% |
| 45 to 59 Minutes | 0 | 0.0% |
| 60 to 89 Minutes | 0 | 0.0% |
| 90 or more Minutes | 5 | 1.7% |
Commute Time by Sex in Clara
The most common commute times in Clara are 5 to 9 minutes (74 commuters, 56.5%) for males and less than 5 minutes (154 commuters, 96.9%) for females.
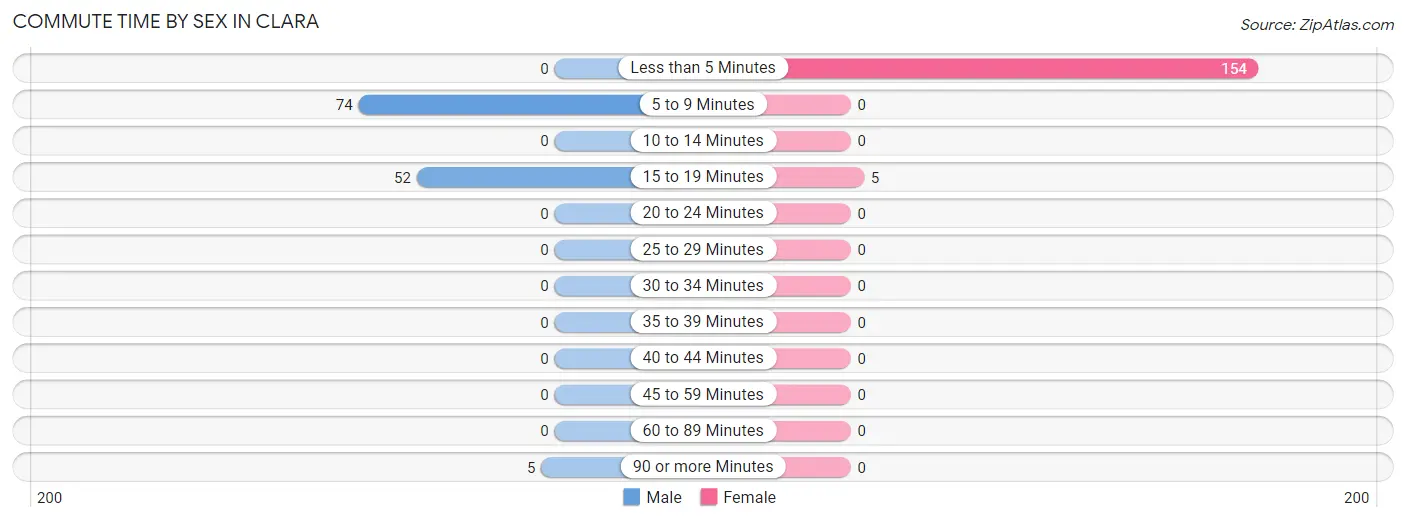
| Commute Time | Male | Female |
| Less than 5 Minutes | 0 (0.0%) | 154 (96.9%) |
| 5 to 9 Minutes | 74 (56.5%) | 0 (0.0%) |
| 10 to 14 Minutes | 0 (0.0%) | 0 (0.0%) |
| 15 to 19 Minutes | 52 (39.7%) | 5 (3.1%) |
| 20 to 24 Minutes | 0 (0.0%) | 0 (0.0%) |
| 25 to 29 Minutes | 0 (0.0%) | 0 (0.0%) |
| 30 to 34 Minutes | 0 (0.0%) | 0 (0.0%) |
| 35 to 39 Minutes | 0 (0.0%) | 0 (0.0%) |
| 40 to 44 Minutes | 0 (0.0%) | 0 (0.0%) |
| 45 to 59 Minutes | 0 (0.0%) | 0 (0.0%) |
| 60 to 89 Minutes | 0 (0.0%) | 0 (0.0%) |
| 90 or more Minutes | 5 (3.8%) | 0 (0.0%) |
Time of Departure to Work by Sex in Clara
The most frequent times of departure to work in Clara are 7:30 AM to 7:59 AM (74, 56.5%) for males and 6:30 AM to 6:59 AM (159, 100.0%) for females.
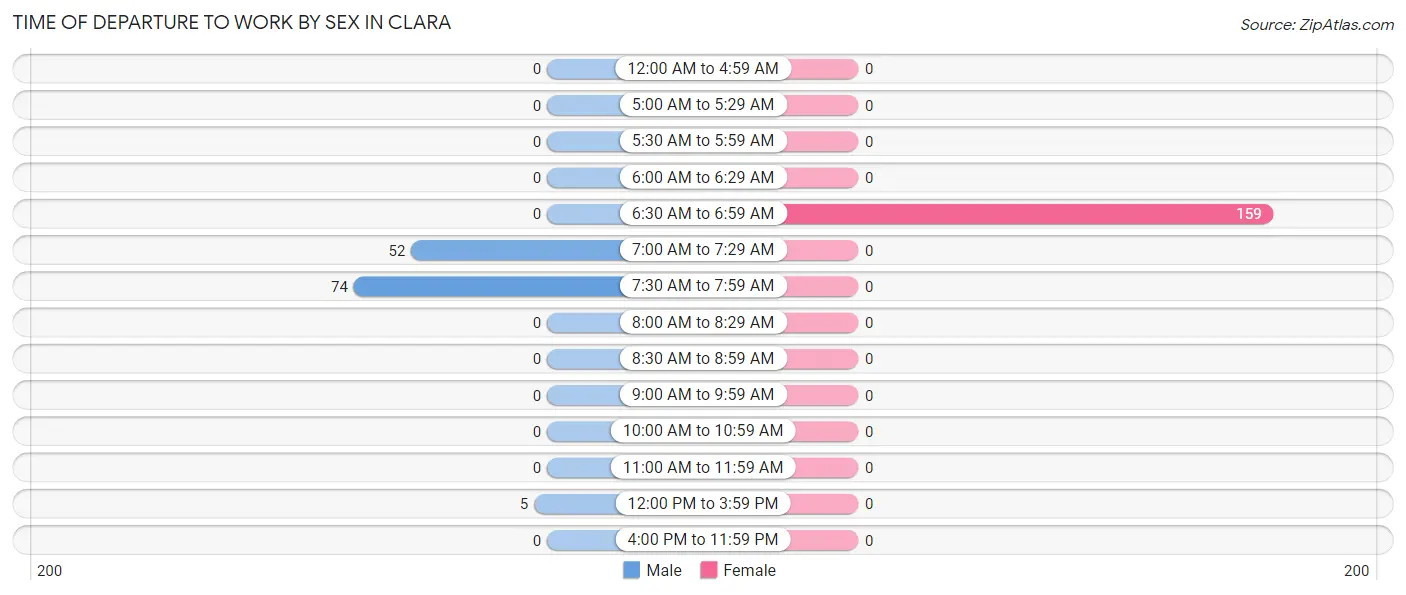
| Time of Departure | Male | Female |
| 12:00 AM to 4:59 AM | 0 (0.0%) | 0 (0.0%) |
| 5:00 AM to 5:29 AM | 0 (0.0%) | 0 (0.0%) |
| 5:30 AM to 5:59 AM | 0 (0.0%) | 0 (0.0%) |
| 6:00 AM to 6:29 AM | 0 (0.0%) | 0 (0.0%) |
| 6:30 AM to 6:59 AM | 0 (0.0%) | 159 (100.0%) |
| 7:00 AM to 7:29 AM | 52 (39.7%) | 0 (0.0%) |
| 7:30 AM to 7:59 AM | 74 (56.5%) | 0 (0.0%) |
| 8:00 AM to 8:29 AM | 0 (0.0%) | 0 (0.0%) |
| 8:30 AM to 8:59 AM | 0 (0.0%) | 0 (0.0%) |
| 9:00 AM to 9:59 AM | 0 (0.0%) | 0 (0.0%) |
| 10:00 AM to 10:59 AM | 0 (0.0%) | 0 (0.0%) |
| 11:00 AM to 11:59 AM | 0 (0.0%) | 0 (0.0%) |
| 12:00 PM to 3:59 PM | 5 (3.8%) | 0 (0.0%) |
| 4:00 PM to 11:59 PM | 0 (0.0%) | 0 (0.0%) |
| Total | 131 (100.0%) | 159 (100.0%) |
Housing Occupancy in Clara
Occupancy by Ownership in Clara
Of the total 279 dwellings in Clara, owner-occupied units account for 279 (100.0%), while renter-occupied units make up 0 (0.0%).
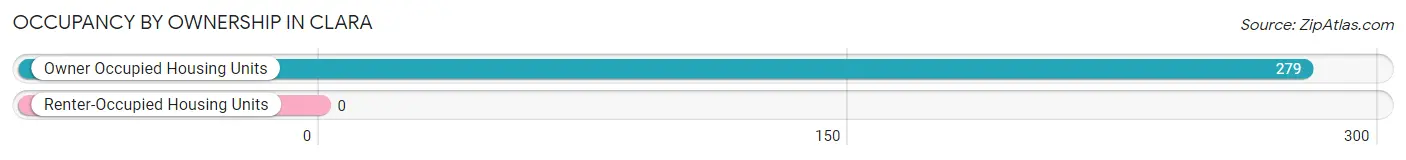
| Occupancy | # Housing Units | % Housing Units |
| Owner Occupied Housing Units | 279 | 100.0% |
| Renter-Occupied Housing Units | 0 | 0.0% |
| Total Occupied Housing Units | 279 | 100.0% |
Occupancy by Household Size in Clara
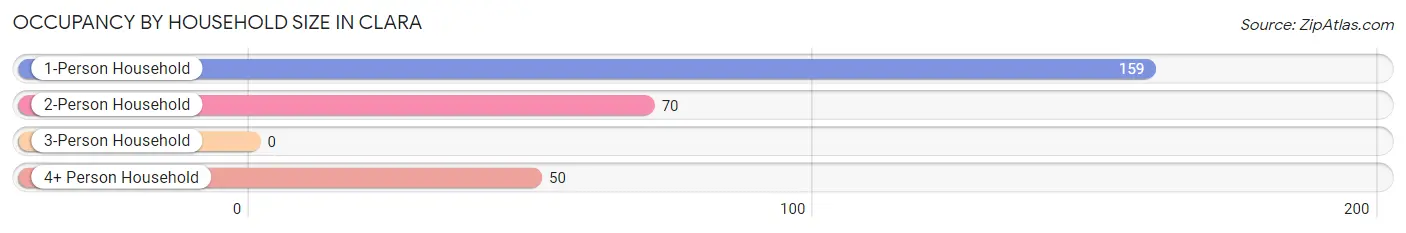
| Household Size | # Housing Units | % Housing Units |
| 1-Person Household | 159 | 57.0% |
| 2-Person Household | 70 | 25.1% |
| 3-Person Household | 0 | 0.0% |
| 4+ Person Household | 50 | 17.9% |
| Total Housing Units | 279 | 100.0% |
Occupancy by Ownership by Household Size in Clara
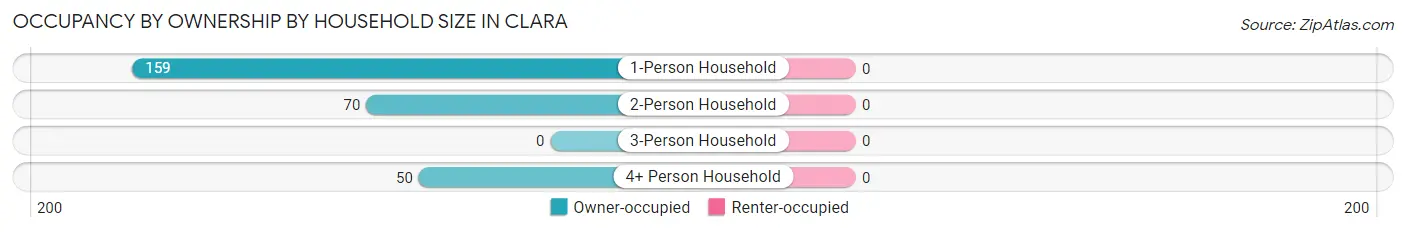
| Household Size | Owner-occupied | Renter-occupied |
| 1-Person Household | 159 (100.0%) | 0 (0.0%) |
| 2-Person Household | 70 (100.0%) | 0 (0.0%) |
| 3-Person Household | 0 (0.0%) | 0 (0.0%) |
| 4+ Person Household | 50 (100.0%) | 0 (0.0%) |
| Total Housing Units | 279 (100.0%) | 0 (0.0%) |
Occupancy by Educational Attainment in Clara
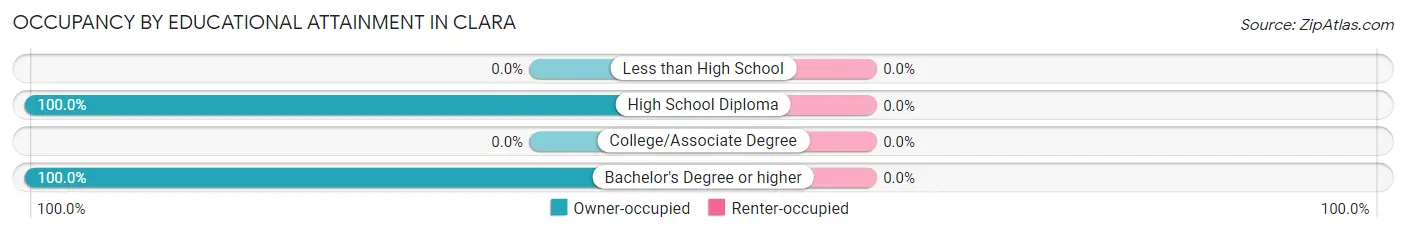
| Household Size | Owner-occupied | Renter-occupied |
| Less than High School | 0 (0.0%) | 0 (0.0%) |
| High School Diploma | 70 (100.0%) | 0 (0.0%) |
| College/Associate Degree | 0 (0.0%) | 0 (0.0%) |
| Bachelor's Degree or higher | 209 (100.0%) | 0 (0.0%) |
Occupancy by Age of Householder in Clara
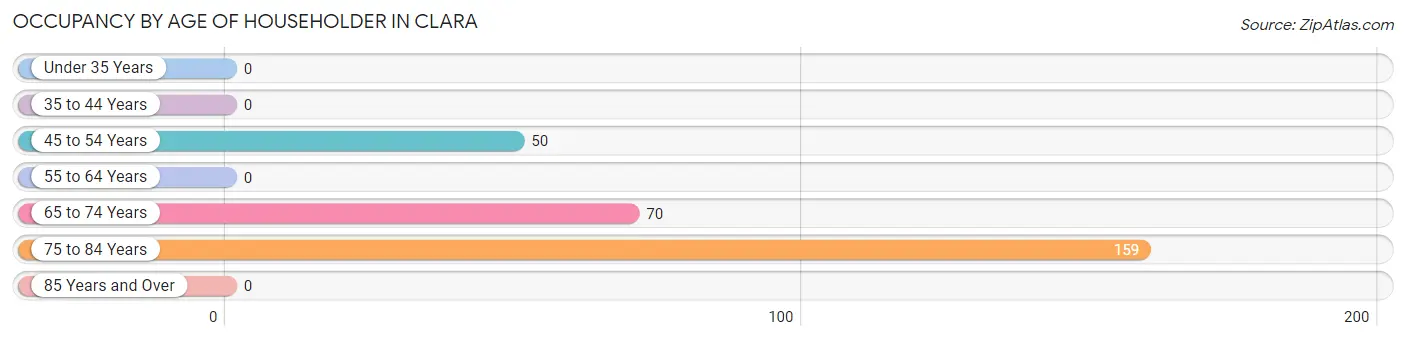
| Age Bracket | # Households | % Households |
| Under 35 Years | 0 | 0.0% |
| 35 to 44 Years | 0 | 0.0% |
| 45 to 54 Years | 50 | 17.9% |
| 55 to 64 Years | 0 | 0.0% |
| 65 to 74 Years | 70 | 25.1% |
| 75 to 84 Years | 159 | 57.0% |
| 85 Years and Over | 0 | 0.0% |
| Total | 279 | 100.0% |
Housing Finances in Clara
Median Income by Occupancy in Clara
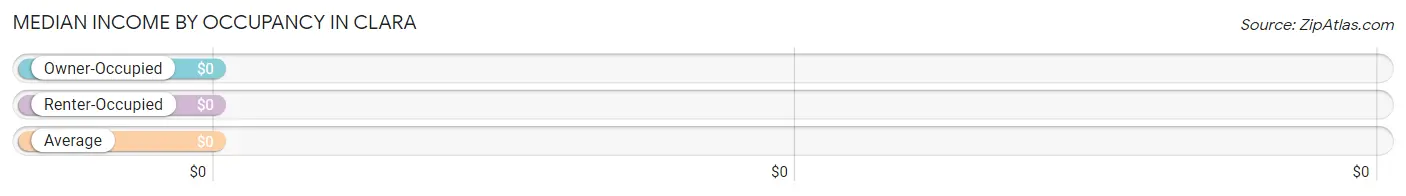
| Occupancy Type | # Households | Median Income |
| Owner-Occupied | 279 (100.0%) | $0 |
| Renter-Occupied | 0 (0.0%) | $0 |
| Average | 279 (100.0%) | $0 |
Occupancy by Householder Income Bracket in Clara
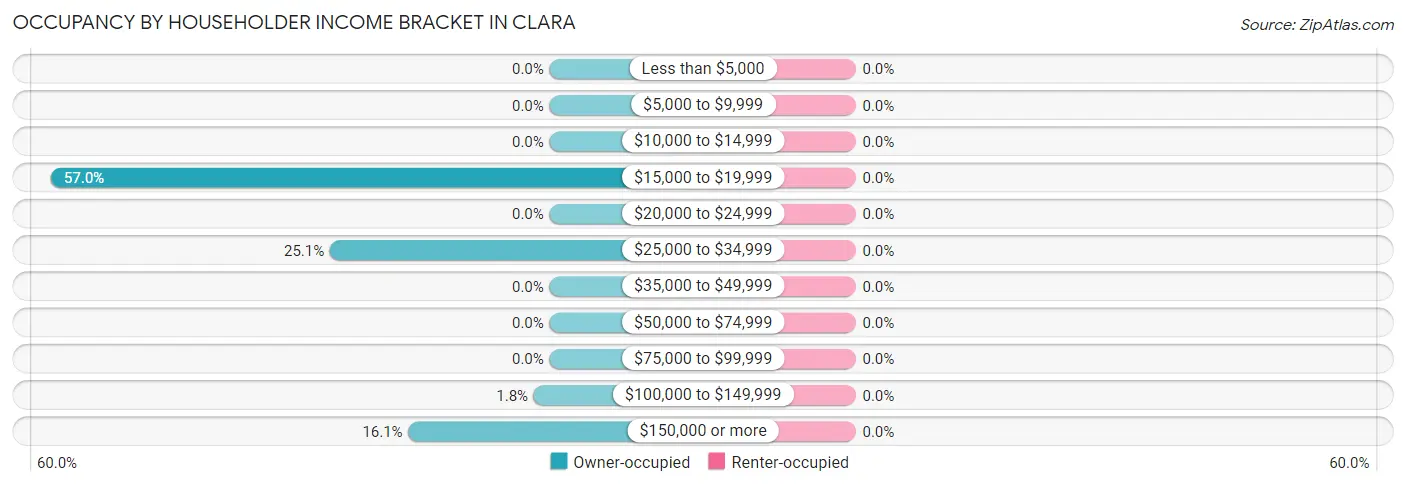
| Income Bracket | Owner-occupied | Renter-occupied |
| Less than $5,000 | 0 (0.0%) | 0 (0.0%) |
| $5,000 to $9,999 | 0 (0.0%) | 0 (0.0%) |
| $10,000 to $14,999 | 0 (0.0%) | 0 (0.0%) |
| $15,000 to $19,999 | 159 (57.0%) | 0 (0.0%) |
| $20,000 to $24,999 | 0 (0.0%) | 0 (0.0%) |
| $25,000 to $34,999 | 70 (25.1%) | 0 (0.0%) |
| $35,000 to $49,999 | 0 (0.0%) | 0 (0.0%) |
| $50,000 to $74,999 | 0 (0.0%) | 0 (0.0%) |
| $75,000 to $99,999 | 0 (0.0%) | 0 (0.0%) |
| $100,000 to $149,999 | 5 (1.8%) | 0 (0.0%) |
| $150,000 or more | 45 (16.1%) | 0 (0.0%) |
| Total | 279 (100.0%) | 0 (0.0%) |
Monthly Housing Cost Tiers in Clara
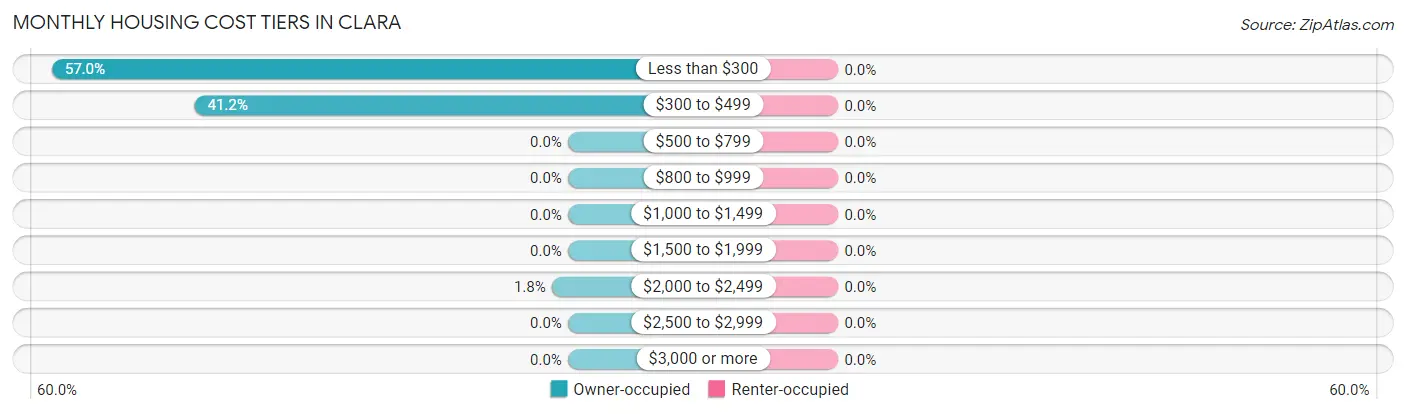
| Monthly Cost | Owner-occupied | Renter-occupied |
| Less than $300 | 159 (57.0%) | 0 (0.0%) |
| $300 to $499 | 115 (41.2%) | 0 (0.0%) |
| $500 to $799 | 0 (0.0%) | 0 (0.0%) |
| $800 to $999 | 0 (0.0%) | 0 (0.0%) |
| $1,000 to $1,499 | 0 (0.0%) | 0 (0.0%) |
| $1,500 to $1,999 | 0 (0.0%) | 0 (0.0%) |
| $2,000 to $2,499 | 5 (1.8%) | 0 (0.0%) |
| $2,500 to $2,999 | 0 (0.0%) | 0 (0.0%) |
| $3,000 or more | 0 (0.0%) | 0 (0.0%) |
| Total | 279 (100.0%) | 0 (0.0%) |
Physical Housing Characteristics in Clara
Housing Structures in Clara
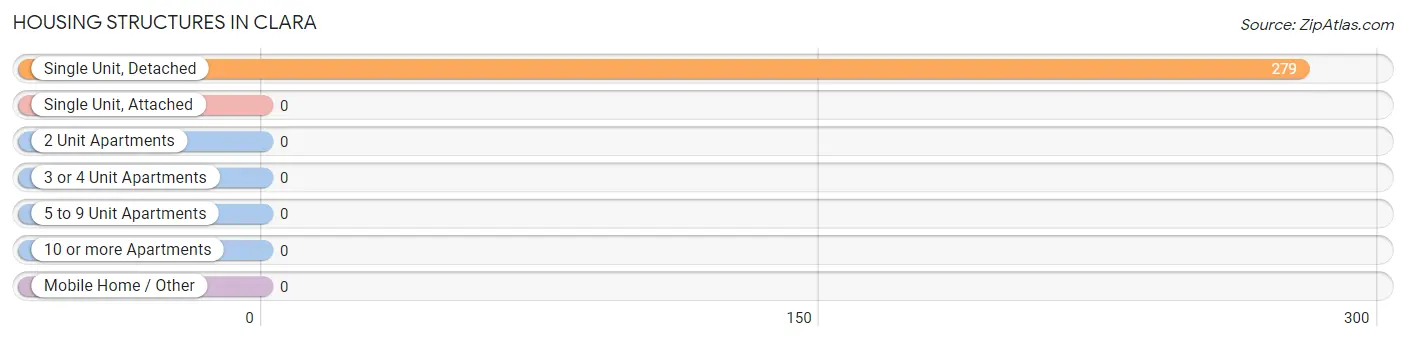
| Structure Type | # Housing Units | % Housing Units |
| Single Unit, Detached | 279 | 100.0% |
| Single Unit, Attached | 0 | 0.0% |
| 2 Unit Apartments | 0 | 0.0% |
| 3 or 4 Unit Apartments | 0 | 0.0% |
| 5 to 9 Unit Apartments | 0 | 0.0% |
| 10 or more Apartments | 0 | 0.0% |
| Mobile Home / Other | 0 | 0.0% |
| Total | 279 | 100.0% |
Housing Structures by Occupancy in Clara
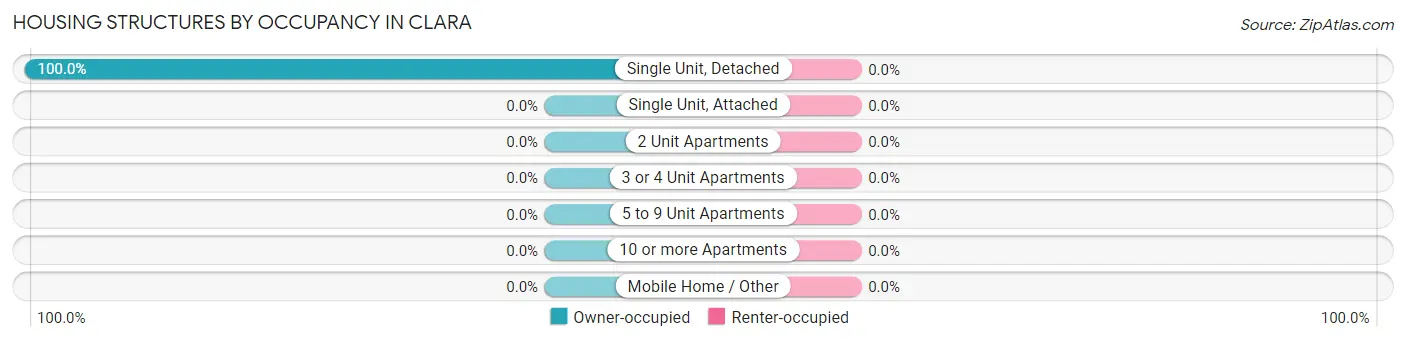
| Structure Type | Owner-occupied | Renter-occupied |
| Single Unit, Detached | 279 (100.0%) | 0 (0.0%) |
| Single Unit, Attached | 0 (0.0%) | 0 (0.0%) |
| 2 Unit Apartments | 0 (0.0%) | 0 (0.0%) |
| 3 or 4 Unit Apartments | 0 (0.0%) | 0 (0.0%) |
| 5 to 9 Unit Apartments | 0 (0.0%) | 0 (0.0%) |
| 10 or more Apartments | 0 (0.0%) | 0 (0.0%) |
| Mobile Home / Other | 0 (0.0%) | 0 (0.0%) |
| Total | 279 (100.0%) | 0 (0.0%) |
Housing Structures by Number of Rooms in Clara
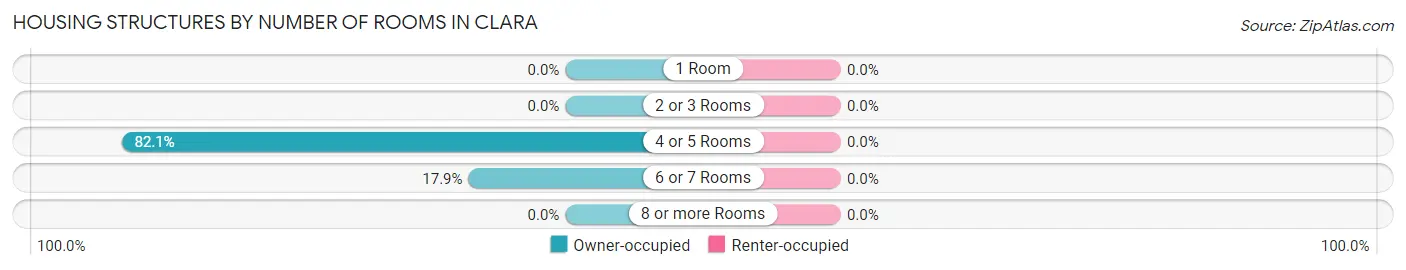
| Number of Rooms | Owner-occupied | Renter-occupied |
| 1 Room | 0 (0.0%) | 0 (0.0%) |
| 2 or 3 Rooms | 0 (0.0%) | 0 (0.0%) |
| 4 or 5 Rooms | 229 (82.1%) | 0 (0.0%) |
| 6 or 7 Rooms | 50 (17.9%) | 0 (0.0%) |
| 8 or more Rooms | 0 (0.0%) | 0 (0.0%) |
| Total | 279 (100.0%) | 0 (0.0%) |
Housing Structure by Heating Type in Clara
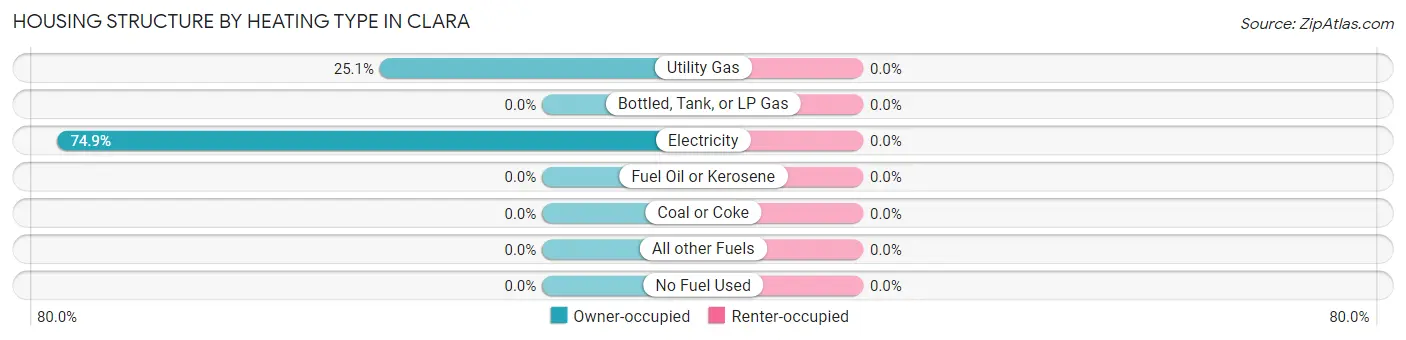
| Heating Type | Owner-occupied | Renter-occupied |
| Utility Gas | 70 (25.1%) | 0 (0.0%) |
| Bottled, Tank, or LP Gas | 0 (0.0%) | 0 (0.0%) |
| Electricity | 209 (74.9%) | 0 (0.0%) |
| Fuel Oil or Kerosene | 0 (0.0%) | 0 (0.0%) |
| Coal or Coke | 0 (0.0%) | 0 (0.0%) |
| All other Fuels | 0 (0.0%) | 0 (0.0%) |
| No Fuel Used | 0 (0.0%) | 0 (0.0%) |
| Total | 279 (100.0%) | 0 (0.0%) |
Household Vehicle Usage in Clara
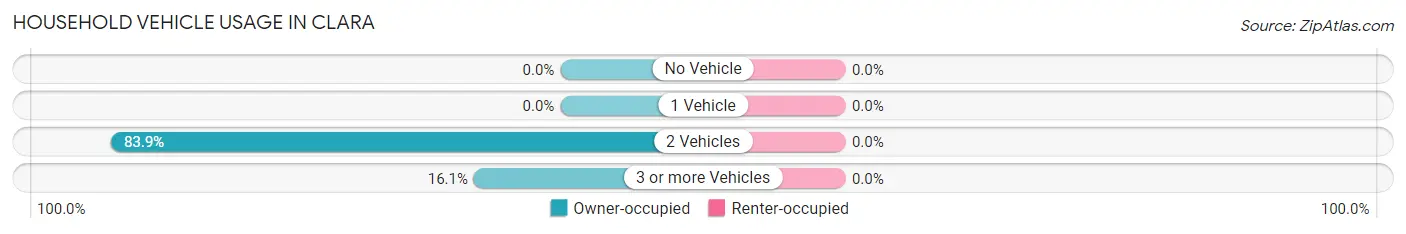
| Vehicles per Household | Owner-occupied | Renter-occupied |
| No Vehicle | 0 (0.0%) | 0 (0.0%) |
| 1 Vehicle | 0 (0.0%) | 0 (0.0%) |
| 2 Vehicles | 234 (83.9%) | 0 (0.0%) |
| 3 or more Vehicles | 45 (16.1%) | 0 (0.0%) |
| Total | 279 (100.0%) | 0 (0.0%) |
Real Estate & Mortgages in Clara
Real Estate and Mortgage Overview in Clara
| Characteristic | Without Mortgage | With Mortgage |
| Housing Units | 274 | 5 |
| Median Property Value | $88,600 | $0 |
| Median Household Income | $17,154 | $0 |
| Monthly Housing Costs | $293 | $0 |
| Real Estate Taxes | $286 | $0 |
Property Value by Mortgage Status in Clara
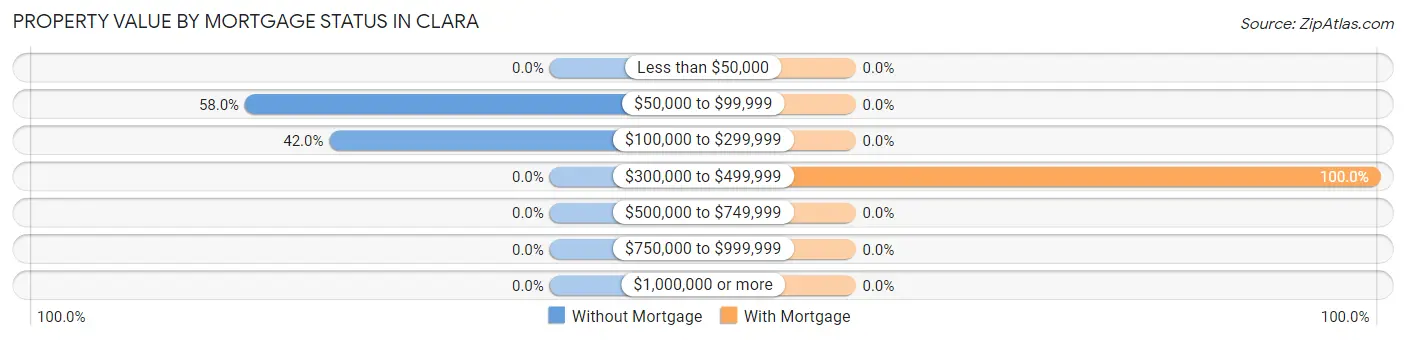
| Property Value | Without Mortgage | With Mortgage |
| Less than $50,000 | 0 (0.0%) | 0 (0.0%) |
| $50,000 to $99,999 | 159 (58.0%) | 0 (0.0%) |
| $100,000 to $299,999 | 115 (42.0%) | 0 (0.0%) |
| $300,000 to $499,999 | 0 (0.0%) | 5 (100.0%) |
| $500,000 to $749,999 | 0 (0.0%) | 0 (0.0%) |
| $750,000 to $999,999 | 0 (0.0%) | 0 (0.0%) |
| $1,000,000 or more | 0 (0.0%) | 0 (0.0%) |
| Total | 274 (100.0%) | 5 (100.0%) |
Household Income by Mortgage Status in Clara
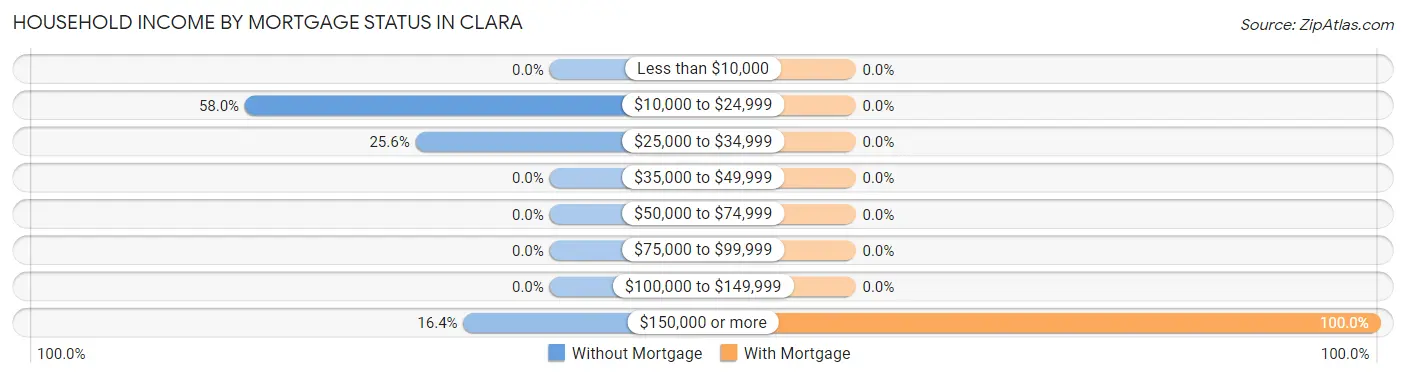
| Household Income | Without Mortgage | With Mortgage |
| Less than $10,000 | 0 (0.0%) | 0 (0.0%) |
| $10,000 to $24,999 | 159 (58.0%) | 0 (0.0%) |
| $25,000 to $34,999 | 70 (25.6%) | 0 (0.0%) |
| $35,000 to $49,999 | 0 (0.0%) | 0 (0.0%) |
| $50,000 to $74,999 | 0 (0.0%) | 0 (0.0%) |
| $75,000 to $99,999 | 0 (0.0%) | 0 (0.0%) |
| $100,000 to $149,999 | 0 (0.0%) | 0 (0.0%) |
| $150,000 or more | 45 (16.4%) | 5 (100.0%) |
| Total | 274 (100.0%) | 5 (100.0%) |
Property Value to Household Income Ratio in Clara
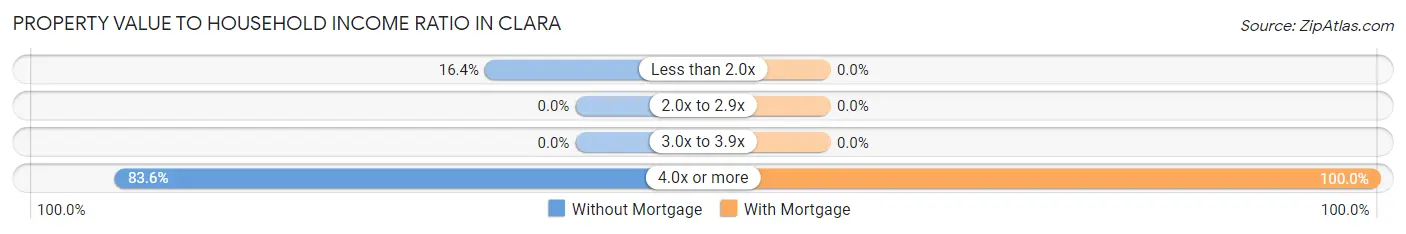
| Value-to-Income Ratio | Without Mortgage | With Mortgage |
| Less than 2.0x | 45 (16.4%) | 0 (0.0%) |
| 2.0x to 2.9x | 0 (0.0%) | 0 (0.0%) |
| 3.0x to 3.9x | 0 (0.0%) | 0 (0.0%) |
| 4.0x or more | 229 (83.6%) | 5 (100.0%) |
| Total | 274 (100.0%) | 5 (100.0%) |
Real Estate Taxes by Mortgage Status in Clara
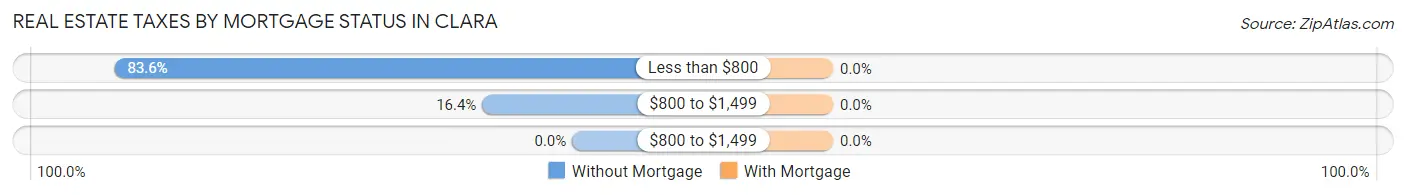
| Property Taxes | Without Mortgage | With Mortgage |
| Less than $800 | 229 (83.6%) | 0 (0.0%) |
| $800 to $1,499 | 45 (16.4%) | 0 (0.0%) |
| $800 to $1,499 | 0 (0.0%) | 0 (0.0%) |
| Total | 274 (100.0%) | 5 (100.0%) |
Health & Disability in Clara
Health Insurance Coverage by Age in Clara
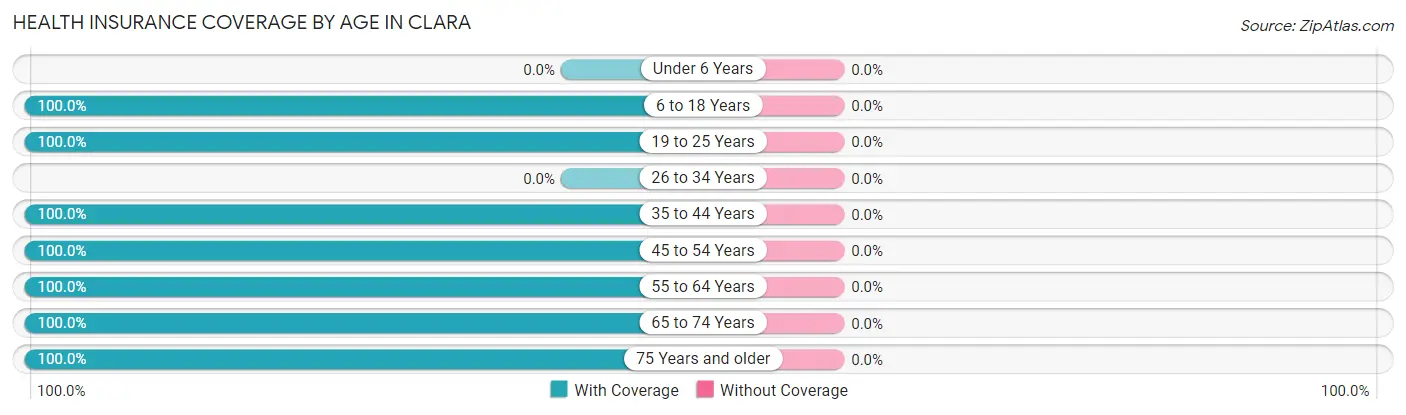
| Age Bracket | With Coverage | Without Coverage |
| Under 6 Years | 0 (0.0%) | 0 (0.0%) |
| 6 to 18 Years | 8 (100.0%) | 0 (0.0%) |
| 19 to 25 Years | 183 (100.0%) | 0 (0.0%) |
| 26 to 34 Years | 0 (0.0%) | 0 (0.0%) |
| 35 to 44 Years | 5 (100.0%) | 0 (0.0%) |
| 45 to 54 Years | 102 (100.0%) | 0 (0.0%) |
| 55 to 64 Years | 70 (100.0%) | 0 (0.0%) |
| 65 to 74 Years | 70 (100.0%) | 0 (0.0%) |
| 75 Years and older | 159 (100.0%) | 0 (0.0%) |
| Total | 597 (100.0%) | 0 (0.0%) |
Health Insurance Coverage by Citizenship Status in Clara
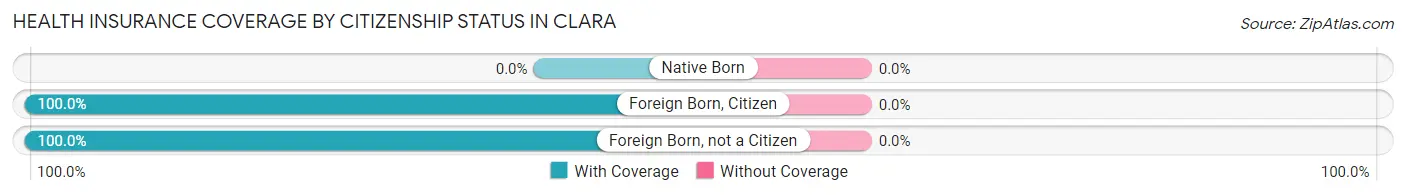
| Citizenship Status | With Coverage | Without Coverage |
| Native Born | 0 (0.0%) | 0 (0.0%) |
| Foreign Born, Citizen | 8 (100.0%) | 0 (0.0%) |
| Foreign Born, not a Citizen | 183 (100.0%) | 0 (0.0%) |
Health Insurance Coverage by Household Income in Clara
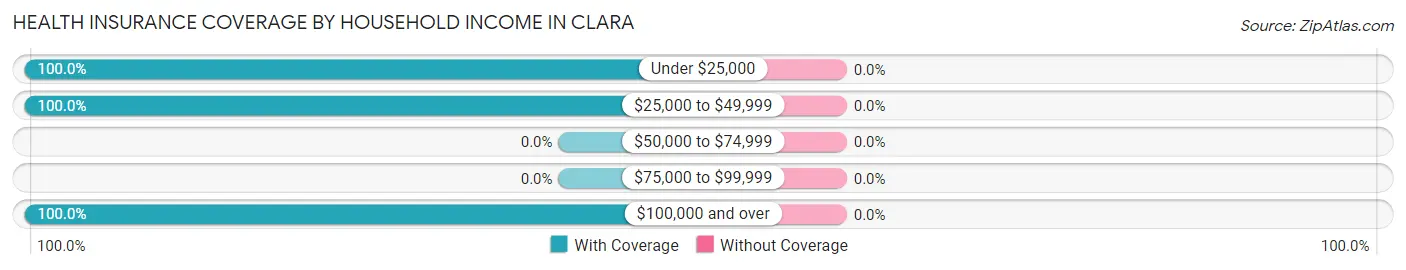
| Household Income | With Coverage | Without Coverage |
| Under $25,000 | 159 (100.0%) | 0 (0.0%) |
| $25,000 to $49,999 | 140 (100.0%) | 0 (0.0%) |
| $50,000 to $74,999 | 0 (0.0%) | 0 (0.0%) |
| $75,000 to $99,999 | 0 (0.0%) | 0 (0.0%) |
| $100,000 and over | 298 (100.0%) | 0 (0.0%) |
Public vs Private Health Insurance Coverage by Age in Clara
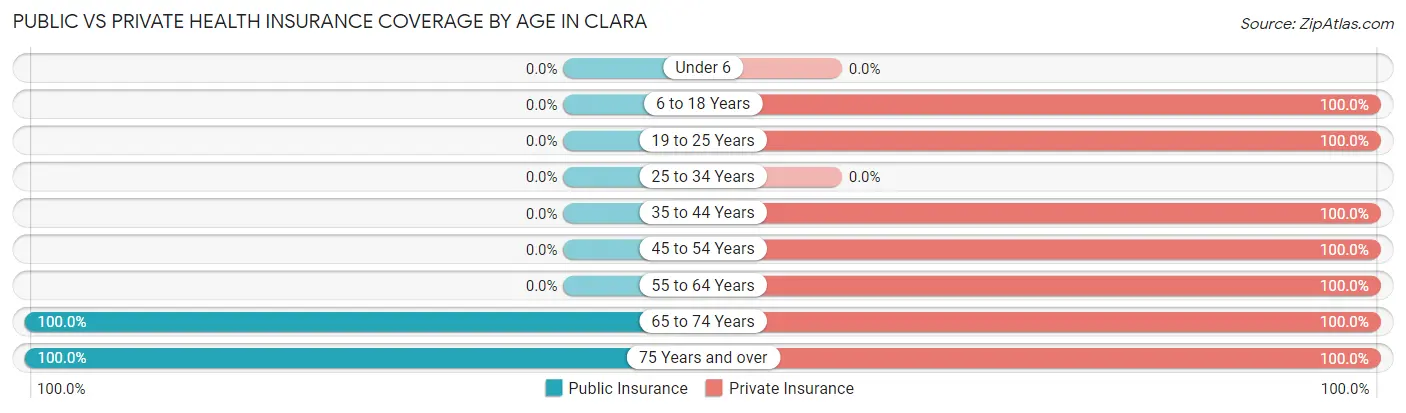
| Age Bracket | Public Insurance | Private Insurance |
| Under 6 | 0 (0.0%) | 0 (0.0%) |
| 6 to 18 Years | 0 (0.0%) | 8 (100.0%) |
| 19 to 25 Years | 0 (0.0%) | 183 (100.0%) |
| 25 to 34 Years | 0 (0.0%) | 0 (0.0%) |
| 35 to 44 Years | 0 (0.0%) | 5 (100.0%) |
| 45 to 54 Years | 0 (0.0%) | 102 (100.0%) |
| 55 to 64 Years | 0 (0.0%) | 70 (100.0%) |
| 65 to 74 Years | 70 (100.0%) | 70 (100.0%) |
| 75 Years and over | 159 (100.0%) | 159 (100.0%) |
| Total | 229 (38.4%) | 597 (100.0%) |
Disability Status by Sex by Age in Clara
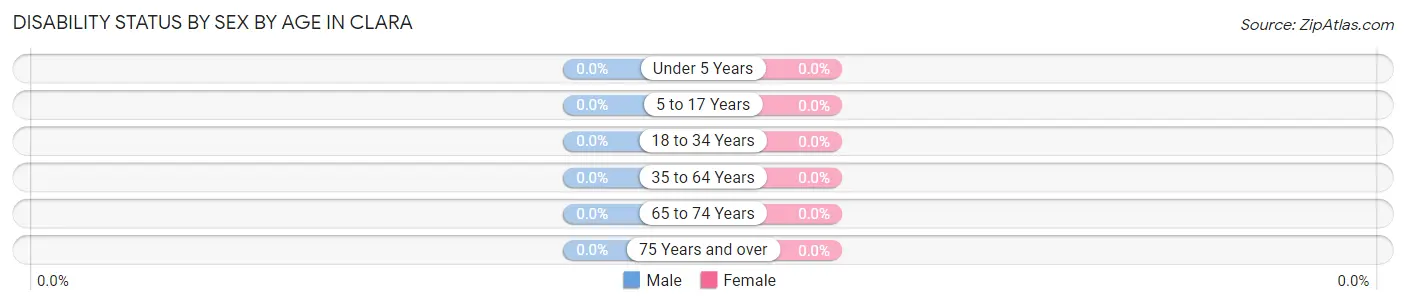
| Age Bracket | Male | Female |
| Under 5 Years | 0 (0.0%) | 0 (0.0%) |
| 5 to 17 Years | 0 (0.0%) | 0 (0.0%) |
| 18 to 34 Years | 0 (0.0%) | 0 (0.0%) |
| 35 to 64 Years | 0 (0.0%) | 0 (0.0%) |
| 65 to 74 Years | 0 (0.0%) | 0 (0.0%) |
| 75 Years and over | 0 (0.0%) | 0 (0.0%) |
Disability Class by Sex by Age in Clara
Disability Class: Hearing Difficulty
| Age Bracket | Male | Female |
| Under 5 Years | 0 (0.0%) | 0 (0.0%) |
| 5 to 17 Years | 0 (0.0%) | 0 (0.0%) |
| 18 to 34 Years | 0 (0.0%) | 0 (0.0%) |
| 35 to 64 Years | 0 (0.0%) | 0 (0.0%) |
| 65 to 74 Years | 0 (0.0%) | 0 (0.0%) |
| 75 Years and over | 0 (0.0%) | 0 (0.0%) |
Disability Class: Vision Difficulty
| Age Bracket | Male | Female |
| Under 5 Years | 0 (0.0%) | 0 (0.0%) |
| 5 to 17 Years | 0 (0.0%) | 0 (0.0%) |
| 18 to 34 Years | 0 (0.0%) | 0 (0.0%) |
| 35 to 64 Years | 0 (0.0%) | 0 (0.0%) |
| 65 to 74 Years | 0 (0.0%) | 0 (0.0%) |
| 75 Years and over | 0 (0.0%) | 0 (0.0%) |
Disability Class: Cognitive Difficulty
| Age Bracket | Male | Female |
| 5 to 17 Years | 0 (0.0%) | 0 (0.0%) |
| 18 to 34 Years | 0 (0.0%) | 0 (0.0%) |
| 35 to 64 Years | 0 (0.0%) | 0 (0.0%) |
| 65 to 74 Years | 0 (0.0%) | 0 (0.0%) |
| 75 Years and over | 0 (0.0%) | 0 (0.0%) |
Disability Class: Ambulatory Difficulty
| Age Bracket | Male | Female |
| 5 to 17 Years | 0 (0.0%) | 0 (0.0%) |
| 18 to 34 Years | 0 (0.0%) | 0 (0.0%) |
| 35 to 64 Years | 0 (0.0%) | 0 (0.0%) |
| 65 to 74 Years | 0 (0.0%) | 0 (0.0%) |
| 75 Years and over | 0 (0.0%) | 0 (0.0%) |
Disability Class: Self-Care Difficulty
| Age Bracket | Male | Female |
| 5 to 17 Years | 0 (0.0%) | 0 (0.0%) |
| 18 to 34 Years | 0 (0.0%) | 0 (0.0%) |
| 35 to 64 Years | 0 (0.0%) | 0 (0.0%) |
| 65 to 74 Years | 0 (0.0%) | 0 (0.0%) |
| 75 Years and over | 0 (0.0%) | 0 (0.0%) |
Technology Access in Clara
Computing Device Access in Clara
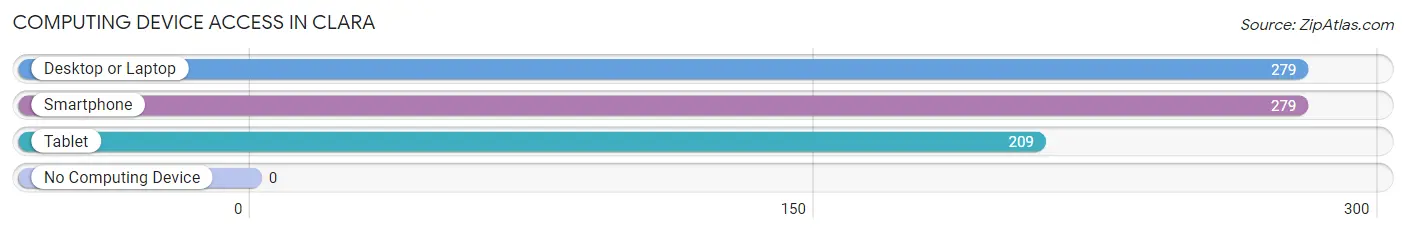
| Device Type | # Households | % Households |
| Desktop or Laptop | 279 | 100.0% |
| Smartphone | 279 | 100.0% |
| Tablet | 209 | 74.9% |
| No Computing Device | 0 | 0.0% |
| Total | 279 | 100.0% |
Internet Access in Clara
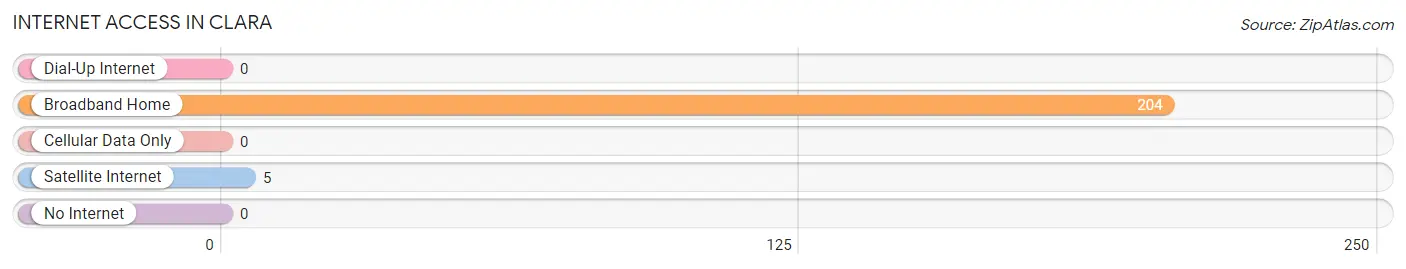
| Internet Type | # Households | % Households |
| Dial-Up Internet | 0 | 0.0% |
| Broadband Home | 204 | 73.1% |
| Cellular Data Only | 0 | 0.0% |
| Satellite Internet | 5 | 1.8% |
| No Internet | 0 | 0.0% |
| Total | 279 | 100.0% |
Clara Summary
Clara is a small town located in the state of Mississippi, in the United States of America. It is situated in the northern part of the state, in Monroe County, and is part of the Aberdeen Micropolitan Statistical Area. The town has a population of approximately 1,000 people, and is known for its rural charm and friendly atmosphere.
Geography
Clara is located in the northern part of Mississippi, in Monroe County. It is situated in the Aberdeen Micropolitan Statistical Area, and is approximately 30 miles from the state capital of Jackson. The town is situated on the banks of the Tombigbee River, and is surrounded by rolling hills and lush forests. The climate in Clara is humid subtropical, with hot summers and mild winters.
History
Clara was founded in 1837, and was named after the daughter of the town’s first settler, William H. Smith. The town was originally a small farming community, and was home to a number of cotton plantations. During the Civil War, Clara was the site of a major battle between Union and Confederate forces. After the war, the town experienced a period of growth and prosperity, and by the early 20th century, it had become a thriving commercial center.
Economy
Clara’s economy is largely based on agriculture and forestry. The town is home to a number of farms, and is known for its production of cotton, soybeans, corn, and other crops. The town is also home to a number of timber companies, which harvest and process timber for use in construction and other industries. In addition, Clara is home to a number of small businesses, including restaurants, shops, and other services.
Demographics
As of the 2010 census, Clara had a population of 1,000 people. The racial makeup of the town was 95.2% White, 2.2% African American, 0.2% Native American, 0.2% Asian, 0.2% from other races, and 1.2% from two or more races. The median household income in Clara was $30,000, and the median family income was $35,000. The town’s poverty rate was 16.7%.
Conclusion
Clara is a small town located in the northern part of Mississippi. It is known for its rural charm and friendly atmosphere, and is home to a number of farms and timber companies. The town has a population of 1,000 people, and is largely composed of White and African American residents. The town’s economy is based on agriculture and forestry, and it is home to a number of small businesses.
Common Questions
What is Per Capita Income in Clara?
Per Capita income in Clara is $25,437.
What is Inequality or Gini Index in Clara?
Inequality or Gini Index in Clara is 0.51.
What is the Total Population of Clara?
Total Population of Clara is 597.
What is the Total Male Population of Clara?
Total Male Population of Clara is 205.
What is the Total Female Population of Clara?
Total Female Population of Clara is 392.
What is the Ratio of Males per 100 Females in Clara?
There are 52.30 Males per 100 Females in Clara.
What is the Ratio of Females per 100 Males in Clara?
There are 191.22 Females per 100 Males in Clara.
What is the Median Population Age in Clara?
Median Population Age in Clara is 62.0 Years.
What is the Average Family Size in Clara
Average Family Size in Clara is 3.6 People.
What is the Average Household Size in Clara
Average Household Size in Clara is 2.1 People.
How Large is the Labor Force in Clara?
There are 290 People in the Labor Forcein in Clara.
What is the Percentage of People in the Labor Force in Clara?
49.2% of People are in the Labor Force in Clara.