Lake, MS Map & Demographics
Lake Map
Lake Overview
$20,309
PER CAPITA INCOME
$56,613
AVG FAMILY INCOME
$55,605
AVG HOUSEHOLD INCOME
31.5%
WAGE / INCOME GAP [ % ]
68.5¢/ $1
WAGE / INCOME GAP [ $ ]
0.34
INEQUALITY / GINI INDEX
512
TOTAL POPULATION
233
MALE POPULATION
279
FEMALE POPULATION
83.51
MALES / 100 FEMALES
119.74
FEMALES / 100 MALES
33.4
MEDIAN AGE
3.4
AVG FAMILY SIZE
3.0
AVG HOUSEHOLD SIZE
221
LABOR FORCE [ PEOPLE ]
56.7%
PERCENT IN LABOR FORCE
Lake Zip Codes
Income in Lake
Income Overview in Lake
Per Capita Income in Lake is $20,309, while median incomes of families and households are $56,613 and $55,605 respectively.
| Characteristic | Number | Measure |
| Per Capita Income | 512 | $20,309 |
| Median Family Income | 138 | $56,613 |
| Mean Family Income | 138 | $61,759 |
| Median Household Income | 171 | $55,605 |
| Mean Household Income | 171 | $56,636 |
| Income Deficit | 138 | $0 |
| Wage / Income Gap (%) | 512 | 31.54% |
| Wage / Income Gap ($) | 512 | 68.46¢ per $1 |
| Gini / Inequality Index | 512 | 0.34 |
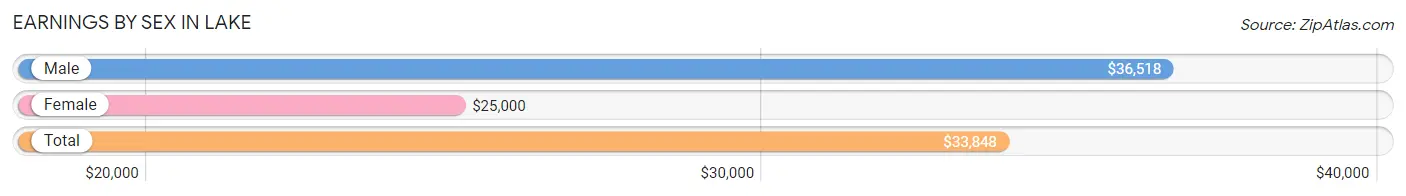
Earnings by Sex in Lake
Average Earnings in Lake are $33,848, $36,518 for men and $25,000 for women, a difference of 31.5%.
| Sex | Number | Average Earnings |
| Male | 105 (46.3%) | $36,518 |
| Female | 122 (53.7%) | $25,000 |
| Total | 227 (100.0%) | $33,848 |
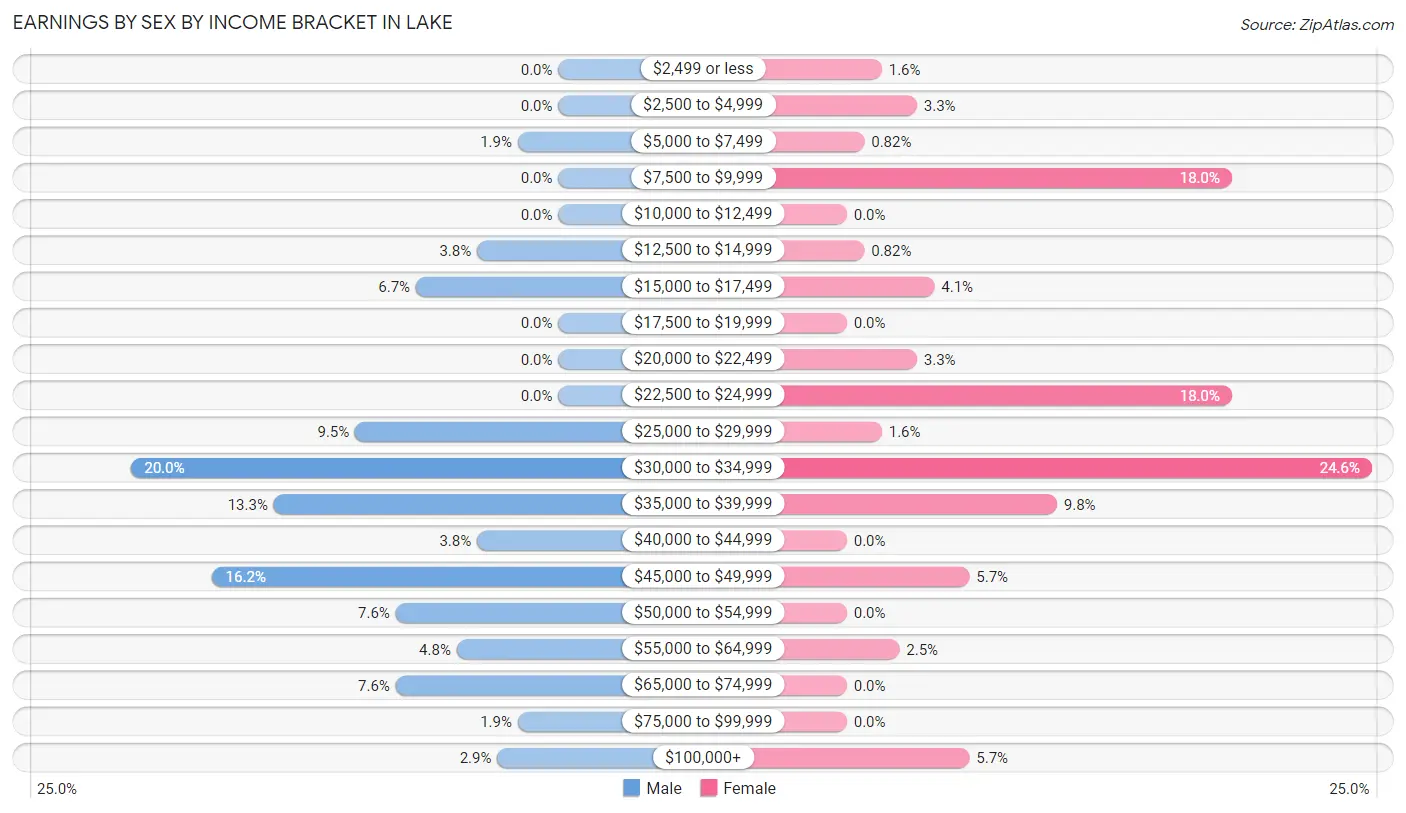
Earnings by Sex by Income Bracket in Lake
The most common earnings brackets in Lake are $30,000 to $34,999 for men (21 | 20.0%) and $30,000 to $34,999 for women (30 | 24.6%).
| Income | Male | Female |
| $2,499 or less | 0 (0.0%) | 2 (1.6%) |
| $2,500 to $4,999 | 0 (0.0%) | 4 (3.3%) |
| $5,000 to $7,499 | 2 (1.9%) | 1 (0.8%) |
| $7,500 to $9,999 | 0 (0.0%) | 22 (18.0%) |
| $10,000 to $12,499 | 0 (0.0%) | 0 (0.0%) |
| $12,500 to $14,999 | 4 (3.8%) | 1 (0.8%) |
| $15,000 to $17,499 | 7 (6.7%) | 5 (4.1%) |
| $17,500 to $19,999 | 0 (0.0%) | 0 (0.0%) |
| $20,000 to $22,499 | 0 (0.0%) | 4 (3.3%) |
| $22,500 to $24,999 | 0 (0.0%) | 22 (18.0%) |
| $25,000 to $29,999 | 10 (9.5%) | 2 (1.6%) |
| $30,000 to $34,999 | 21 (20.0%) | 30 (24.6%) |
| $35,000 to $39,999 | 14 (13.3%) | 12 (9.8%) |
| $40,000 to $44,999 | 4 (3.8%) | 0 (0.0%) |
| $45,000 to $49,999 | 17 (16.2%) | 7 (5.7%) |
| $50,000 to $54,999 | 8 (7.6%) | 0 (0.0%) |
| $55,000 to $64,999 | 5 (4.8%) | 3 (2.5%) |
| $65,000 to $74,999 | 8 (7.6%) | 0 (0.0%) |
| $75,000 to $99,999 | 2 (1.9%) | 0 (0.0%) |
| $100,000+ | 3 (2.9%) | 7 (5.7%) |
| Total | 105 (100.0%) | 122 (100.0%) |
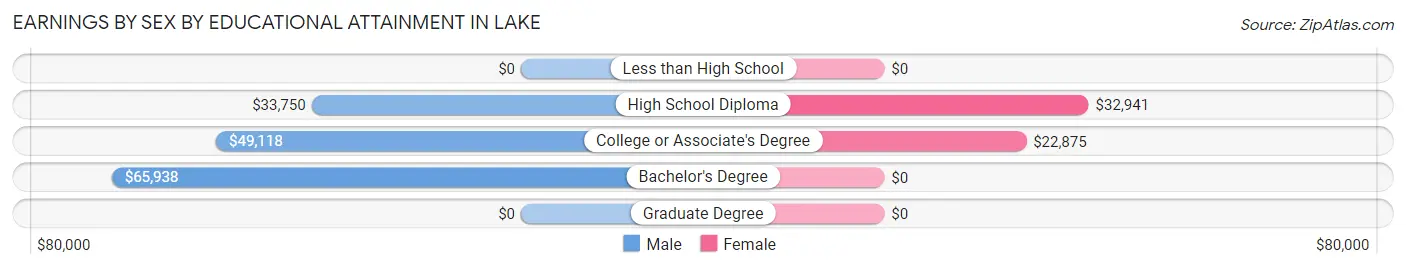
Earnings by Sex by Educational Attainment in Lake
Average earnings in Lake are $40,938 for men and $32,542 for women, a difference of 20.5%. Men with an educational attainment of bachelor's degree enjoy the highest average annual earnings of $65,938, while those with high school diploma education earn the least with $33,750. Women with an educational attainment of high school diploma earn the most with the average annual earnings of $32,941, while those with college or associate's degree education have the smallest earnings of $22,875.
| Educational Attainment | Male Income | Female Income |
| Less than High School | - | - |
| High School Diploma | $33,750 | $32,941 |
| College or Associate's Degree | $49,118 | $22,875 |
| Bachelor's Degree | $65,938 | $0 |
| Graduate Degree | - | - |
| Total | $40,938 | $32,542 |
Family Income in Lake
Family Income Brackets in Lake
According to the Lake family income data, there are 68 families falling into the $50,000 to $74,999 income range, which is the most common income bracket and makes up 49.3% of all families.
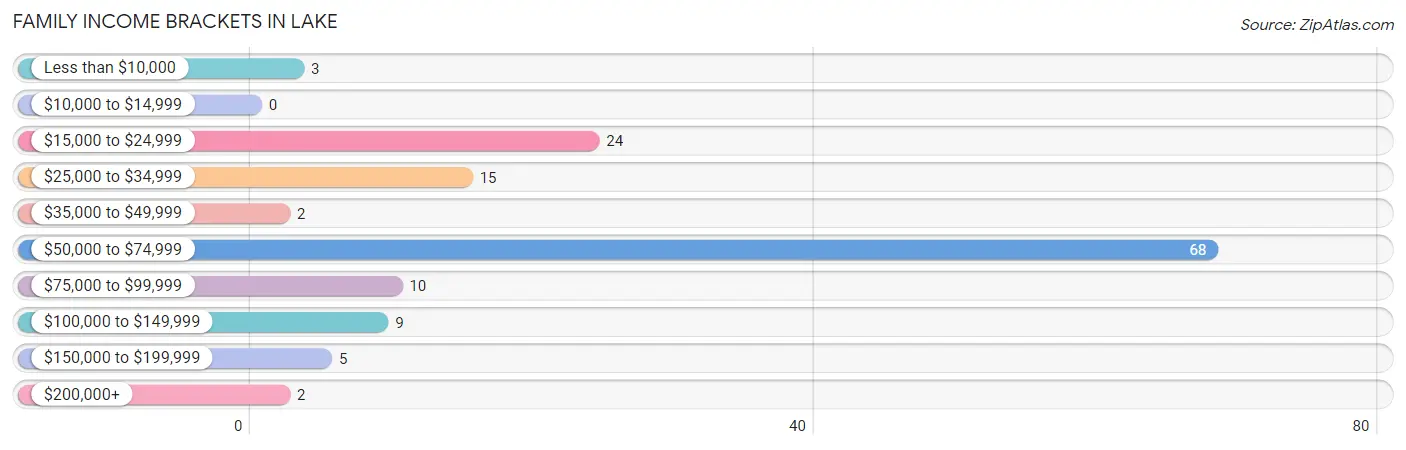
| Income Bracket | # Families | % Families |
| Less than $10,000 | 3 | 2.2% |
| $10,000 to $14,999 | 0 | 0.0% |
| $15,000 to $24,999 | 24 | 17.4% |
| $25,000 to $34,999 | 15 | 10.9% |
| $35,000 to $49,999 | 2 | 1.4% |
| $50,000 to $74,999 | 68 | 49.3% |
| $75,000 to $99,999 | 10 | 7.2% |
| $100,000 to $149,999 | 9 | 6.5% |
| $150,000 to $199,999 | 5 | 3.6% |
| $200,000+ | 2 | 1.4% |
Family Income by Famaliy Size in Lake
4-person families (16 | 11.6%) account for the highest median family income in Lake with $116,429 per family, while 4-person families (16 | 11.6%) have the highest median income of $29,107 per family member.
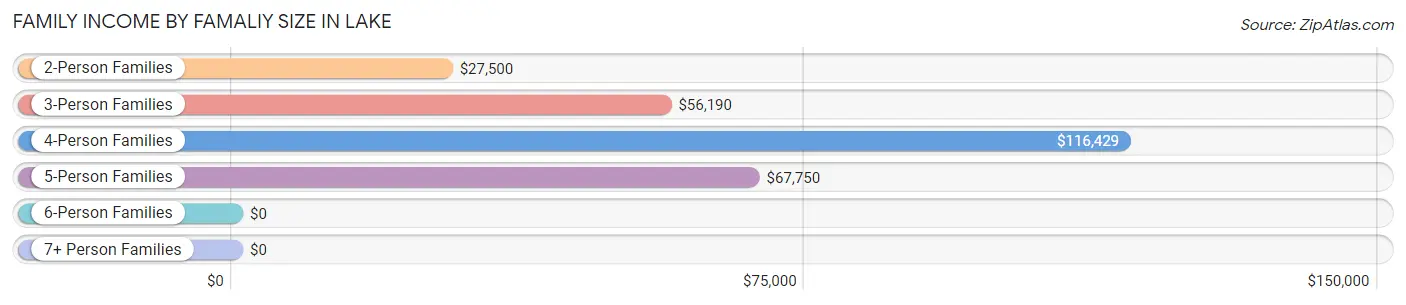
| Income Bracket | # Families | Median Income |
| 2-Person Families | 28 (20.3%) | $27,500 |
| 3-Person Families | 60 (43.5%) | $56,190 |
| 4-Person Families | 16 (11.6%) | $116,429 |
| 5-Person Families | 28 (20.3%) | $67,750 |
| 6-Person Families | 6 (4.3%) | $0 |
| 7+ Person Families | 0 (0.0%) | $0 |
| Total | 138 (100.0%) | $56,613 |
Family Income by Number of Earners in Lake
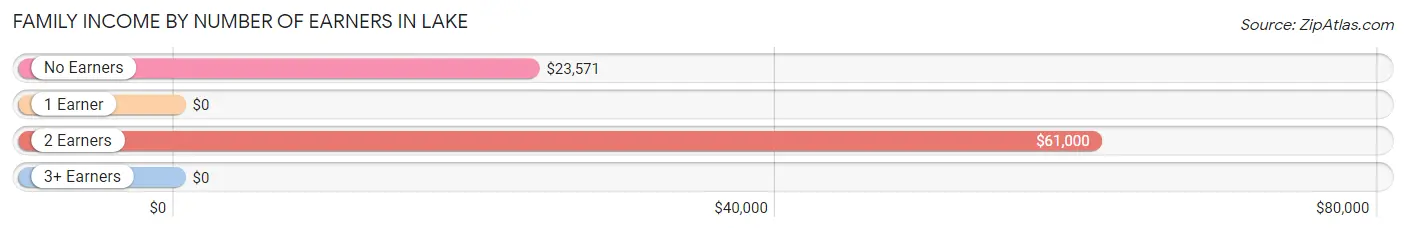
| Number of Earners | # Families | Median Income |
| No Earners | 16 (11.6%) | $23,571 |
| 1 Earner | 44 (31.9%) | $0 |
| 2 Earners | 78 (56.5%) | $61,000 |
| 3+ Earners | 0 (0.0%) | $0 |
| Total | 138 (100.0%) | $56,613 |
Household Income in Lake
Household Income Brackets in Lake
With 72 households falling in the category, the $50,000 to $74,999 income range is the most frequent in Lake, accounting for 42.1% of all households. In contrast, only 2 households (1.2%) fall into the $200,000+ income bracket, making it the least populous group.
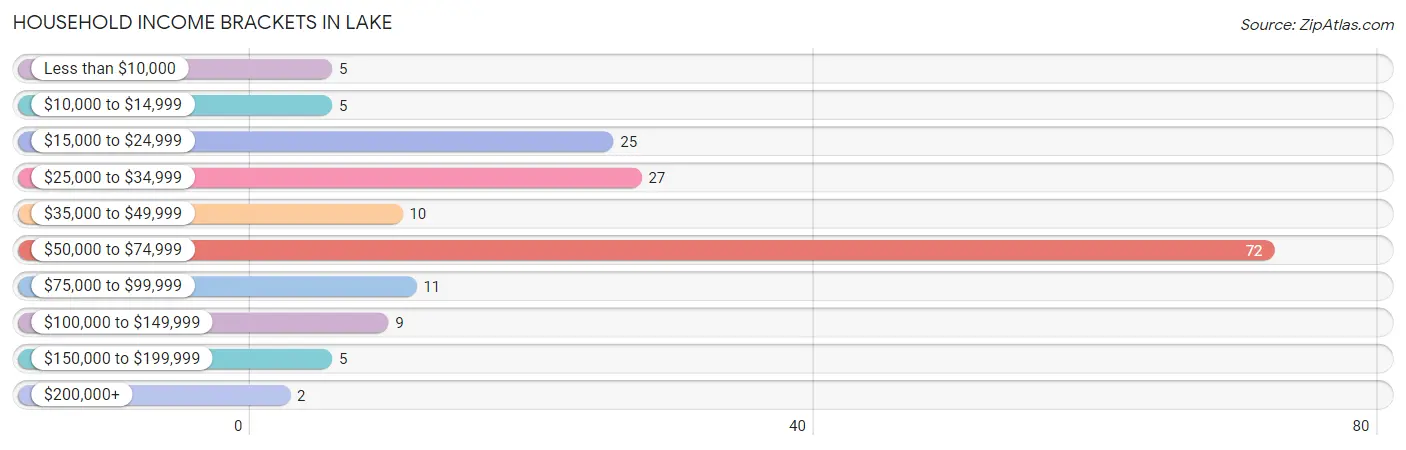
| Income Bracket | # Households | % Households |
| Less than $10,000 | 5 | 2.9% |
| $10,000 to $14,999 | 5 | 2.9% |
| $15,000 to $24,999 | 25 | 14.6% |
| $25,000 to $34,999 | 27 | 15.8% |
| $35,000 to $49,999 | 10 | 5.8% |
| $50,000 to $74,999 | 72 | 42.1% |
| $75,000 to $99,999 | 11 | 6.4% |
| $100,000 to $149,999 | 9 | 5.3% |
| $150,000 to $199,999 | 5 | 2.9% |
| $200,000+ | 2 | 1.2% |
Household Income by Householder Age in Lake
The median household income in Lake is $55,605, with the highest median household income of $56,845 found in the 45 to 64 years age bracket for the primary householder. A total of 67 households (39.2%) fall into this category.
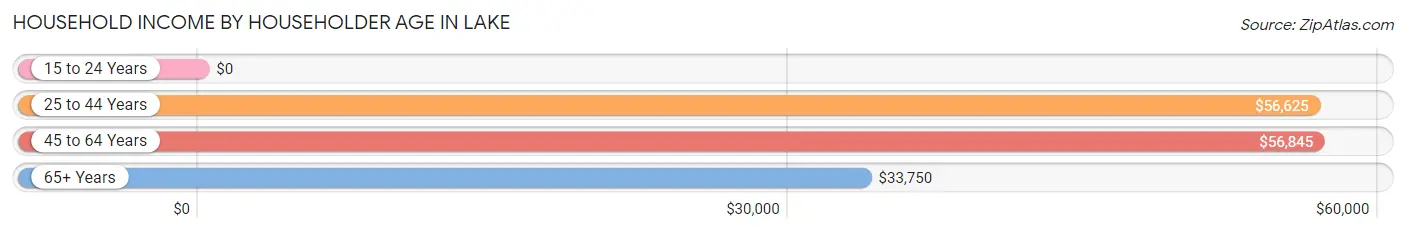
| Income Bracket | # Households | Median Income |
| 15 to 24 Years | 0 (0.0%) | $0 |
| 25 to 44 Years | 45 (26.3%) | $56,625 |
| 45 to 64 Years | 67 (39.2%) | $56,845 |
| 65+ Years | 59 (34.5%) | $33,750 |
| Total | 171 (100.0%) | $55,605 |
Poverty in Lake
Income Below Poverty by Sex and Age in Lake
With 9.9% poverty level for males and 10.0% for females among the residents of Lake, 6 to 11 year old males and under 5 year old females are the most vulnerable to poverty, with 5 males (31.2%) and 5 females (100.0%) in their respective age groups living below the poverty level.
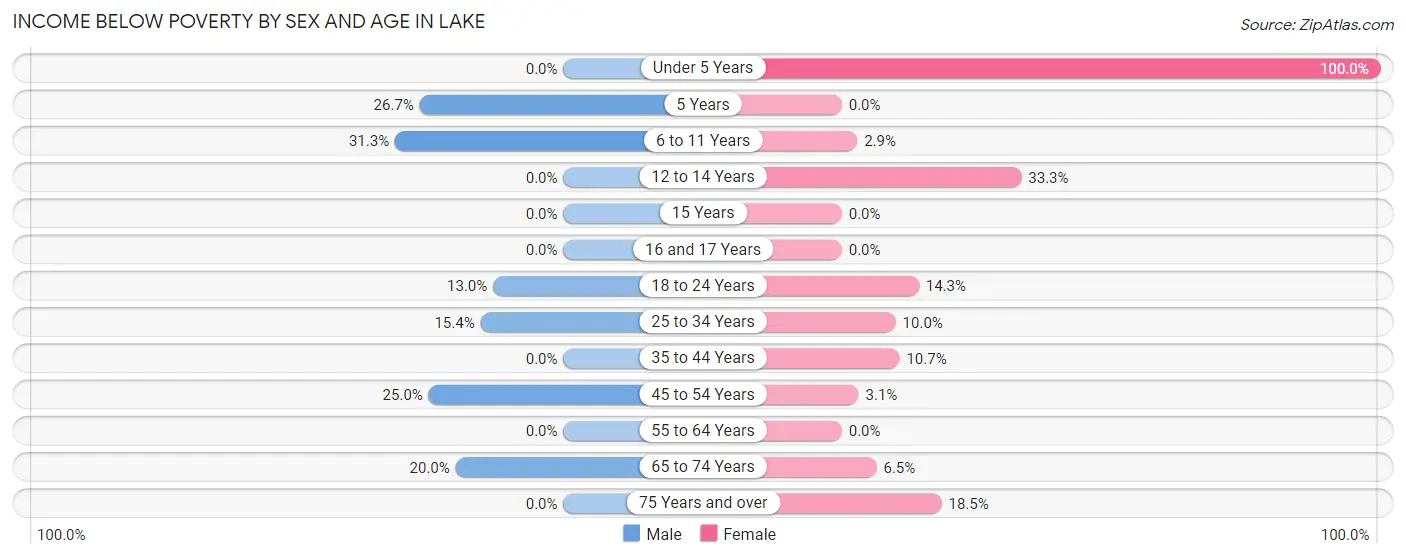
| Age Bracket | Male | Female |
| Under 5 Years | 0 (0.0%) | 5 (100.0%) |
| 5 Years | 4 (26.7%) | 0 (0.0%) |
| 6 to 11 Years | 5 (31.2%) | 1 (2.9%) |
| 12 to 14 Years | 0 (0.0%) | 5 (33.3%) |
| 15 Years | 0 (0.0%) | 0 (0.0%) |
| 16 and 17 Years | 0 (0.0%) | 0 (0.0%) |
| 18 to 24 Years | 3 (13.0%) | 2 (14.3%) |
| 25 to 34 Years | 4 (15.4%) | 4 (10.0%) |
| 35 to 44 Years | 0 (0.0%) | 3 (10.7%) |
| 45 to 54 Years | 5 (25.0%) | 1 (3.1%) |
| 55 to 64 Years | 0 (0.0%) | 0 (0.0%) |
| 65 to 74 Years | 2 (20.0%) | 2 (6.5%) |
| 75 Years and over | 0 (0.0%) | 5 (18.5%) |
| Total | 23 (9.9%) | 28 (10.0%) |
Income Above Poverty by Sex and Age in Lake
According to the poverty statistics in Lake, males aged under 5 years and females aged 5 years are the age groups that are most secure financially, with 100.0% of males and 100.0% of females in these age groups living above the poverty line.
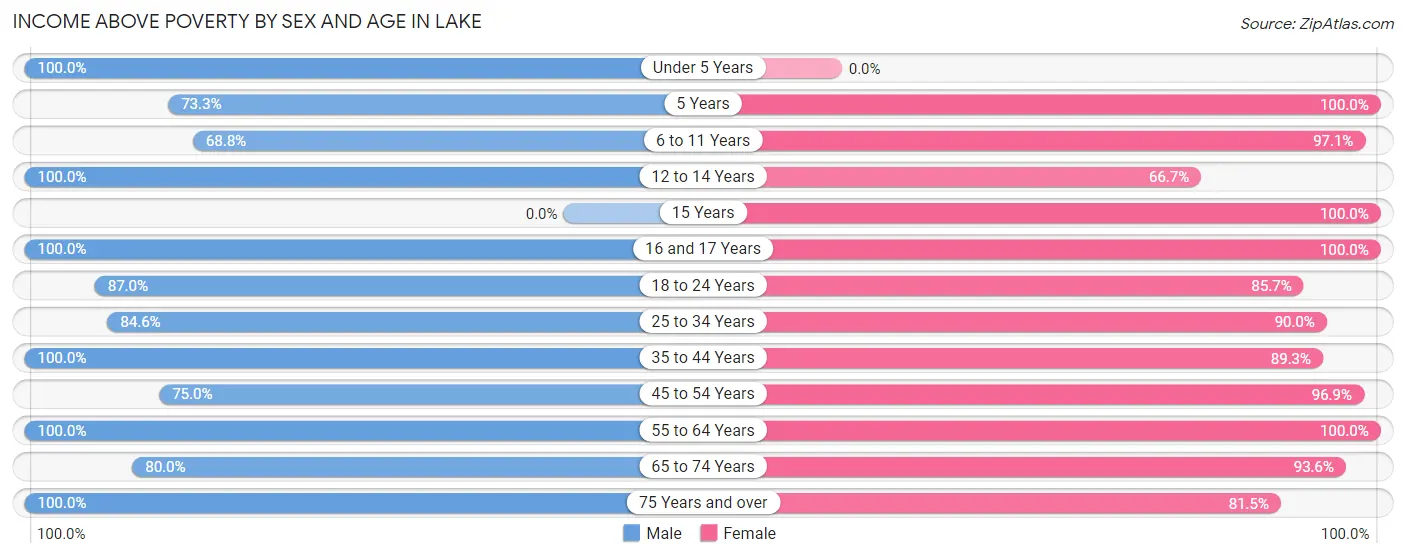
| Age Bracket | Male | Female |
| Under 5 Years | 15 (100.0%) | 0 (0.0%) |
| 5 Years | 11 (73.3%) | 9 (100.0%) |
| 6 to 11 Years | 11 (68.8%) | 34 (97.1%) |
| 12 to 14 Years | 11 (100.0%) | 10 (66.7%) |
| 15 Years | 0 (0.0%) | 1 (100.0%) |
| 16 and 17 Years | 37 (100.0%) | 9 (100.0%) |
| 18 to 24 Years | 20 (87.0%) | 12 (85.7%) |
| 25 to 34 Years | 22 (84.6%) | 36 (90.0%) |
| 35 to 44 Years | 16 (100.0%) | 25 (89.3%) |
| 45 to 54 Years | 15 (75.0%) | 31 (96.9%) |
| 55 to 64 Years | 30 (100.0%) | 33 (100.0%) |
| 65 to 74 Years | 8 (80.0%) | 29 (93.5%) |
| 75 Years and over | 14 (100.0%) | 22 (81.5%) |
| Total | 210 (90.1%) | 251 (90.0%) |
Income Below Poverty Among Married-Couple Families in Lake
The poverty statistics for married-couple families in Lake show that 7.1% or 6 of the total 85 families live below the poverty line. Families with 3 or 4 children have the highest poverty rate of 16.7%, comprising of 4 families. On the other hand, families with 1 or 2 children have the lowest poverty rate of 0.0%, which includes 0 families.
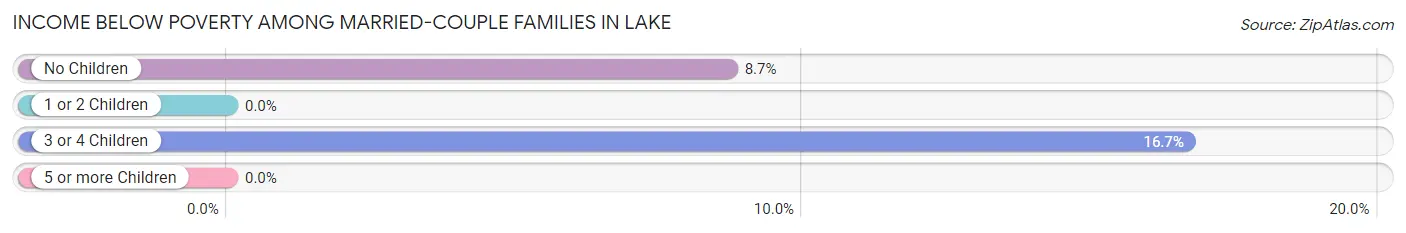
| Children | Above Poverty | Below Poverty |
| No Children | 21 (91.3%) | 2 (8.7%) |
| 1 or 2 Children | 38 (100.0%) | 0 (0.0%) |
| 3 or 4 Children | 20 (83.3%) | 4 (16.7%) |
| 5 or more Children | 0 (0.0%) | 0 (0.0%) |
| Total | 79 (92.9%) | 6 (7.1%) |
Income Below Poverty Among Single-Parent Households in Lake
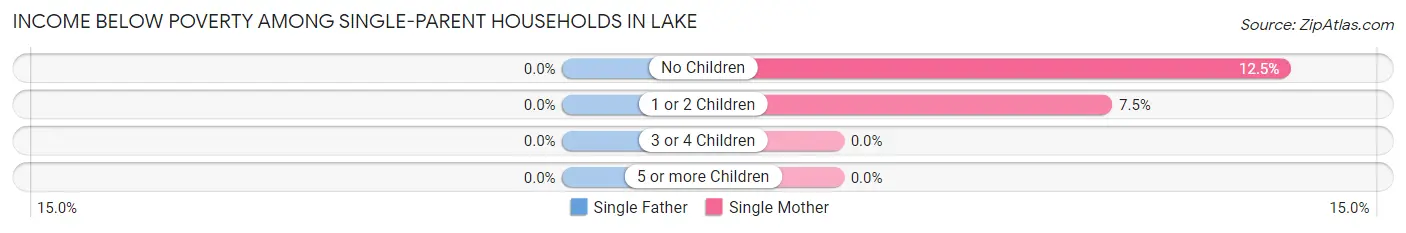
| Children | Single Father | Single Mother |
| No Children | 0 (0.0%) | 1 (12.5%) |
| 1 or 2 Children | 0 (0.0%) | 3 (7.5%) |
| 3 or 4 Children | 0 (0.0%) | 0 (0.0%) |
| 5 or more Children | 0 (0.0%) | 0 (0.0%) |
| Total | 0 (0.0%) | 4 (8.3%) |
Income Below Poverty Among Married-Couple vs Single-Parent Households in Lake
The poverty data for Lake shows that 6 of the married-couple family households (7.1%) and 4 of the single-parent households (7.5%) are living below the poverty level. Within the married-couple family households, those with 3 or 4 children have the highest poverty rate, with 4 households (16.7%) falling below the poverty line. Among the single-parent households, those with no children have the highest poverty rate, with 1 household (12.5%) living below poverty.
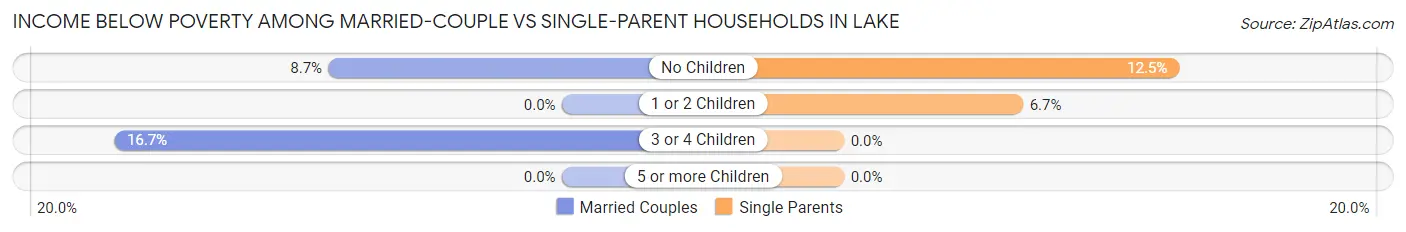
| Children | Married-Couple Families | Single-Parent Households |
| No Children | 2 (8.7%) | 1 (12.5%) |
| 1 or 2 Children | 0 (0.0%) | 3 (6.7%) |
| 3 or 4 Children | 4 (16.7%) | 0 (0.0%) |
| 5 or more Children | 0 (0.0%) | 0 (0.0%) |
| Total | 6 (7.1%) | 4 (7.5%) |
Race in Lake
The most populous races in Lake are White / Caucasian (282 | 55.1%), Black / African American (214 | 41.8%), and Two or more Races (15 | 2.9%).
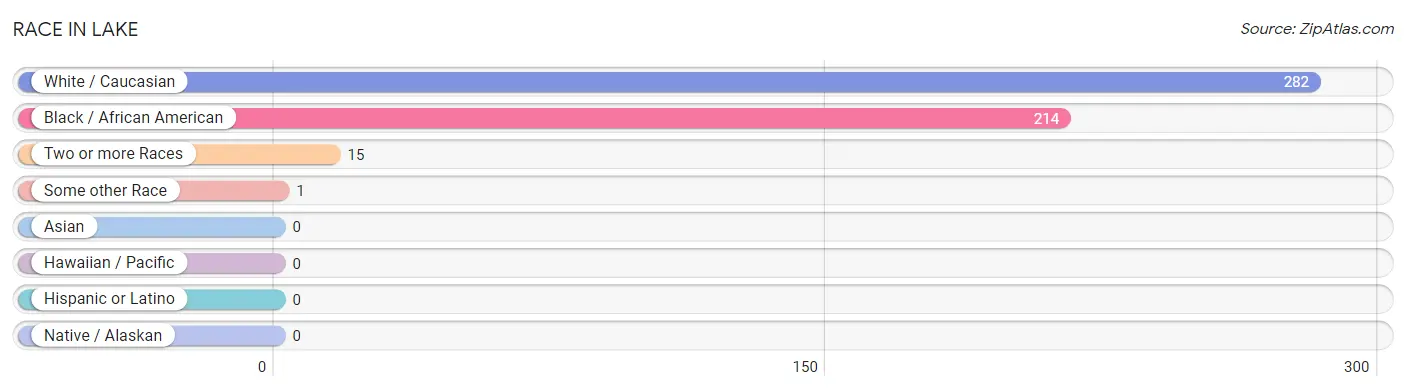
| Race | # Population | % Population |
| Asian | 0 | 0.0% |
| Black / African American | 214 | 41.8% |
| Hawaiian / Pacific | 0 | 0.0% |
| Hispanic or Latino | 0 | 0.0% |
| Native / Alaskan | 0 | 0.0% |
| White / Caucasian | 282 | 55.1% |
| Two or more Races | 15 | 2.9% |
| Some other Race | 1 | 0.2% |
| Total | 512 | 100.0% |
Ancestry in Lake
The most populous ancestries reported in Lake are American (162 | 31.6%), English (69 | 13.5%), Irish (45 | 8.8%), German (7 | 1.4%), and Scottish (3 | 0.6%), together accounting for 55.9% of all Lake residents.
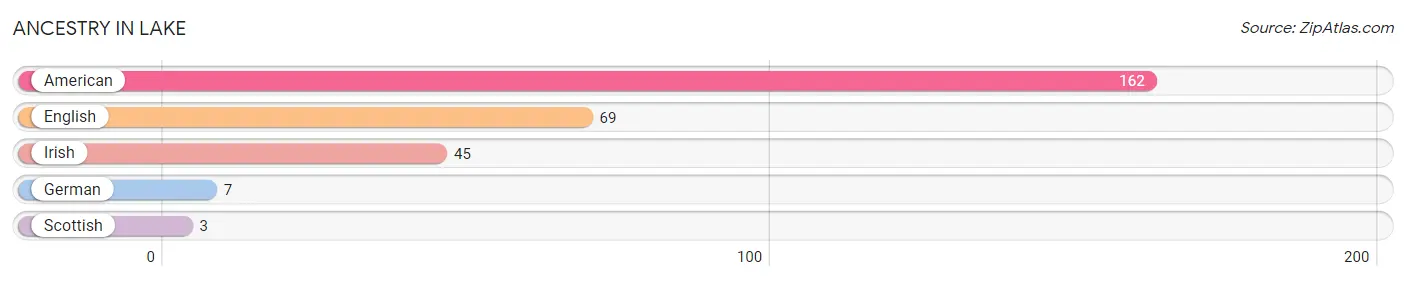
| Ancestry | # Population | % Population |
| American | 162 | 31.6% |
| English | 69 | 13.5% |
| German | 7 | 1.4% |
| Irish | 45 | 8.8% |
| Scottish | 3 | 0.6% | View All 5 Rows |
Immigrants in Lake
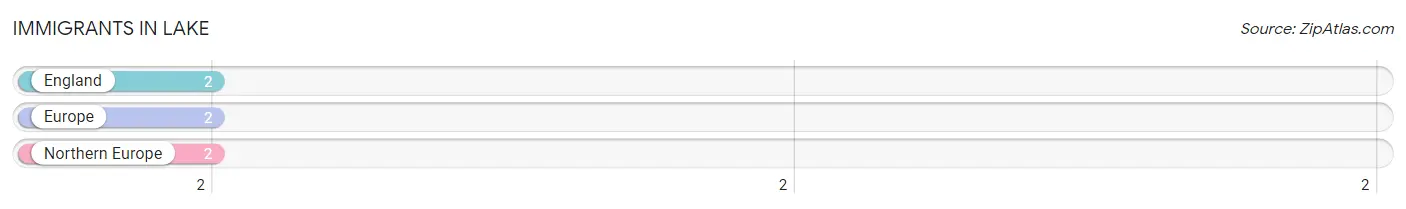
The most numerous immigrant groups reported in Lake came from England (2 | 0.4%), Europe (2 | 0.4%), and Northern Europe (2 | 0.4%), together accounting for 1.2% of all Lake residents.
| Immigration Origin | # Population | % Population |
| England | 2 | 0.4% |
| Europe | 2 | 0.4% |
| Northern Europe | 2 | 0.4% | View All 3 Rows |
Sex and Age in Lake
Sex and Age in Lake
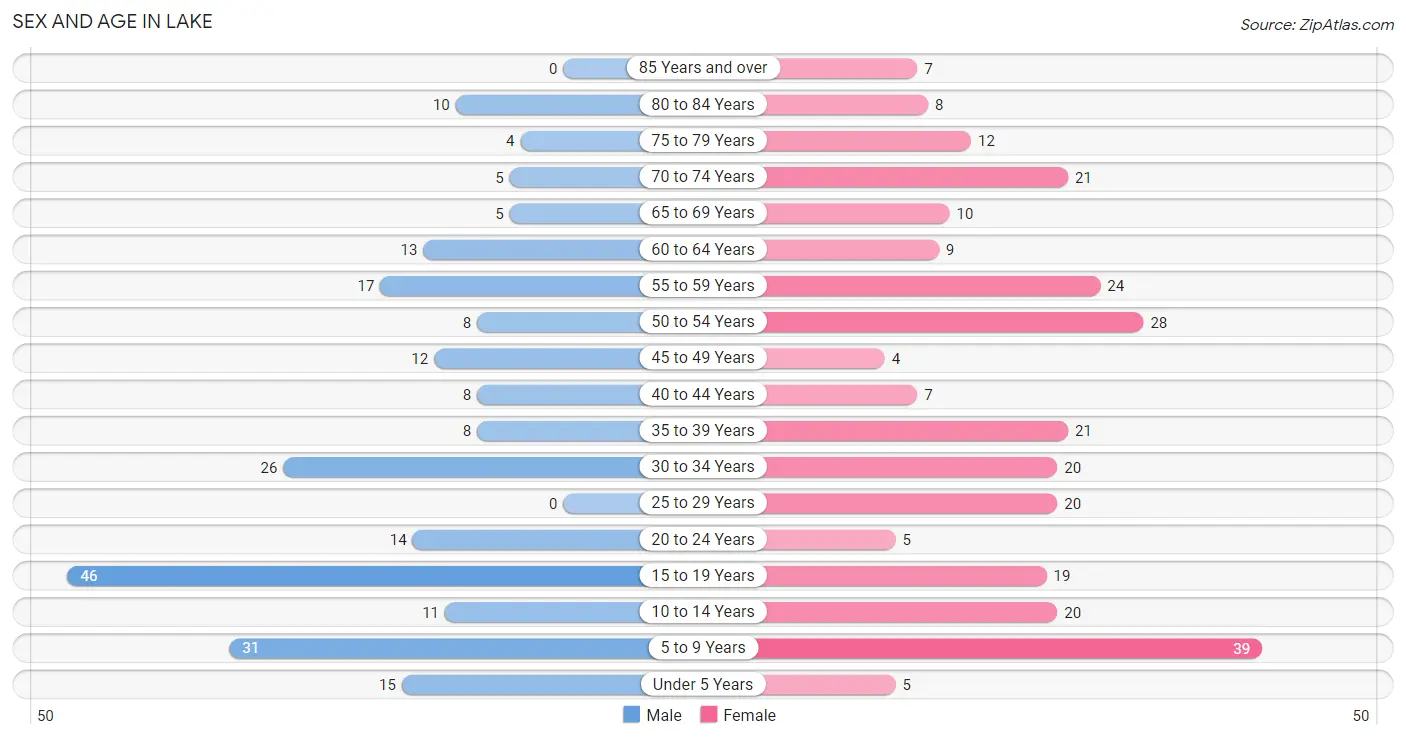
The most populous age groups in Lake are 15 to 19 Years (46 | 19.7%) for men and 5 to 9 Years (39 | 14.0%) for women.
| Age Bracket | Male | Female |
| Under 5 Years | 15 (6.4%) | 5 (1.8%) |
| 5 to 9 Years | 31 (13.3%) | 39 (14.0%) |
| 10 to 14 Years | 11 (4.7%) | 20 (7.2%) |
| 15 to 19 Years | 46 (19.7%) | 19 (6.8%) |
| 20 to 24 Years | 14 (6.0%) | 5 (1.8%) |
| 25 to 29 Years | 0 (0.0%) | 20 (7.2%) |
| 30 to 34 Years | 26 (11.2%) | 20 (7.2%) |
| 35 to 39 Years | 8 (3.4%) | 21 (7.5%) |
| 40 to 44 Years | 8 (3.4%) | 7 (2.5%) |
| 45 to 49 Years | 12 (5.1%) | 4 (1.4%) |
| 50 to 54 Years | 8 (3.4%) | 28 (10.0%) |
| 55 to 59 Years | 17 (7.3%) | 24 (8.6%) |
| 60 to 64 Years | 13 (5.6%) | 9 (3.2%) |
| 65 to 69 Years | 5 (2.1%) | 10 (3.6%) |
| 70 to 74 Years | 5 (2.1%) | 21 (7.5%) |
| 75 to 79 Years | 4 (1.7%) | 12 (4.3%) |
| 80 to 84 Years | 10 (4.3%) | 8 (2.9%) |
| 85 Years and over | 0 (0.0%) | 7 (2.5%) |
| Total | 233 (100.0%) | 279 (100.0%) |
Families and Households in Lake
Median Family Size in Lake
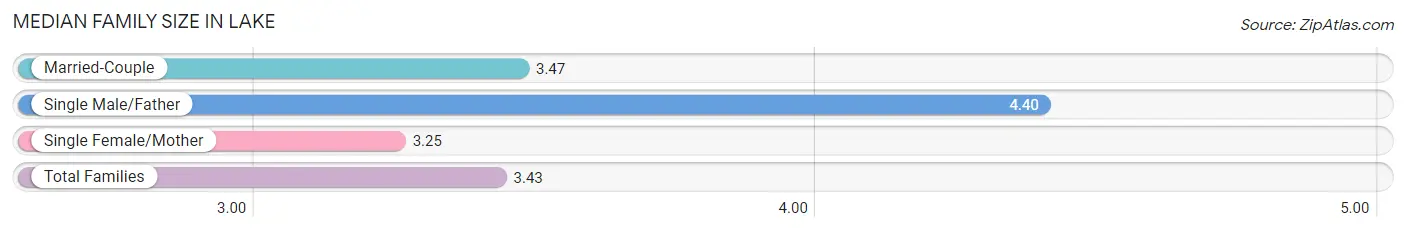
The median family size in Lake is 3.43 persons per family, with single male/father families (5 | 3.6%) accounting for the largest median family size of 4.4 persons per family. On the other hand, single female/mother families (48 | 34.8%) represent the smallest median family size with 3.25 persons per family.
| Family Type | # Families | Family Size |
| Married-Couple | 85 (61.6%) | 3.47 |
| Single Male/Father | 5 (3.6%) | 4.40 |
| Single Female/Mother | 48 (34.8%) | 3.25 |
| Total Families | 138 (100.0%) | 3.43 |
Median Household Size in Lake
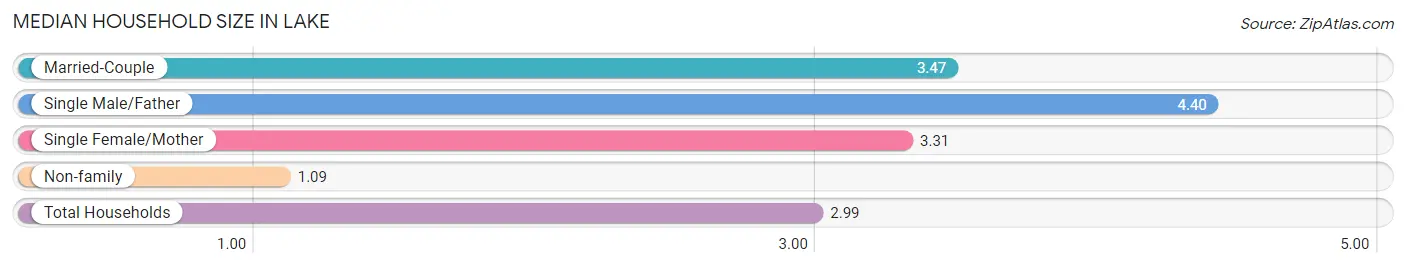
The median household size in Lake is 2.99 persons per household, with single male/father households (5 | 2.9%) accounting for the largest median household size of 4.4 persons per household. non-family households (33 | 19.3%) represent the smallest median household size with 1.09 persons per household.
| Household Type | # Households | Household Size |
| Married-Couple | 85 (49.7%) | 3.47 |
| Single Male/Father | 5 (2.9%) | 4.40 |
| Single Female/Mother | 48 (28.1%) | 3.31 |
| Non-family | 33 (19.3%) | 1.09 |
| Total Households | 171 (100.0%) | 2.99 |
Household Size by Marriage Status in Lake
Out of a total of 171 households in Lake, 138 (80.7%) are family households, while 33 (19.3%) are nonfamily households. The most numerous type of family households are 3-person households, comprising 65, and the most common type of nonfamily households are 1-person households, comprising 30.
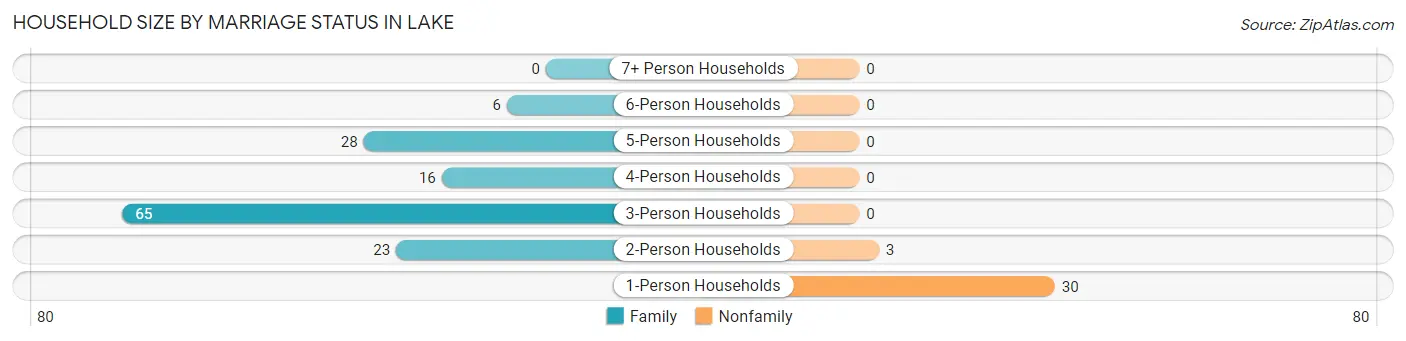
| Household Size | Family Households | Nonfamily Households |
| 1-Person Households | - | 30 (17.5%) |
| 2-Person Households | 23 (13.5%) | 3 (1.8%) |
| 3-Person Households | 65 (38.0%) | 0 (0.0%) |
| 4-Person Households | 16 (9.4%) | 0 (0.0%) |
| 5-Person Households | 28 (16.4%) | 0 (0.0%) |
| 6-Person Households | 6 (3.5%) | 0 (0.0%) |
| 7+ Person Households | 0 (0.0%) | 0 (0.0%) |
| Total | 138 (80.7%) | 33 (19.3%) |
Female Fertility in Lake
Fertility by Age in Lake
Average fertility rate in Lake is 10.0 births per 1,000 women. Women in the age bracket of 20 to 34 years have the highest fertility rate with 22.0 births per 1,000 women. Women in the age bracket of 20 to 34 years acount for 100.0% of all women with births.
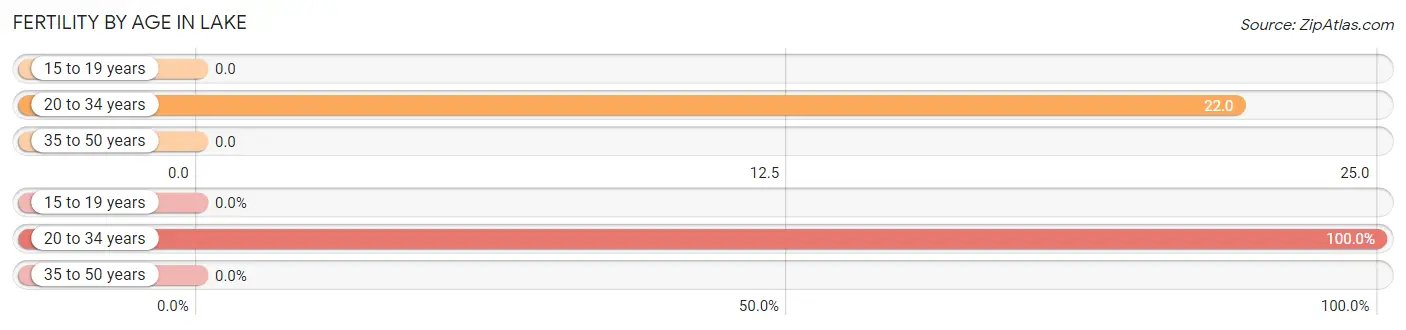
| Age Bracket | Women with Births | Births / 1,000 Women |
| 15 to 19 years | 0 (0.0%) | 0.0 |
| 20 to 34 years | 1 (100.0%) | 22.0 |
| 35 to 50 years | 0 (0.0%) | 0.0 |
| Total | 1 (100.0%) | 10.0 |
Fertility by Age by Marriage Status in Lake
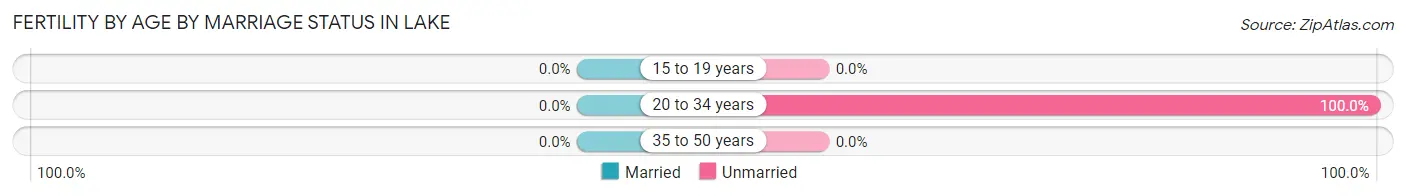
| Age Bracket | Married | Unmarried |
| 15 to 19 years | 0 (0.0%) | 0 (0.0%) |
| 20 to 34 years | 0 (0.0%) | 1 (100.0%) |
| 35 to 50 years | 0 (0.0%) | 0 (0.0%) |
| Total | 0 (0.0%) | 1 (100.0%) |
Fertility by Education in Lake
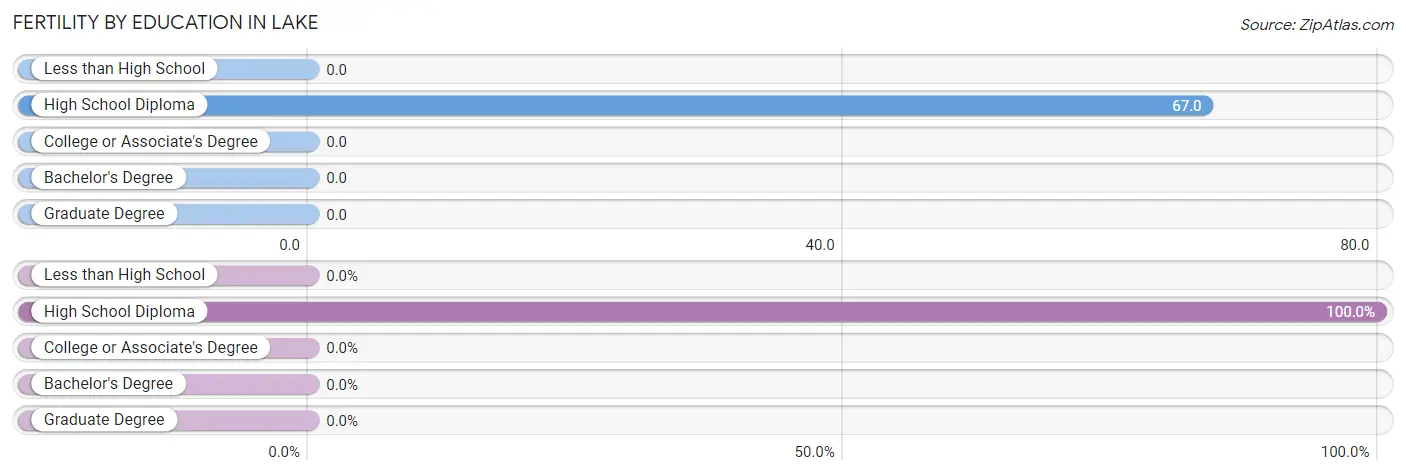
| Educational Attainment | Women with Births | Births / 1,000 Women |
| Less than High School | 0 (0.0%) | 0.0 |
| High School Diploma | 1 (100.0%) | 67.0 |
| College or Associate's Degree | 0 (0.0%) | 0.0 |
| Bachelor's Degree | 0 (0.0%) | 0.0 |
| Graduate Degree | 0 (0.0%) | 0.0 |
| Total | 1 (100.0%) | 10.0 |
Fertility by Education by Marriage Status in Lake
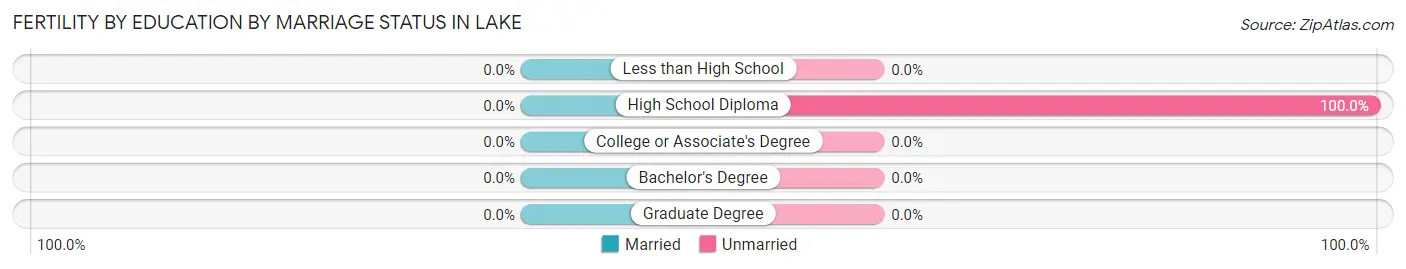
| Educational Attainment | Married | Unmarried |
| Less than High School | 0 (0.0%) | 0 (0.0%) |
| High School Diploma | 0 (0.0%) | 1 (100.0%) |
| College or Associate's Degree | 0 (0.0%) | 0 (0.0%) |
| Bachelor's Degree | 0 (0.0%) | 0 (0.0%) |
| Graduate Degree | 0 (0.0%) | 0 (0.0%) |
| Total | 0 (0.0%) | 1 (100.0%) |
Employment Characteristics in Lake
Employment by Class of Employer in Lake
Among the 221 employed individuals in Lake, private company employees (138 | 62.4%), self-employed (incorporated) (41 | 18.5%), and state government employees (26 | 11.8%) make up the most common classes of employment.
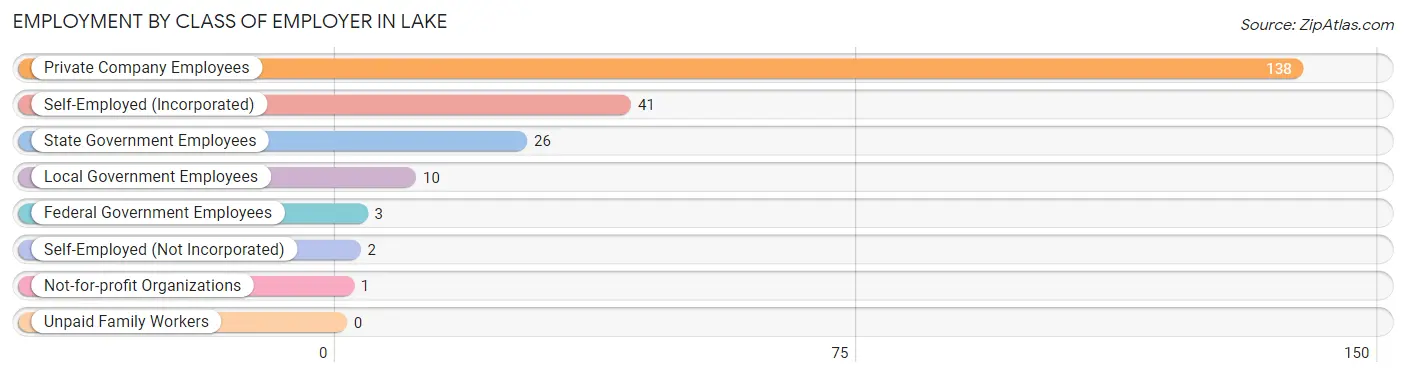
| Employer Class | # Employees | % Employees |
| Private Company Employees | 138 | 62.4% |
| Self-Employed (Incorporated) | 41 | 18.5% |
| Self-Employed (Not Incorporated) | 2 | 0.9% |
| Not-for-profit Organizations | 1 | 0.4% |
| Local Government Employees | 10 | 4.5% |
| State Government Employees | 26 | 11.8% |
| Federal Government Employees | 3 | 1.4% |
| Unpaid Family Workers | 0 | 0.0% |
| Total | 221 | 100.0% |
Employment Status by Age in Lake
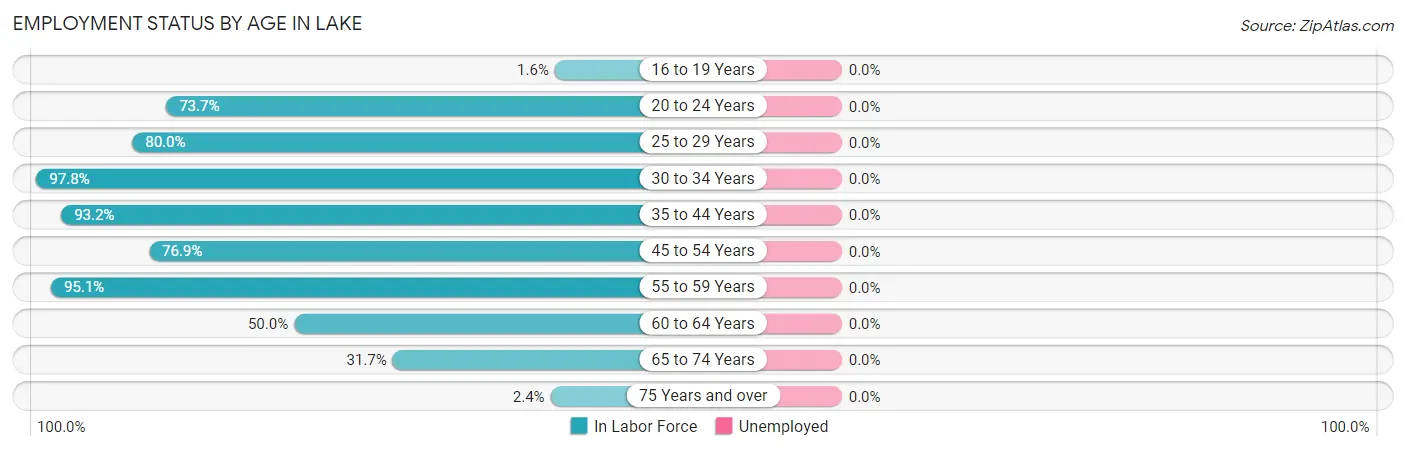
| Age Bracket | In Labor Force | Unemployed |
| 16 to 19 Years | 1 (1.6%) | 0 (0.0%) |
| 20 to 24 Years | 14 (73.7%) | 0 (0.0%) |
| 25 to 29 Years | 16 (80.0%) | 0 (0.0%) |
| 30 to 34 Years | 45 (97.8%) | 0 (0.0%) |
| 35 to 44 Years | 41 (93.2%) | 0 (0.0%) |
| 45 to 54 Years | 40 (76.9%) | 0 (0.0%) |
| 55 to 59 Years | 39 (95.1%) | 0 (0.0%) |
| 60 to 64 Years | 11 (50.0%) | 0 (0.0%) |
| 65 to 74 Years | 13 (31.7%) | 0 (0.0%) |
| 75 Years and over | 1 (2.4%) | 0 (0.0%) |
| Total | 221 (56.7%) | 0 (0.0%) |
Employment Status by Educational Attainment in Lake
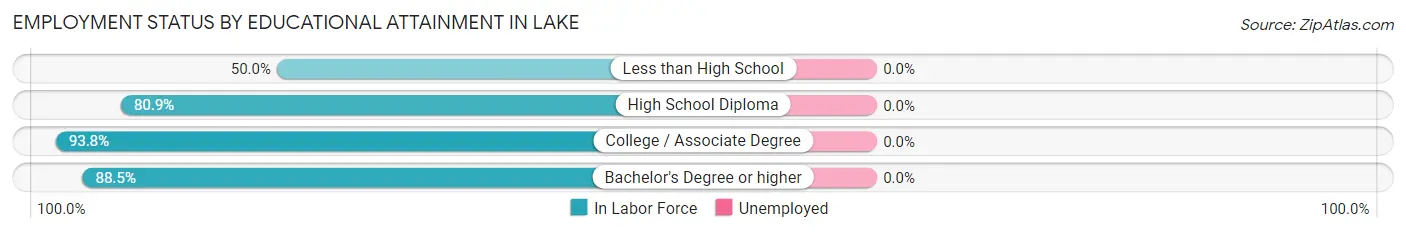
| Educational Attainment | In Labor Force | Unemployed |
| Less than High School | 7 (50.0%) | 0 (0.0%) |
| High School Diploma | 72 (80.9%) | 0 (0.0%) |
| College / Associate Degree | 90 (93.8%) | 0 (0.0%) |
| Bachelor's Degree or higher | 23 (88.5%) | 0 (0.0%) |
| Total | 192 (85.3%) | 0 (0.0%) |
Employment Occupations by Sex in Lake
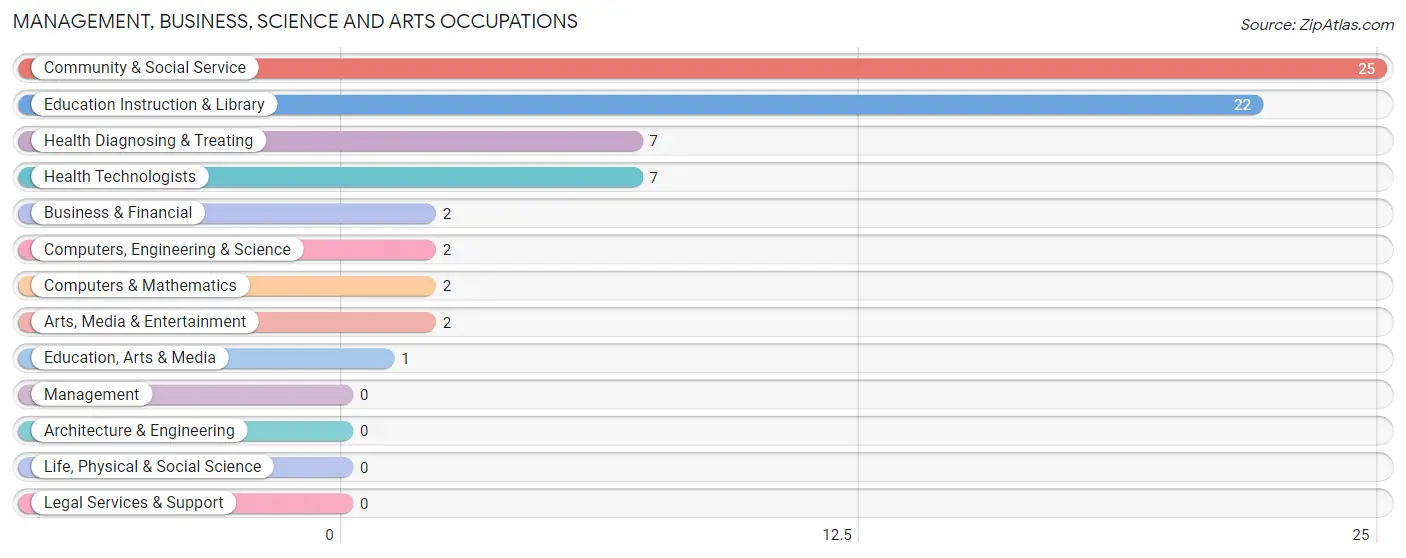
Management, Business, Science and Arts Occupations
The most common Management, Business, Science and Arts occupations in Lake are Community & Social Service (25 | 11.3%), Education Instruction & Library (22 | 10.0%), Health Diagnosing & Treating (7 | 3.2%), Health Technologists (7 | 3.2%), and Business & Financial (2 | 0.9%).
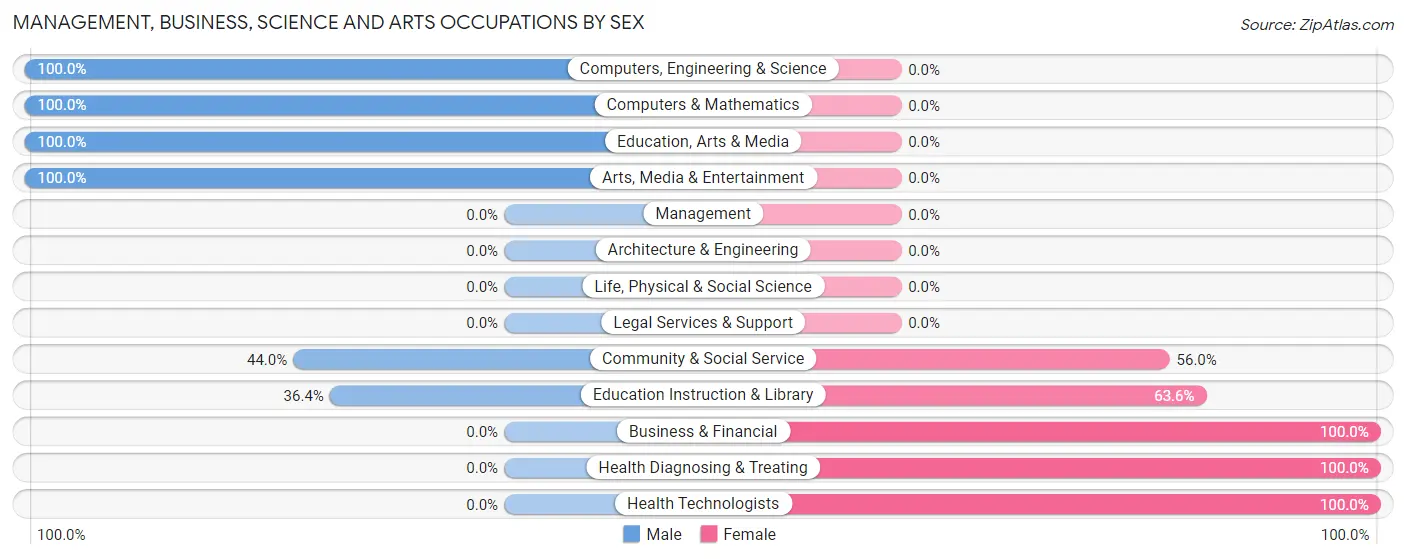
Management, Business, Science and Arts Occupations by Sex
Within the Management, Business, Science and Arts occupations in Lake, the most male-oriented occupations are Computers, Engineering & Science (100.0%), Computers & Mathematics (100.0%), and Education, Arts & Media (100.0%), while the most female-oriented occupations are Business & Financial (100.0%), Health Diagnosing & Treating (100.0%), and Health Technologists (100.0%).
| Occupation | Male | Female |
| Management | 0 (0.0%) | 0 (0.0%) |
| Business & Financial | 0 (0.0%) | 2 (100.0%) |
| Computers, Engineering & Science | 2 (100.0%) | 0 (0.0%) |
| Computers & Mathematics | 2 (100.0%) | 0 (0.0%) |
| Architecture & Engineering | 0 (0.0%) | 0 (0.0%) |
| Life, Physical & Social Science | 0 (0.0%) | 0 (0.0%) |
| Community & Social Service | 11 (44.0%) | 14 (56.0%) |
| Education, Arts & Media | 1 (100.0%) | 0 (0.0%) |
| Legal Services & Support | 0 (0.0%) | 0 (0.0%) |
| Education Instruction & Library | 8 (36.4%) | 14 (63.6%) |
| Arts, Media & Entertainment | 2 (100.0%) | 0 (0.0%) |
| Health Diagnosing & Treating | 0 (0.0%) | 7 (100.0%) |
| Health Technologists | 0 (0.0%) | 7 (100.0%) |
| Total (Category) | 13 (36.1%) | 23 (63.9%) |
| Total (Overall) | 105 (47.5%) | 116 (52.5%) |
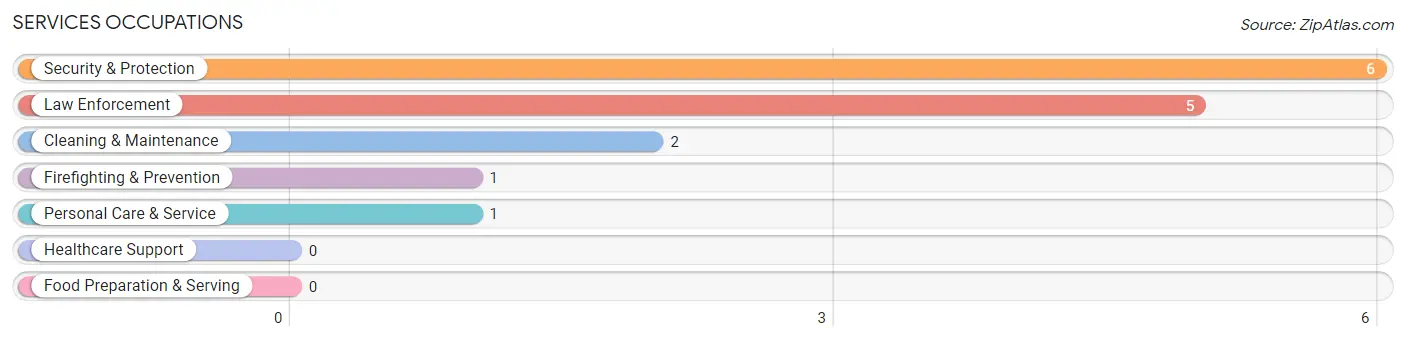
Services Occupations
The most common Services occupations in Lake are Security & Protection (6 | 2.7%), Law Enforcement (5 | 2.3%), Cleaning & Maintenance (2 | 0.9%), Firefighting & Prevention (1 | 0.4%), and Personal Care & Service (1 | 0.4%).
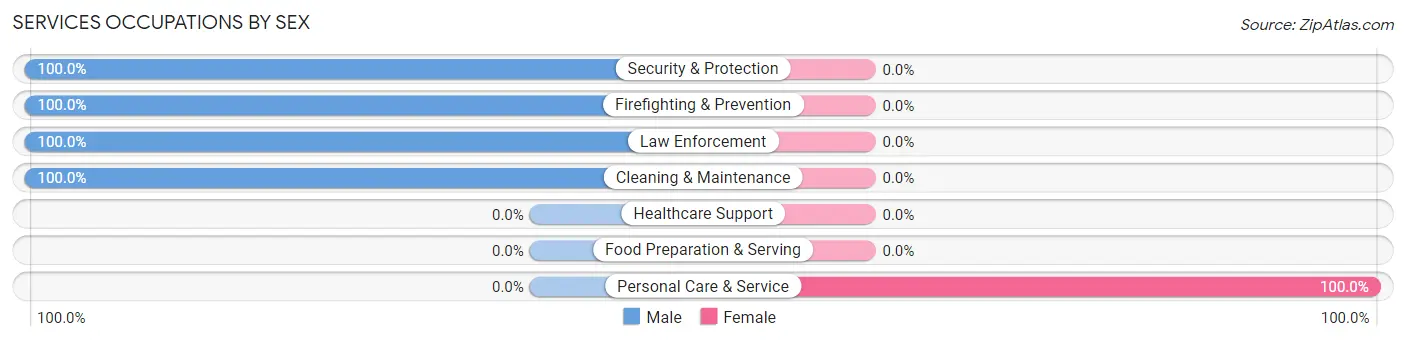
Services Occupations by Sex
| Occupation | Male | Female |
| Healthcare Support | 0 (0.0%) | 0 (0.0%) |
| Security & Protection | 6 (100.0%) | 0 (0.0%) |
| Firefighting & Prevention | 1 (100.0%) | 0 (0.0%) |
| Law Enforcement | 5 (100.0%) | 0 (0.0%) |
| Food Preparation & Serving | 0 (0.0%) | 0 (0.0%) |
| Cleaning & Maintenance | 2 (100.0%) | 0 (0.0%) |
| Personal Care & Service | 0 (0.0%) | 1 (100.0%) |
| Total (Category) | 8 (88.9%) | 1 (11.1%) |
| Total (Overall) | 105 (47.5%) | 116 (52.5%) |
Sales and Office Occupations
The most common Sales and Office occupations in Lake are Office & Administration (44 | 19.9%), and Sales & Related (14 | 6.3%).
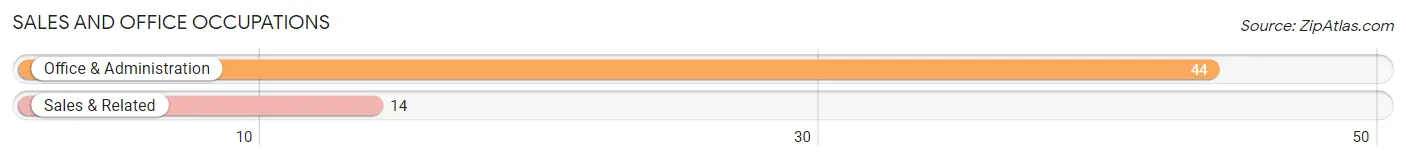
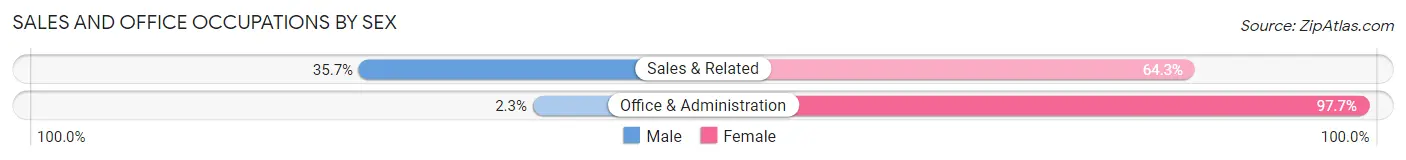
Sales and Office Occupations by Sex
| Occupation | Male | Female |
| Sales & Related | 5 (35.7%) | 9 (64.3%) |
| Office & Administration | 1 (2.3%) | 43 (97.7%) |
| Total (Category) | 6 (10.3%) | 52 (89.7%) |
| Total (Overall) | 105 (47.5%) | 116 (52.5%) |
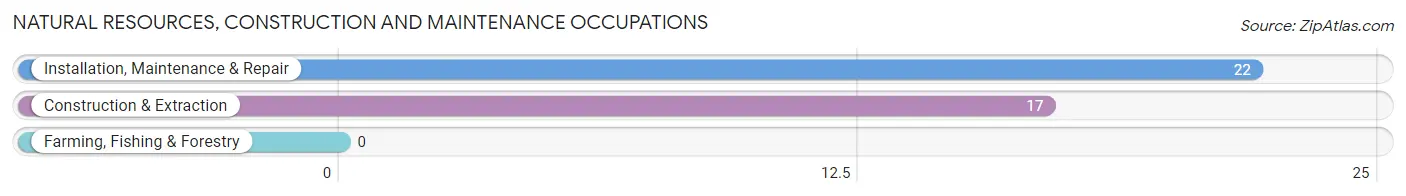
Natural Resources, Construction and Maintenance Occupations
The most common Natural Resources, Construction and Maintenance occupations in Lake are Installation, Maintenance & Repair (22 | 10.0%), and Construction & Extraction (17 | 7.7%).
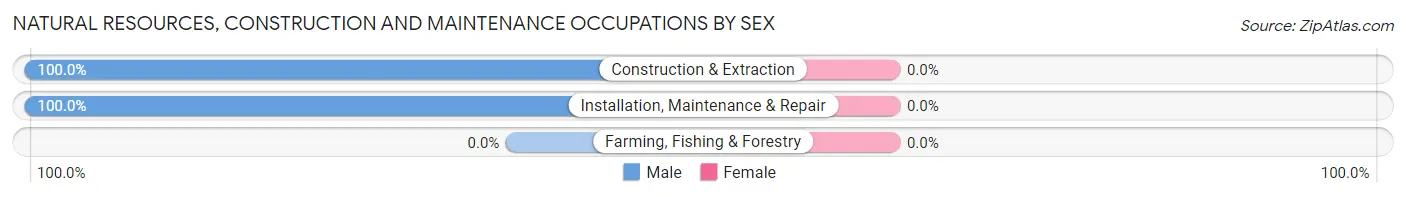
Natural Resources, Construction and Maintenance Occupations by Sex
| Occupation | Male | Female |
| Farming, Fishing & Forestry | 0 (0.0%) | 0 (0.0%) |
| Construction & Extraction | 17 (100.0%) | 0 (0.0%) |
| Installation, Maintenance & Repair | 22 (100.0%) | 0 (0.0%) |
| Total (Category) | 39 (100.0%) | 0 (0.0%) |
| Total (Overall) | 105 (47.5%) | 116 (52.5%) |
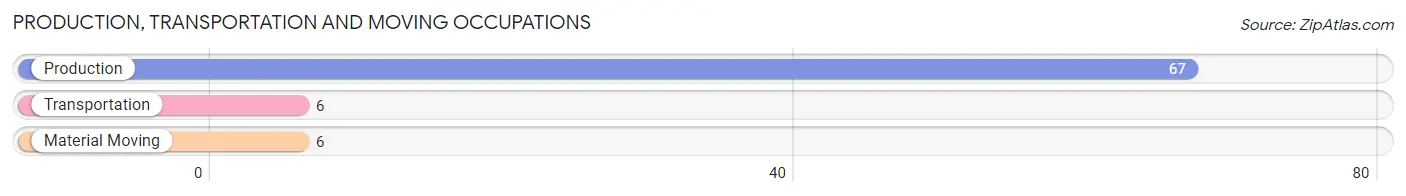
Production, Transportation and Moving Occupations
The most common Production, Transportation and Moving occupations in Lake are Production (67 | 30.3%), Transportation (6 | 2.7%), and Material Moving (6 | 2.7%).
Production, Transportation and Moving Occupations by Sex
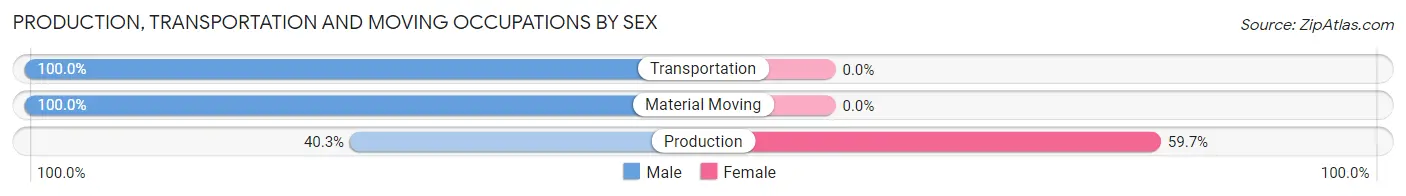
| Occupation | Male | Female |
| Production | 27 (40.3%) | 40 (59.7%) |
| Transportation | 6 (100.0%) | 0 (0.0%) |
| Material Moving | 6 (100.0%) | 0 (0.0%) |
| Total (Category) | 39 (49.4%) | 40 (50.6%) |
| Total (Overall) | 105 (47.5%) | 116 (52.5%) |
Employment Industries by Sex in Lake
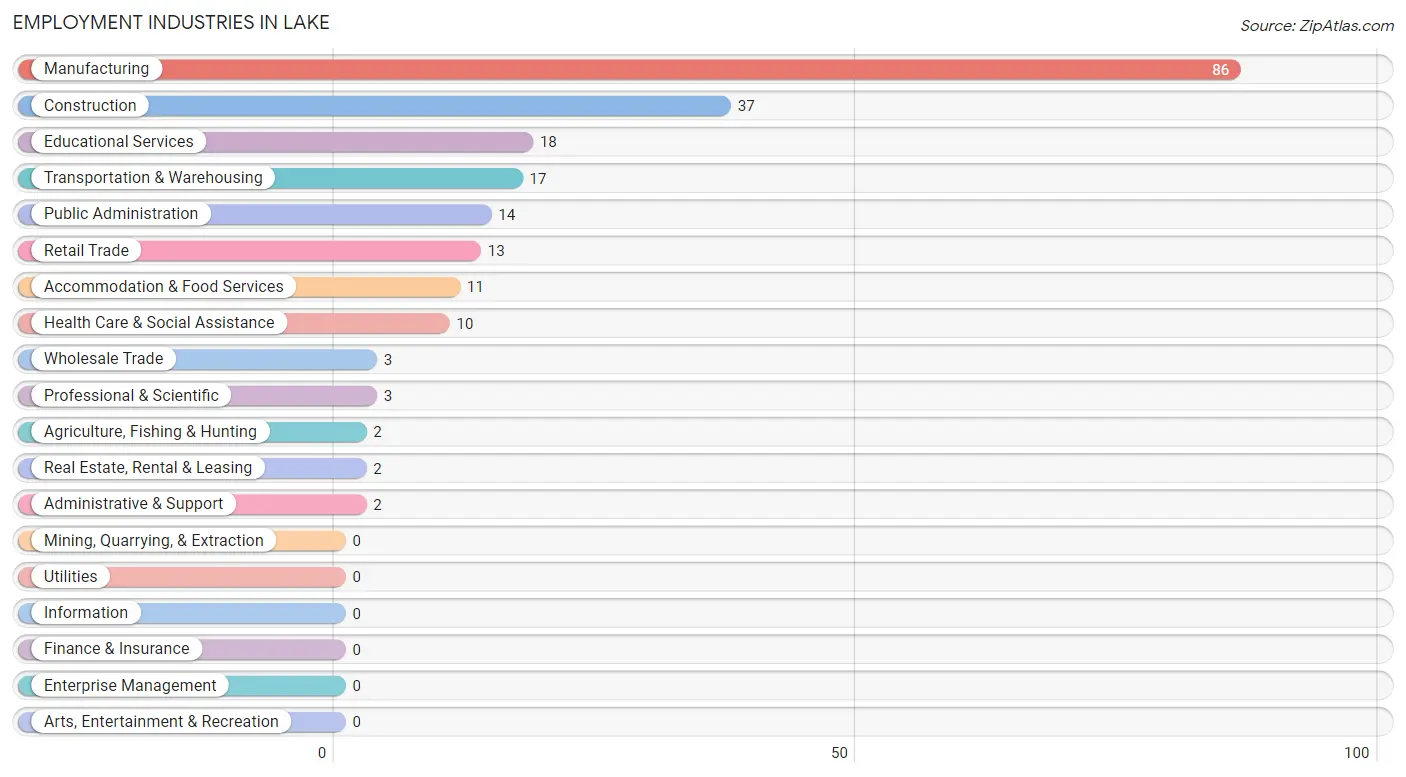
Employment Industries in Lake
The major employment industries in Lake include Manufacturing (86 | 38.9%), Construction (37 | 16.7%), Educational Services (18 | 8.1%), Transportation & Warehousing (17 | 7.7%), and Public Administration (14 | 6.3%).
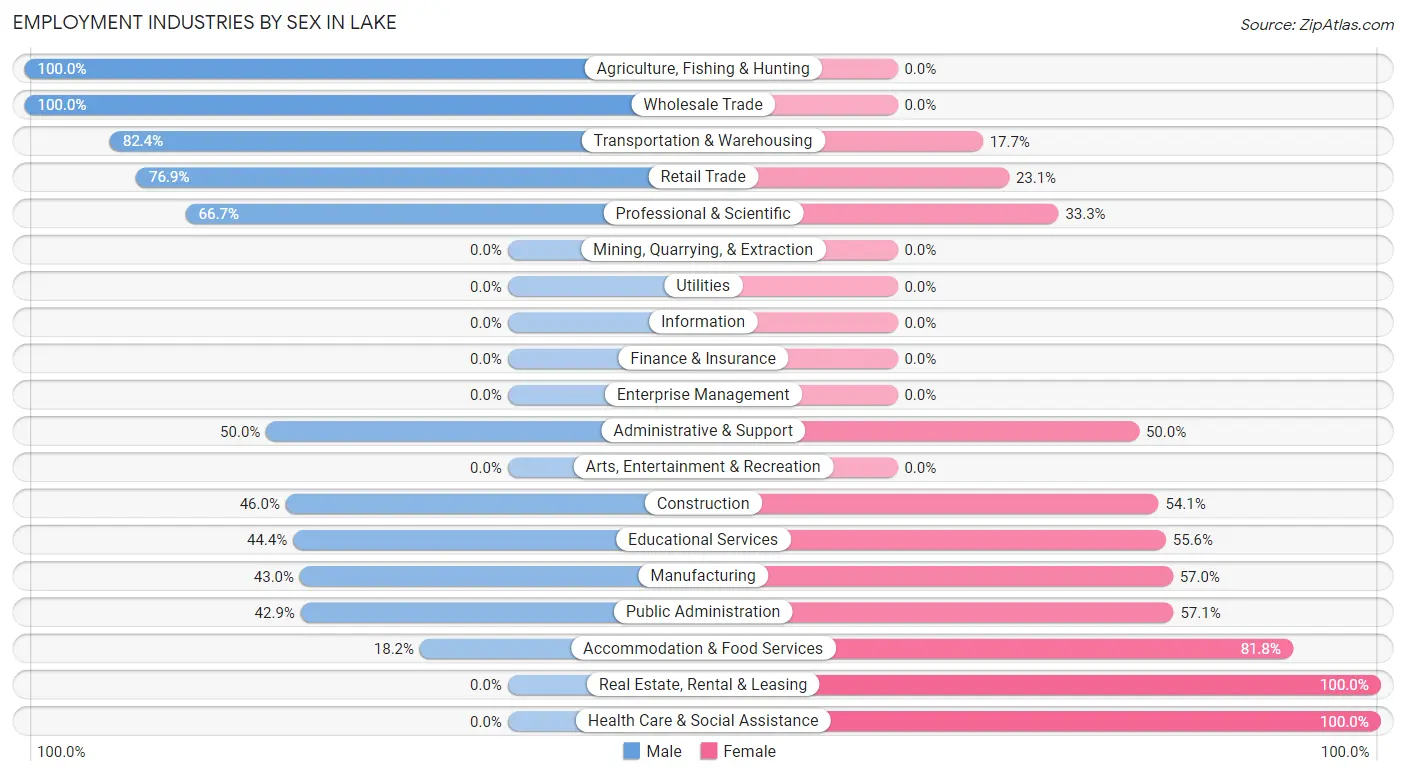
Employment Industries by Sex in Lake
The Lake industries that see more men than women are Agriculture, Fishing & Hunting (100.0%), Wholesale Trade (100.0%), and Transportation & Warehousing (82.4%), whereas the industries that tend to have a higher number of women are Real Estate, Rental & Leasing (100.0%), Health Care & Social Assistance (100.0%), and Accommodation & Food Services (81.8%).
| Industry | Male | Female |
| Agriculture, Fishing & Hunting | 2 (100.0%) | 0 (0.0%) |
| Mining, Quarrying, & Extraction | 0 (0.0%) | 0 (0.0%) |
| Construction | 17 (46.0%) | 20 (54.0%) |
| Manufacturing | 37 (43.0%) | 49 (57.0%) |
| Wholesale Trade | 3 (100.0%) | 0 (0.0%) |
| Retail Trade | 10 (76.9%) | 3 (23.1%) |
| Transportation & Warehousing | 14 (82.4%) | 3 (17.6%) |
| Utilities | 0 (0.0%) | 0 (0.0%) |
| Information | 0 (0.0%) | 0 (0.0%) |
| Finance & Insurance | 0 (0.0%) | 0 (0.0%) |
| Real Estate, Rental & Leasing | 0 (0.0%) | 2 (100.0%) |
| Professional & Scientific | 2 (66.7%) | 1 (33.3%) |
| Enterprise Management | 0 (0.0%) | 0 (0.0%) |
| Administrative & Support | 1 (50.0%) | 1 (50.0%) |
| Educational Services | 8 (44.4%) | 10 (55.6%) |
| Health Care & Social Assistance | 0 (0.0%) | 10 (100.0%) |
| Arts, Entertainment & Recreation | 0 (0.0%) | 0 (0.0%) |
| Accommodation & Food Services | 2 (18.2%) | 9 (81.8%) |
| Public Administration | 6 (42.9%) | 8 (57.1%) |
| Total | 105 (47.5%) | 116 (52.5%) |
Education in Lake
School Enrollment in Lake
The most common levels of schooling among the 174 students in Lake are high school (63 | 36.2%), elementary school (46 | 26.4%), and middle school (27 | 15.5%).
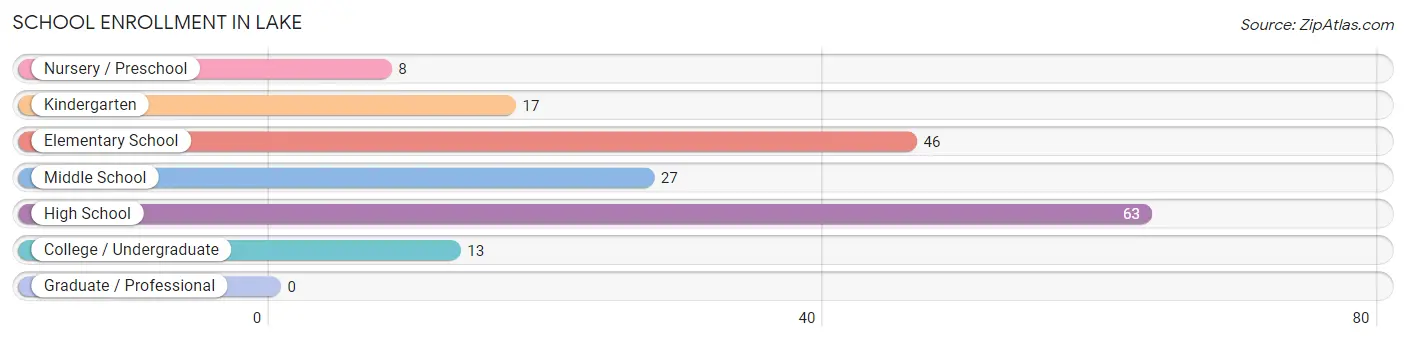
| School Level | # Students | % Students |
| Nursery / Preschool | 8 | 4.6% |
| Kindergarten | 17 | 9.8% |
| Elementary School | 46 | 26.4% |
| Middle School | 27 | 15.5% |
| High School | 63 | 36.2% |
| College / Undergraduate | 13 | 7.5% |
| Graduate / Professional | 0 | 0.0% |
| Total | 174 | 100.0% |
School Enrollment by Age by Funding Source in Lake
Out of a total of 174 students who are enrolled in schools in Lake, 18 (10.3%) attend a private institution, while the remaining 156 (89.7%) are enrolled in public schools. The age group of 3 to 4 year olds has the highest likelihood of being enrolled in private schools, with 8 (100.0% in the age bracket) enrolled. Conversely, the age group of 10 to 14 year olds has the lowest likelihood of being enrolled in a private school, with 29 (100.0% in the age bracket) attending a public institution.
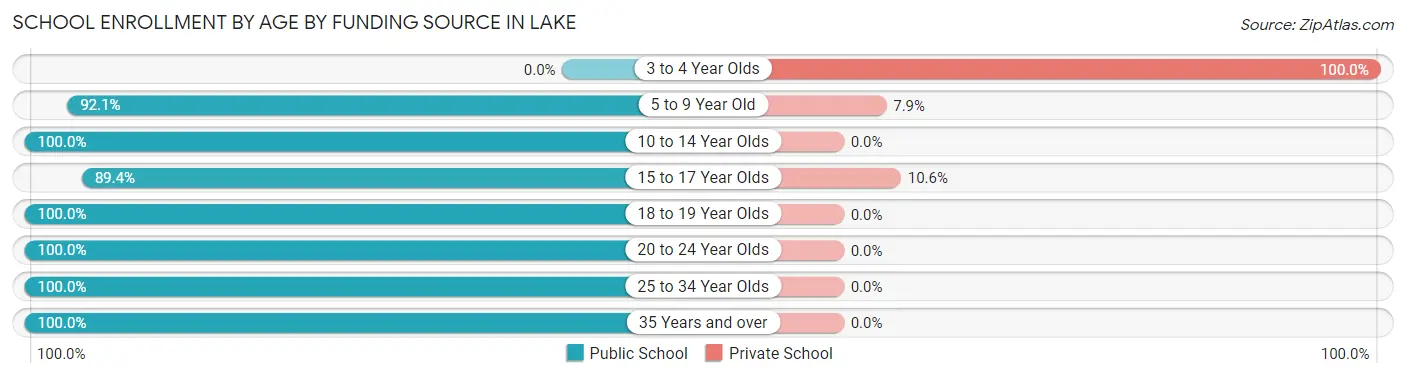
| Age Bracket | Public School | Private School |
| 3 to 4 Year Olds | 0 (0.0%) | 8 (100.0%) |
| 5 to 9 Year Old | 58 (92.1%) | 5 (7.9%) |
| 10 to 14 Year Olds | 29 (100.0%) | 0 (0.0%) |
| 15 to 17 Year Olds | 42 (89.4%) | 5 (10.6%) |
| 18 to 19 Year Olds | 15 (100.0%) | 0 (0.0%) |
| 20 to 24 Year Olds | 4 (100.0%) | 0 (0.0%) |
| 25 to 34 Year Olds | 6 (100.0%) | 0 (0.0%) |
| 35 Years and over | 2 (100.0%) | 0 (0.0%) |
| Total | 156 (89.7%) | 18 (10.3%) |
Educational Attainment by Field of Study in Lake
Education (16 | 48.5%), business (7 | 21.2%), multidisciplinary studies (5 | 15.1%), bio, nature & agricultural (2 | 6.1%), and arts & humanities (2 | 6.1%) are the most common fields of study among 33 individuals in Lake who have obtained a bachelor's degree or higher.
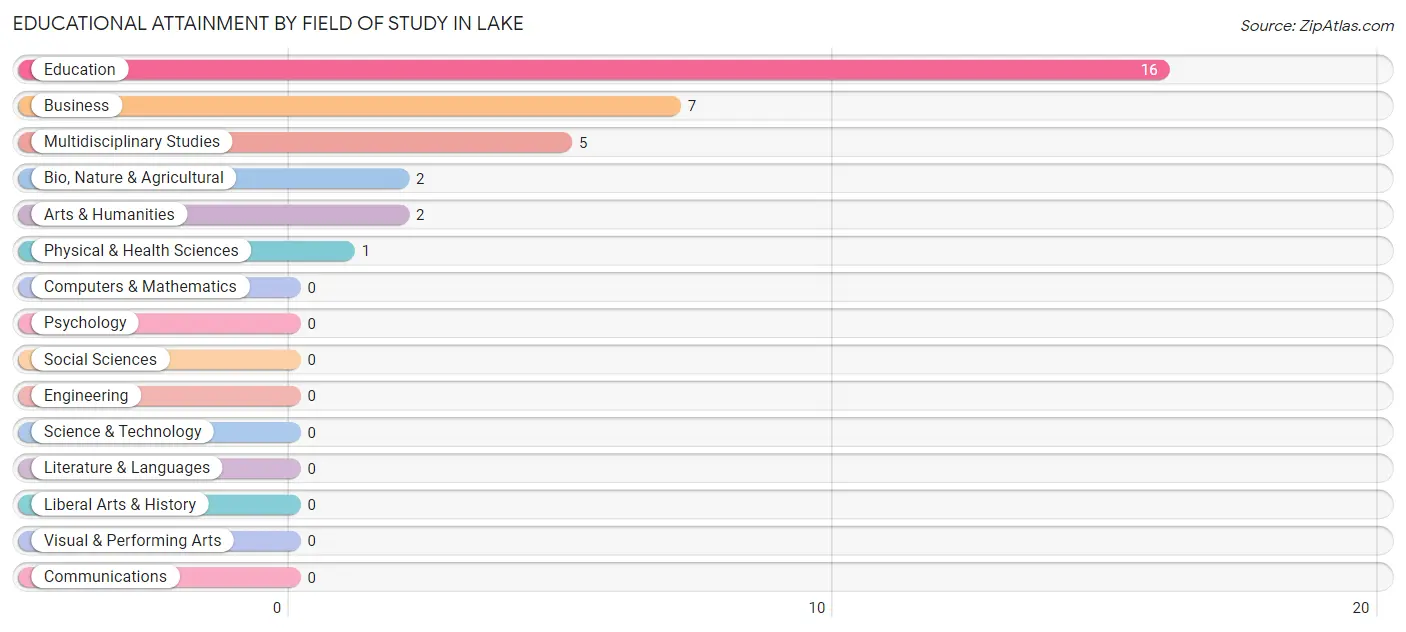
| Field of Study | # Graduates | % Graduates |
| Computers & Mathematics | 0 | 0.0% |
| Bio, Nature & Agricultural | 2 | 6.1% |
| Physical & Health Sciences | 1 | 3.0% |
| Psychology | 0 | 0.0% |
| Social Sciences | 0 | 0.0% |
| Engineering | 0 | 0.0% |
| Multidisciplinary Studies | 5 | 15.1% |
| Science & Technology | 0 | 0.0% |
| Business | 7 | 21.2% |
| Education | 16 | 48.5% |
| Literature & Languages | 0 | 0.0% |
| Liberal Arts & History | 0 | 0.0% |
| Visual & Performing Arts | 0 | 0.0% |
| Communications | 0 | 0.0% |
| Arts & Humanities | 2 | 6.1% |
| Total | 33 | 100.0% |
Transportation & Commute in Lake
Vehicle Availability by Sex in Lake
The most prevalent vehicle ownership categories in Lake are males with 2 vehicles (49, accounting for 46.7%) and females with 2 vehicles (38, making up 42.2%).
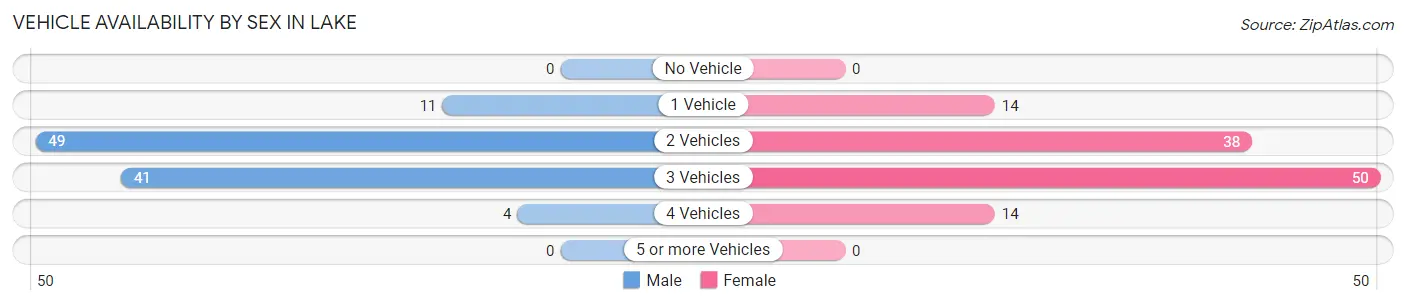
| Vehicles Available | Male | Female |
| No Vehicle | 0 (0.0%) | 0 (0.0%) |
| 1 Vehicle | 11 (10.5%) | 14 (12.1%) |
| 2 Vehicles | 49 (46.7%) | 38 (32.8%) |
| 3 Vehicles | 41 (39.1%) | 50 (43.1%) |
| 4 Vehicles | 4 (3.8%) | 14 (12.1%) |
| 5 or more Vehicles | 0 (0.0%) | 0 (0.0%) |
| Total | 105 (100.0%) | 116 (100.0%) |
Commute Time in Lake
The most frequently occuring commute durations in Lake are 15 to 19 minutes (64 commuters, 29.2%), 10 to 14 minutes (44 commuters, 20.1%), and 20 to 24 minutes (39 commuters, 17.8%).
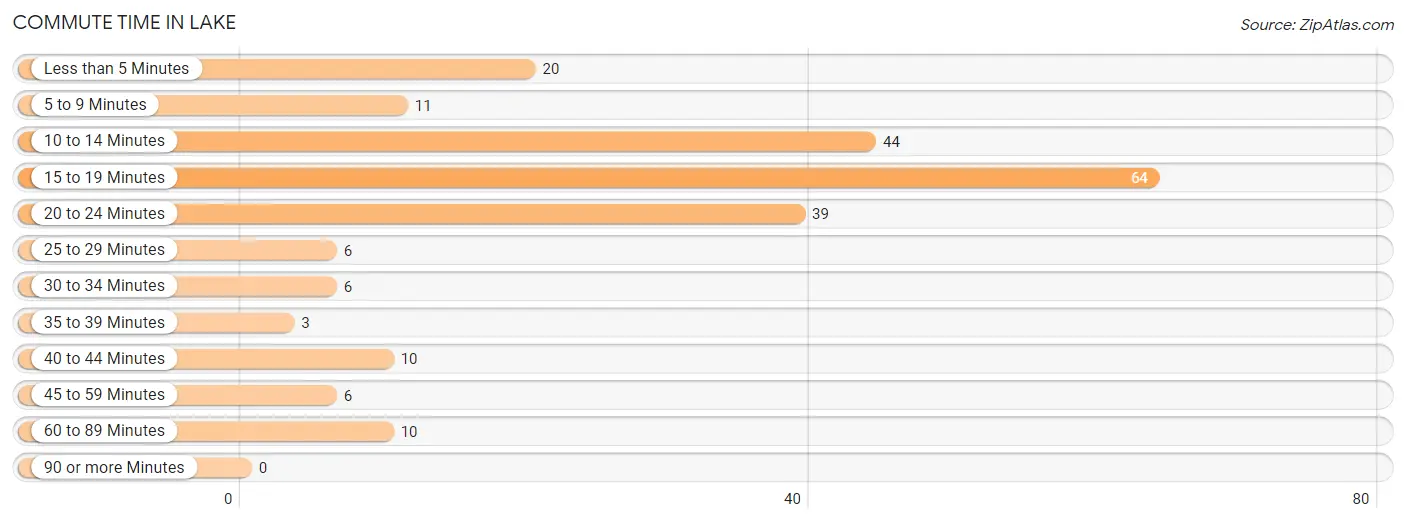
| Commute Time | # Commuters | % Commuters |
| Less than 5 Minutes | 20 | 9.1% |
| 5 to 9 Minutes | 11 | 5.0% |
| 10 to 14 Minutes | 44 | 20.1% |
| 15 to 19 Minutes | 64 | 29.2% |
| 20 to 24 Minutes | 39 | 17.8% |
| 25 to 29 Minutes | 6 | 2.7% |
| 30 to 34 Minutes | 6 | 2.7% |
| 35 to 39 Minutes | 3 | 1.4% |
| 40 to 44 Minutes | 10 | 4.6% |
| 45 to 59 Minutes | 6 | 2.7% |
| 60 to 89 Minutes | 10 | 4.6% |
| 90 or more Minutes | 0 | 0.0% |
Commute Time by Sex in Lake
The most common commute times in Lake are 15 to 19 minutes (37 commuters, 35.9%) for males and 10 to 14 minutes (33 commuters, 28.4%) for females.
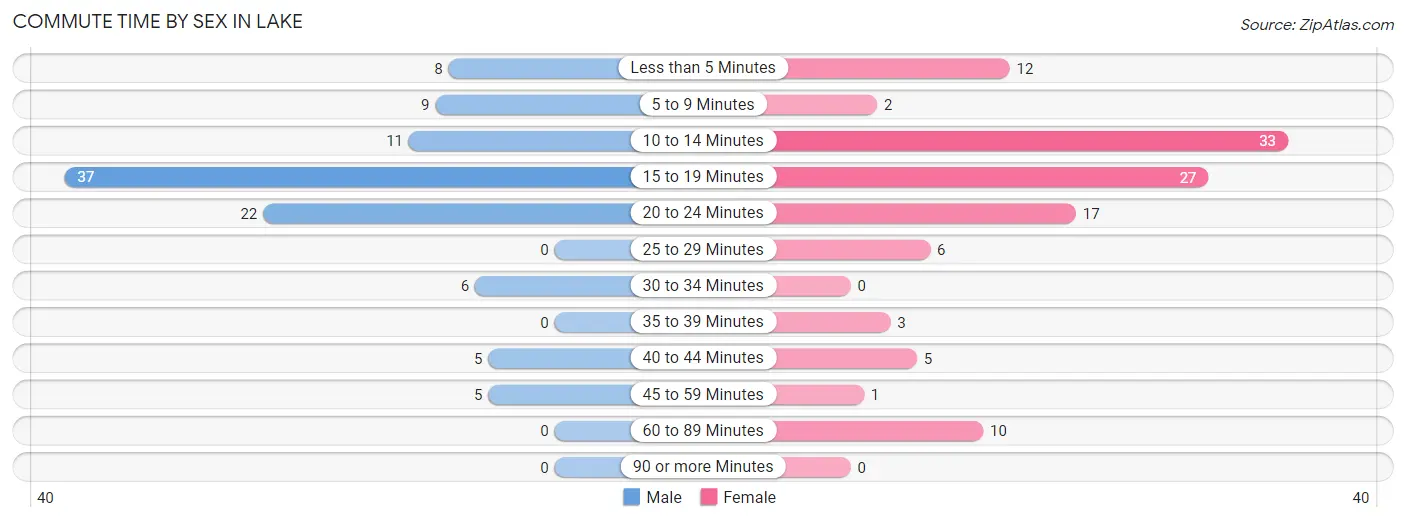
| Commute Time | Male | Female |
| Less than 5 Minutes | 8 (7.8%) | 12 (10.3%) |
| 5 to 9 Minutes | 9 (8.7%) | 2 (1.7%) |
| 10 to 14 Minutes | 11 (10.7%) | 33 (28.4%) |
| 15 to 19 Minutes | 37 (35.9%) | 27 (23.3%) |
| 20 to 24 Minutes | 22 (21.4%) | 17 (14.7%) |
| 25 to 29 Minutes | 0 (0.0%) | 6 (5.2%) |
| 30 to 34 Minutes | 6 (5.8%) | 0 (0.0%) |
| 35 to 39 Minutes | 0 (0.0%) | 3 (2.6%) |
| 40 to 44 Minutes | 5 (4.9%) | 5 (4.3%) |
| 45 to 59 Minutes | 5 (4.9%) | 1 (0.9%) |
| 60 to 89 Minutes | 0 (0.0%) | 10 (8.6%) |
| 90 or more Minutes | 0 (0.0%) | 0 (0.0%) |
Time of Departure to Work by Sex in Lake
The most frequent times of departure to work in Lake are 7:00 AM to 7:29 AM (23, 22.3%) for males and 8:00 AM to 8:29 AM (28, 24.1%) for females.
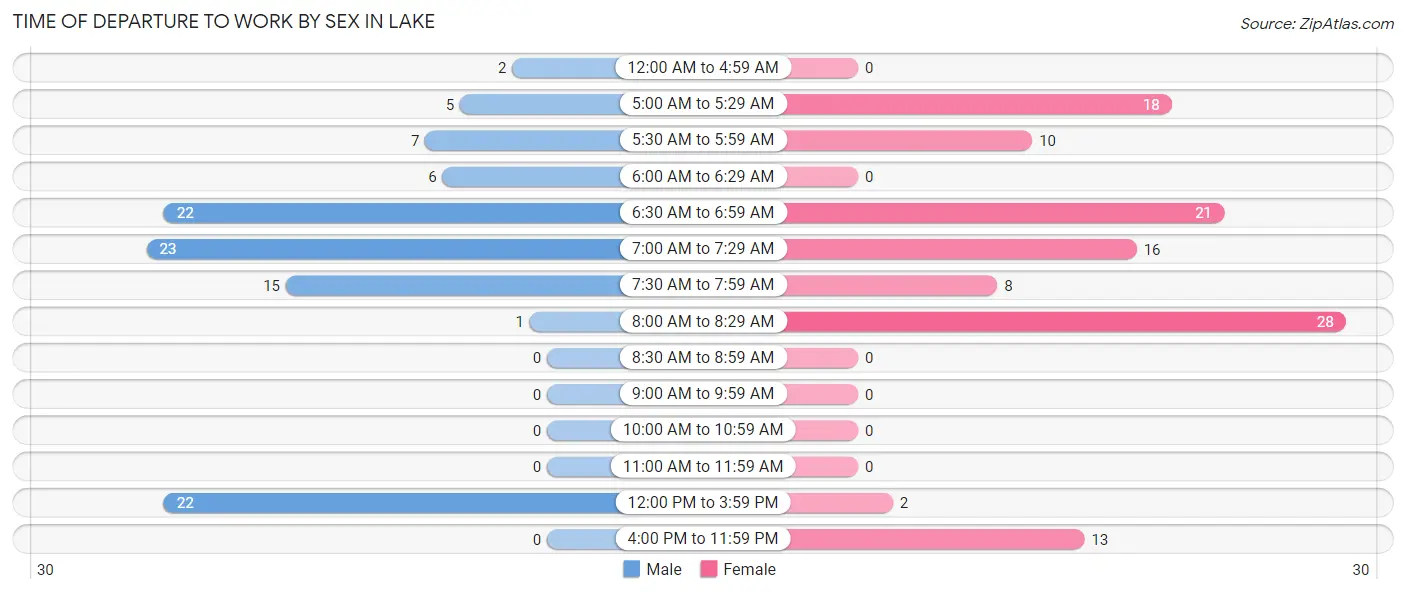
| Time of Departure | Male | Female |
| 12:00 AM to 4:59 AM | 2 (1.9%) | 0 (0.0%) |
| 5:00 AM to 5:29 AM | 5 (4.9%) | 18 (15.5%) |
| 5:30 AM to 5:59 AM | 7 (6.8%) | 10 (8.6%) |
| 6:00 AM to 6:29 AM | 6 (5.8%) | 0 (0.0%) |
| 6:30 AM to 6:59 AM | 22 (21.4%) | 21 (18.1%) |
| 7:00 AM to 7:29 AM | 23 (22.3%) | 16 (13.8%) |
| 7:30 AM to 7:59 AM | 15 (14.6%) | 8 (6.9%) |
| 8:00 AM to 8:29 AM | 1 (1.0%) | 28 (24.1%) |
| 8:30 AM to 8:59 AM | 0 (0.0%) | 0 (0.0%) |
| 9:00 AM to 9:59 AM | 0 (0.0%) | 0 (0.0%) |
| 10:00 AM to 10:59 AM | 0 (0.0%) | 0 (0.0%) |
| 11:00 AM to 11:59 AM | 0 (0.0%) | 0 (0.0%) |
| 12:00 PM to 3:59 PM | 22 (21.4%) | 2 (1.7%) |
| 4:00 PM to 11:59 PM | 0 (0.0%) | 13 (11.2%) |
| Total | 103 (100.0%) | 116 (100.0%) |
Housing Occupancy in Lake
Occupancy by Ownership in Lake
Of the total 171 dwellings in Lake, owner-occupied units account for 121 (70.8%), while renter-occupied units make up 50 (29.2%).
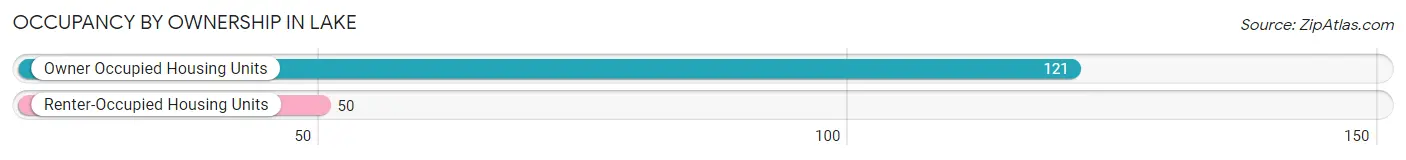
| Occupancy | # Housing Units | % Housing Units |
| Owner Occupied Housing Units | 121 | 70.8% |
| Renter-Occupied Housing Units | 50 | 29.2% |
| Total Occupied Housing Units | 171 | 100.0% |
Occupancy by Household Size in Lake
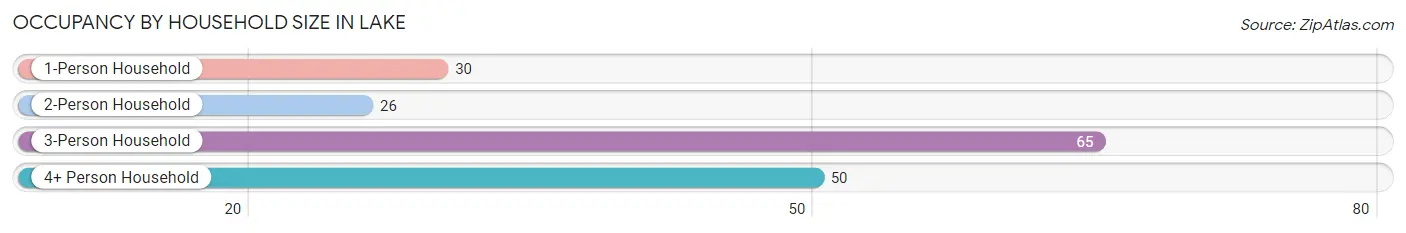
| Household Size | # Housing Units | % Housing Units |
| 1-Person Household | 30 | 17.5% |
| 2-Person Household | 26 | 15.2% |
| 3-Person Household | 65 | 38.0% |
| 4+ Person Household | 50 | 29.2% |
| Total Housing Units | 171 | 100.0% |
Occupancy by Ownership by Household Size in Lake
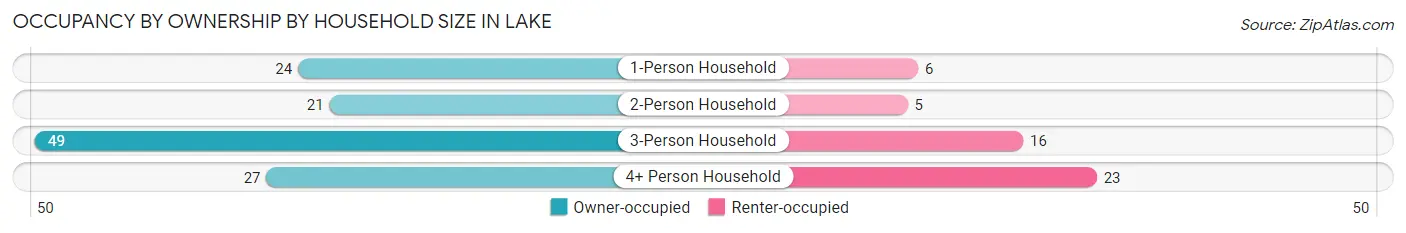
| Household Size | Owner-occupied | Renter-occupied |
| 1-Person Household | 24 (80.0%) | 6 (20.0%) |
| 2-Person Household | 21 (80.8%) | 5 (19.2%) |
| 3-Person Household | 49 (75.4%) | 16 (24.6%) |
| 4+ Person Household | 27 (54.0%) | 23 (46.0%) |
| Total Housing Units | 121 (70.8%) | 50 (29.2%) |
Occupancy by Educational Attainment in Lake
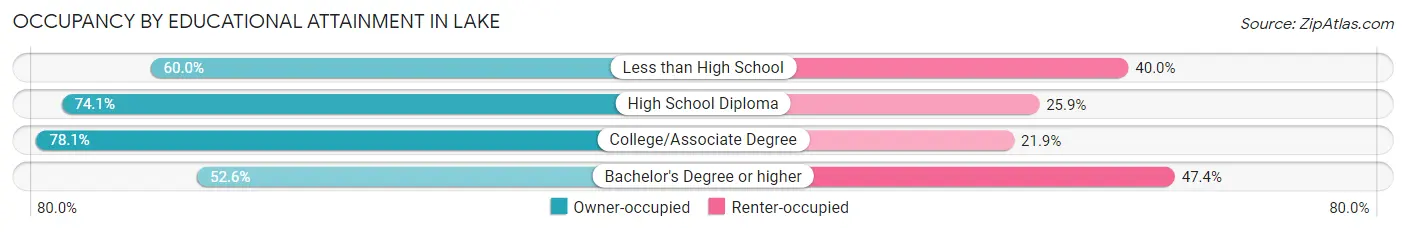
| Household Size | Owner-occupied | Renter-occupied |
| Less than High School | 18 (60.0%) | 12 (40.0%) |
| High School Diploma | 43 (74.1%) | 15 (25.9%) |
| College/Associate Degree | 50 (78.1%) | 14 (21.9%) |
| Bachelor's Degree or higher | 10 (52.6%) | 9 (47.4%) |
Occupancy by Age of Householder in Lake
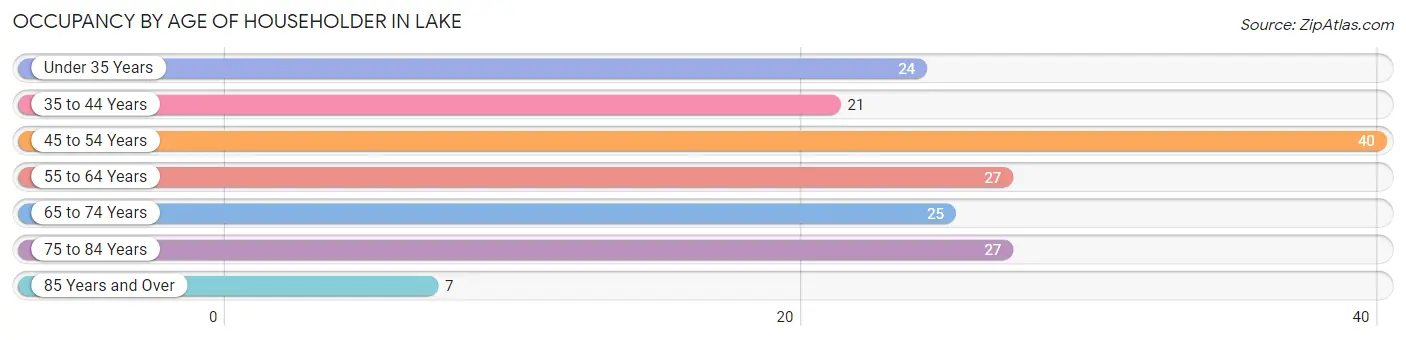
| Age Bracket | # Households | % Households |
| Under 35 Years | 24 | 14.0% |
| 35 to 44 Years | 21 | 12.3% |
| 45 to 54 Years | 40 | 23.4% |
| 55 to 64 Years | 27 | 15.8% |
| 65 to 74 Years | 25 | 14.6% |
| 75 to 84 Years | 27 | 15.8% |
| 85 Years and Over | 7 | 4.1% |
| Total | 171 | 100.0% |
Housing Finances in Lake
Median Income by Occupancy in Lake
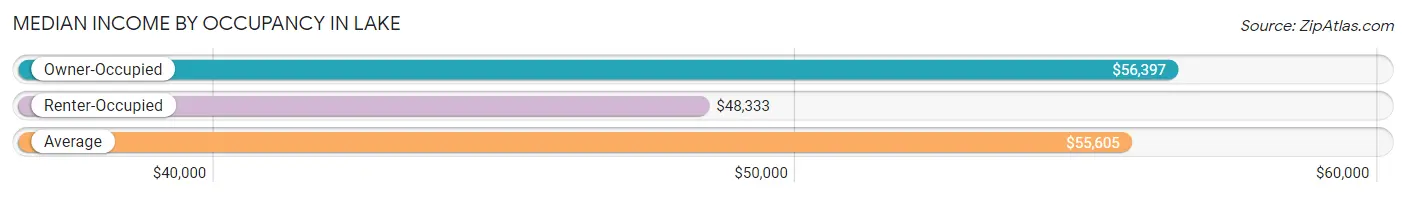
| Occupancy Type | # Households | Median Income |
| Owner-Occupied | 121 (70.8%) | $56,397 |
| Renter-Occupied | 50 (29.2%) | $48,333 |
| Average | 171 (100.0%) | $55,605 |
Occupancy by Householder Income Bracket in Lake
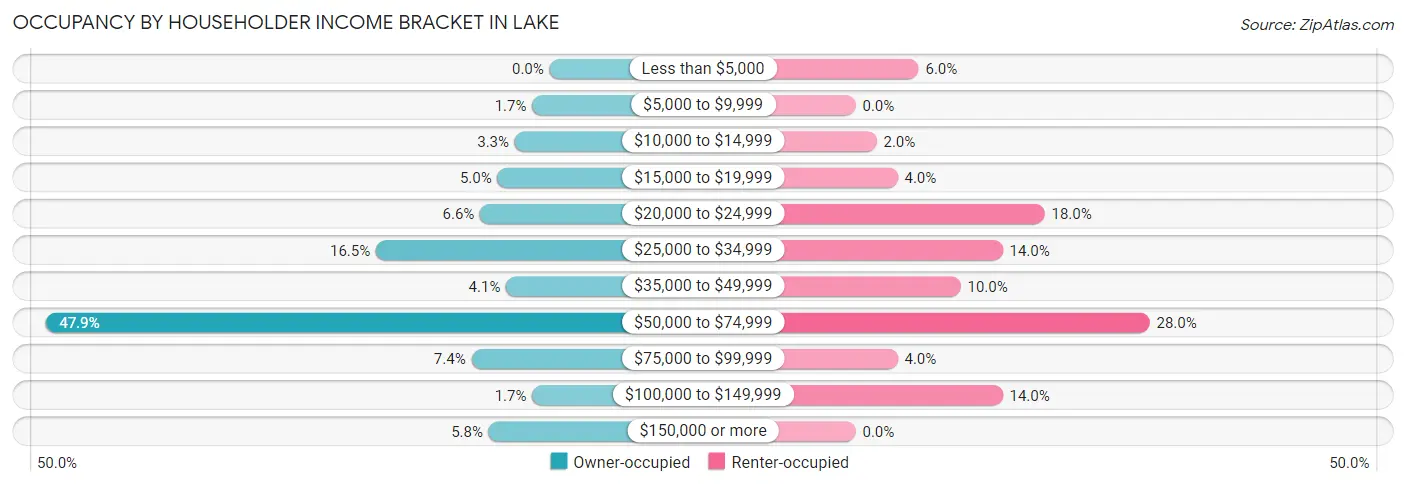
| Income Bracket | Owner-occupied | Renter-occupied |
| Less than $5,000 | 0 (0.0%) | 3 (6.0%) |
| $5,000 to $9,999 | 2 (1.7%) | 0 (0.0%) |
| $10,000 to $14,999 | 4 (3.3%) | 1 (2.0%) |
| $15,000 to $19,999 | 6 (5.0%) | 2 (4.0%) |
| $20,000 to $24,999 | 8 (6.6%) | 9 (18.0%) |
| $25,000 to $34,999 | 20 (16.5%) | 7 (14.0%) |
| $35,000 to $49,999 | 5 (4.1%) | 5 (10.0%) |
| $50,000 to $74,999 | 58 (47.9%) | 14 (28.0%) |
| $75,000 to $99,999 | 9 (7.4%) | 2 (4.0%) |
| $100,000 to $149,999 | 2 (1.7%) | 7 (14.0%) |
| $150,000 or more | 7 (5.8%) | 0 (0.0%) |
| Total | 121 (100.0%) | 50 (100.0%) |
Monthly Housing Cost Tiers in Lake
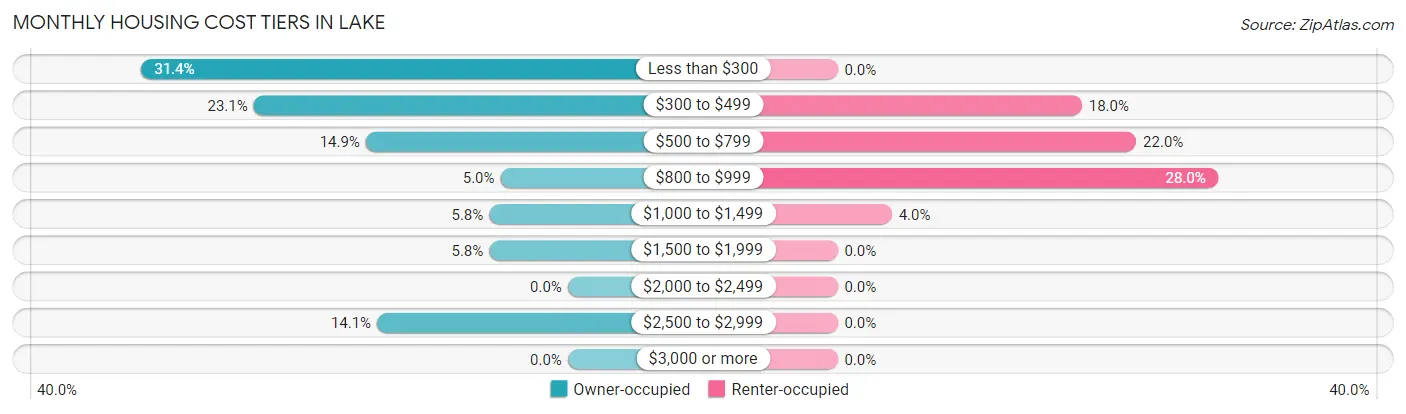
| Monthly Cost | Owner-occupied | Renter-occupied |
| Less than $300 | 38 (31.4%) | 0 (0.0%) |
| $300 to $499 | 28 (23.1%) | 9 (18.0%) |
| $500 to $799 | 18 (14.9%) | 11 (22.0%) |
| $800 to $999 | 6 (5.0%) | 14 (28.0%) |
| $1,000 to $1,499 | 7 (5.8%) | 2 (4.0%) |
| $1,500 to $1,999 | 7 (5.8%) | 0 (0.0%) |
| $2,000 to $2,499 | 0 (0.0%) | 0 (0.0%) |
| $2,500 to $2,999 | 17 (14.1%) | 0 (0.0%) |
| $3,000 or more | 0 (0.0%) | 0 (0.0%) |
| Total | 121 (100.0%) | 50 (100.0%) |
Physical Housing Characteristics in Lake
Housing Structures in Lake
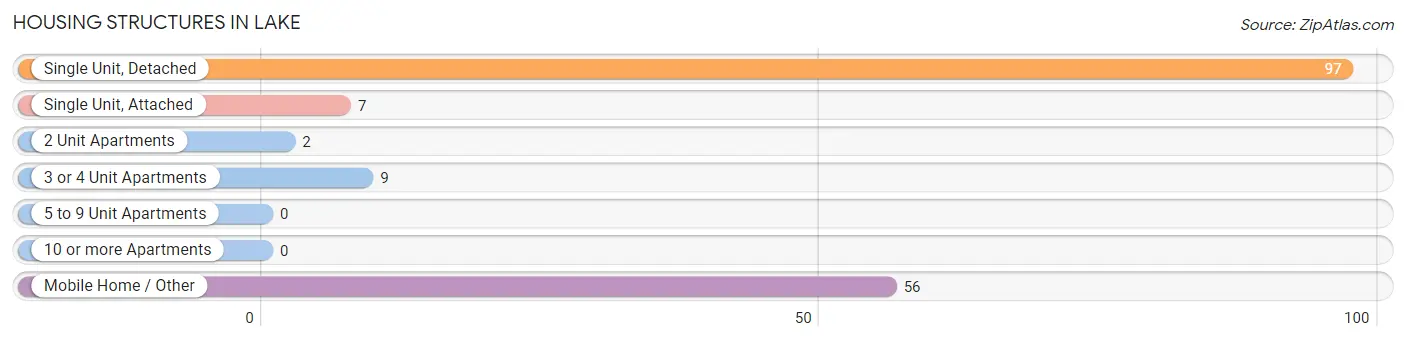
| Structure Type | # Housing Units | % Housing Units |
| Single Unit, Detached | 97 | 56.7% |
| Single Unit, Attached | 7 | 4.1% |
| 2 Unit Apartments | 2 | 1.2% |
| 3 or 4 Unit Apartments | 9 | 5.3% |
| 5 to 9 Unit Apartments | 0 | 0.0% |
| 10 or more Apartments | 0 | 0.0% |
| Mobile Home / Other | 56 | 32.8% |
| Total | 171 | 100.0% |
Housing Structures by Occupancy in Lake
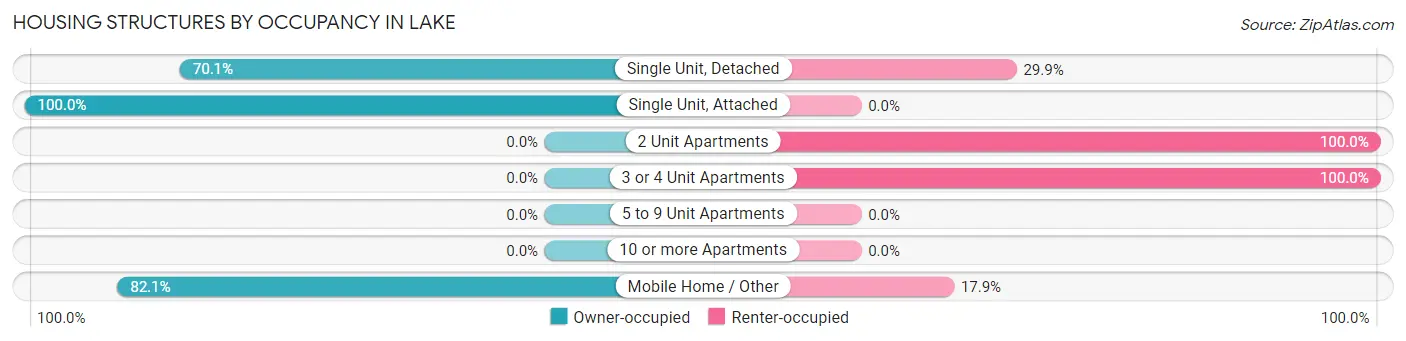
| Structure Type | Owner-occupied | Renter-occupied |
| Single Unit, Detached | 68 (70.1%) | 29 (29.9%) |
| Single Unit, Attached | 7 (100.0%) | 0 (0.0%) |
| 2 Unit Apartments | 0 (0.0%) | 2 (100.0%) |
| 3 or 4 Unit Apartments | 0 (0.0%) | 9 (100.0%) |
| 5 to 9 Unit Apartments | 0 (0.0%) | 0 (0.0%) |
| 10 or more Apartments | 0 (0.0%) | 0 (0.0%) |
| Mobile Home / Other | 46 (82.1%) | 10 (17.9%) |
| Total | 121 (70.8%) | 50 (29.2%) |
Housing Structures by Number of Rooms in Lake
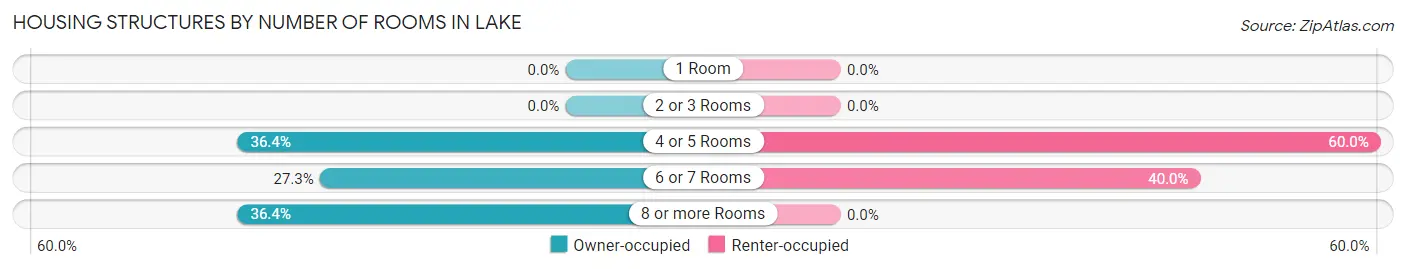
| Number of Rooms | Owner-occupied | Renter-occupied |
| 1 Room | 0 (0.0%) | 0 (0.0%) |
| 2 or 3 Rooms | 0 (0.0%) | 0 (0.0%) |
| 4 or 5 Rooms | 44 (36.4%) | 30 (60.0%) |
| 6 or 7 Rooms | 33 (27.3%) | 20 (40.0%) |
| 8 or more Rooms | 44 (36.4%) | 0 (0.0%) |
| Total | 121 (100.0%) | 50 (100.0%) |
Housing Structure by Heating Type in Lake
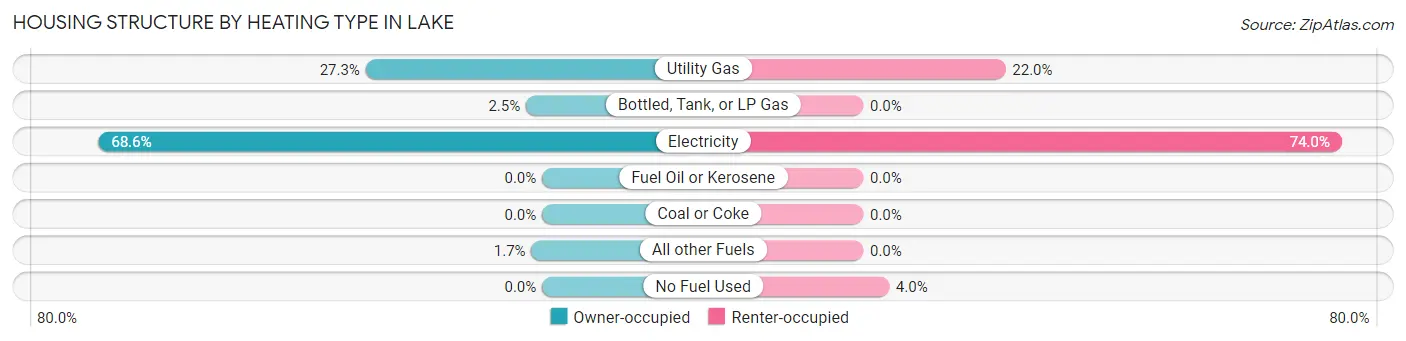
| Heating Type | Owner-occupied | Renter-occupied |
| Utility Gas | 33 (27.3%) | 11 (22.0%) |
| Bottled, Tank, or LP Gas | 3 (2.5%) | 0 (0.0%) |
| Electricity | 83 (68.6%) | 37 (74.0%) |
| Fuel Oil or Kerosene | 0 (0.0%) | 0 (0.0%) |
| Coal or Coke | 0 (0.0%) | 0 (0.0%) |
| All other Fuels | 2 (1.7%) | 0 (0.0%) |
| No Fuel Used | 0 (0.0%) | 2 (4.0%) |
| Total | 121 (100.0%) | 50 (100.0%) |
Household Vehicle Usage in Lake
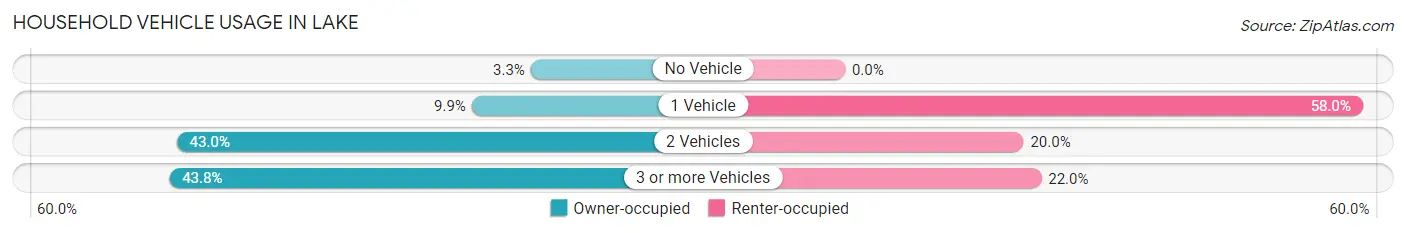
| Vehicles per Household | Owner-occupied | Renter-occupied |
| No Vehicle | 4 (3.3%) | 0 (0.0%) |
| 1 Vehicle | 12 (9.9%) | 29 (58.0%) |
| 2 Vehicles | 52 (43.0%) | 10 (20.0%) |
| 3 or more Vehicles | 53 (43.8%) | 11 (22.0%) |
| Total | 121 (100.0%) | 50 (100.0%) |
Real Estate & Mortgages in Lake
Real Estate and Mortgage Overview in Lake
| Characteristic | Without Mortgage | With Mortgage |
| Housing Units | 72 | 49 |
| Median Property Value | $73,000 | $0 |
| Median Household Income | - | - |
| Monthly Housing Costs | $283 | $0 |
| Real Estate Taxes | $199 | $14 |
Property Value by Mortgage Status in Lake
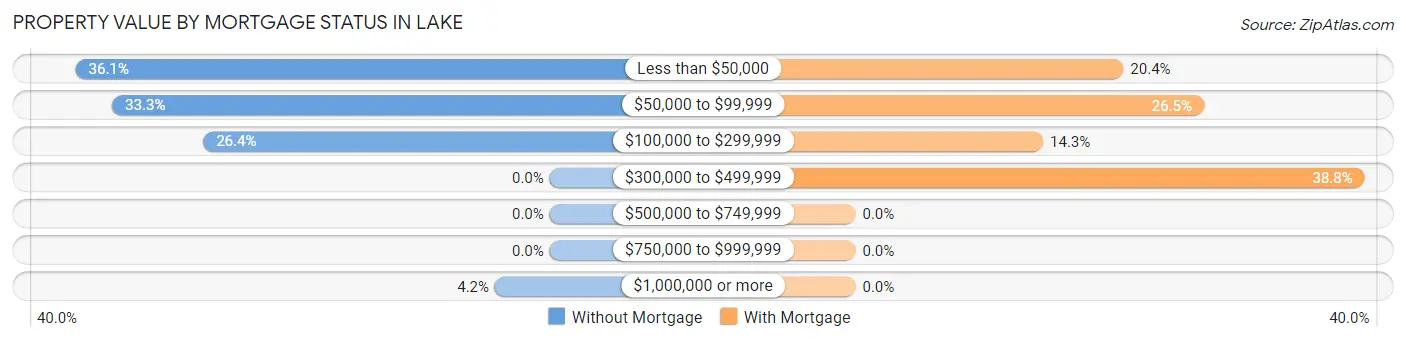
| Property Value | Without Mortgage | With Mortgage |
| Less than $50,000 | 26 (36.1%) | 10 (20.4%) |
| $50,000 to $99,999 | 24 (33.3%) | 13 (26.5%) |
| $100,000 to $299,999 | 19 (26.4%) | 7 (14.3%) |
| $300,000 to $499,999 | 0 (0.0%) | 19 (38.8%) |
| $500,000 to $749,999 | 0 (0.0%) | 0 (0.0%) |
| $750,000 to $999,999 | 0 (0.0%) | 0 (0.0%) |
| $1,000,000 or more | 3 (4.2%) | 0 (0.0%) |
| Total | 72 (100.0%) | 49 (100.0%) |
Household Income by Mortgage Status in Lake
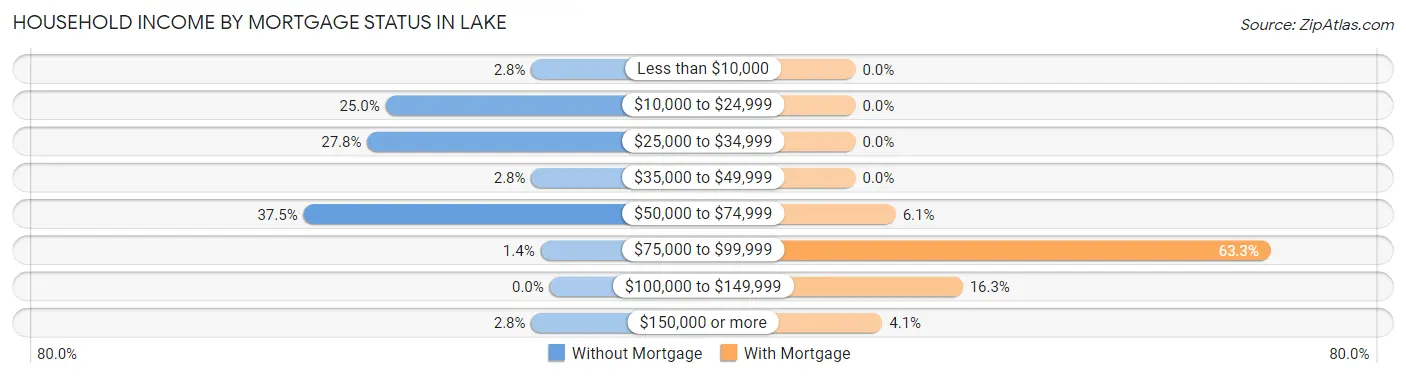
| Household Income | Without Mortgage | With Mortgage |
| Less than $10,000 | 2 (2.8%) | 0 (0.0%) |
| $10,000 to $24,999 | 18 (25.0%) | 0 (0.0%) |
| $25,000 to $34,999 | 20 (27.8%) | 0 (0.0%) |
| $35,000 to $49,999 | 2 (2.8%) | 0 (0.0%) |
| $50,000 to $74,999 | 27 (37.5%) | 3 (6.1%) |
| $75,000 to $99,999 | 1 (1.4%) | 31 (63.3%) |
| $100,000 to $149,999 | 0 (0.0%) | 8 (16.3%) |
| $150,000 or more | 2 (2.8%) | 2 (4.1%) |
| Total | 72 (100.0%) | 49 (100.0%) |
Property Value to Household Income Ratio in Lake
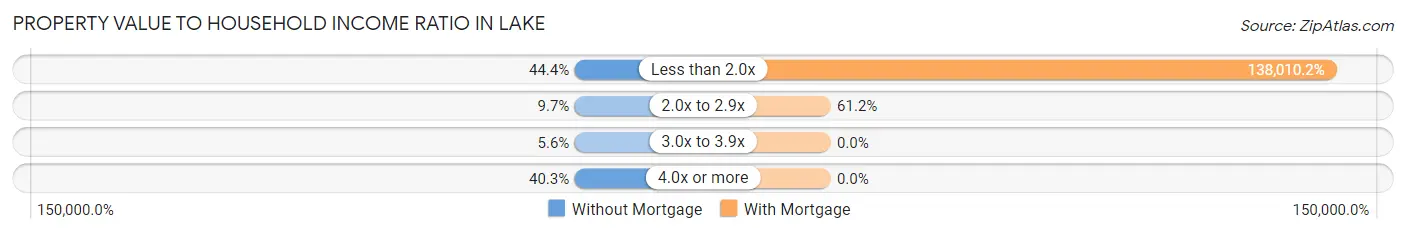
| Value-to-Income Ratio | Without Mortgage | With Mortgage |
| Less than 2.0x | 32 (44.4%) | 67,625 (138,010.2%) |
| 2.0x to 2.9x | 7 (9.7%) | 30 (61.2%) |
| 3.0x to 3.9x | 4 (5.6%) | 0 (0.0%) |
| 4.0x or more | 29 (40.3%) | 0 (0.0%) |
| Total | 72 (100.0%) | 49 (100.0%) |
Real Estate Taxes by Mortgage Status in Lake
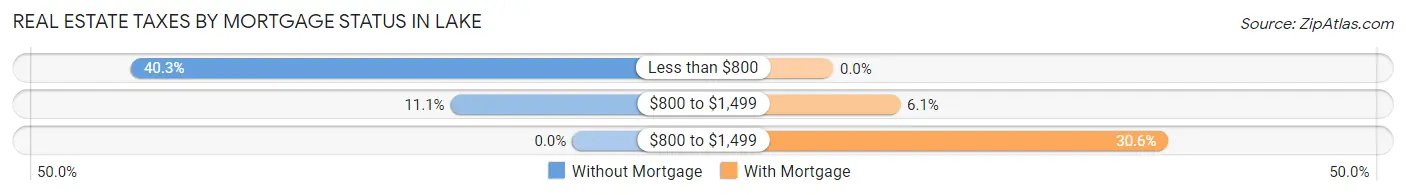
| Property Taxes | Without Mortgage | With Mortgage |
| Less than $800 | 29 (40.3%) | 0 (0.0%) |
| $800 to $1,499 | 8 (11.1%) | 3 (6.1%) |
| $800 to $1,499 | 0 (0.0%) | 15 (30.6%) |
| Total | 72 (100.0%) | 49 (100.0%) |
Health & Disability in Lake
Health Insurance Coverage by Age in Lake
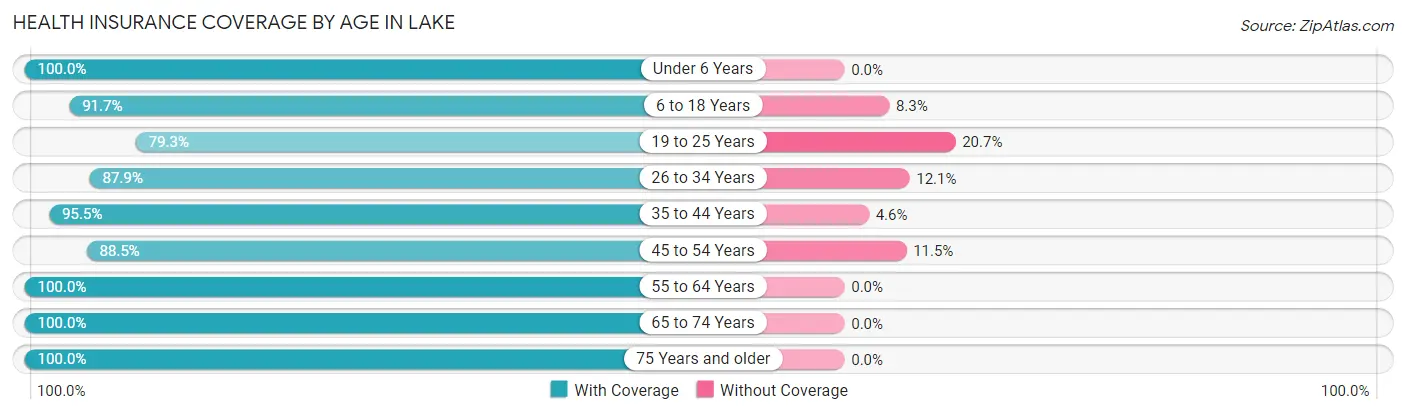
| Age Bracket | With Coverage | Without Coverage |
| Under 6 Years | 44 (100.0%) | 0 (0.0%) |
| 6 to 18 Years | 121 (91.7%) | 11 (8.3%) |
| 19 to 25 Years | 23 (79.3%) | 6 (20.7%) |
| 26 to 34 Years | 58 (87.9%) | 8 (12.1%) |
| 35 to 44 Years | 42 (95.5%) | 2 (4.5%) |
| 45 to 54 Years | 46 (88.5%) | 6 (11.5%) |
| 55 to 64 Years | 63 (100.0%) | 0 (0.0%) |
| 65 to 74 Years | 41 (100.0%) | 0 (0.0%) |
| 75 Years and older | 41 (100.0%) | 0 (0.0%) |
| Total | 479 (93.5%) | 33 (6.5%) |
Health Insurance Coverage by Citizenship Status in Lake
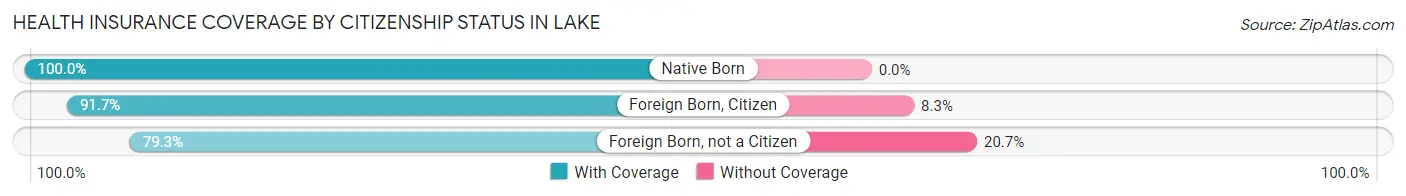
| Citizenship Status | With Coverage | Without Coverage |
| Native Born | 44 (100.0%) | 0 (0.0%) |
| Foreign Born, Citizen | 121 (91.7%) | 11 (8.3%) |
| Foreign Born, not a Citizen | 23 (79.3%) | 6 (20.7%) |
Health Insurance Coverage by Household Income in Lake
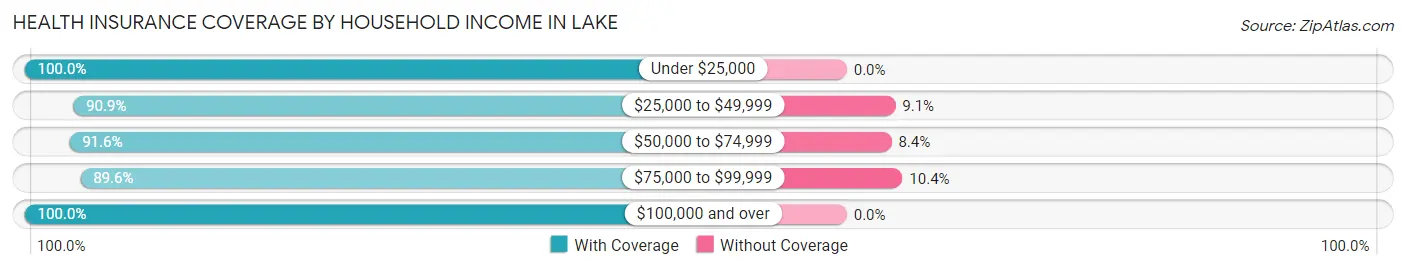
| Household Income | With Coverage | Without Coverage |
| Under $25,000 | 66 (100.0%) | 0 (0.0%) |
| $25,000 to $49,999 | 80 (90.9%) | 8 (9.1%) |
| $50,000 to $74,999 | 219 (91.6%) | 20 (8.4%) |
| $75,000 to $99,999 | 43 (89.6%) | 5 (10.4%) |
| $100,000 and over | 71 (100.0%) | 0 (0.0%) |
Public vs Private Health Insurance Coverage by Age in Lake
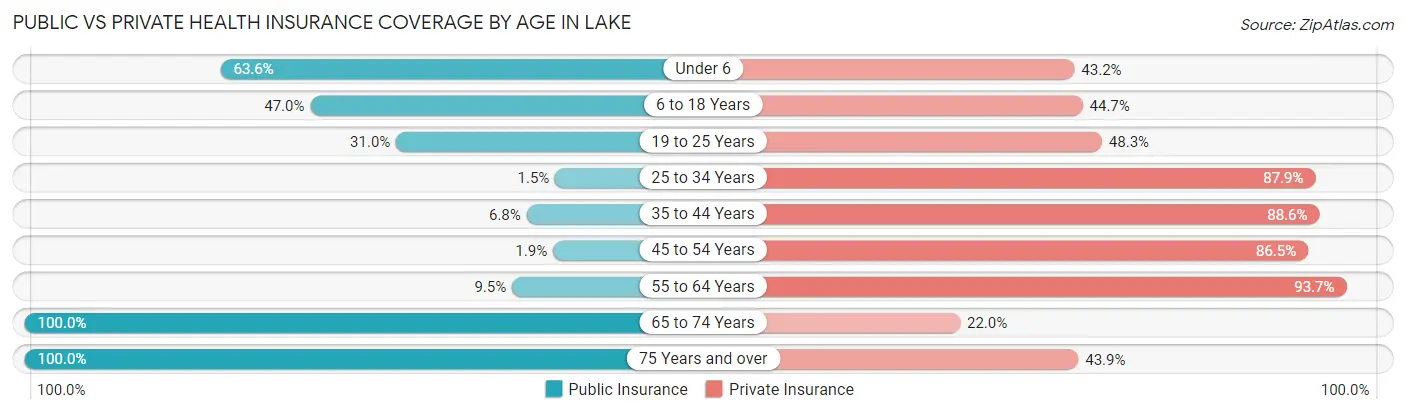
| Age Bracket | Public Insurance | Private Insurance |
| Under 6 | 28 (63.6%) | 19 (43.2%) |
| 6 to 18 Years | 62 (47.0%) | 59 (44.7%) |
| 19 to 25 Years | 9 (31.0%) | 14 (48.3%) |
| 25 to 34 Years | 1 (1.5%) | 58 (87.9%) |
| 35 to 44 Years | 3 (6.8%) | 39 (88.6%) |
| 45 to 54 Years | 1 (1.9%) | 45 (86.5%) |
| 55 to 64 Years | 6 (9.5%) | 59 (93.6%) |
| 65 to 74 Years | 41 (100.0%) | 9 (22.0%) |
| 75 Years and over | 41 (100.0%) | 18 (43.9%) |
| Total | 192 (37.5%) | 320 (62.5%) |
Disability Status by Sex by Age in Lake
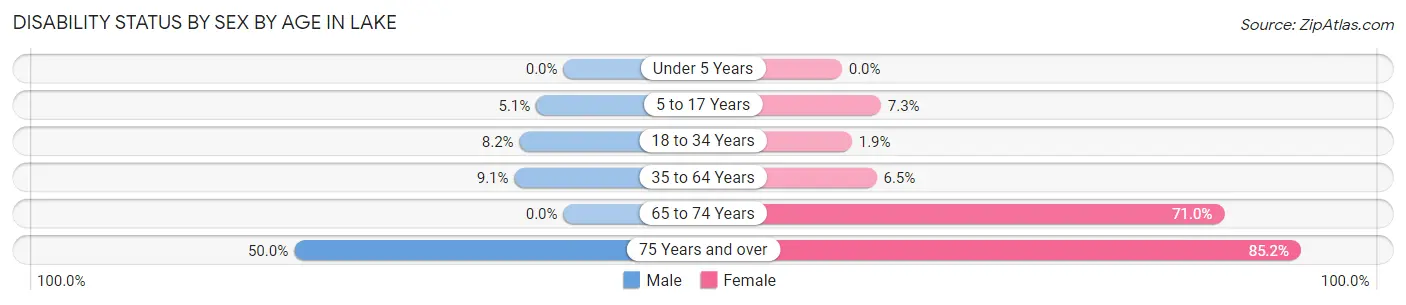
| Age Bracket | Male | Female |
| Under 5 Years | 0 (0.0%) | 0 (0.0%) |
| 5 to 17 Years | 4 (5.1%) | 5 (7.2%) |
| 18 to 34 Years | 4 (8.2%) | 1 (1.8%) |
| 35 to 64 Years | 6 (9.1%) | 6 (6.5%) |
| 65 to 74 Years | 0 (0.0%) | 22 (71.0%) |
| 75 Years and over | 7 (50.0%) | 23 (85.2%) |
Disability Class by Sex by Age in Lake
Disability Class: Hearing Difficulty
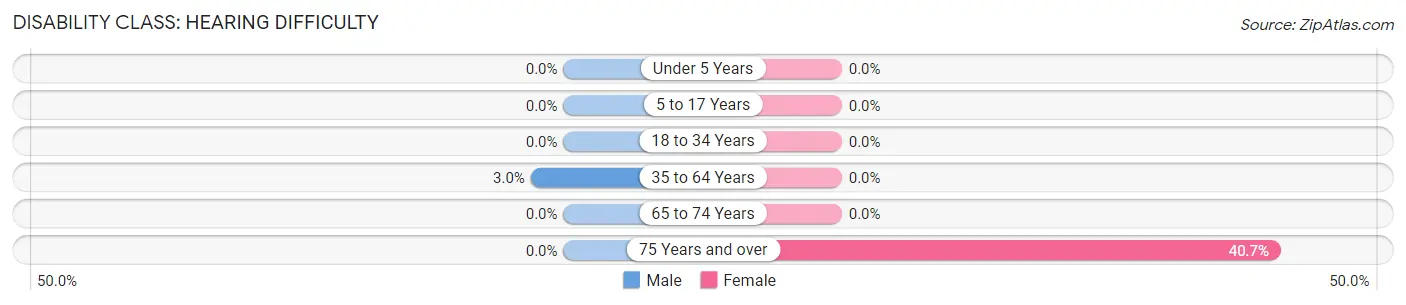
| Age Bracket | Male | Female |
| Under 5 Years | 0 (0.0%) | 0 (0.0%) |
| 5 to 17 Years | 0 (0.0%) | 0 (0.0%) |
| 18 to 34 Years | 0 (0.0%) | 0 (0.0%) |
| 35 to 64 Years | 2 (3.0%) | 0 (0.0%) |
| 65 to 74 Years | 0 (0.0%) | 0 (0.0%) |
| 75 Years and over | 0 (0.0%) | 11 (40.7%) |
Disability Class: Vision Difficulty
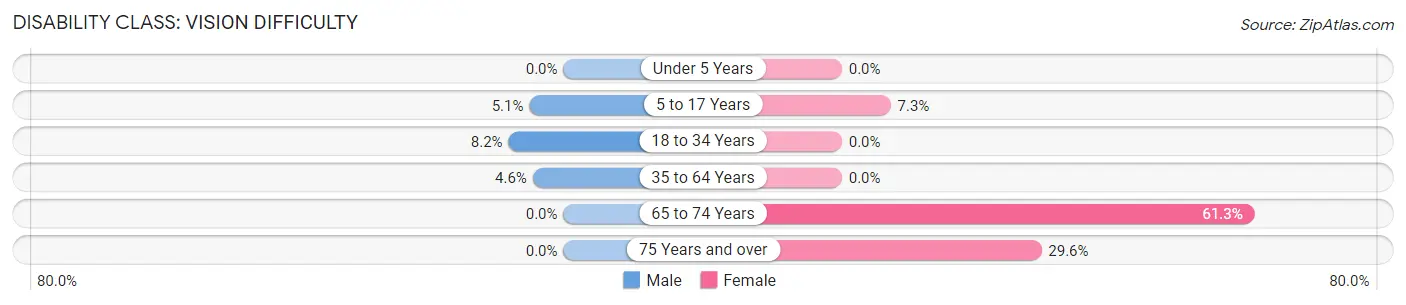
| Age Bracket | Male | Female |
| Under 5 Years | 0 (0.0%) | 0 (0.0%) |
| 5 to 17 Years | 4 (5.1%) | 5 (7.2%) |
| 18 to 34 Years | 4 (8.2%) | 0 (0.0%) |
| 35 to 64 Years | 3 (4.5%) | 0 (0.0%) |
| 65 to 74 Years | 0 (0.0%) | 19 (61.3%) |
| 75 Years and over | 0 (0.0%) | 8 (29.6%) |
Disability Class: Cognitive Difficulty
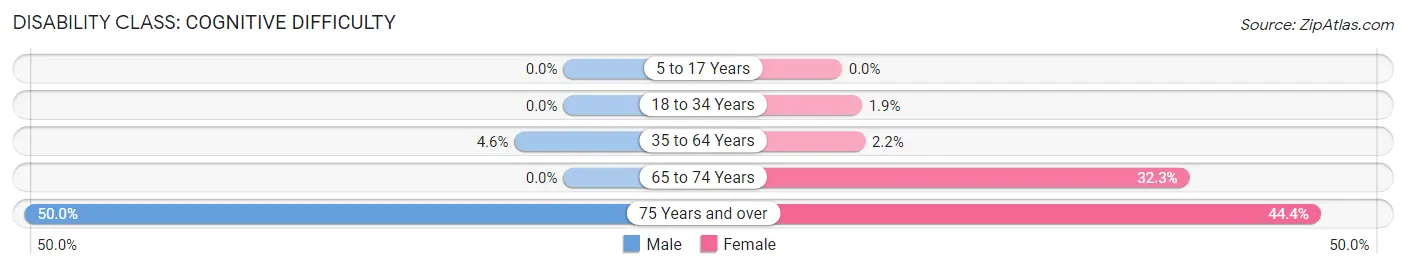
| Age Bracket | Male | Female |
| 5 to 17 Years | 0 (0.0%) | 0 (0.0%) |
| 18 to 34 Years | 0 (0.0%) | 1 (1.8%) |
| 35 to 64 Years | 3 (4.5%) | 2 (2.1%) |
| 65 to 74 Years | 0 (0.0%) | 10 (32.3%) |
| 75 Years and over | 7 (50.0%) | 12 (44.4%) |
Disability Class: Ambulatory Difficulty
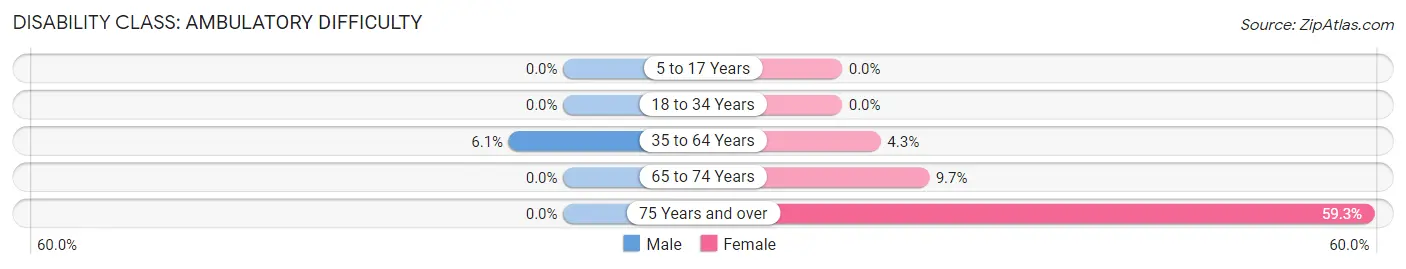
| Age Bracket | Male | Female |
| 5 to 17 Years | 0 (0.0%) | 0 (0.0%) |
| 18 to 34 Years | 0 (0.0%) | 0 (0.0%) |
| 35 to 64 Years | 4 (6.1%) | 4 (4.3%) |
| 65 to 74 Years | 0 (0.0%) | 3 (9.7%) |
| 75 Years and over | 0 (0.0%) | 16 (59.3%) |
Disability Class: Self-Care Difficulty
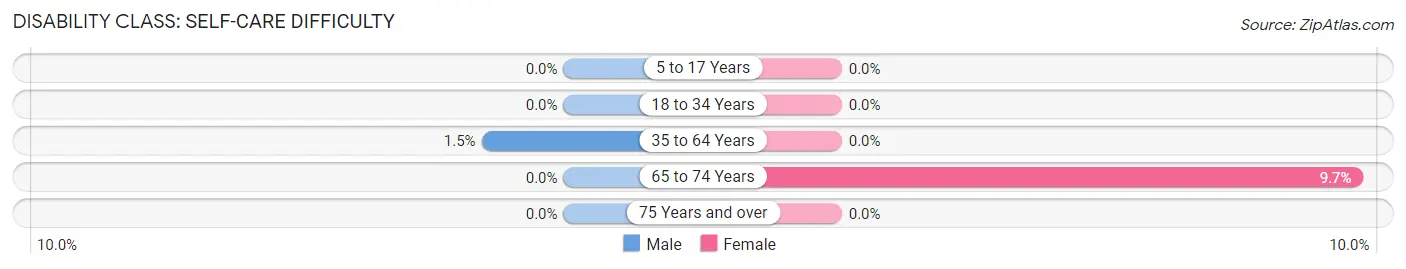
| Age Bracket | Male | Female |
| 5 to 17 Years | 0 (0.0%) | 0 (0.0%) |
| 18 to 34 Years | 0 (0.0%) | 0 (0.0%) |
| 35 to 64 Years | 1 (1.5%) | 0 (0.0%) |
| 65 to 74 Years | 0 (0.0%) | 3 (9.7%) |
| 75 Years and over | 0 (0.0%) | 0 (0.0%) |
Technology Access in Lake
Computing Device Access in Lake
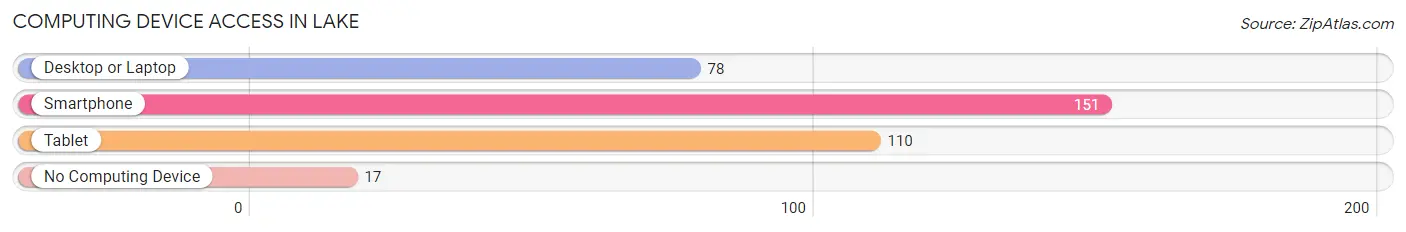
| Device Type | # Households | % Households |
| Desktop or Laptop | 78 | 45.6% |
| Smartphone | 151 | 88.3% |
| Tablet | 110 | 64.3% |
| No Computing Device | 17 | 9.9% |
| Total | 171 | 100.0% |
Internet Access in Lake
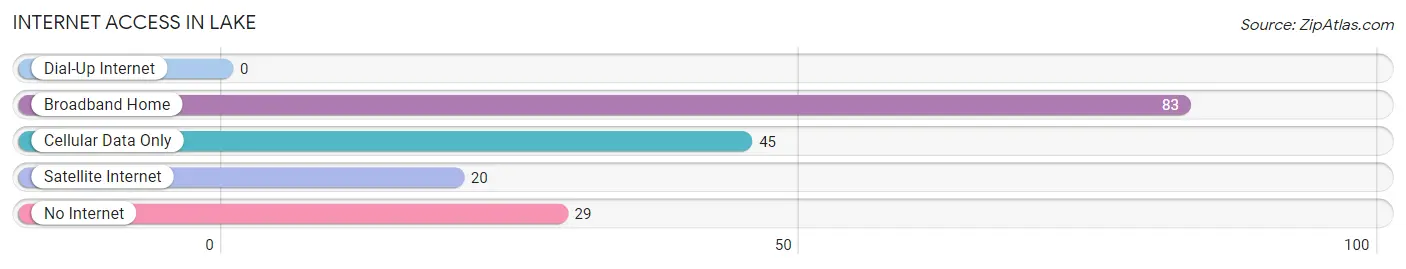
| Internet Type | # Households | % Households |
| Dial-Up Internet | 0 | 0.0% |
| Broadband Home | 83 | 48.5% |
| Cellular Data Only | 45 | 26.3% |
| Satellite Internet | 20 | 11.7% |
| No Internet | 29 | 17.0% |
| Total | 171 | 100.0% |
Lake Summary
Lake, Mississippi is a small town located in the northwest corner of the state, in the heart of the Mississippi Delta. It is situated in Bolivar County, and is part of the larger Greenville metropolitan area. The town has a population of just over 1,000 people, and is known for its rural charm and friendly atmosphere.
History
The town of Lake was founded in 1871, when the first settlers arrived in the area. The town was originally known as “Lake Station”, and was named after the nearby lake. The town was incorporated in 1876, and the first post office was established in 1877.
The town grew slowly over the years, and by the early 1900s, it had become a thriving agricultural center. Cotton was the main crop grown in the area, and the town was home to several cotton gins and warehouses. The town also had a number of stores, churches, and other businesses.
In the 1950s, the town began to decline as the cotton industry moved away from the area. The town’s population decreased, and many of the businesses closed. In the late 1970s, the town began to experience a resurgence as new businesses moved into the area.
Geography
Lake is located in the northwest corner of Mississippi, in the heart of the Mississippi Delta. The town is situated in Bolivar County, and is part of the larger Greenville metropolitan area. The town is located on the banks of the Mississippi River, and is surrounded by flat, fertile farmland.
The town has a total area of 1.2 square miles, all of which is land. The town is located at an elevation of approximately 200 feet above sea level.
Economy
The economy of Lake is largely based on agriculture. The town is home to several farms, and the surrounding area is known for its production of cotton, soybeans, corn, and other crops. The town also has a number of small businesses, including restaurants, stores, and other services.
The town is also home to a number of manufacturing companies, including a furniture factory and a plastics plant. The town is also home to a number of government offices, including the Bolivar County Courthouse.
Demographics
As of the 2010 census, the town of Lake had a population of 1,072 people. The racial makeup of the town was 79.3% African American, 19.2% White, 0.3% Native American, 0.2% Asian, and 0.9% from other races. The median household income was $20,972, and the median family income was $25,625.
The town has a high rate of poverty, with 33.3% of the population living below the poverty line. The town also has a high rate of unemployment, with 10.3% of the population unemployed.
Conclusion
Lake, Mississippi is a small town located in the northwest corner of the state, in the heart of the Mississippi Delta. The town has a population of just over 1,000 people, and is known for its rural charm and friendly atmosphere. The town’s economy is largely based on agriculture, and the town is home to several farms and manufacturing companies. The town has a high rate of poverty and unemployment, and the median household income is significantly lower than the national average. Despite these challenges, the town remains a vibrant and welcoming community.
Common Questions
What is Per Capita Income in Lake?
Per Capita income in Lake is $20,309.
What is the Median Family Income in Lake?
Median Family Income in Lake is $56,613.
What is the Median Household income in Lake?
Median Household Income in Lake is $55,605.
What is Income or Wage Gap in Lake?
Income or Wage Gap in Lake is 31.5%.
Women in Lake earn 68.5 cents for every dollar earned by a man.
What is Inequality or Gini Index in Lake?
Inequality or Gini Index in Lake is 0.34.
What is the Total Population of Lake?
Total Population of Lake is 512.
What is the Total Male Population of Lake?
Total Male Population of Lake is 233.
What is the Total Female Population of Lake?
Total Female Population of Lake is 279.
What is the Ratio of Males per 100 Females in Lake?
There are 83.51 Males per 100 Females in Lake.
What is the Ratio of Females per 100 Males in Lake?
There are 119.74 Females per 100 Males in Lake.
What is the Median Population Age in Lake?
Median Population Age in Lake is 33.4 Years.
What is the Average Family Size in Lake
Average Family Size in Lake is 3.4 People.
What is the Average Household Size in Lake
Average Household Size in Lake is 3.0 People.
How Large is the Labor Force in Lake?
There are 221 People in the Labor Forcein in Lake.
What is the Percentage of People in the Labor Force in Lake?
56.7% of People are in the Labor Force in Lake.