Zip Codes with the Highest Percentage of Immigrants from Western Asia in Independence, MO
RELATED REPORTS & OPTIONS
Western Asia
Independence
Compare Zip Codes
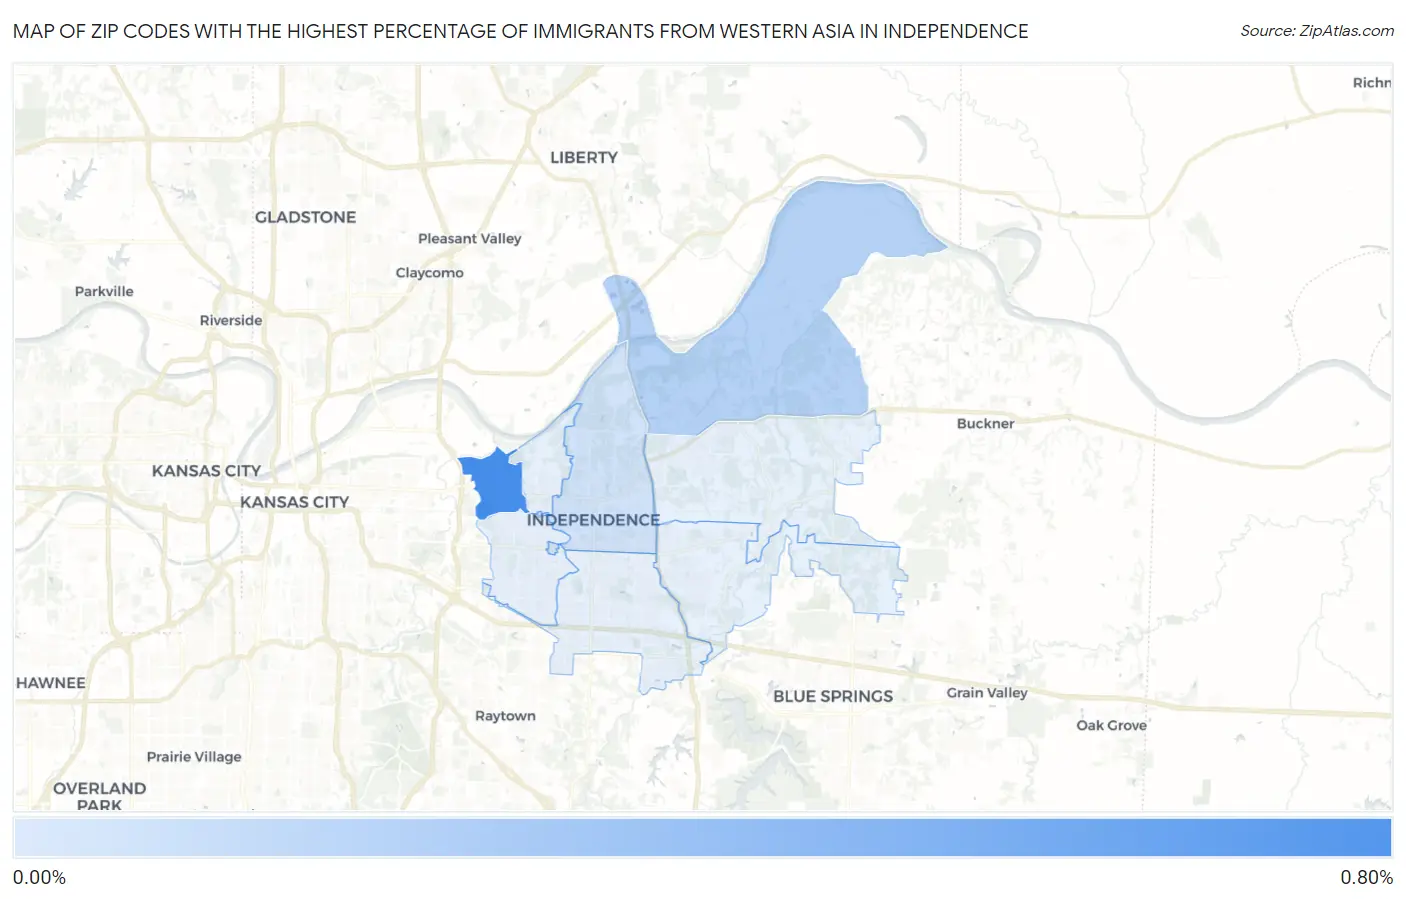
Map of Zip Codes with the Highest Percentage of Immigrants from Western Asia in Independence
0.061%
0.78%
Zip Codes with the Highest Percentage of Immigrants from Western Asia in Independence, MO
| Zip Code | Western Asia | vs State | vs National | |
| 1. | 64053 | 0.78% | 0.17%(+0.617)#-1 | 0.36%(+0.420)#0 |
| 2. | 64058 | 0.21% | 0.17%(+0.043)#0 | 0.36%(-0.154)#1 |
| 3. | 64050 | 0.061% | 0.17%(-0.106)#1 | 0.36%(-0.303)#2 |
1
Common Questions
What are the Top 5 Zip Codes with the Highest Percentage of Immigrants from Western Asia in Independence, MO?
Top 5 Zip Codes with the Highest Percentage of Immigrants from Western Asia in Independence, MO are:
What zip code has the Highest Percentage of Immigrants from Western Asia in Independence, MO?
64053 has the Highest Percentage of Immigrants from Western Asia in Independence, MO with 0.78%.
What is the Percentage of Immigrants from Western Asia in Independence, MO?
Percentage of Immigrants from Western Asia in Independence is 0.052%.
What is the Percentage of Immigrants from Western Asia in Missouri?
Percentage of Immigrants from Western Asia in Missouri is 0.17%.
What is the Percentage of Immigrants from Western Asia in the United States?
Percentage of Immigrants from Western Asia in the United States is 0.36%.