Kirbyville, MO Map & Demographics
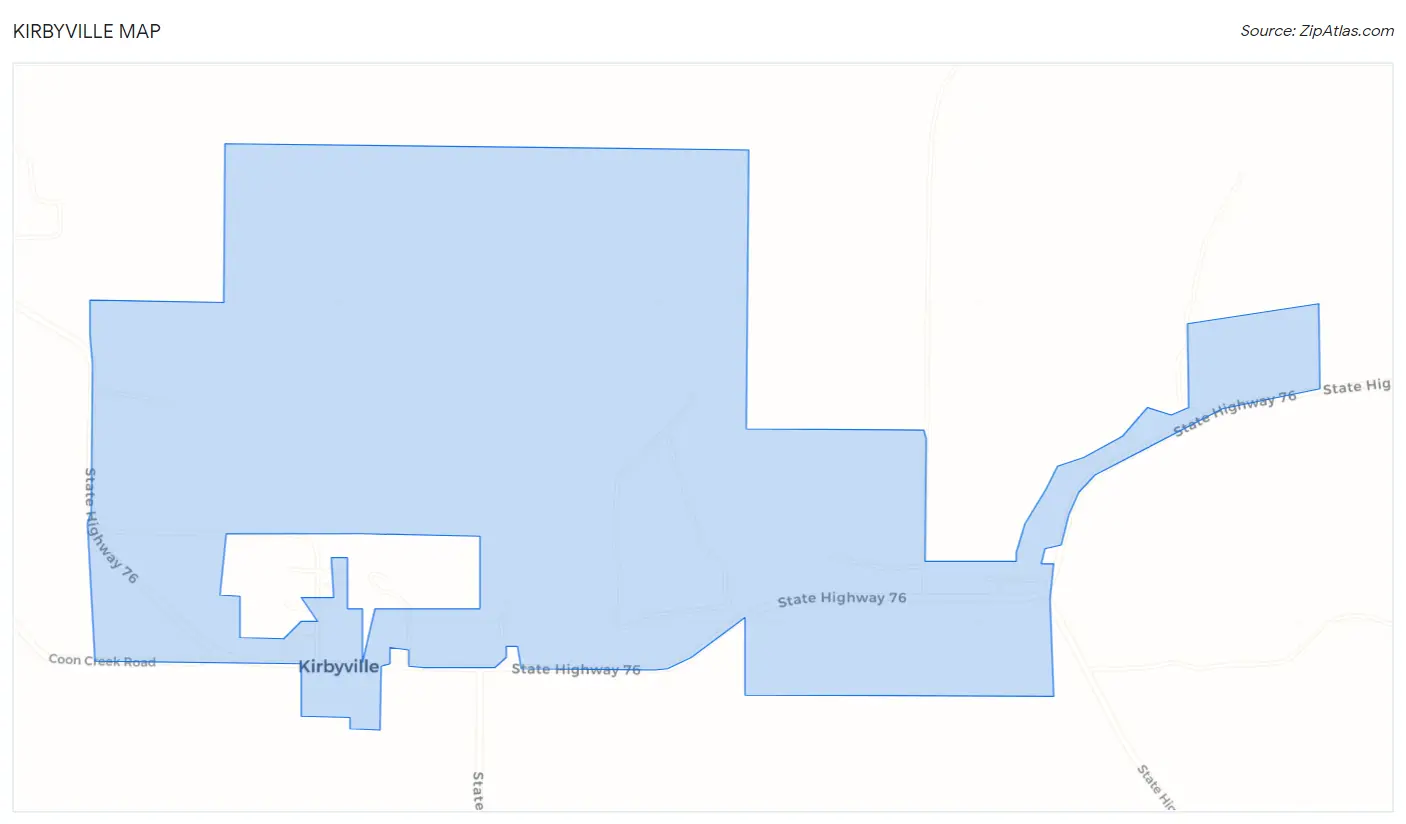
Kirbyville Map
Kirbyville Overview
$24,718
PER CAPITA INCOME
$54,107
AVG FAMILY INCOME
$53,929
AVG HOUSEHOLD INCOME
51.9%
WAGE / INCOME GAP [ % ]
48.1¢/ $1
WAGE / INCOME GAP [ $ ]
0.33
INEQUALITY / GINI INDEX
109
TOTAL POPULATION
67
MALE POPULATION
42
FEMALE POPULATION
159.52
MALES / 100 FEMALES
62.69
FEMALES / 100 MALES
48.6
MEDIAN AGE
3.1
AVG FAMILY SIZE
2.6
AVG HOUSEHOLD SIZE
42
LABOR FORCE [ PEOPLE ]
44.7%
PERCENT IN LABOR FORCE
Kirbyville Zip Codes
Kirbyville Area Codes
Income in Kirbyville
Income Overview in Kirbyville
Per Capita Income in Kirbyville is $24,718, while median incomes of families and households are $54,107 and $53,929 respectively.
| Characteristic | Number | Measure |
| Per Capita Income | 109 | $24,718 |
| Median Family Income | 27 | $54,107 |
| Mean Family Income | 27 | $56,778 |
| Median Household Income | 42 | $53,929 |
| Mean Household Income | 42 | $57,281 |
| Income Deficit | 27 | $0 |
| Wage / Income Gap (%) | 109 | 51.94% |
| Wage / Income Gap ($) | 109 | 48.06¢ per $1 |
| Gini / Inequality Index | 109 | 0.33 |
Earnings by Sex in Kirbyville
Average Earnings in Kirbyville are $52,500, $80,625 for men and $38,750 for women, a difference of 51.9%.
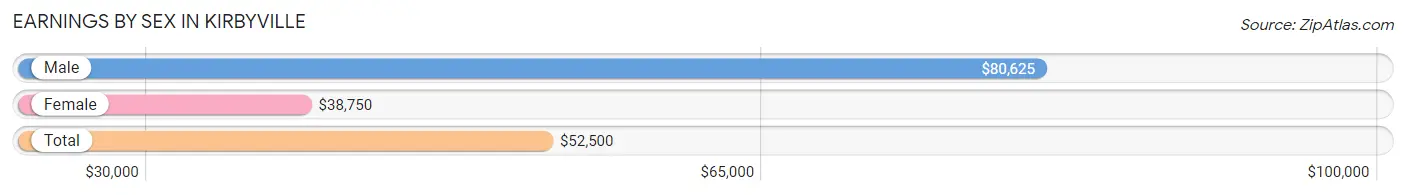
| Sex | Number | Average Earnings |
| Male | 19 (45.2%) | $80,625 |
| Female | 23 (54.8%) | $38,750 |
| Total | 42 (100.0%) | $52,500 |
Earnings by Sex by Income Bracket in Kirbyville
The most common earnings brackets in Kirbyville are $75,000 to $99,999 for men (11 | 57.9%) and $50,000 to $54,999 for women (8 | 34.8%).
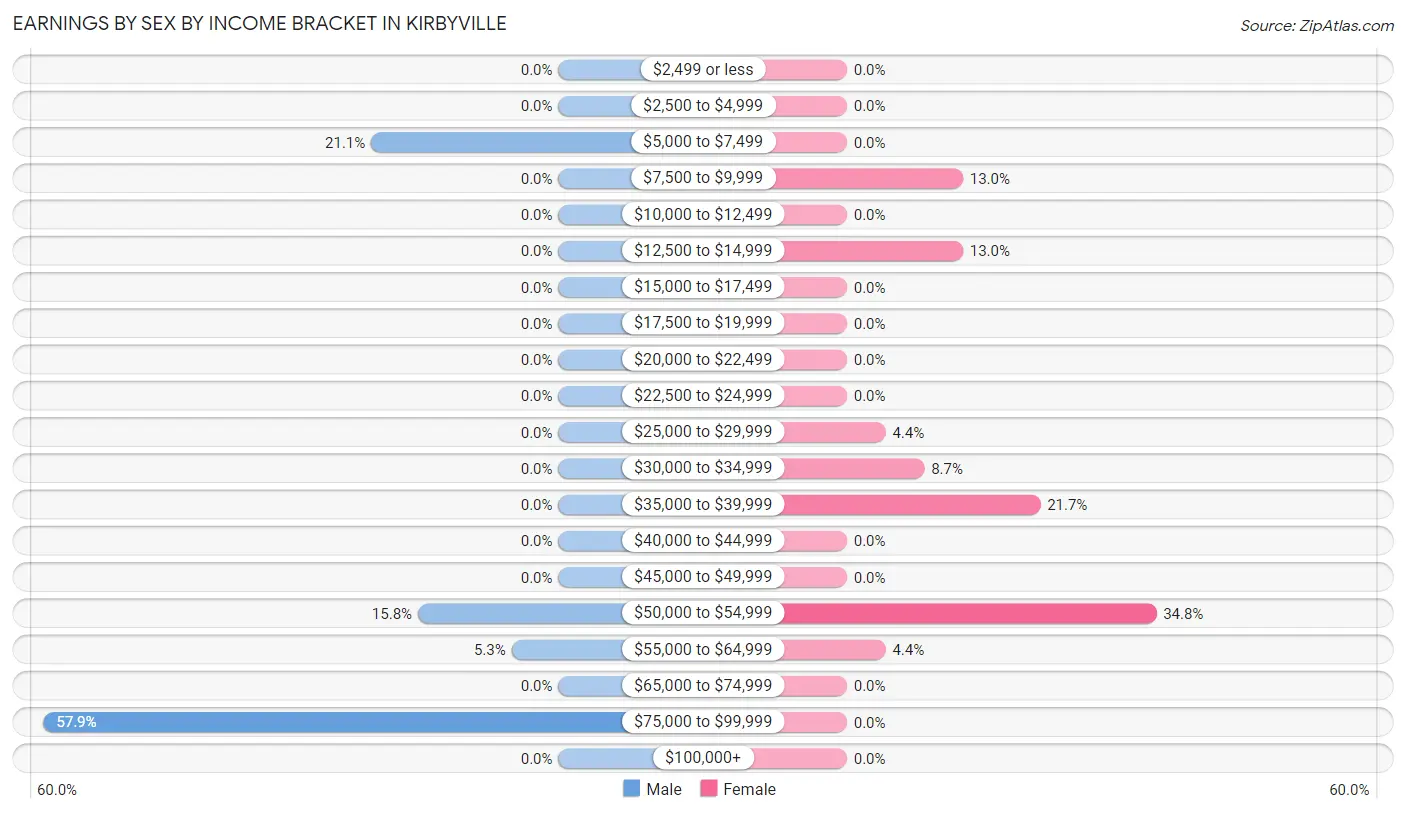
| Income | Male | Female |
| $2,499 or less | 0 (0.0%) | 0 (0.0%) |
| $2,500 to $4,999 | 0 (0.0%) | 0 (0.0%) |
| $5,000 to $7,499 | 4 (21.0%) | 0 (0.0%) |
| $7,500 to $9,999 | 0 (0.0%) | 3 (13.0%) |
| $10,000 to $12,499 | 0 (0.0%) | 0 (0.0%) |
| $12,500 to $14,999 | 0 (0.0%) | 3 (13.0%) |
| $15,000 to $17,499 | 0 (0.0%) | 0 (0.0%) |
| $17,500 to $19,999 | 0 (0.0%) | 0 (0.0%) |
| $20,000 to $22,499 | 0 (0.0%) | 0 (0.0%) |
| $22,500 to $24,999 | 0 (0.0%) | 0 (0.0%) |
| $25,000 to $29,999 | 0 (0.0%) | 1 (4.3%) |
| $30,000 to $34,999 | 0 (0.0%) | 2 (8.7%) |
| $35,000 to $39,999 | 0 (0.0%) | 5 (21.7%) |
| $40,000 to $44,999 | 0 (0.0%) | 0 (0.0%) |
| $45,000 to $49,999 | 0 (0.0%) | 0 (0.0%) |
| $50,000 to $54,999 | 3 (15.8%) | 8 (34.8%) |
| $55,000 to $64,999 | 1 (5.3%) | 1 (4.3%) |
| $65,000 to $74,999 | 0 (0.0%) | 0 (0.0%) |
| $75,000 to $99,999 | 11 (57.9%) | 0 (0.0%) |
| $100,000+ | 0 (0.0%) | 0 (0.0%) |
| Total | 19 (100.0%) | 23 (100.0%) |
Earnings by Sex by Educational Attainment in Kirbyville
Average earnings in Kirbyville are $80,625 for men and $38,750 for women, a difference of 51.9%. Men with an educational attainment of college or associate's degree enjoy the highest average annual earnings of $80,417, while those with college or associate's degree education earn the least with $80,417. Women with an educational attainment of college or associate's degree earn the most with the average annual earnings of $39,583, while those with college or associate's degree education have the smallest earnings of $39,583.
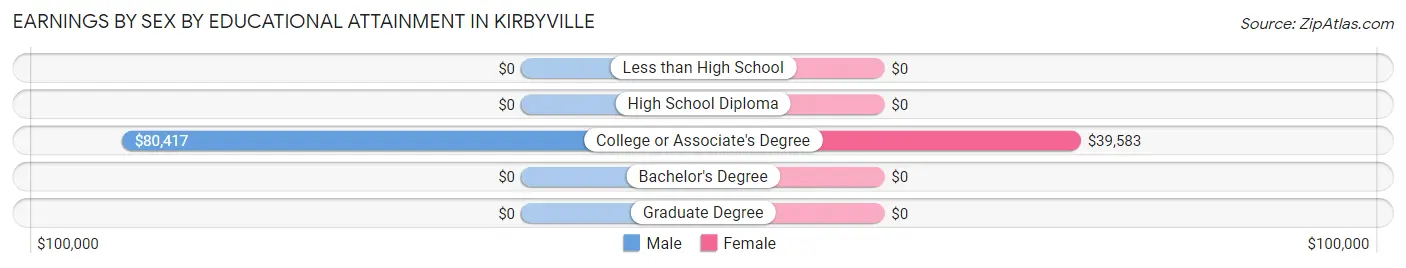
| Educational Attainment | Male Income | Female Income |
| Less than High School | - | - |
| High School Diploma | - | - |
| College or Associate's Degree | $80,417 | $39,583 |
| Bachelor's Degree | - | - |
| Graduate Degree | - | - |
| Total | $80,625 | $38,750 |
Family Income in Kirbyville
Family Income Brackets in Kirbyville
According to the Kirbyville family income data, there are 10 families falling into the $75,000 to $99,999 income range, which is the most common income bracket and makes up 37.0% of all families.
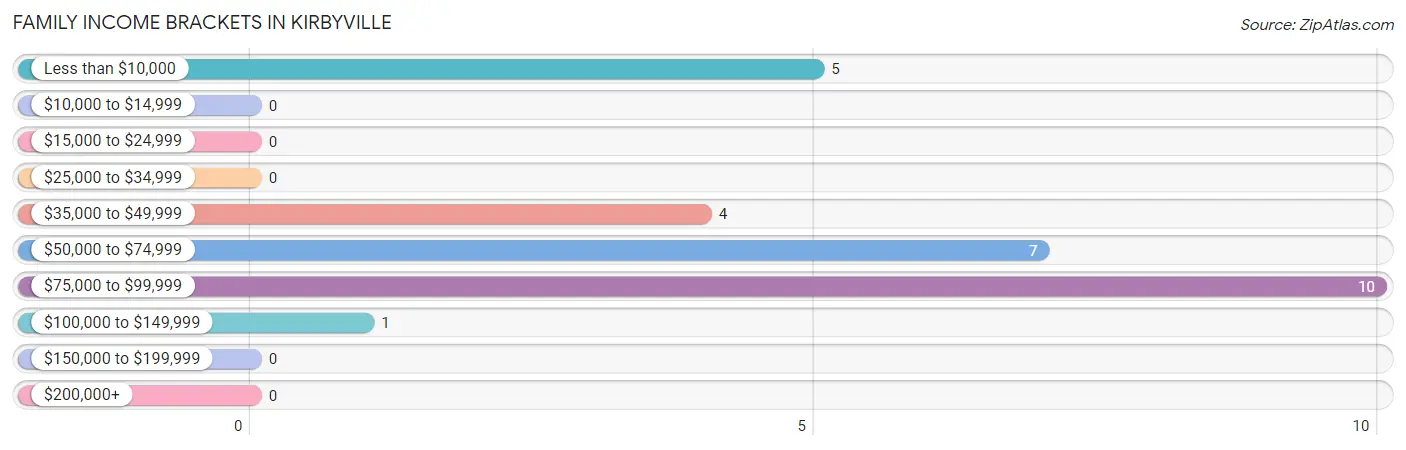
| Income Bracket | # Families | % Families |
| Less than $10,000 | 5 | 18.5% |
| $10,000 to $14,999 | 0 | 0.0% |
| $15,000 to $24,999 | 0 | 0.0% |
| $25,000 to $34,999 | 0 | 0.0% |
| $35,000 to $49,999 | 4 | 14.8% |
| $50,000 to $74,999 | 7 | 25.9% |
| $75,000 to $99,999 | 10 | 37.0% |
| $100,000 to $149,999 | 1 | 3.7% |
| $150,000 to $199,999 | 0 | 0.0% |
| $200,000+ | 0 | 0.0% |
Family Income by Famaliy Size in Kirbyville
2-person families (18 | 66.7%) account for the highest median family income in Kirbyville with $80,714 per family, while 2-person families (18 | 66.7%) have the highest median income of $40,357 per family member.
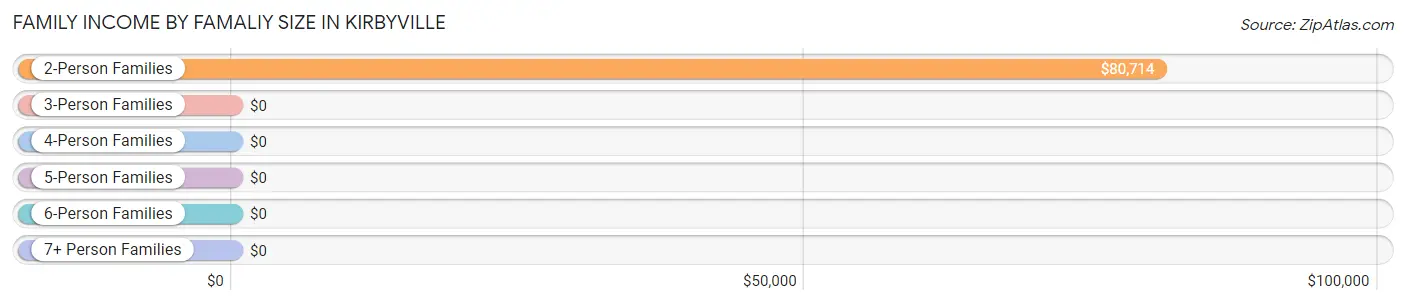
| Income Bracket | # Families | Median Income |
| 2-Person Families | 18 (66.7%) | $80,714 |
| 3-Person Families | 7 (25.9%) | $0 |
| 4-Person Families | 0 (0.0%) | $0 |
| 5-Person Families | 2 (7.4%) | $0 |
| 6-Person Families | 0 (0.0%) | $0 |
| 7+ Person Families | 0 (0.0%) | $0 |
| Total | 27 (100.0%) | $54,107 |
Family Income by Number of Earners in Kirbyville
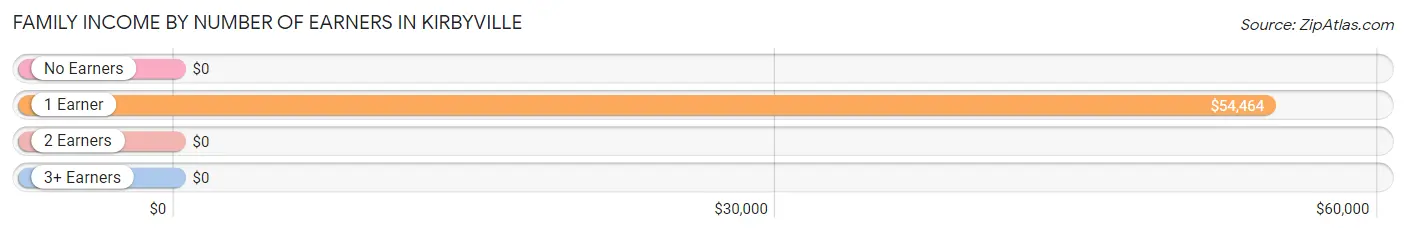
| Number of Earners | # Families | Median Income |
| No Earners | 7 (25.9%) | $0 |
| 1 Earner | 19 (70.4%) | $54,464 |
| 2 Earners | 1 (3.7%) | $0 |
| 3+ Earners | 0 (0.0%) | $0 |
| Total | 27 (100.0%) | $54,107 |
Household Income in Kirbyville
Household Income Brackets in Kirbyville
With 11 households falling in the category, the $50,000 to $74,999 income range is the most frequent in Kirbyville, accounting for 26.2% of all households.
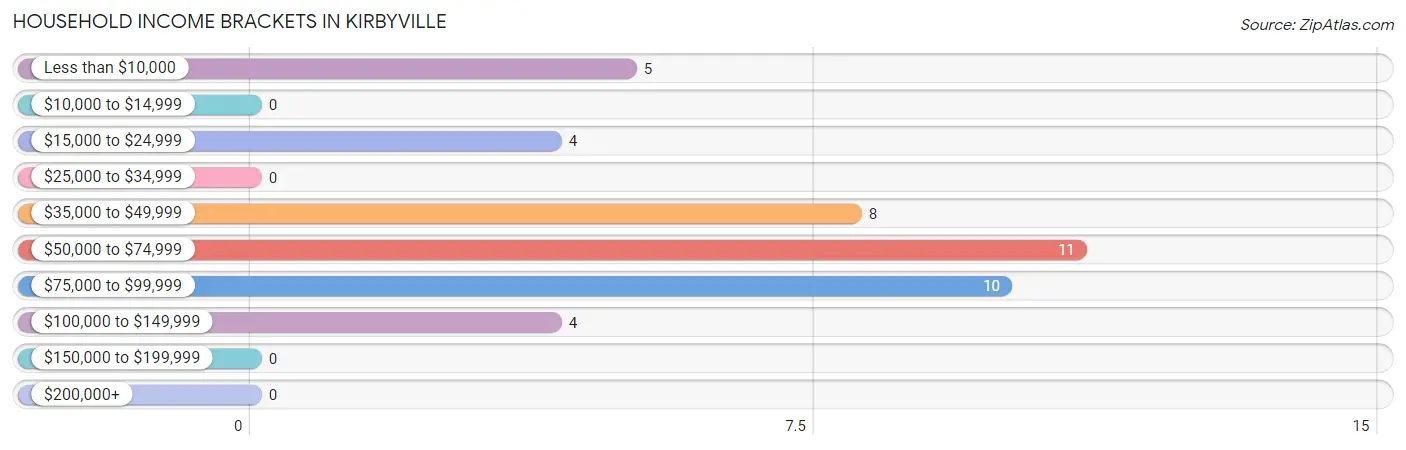
| Income Bracket | # Households | % Households |
| Less than $10,000 | 5 | 11.9% |
| $10,000 to $14,999 | 0 | 0.0% |
| $15,000 to $24,999 | 4 | 9.5% |
| $25,000 to $34,999 | 0 | 0.0% |
| $35,000 to $49,999 | 8 | 19.0% |
| $50,000 to $74,999 | 11 | 26.2% |
| $75,000 to $99,999 | 10 | 23.8% |
| $100,000 to $149,999 | 4 | 9.5% |
| $150,000 to $199,999 | 0 | 0.0% |
| $200,000+ | 0 | 0.0% |
Household Income by Householder Age in Kirbyville
The median household income in Kirbyville is $53,929, with the highest median household income of $60,000 found in the 65+ years age bracket for the primary householder. A total of 16 households (38.1%) fall into this category.
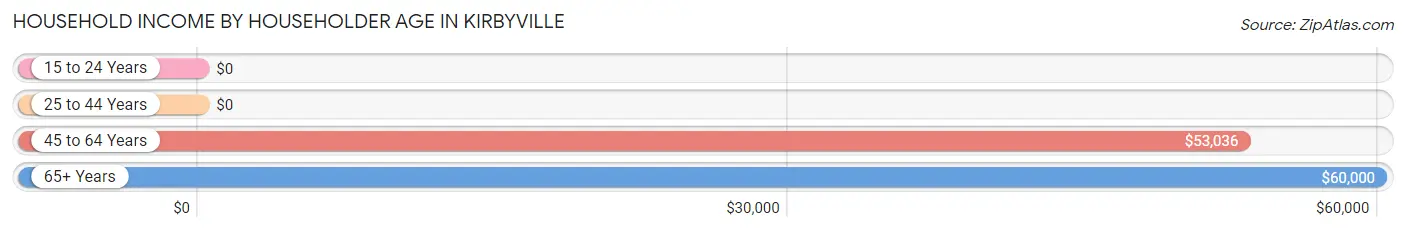
| Income Bracket | # Households | Median Income |
| 15 to 24 Years | 0 (0.0%) | $0 |
| 25 to 44 Years | 9 (21.4%) | $0 |
| 45 to 64 Years | 17 (40.5%) | $53,036 |
| 65+ Years | 16 (38.1%) | $60,000 |
| Total | 42 (100.0%) | $53,929 |
Poverty in Kirbyville
Income Below Poverty by Sex and Age in Kirbyville
With 11.1% poverty level for males and 19.1% for females among the residents of Kirbyville, 55 to 64 year old males and 55 to 64 year old females are the most vulnerable to poverty, with 7 males (35.0%) and 5 females (45.5%) in their respective age groups living below the poverty level.
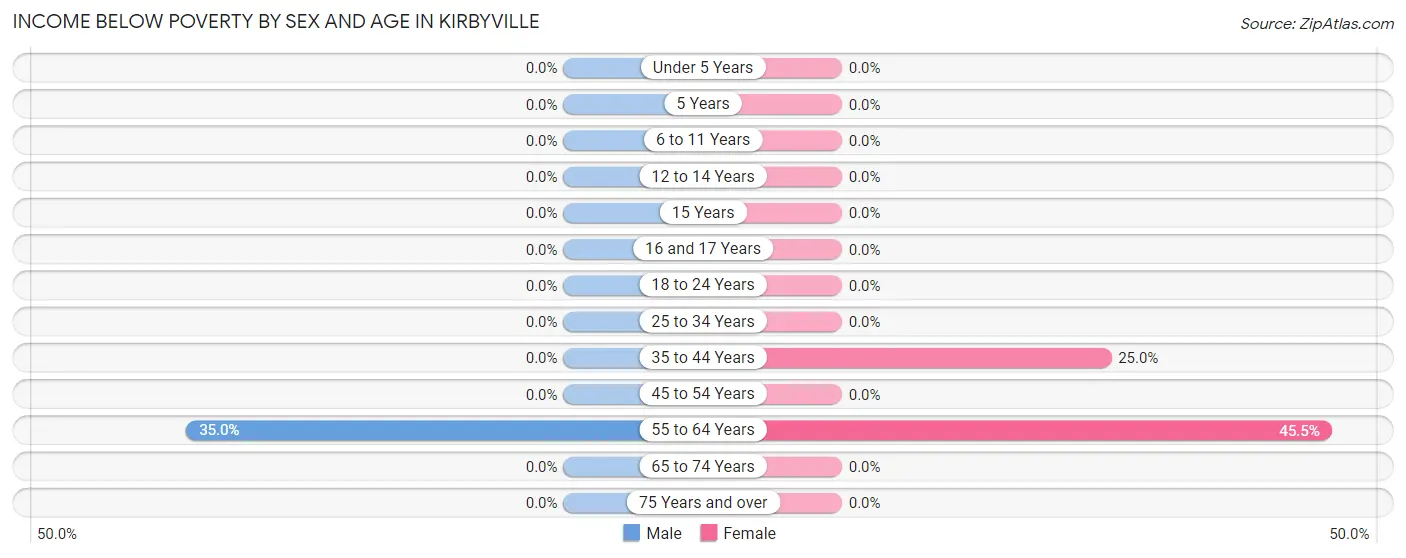
| Age Bracket | Male | Female |
| Under 5 Years | 0 (0.0%) | 0 (0.0%) |
| 5 Years | 0 (0.0%) | 0 (0.0%) |
| 6 to 11 Years | 0 (0.0%) | 0 (0.0%) |
| 12 to 14 Years | 0 (0.0%) | 0 (0.0%) |
| 15 Years | 0 (0.0%) | 0 (0.0%) |
| 16 and 17 Years | 0 (0.0%) | 0 (0.0%) |
| 18 to 24 Years | 0 (0.0%) | 0 (0.0%) |
| 25 to 34 Years | 0 (0.0%) | 0 (0.0%) |
| 35 to 44 Years | 0 (0.0%) | 3 (25.0%) |
| 45 to 54 Years | 0 (0.0%) | 0 (0.0%) |
| 55 to 64 Years | 7 (35.0%) | 5 (45.5%) |
| 65 to 74 Years | 0 (0.0%) | 0 (0.0%) |
| 75 Years and over | 0 (0.0%) | 0 (0.0%) |
| Total | 7 (11.1%) | 8 (19.1%) |
Income Above Poverty by Sex and Age in Kirbyville
According to the poverty statistics in Kirbyville, males aged under 5 years and females aged 12 to 14 years are the age groups that are most secure financially, with 100.0% of males and 100.0% of females in these age groups living above the poverty line.
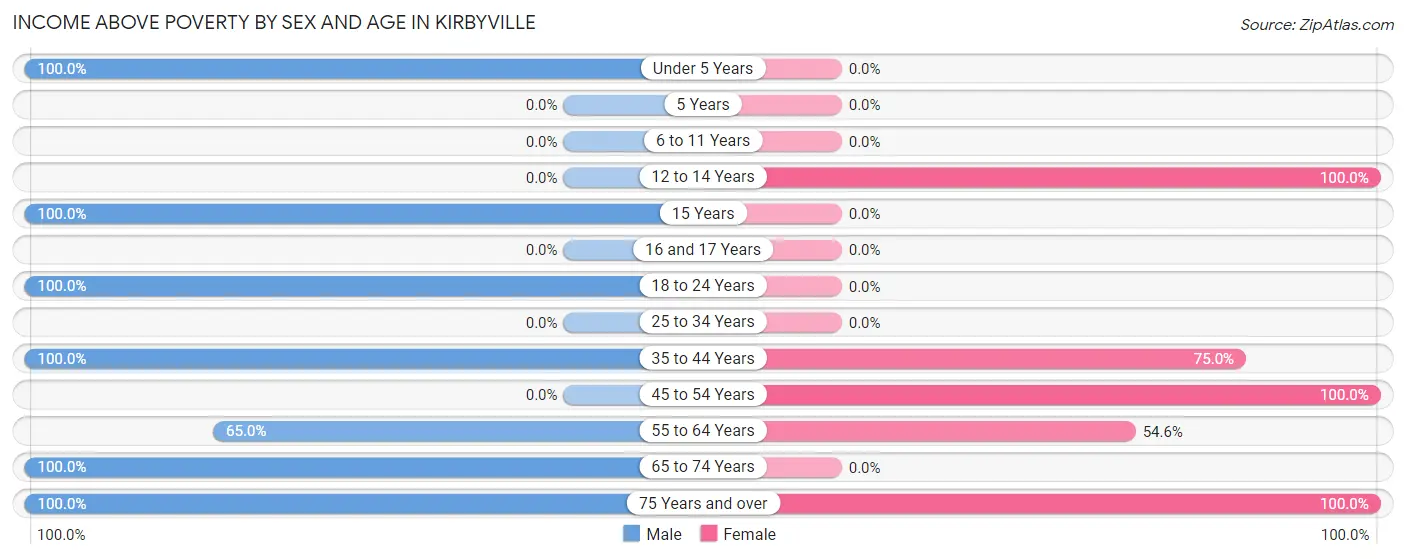
| Age Bracket | Male | Female |
| Under 5 Years | 5 (100.0%) | 0 (0.0%) |
| 5 Years | 0 (0.0%) | 0 (0.0%) |
| 6 to 11 Years | 0 (0.0%) | 0 (0.0%) |
| 12 to 14 Years | 0 (0.0%) | 2 (100.0%) |
| 15 Years | 4 (100.0%) | 0 (0.0%) |
| 16 and 17 Years | 0 (0.0%) | 0 (0.0%) |
| 18 to 24 Years | 12 (100.0%) | 0 (0.0%) |
| 25 to 34 Years | 0 (0.0%) | 0 (0.0%) |
| 35 to 44 Years | 10 (100.0%) | 9 (75.0%) |
| 45 to 54 Years | 0 (0.0%) | 9 (100.0%) |
| 55 to 64 Years | 13 (65.0%) | 6 (54.5%) |
| 65 to 74 Years | 10 (100.0%) | 0 (0.0%) |
| 75 Years and over | 2 (100.0%) | 8 (100.0%) |
| Total | 56 (88.9%) | 34 (80.9%) |
Income Below Poverty Among Married-Couple Families in Kirbyville
The poverty statistics for married-couple families in Kirbyville show that 19.2% or 5 of the total 26 families live below the poverty line. Families with no children have the highest poverty rate of 20.8%, comprising of 5 families. On the other hand, families with 3 or 4 children have the lowest poverty rate of 0.0%, which includes 0 families.
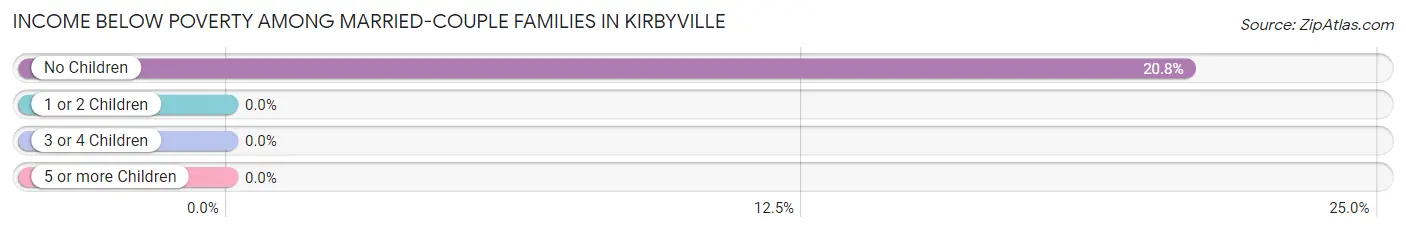
| Children | Above Poverty | Below Poverty |
| No Children | 19 (79.2%) | 5 (20.8%) |
| 1 or 2 Children | 0 (0.0%) | 0 (0.0%) |
| 3 or 4 Children | 2 (100.0%) | 0 (0.0%) |
| 5 or more Children | 0 (0.0%) | 0 (0.0%) |
| Total | 21 (80.8%) | 5 (19.2%) |
Income Below Poverty Among Single-Parent Households in Kirbyville
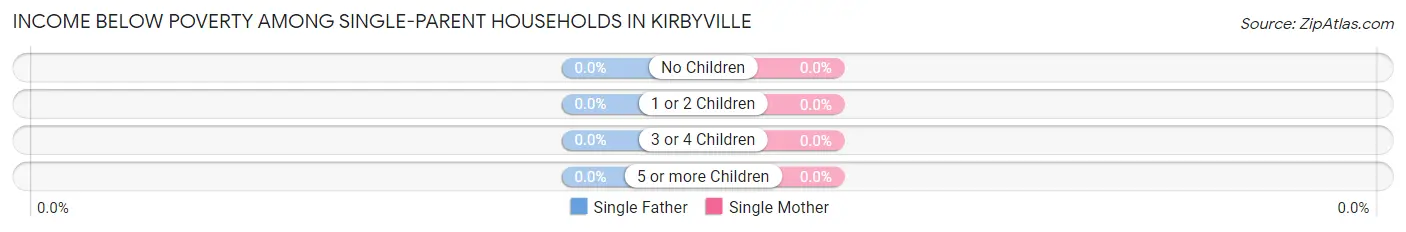
| Children | Single Father | Single Mother |
| No Children | 0 (0.0%) | 0 (0.0%) |
| 1 or 2 Children | 0 (0.0%) | 0 (0.0%) |
| 3 or 4 Children | 0 (0.0%) | 0 (0.0%) |
| 5 or more Children | 0 (0.0%) | 0 (0.0%) |
| Total | 0 (0.0%) | 0 (0.0%) |
Income Below Poverty Among Married-Couple vs Single-Parent Households in Kirbyville
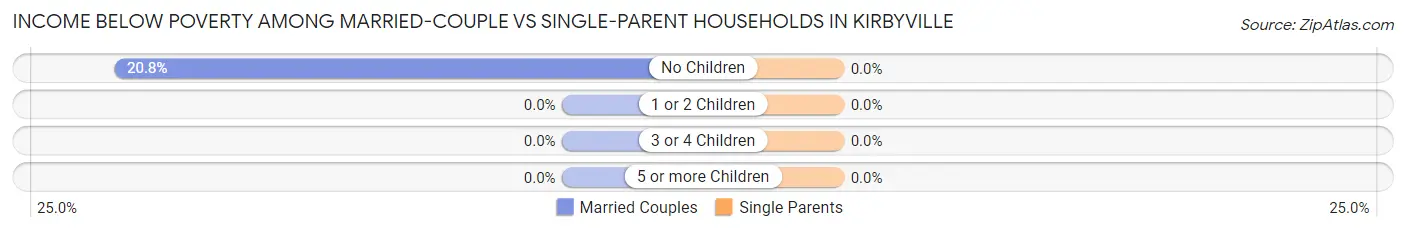
| Children | Married-Couple Families | Single-Parent Households |
| No Children | 5 (20.8%) | 0 (0.0%) |
| 1 or 2 Children | 0 (0.0%) | 0 (0.0%) |
| 3 or 4 Children | 0 (0.0%) | 0 (0.0%) |
| 5 or more Children | 0 (0.0%) | 0 (0.0%) |
| Total | 5 (19.2%) | 0 (0.0%) |
Race in Kirbyville
The most populous races in Kirbyville are White / Caucasian (100 | 91.7%), and Two or more Races (9 | 8.3%).
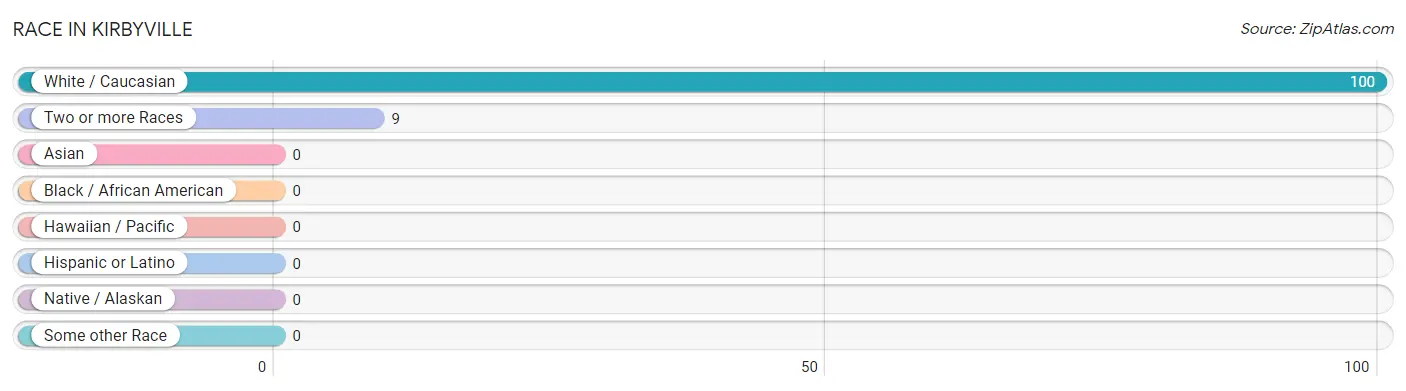
| Race | # Population | % Population |
| Asian | 0 | 0.0% |
| Black / African American | 0 | 0.0% |
| Hawaiian / Pacific | 0 | 0.0% |
| Hispanic or Latino | 0 | 0.0% |
| Native / Alaskan | 0 | 0.0% |
| White / Caucasian | 100 | 91.7% |
| Two or more Races | 9 | 8.3% |
| Some other Race | 0 | 0.0% |
| Total | 109 | 100.0% |
Ancestry in Kirbyville
The most populous ancestries reported in Kirbyville are German (22 | 20.2%), Irish (19 | 17.4%), Italian (19 | 17.4%), French (15 | 13.8%), and American (4 | 3.7%), together accounting for 72.5% of all Kirbyville residents.
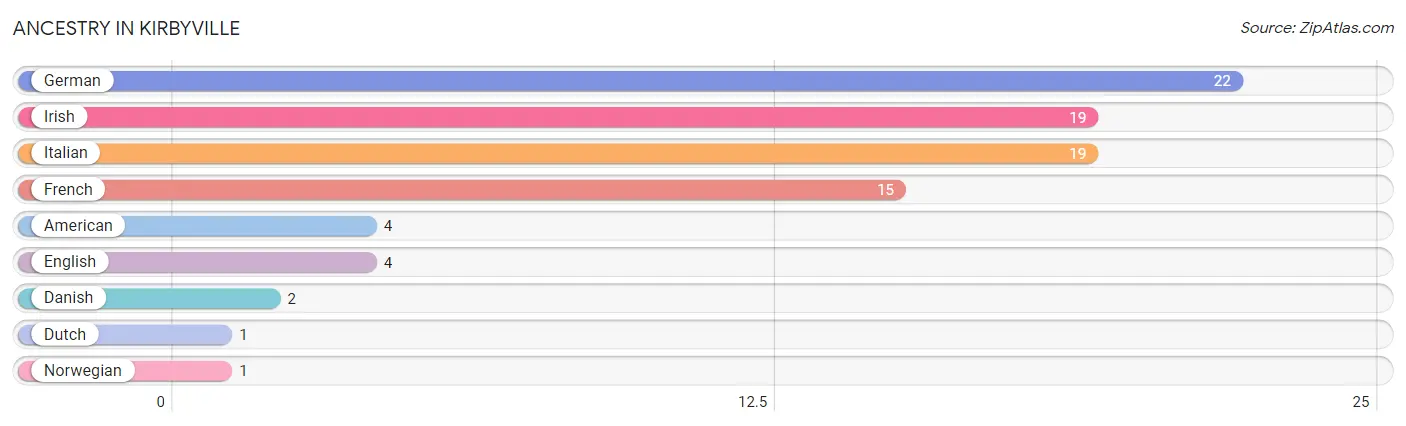
| Ancestry | # Population | % Population |
| American | 4 | 3.7% |
| Danish | 2 | 1.8% |
| Dutch | 1 | 0.9% |
| English | 4 | 3.7% |
| French | 15 | 13.8% |
| German | 22 | 20.2% |
| Irish | 19 | 17.4% |
| Italian | 19 | 17.4% |
| Norwegian | 1 | 0.9% | View All 9 Rows |
Immigrants in Kirbyville

| Immigration Origin | # Population | % Population | View All 0 Rows |
Sex and Age in Kirbyville
Sex and Age in Kirbyville
The most populous age groups in Kirbyville are 15 to 19 Years (16 | 23.9%) for men and 45 to 49 Years (9 | 21.4%) for women.
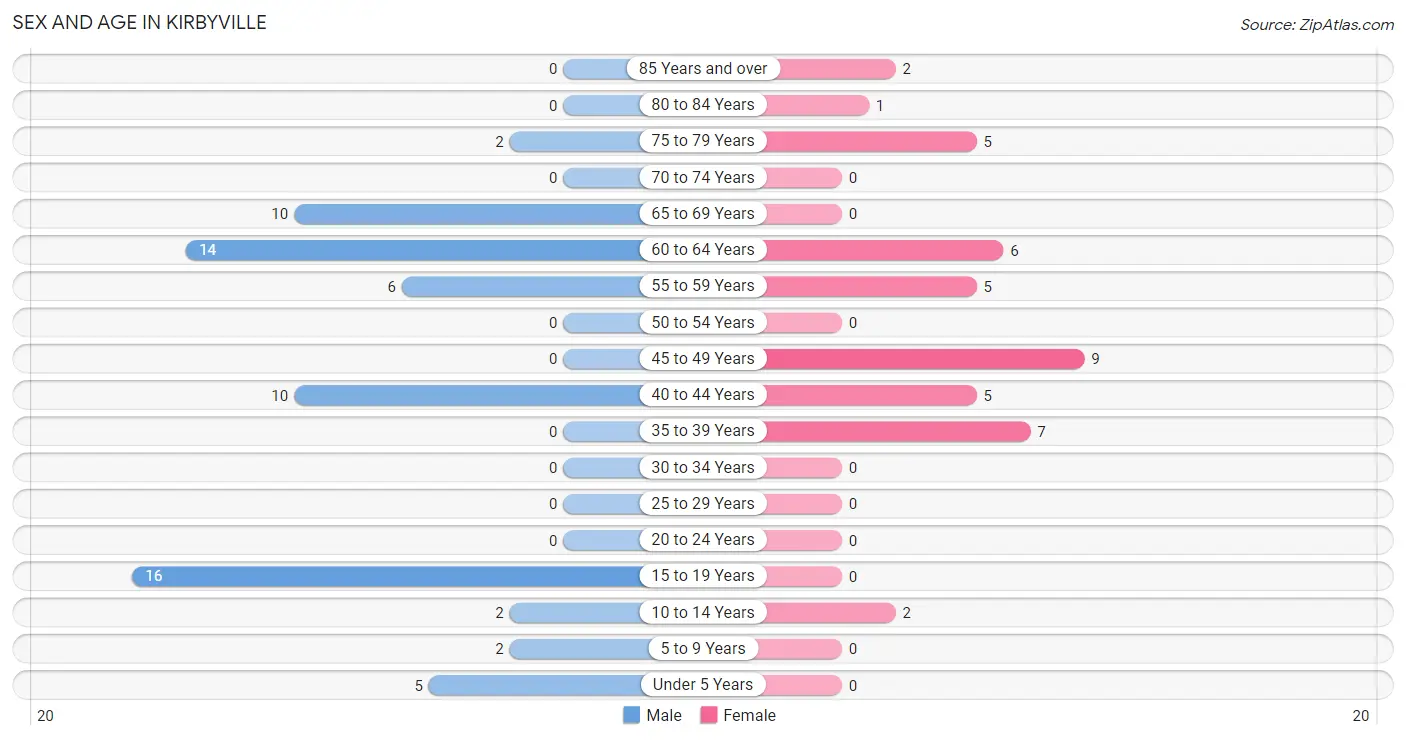
| Age Bracket | Male | Female |
| Under 5 Years | 5 (7.5%) | 0 (0.0%) |
| 5 to 9 Years | 2 (3.0%) | 0 (0.0%) |
| 10 to 14 Years | 2 (3.0%) | 2 (4.8%) |
| 15 to 19 Years | 16 (23.9%) | 0 (0.0%) |
| 20 to 24 Years | 0 (0.0%) | 0 (0.0%) |
| 25 to 29 Years | 0 (0.0%) | 0 (0.0%) |
| 30 to 34 Years | 0 (0.0%) | 0 (0.0%) |
| 35 to 39 Years | 0 (0.0%) | 7 (16.7%) |
| 40 to 44 Years | 10 (14.9%) | 5 (11.9%) |
| 45 to 49 Years | 0 (0.0%) | 9 (21.4%) |
| 50 to 54 Years | 0 (0.0%) | 0 (0.0%) |
| 55 to 59 Years | 6 (9.0%) | 5 (11.9%) |
| 60 to 64 Years | 14 (20.9%) | 6 (14.3%) |
| 65 to 69 Years | 10 (14.9%) | 0 (0.0%) |
| 70 to 74 Years | 0 (0.0%) | 0 (0.0%) |
| 75 to 79 Years | 2 (3.0%) | 5 (11.9%) |
| 80 to 84 Years | 0 (0.0%) | 1 (2.4%) |
| 85 Years and over | 0 (0.0%) | 2 (4.8%) |
| Total | 67 (100.0%) | 42 (100.0%) |
Families and Households in Kirbyville
Median Family Size in Kirbyville
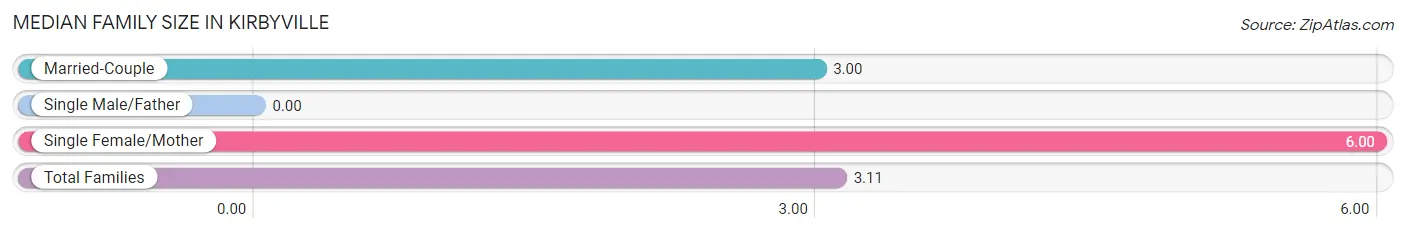
| Family Type | # Families | Family Size |
| Married-Couple | 26 (96.3%) | 3.00 |
| Single Male/Father | 0 (0.0%) | - |
| Single Female/Mother | 1 (3.7%) | 6.00 |
| Total Families | 27 (100.0%) | 3.11 |
Median Household Size in Kirbyville
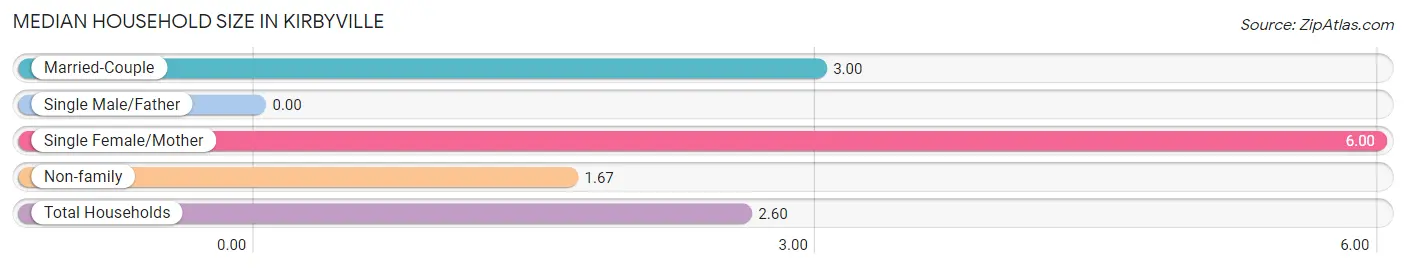
| Household Type | # Households | Household Size |
| Married-Couple | 26 (61.9%) | 3.00 |
| Single Male/Father | 0 (0.0%) | - |
| Single Female/Mother | 1 (2.4%) | 6.00 |
| Non-family | 15 (35.7%) | 1.67 |
| Total Households | 42 (100.0%) | 2.60 |
Household Size by Marriage Status in Kirbyville
Out of a total of 42 households in Kirbyville, 27 (64.3%) are family households, while 15 (35.7%) are nonfamily households. The most numerous type of family households are 2-person households, comprising 18, and the most common type of nonfamily households are 1-person households, comprising 11.
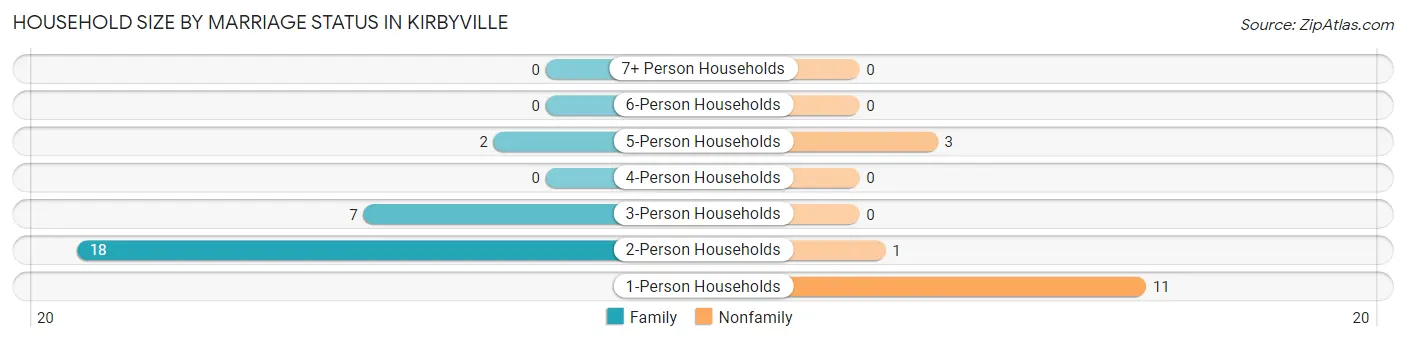
| Household Size | Family Households | Nonfamily Households |
| 1-Person Households | - | 11 (26.2%) |
| 2-Person Households | 18 (42.9%) | 1 (2.4%) |
| 3-Person Households | 7 (16.7%) | 0 (0.0%) |
| 4-Person Households | 0 (0.0%) | 0 (0.0%) |
| 5-Person Households | 2 (4.8%) | 3 (7.1%) |
| 6-Person Households | 0 (0.0%) | 0 (0.0%) |
| 7+ Person Households | 0 (0.0%) | 0 (0.0%) |
| Total | 27 (64.3%) | 15 (35.7%) |
Female Fertility in Kirbyville
Fertility by Age in Kirbyville
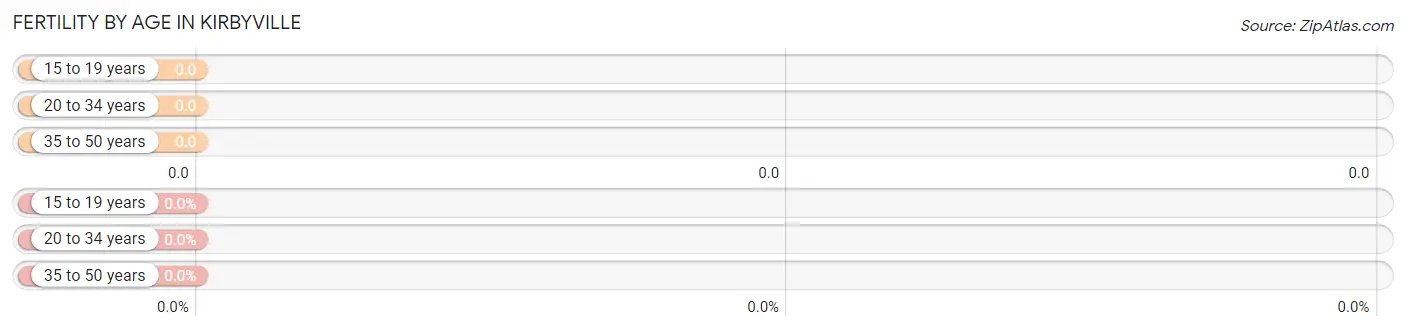
| Age Bracket | Women with Births | Births / 1,000 Women |
| 15 to 19 years | 0 (0.0%) | 0.0 |
| 20 to 34 years | 0 (0.0%) | 0.0 |
| 35 to 50 years | 0 (0.0%) | 0.0 |
| Total | 0 (0.0%) | 0.0 |
Fertility by Age by Marriage Status in Kirbyville
| Age Bracket | Married | Unmarried |
| 15 to 19 years | 0 (0.0%) | 0 (0.0%) |
| 20 to 34 years | 0 (0.0%) | 0 (0.0%) |
| 35 to 50 years | 0 (0.0%) | 0 (0.0%) |
| Total | 0 (0.0%) | 0 (0.0%) |
Fertility by Education in Kirbyville
| Educational Attainment | Women with Births | Births / 1,000 Women |
| Less than High School | 0 (0.0%) | 0.0 |
| High School Diploma | 0 (0.0%) | 0.0 |
| College or Associate's Degree | 0 (0.0%) | 0.0 |
| Bachelor's Degree | 0 (0.0%) | 0.0 |
| Graduate Degree | 0 (0.0%) | 0.0 |
| Total | 0 (0.0%) | 0.0 |
Fertility by Education by Marriage Status in Kirbyville
| Educational Attainment | Married | Unmarried |
| Less than High School | 0 (0.0%) | 0 (0.0%) |
| High School Diploma | 0 (0.0%) | 0 (0.0%) |
| College or Associate's Degree | 0 (0.0%) | 0 (0.0%) |
| Bachelor's Degree | 0 (0.0%) | 0 (0.0%) |
| Graduate Degree | 0 (0.0%) | 0 (0.0%) |
| Total | 0 (0.0%) | 0 (0.0%) |
Employment Characteristics in Kirbyville
Employment by Class of Employer in Kirbyville
Among the 42 employed individuals in Kirbyville, private company employees (32 | 76.2%), state government employees (5 | 11.9%), and self-employed (not incorporated) (3 | 7.1%) make up the most common classes of employment.
| Employer Class | # Employees | % Employees |
| Private Company Employees | 32 | 76.2% |
| Self-Employed (Incorporated) | 0 | 0.0% |
| Self-Employed (Not Incorporated) | 3 | 7.1% |
| Not-for-profit Organizations | 2 | 4.8% |
| Local Government Employees | 0 | 0.0% |
| State Government Employees | 5 | 11.9% |
| Federal Government Employees | 0 | 0.0% |
| Unpaid Family Workers | 0 | 0.0% |
| Total | 42 | 100.0% |
Employment Status by Age in Kirbyville
| Age Bracket | In Labor Force | Unemployed |
| 16 to 19 Years | 0 (0.0%) | 0 (0.0%) |
| 20 to 24 Years | 0 (0.0%) | 0 (0.0%) |
| 25 to 29 Years | 0 (0.0%) | 0 (0.0%) |
| 30 to 34 Years | 0 (0.0%) | 0 (0.0%) |
| 35 to 44 Years | 11 (50.0%) | 0 (0.0%) |
| 45 to 54 Years | 9 (100.0%) | 0 (0.0%) |
| 55 to 59 Years | 11 (100.0%) | 0 (0.0%) |
| 60 to 64 Years | 1 (5.0%) | 0 (0.0%) |
| 65 to 74 Years | 7 (70.0%) | 0 (0.0%) |
| 75 Years and over | 3 (30.0%) | 0 (0.0%) |
| Total | 42 (44.7%) | 0 (0.0%) |
Employment Status by Educational Attainment in Kirbyville
| Educational Attainment | In Labor Force | Unemployed |
| Less than High School | 0 (0.0%) | 0 (0.0%) |
| High School Diploma | 3 (14.3%) | 0 (0.0%) |
| College / Associate Degree | 24 (82.8%) | 0 (0.0%) |
| Bachelor's Degree or higher | 5 (100.0%) | 0 (0.0%) |
| Total | 32 (51.6%) | 0 (0.0%) |
Employment Occupations by Sex in Kirbyville
Management, Business, Science and Arts Occupations
The most common Management, Business, Science and Arts occupations in Kirbyville are Community & Social Service (8 | 19.1%), Management (6 | 14.3%), Education Instruction & Library (5 | 11.9%), Arts, Media & Entertainment (3 | 7.1%), and Health Diagnosing & Treating (2 | 4.8%).
Management, Business, Science and Arts Occupations by Sex
Within the Management, Business, Science and Arts occupations in Kirbyville, the most male-oriented occupations are Community & Social Service (100.0%), Education Instruction & Library (100.0%), and Arts, Media & Entertainment (100.0%), while the most female-oriented occupations are Health Diagnosing & Treating (100.0%), and Management (16.7%).
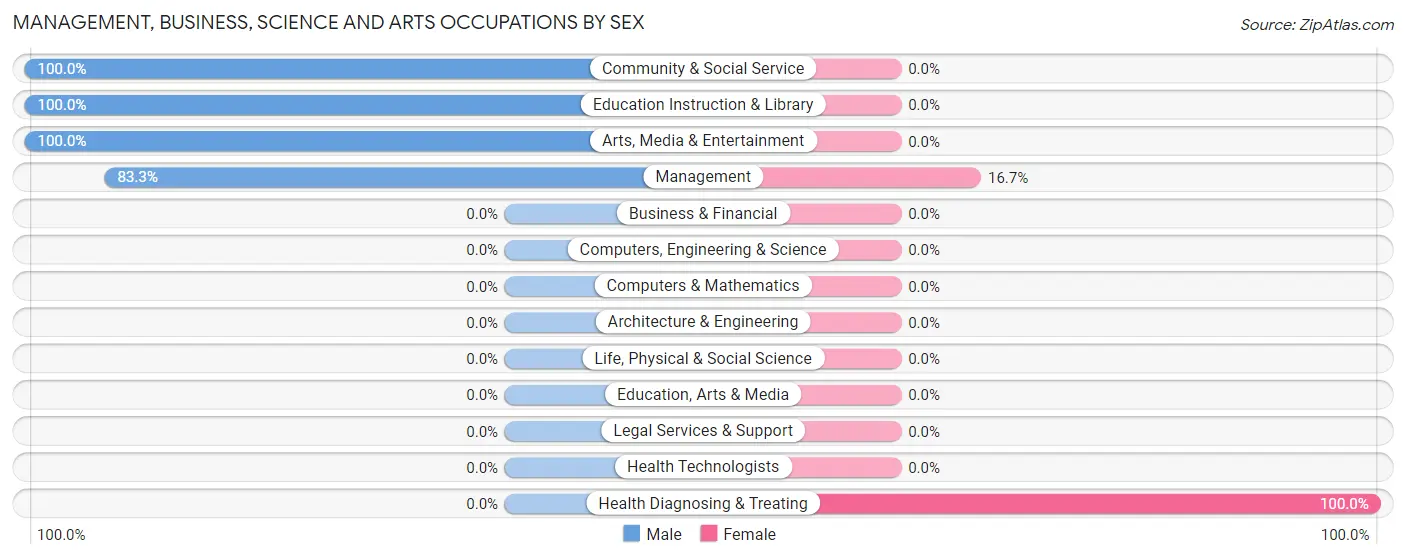
| Occupation | Male | Female |
| Management | 5 (83.3%) | 1 (16.7%) |
| Business & Financial | 0 (0.0%) | 0 (0.0%) |
| Computers, Engineering & Science | 0 (0.0%) | 0 (0.0%) |
| Computers & Mathematics | 0 (0.0%) | 0 (0.0%) |
| Architecture & Engineering | 0 (0.0%) | 0 (0.0%) |
| Life, Physical & Social Science | 0 (0.0%) | 0 (0.0%) |
| Community & Social Service | 8 (100.0%) | 0 (0.0%) |
| Education, Arts & Media | 0 (0.0%) | 0 (0.0%) |
| Legal Services & Support | 0 (0.0%) | 0 (0.0%) |
| Education Instruction & Library | 5 (100.0%) | 0 (0.0%) |
| Arts, Media & Entertainment | 3 (100.0%) | 0 (0.0%) |
| Health Diagnosing & Treating | 0 (0.0%) | 2 (100.0%) |
| Health Technologists | 0 (0.0%) | 0 (0.0%) |
| Total (Category) | 13 (81.2%) | 3 (18.8%) |
| Total (Overall) | 19 (45.2%) | 23 (54.8%) |
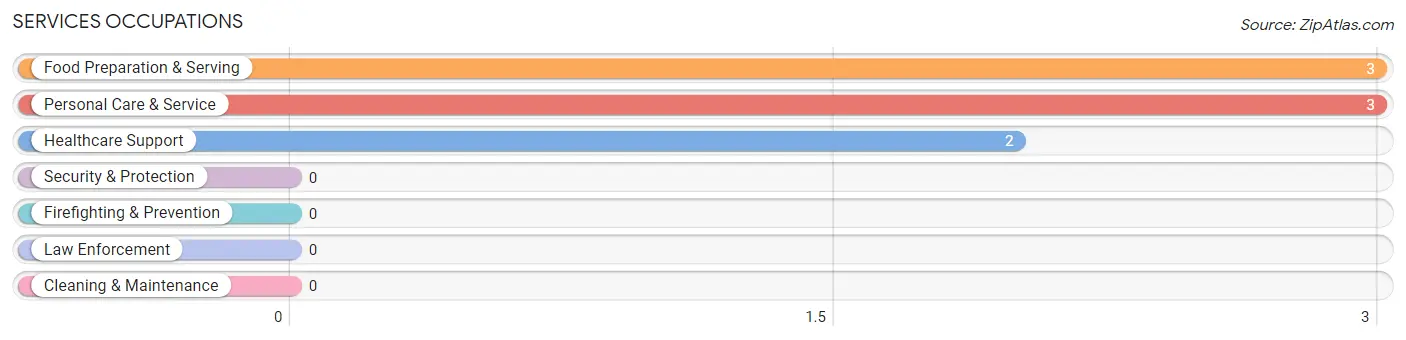
Services Occupations
The most common Services occupations in Kirbyville are Food Preparation & Serving (3 | 7.1%), Personal Care & Service (3 | 7.1%), and Healthcare Support (2 | 4.8%).
Services Occupations by Sex
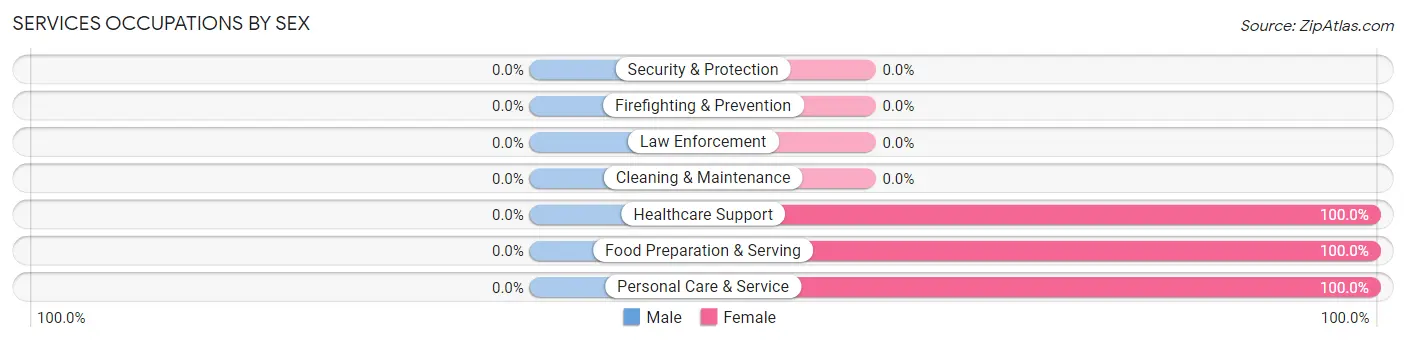
| Occupation | Male | Female |
| Healthcare Support | 0 (0.0%) | 2 (100.0%) |
| Security & Protection | 0 (0.0%) | 0 (0.0%) |
| Firefighting & Prevention | 0 (0.0%) | 0 (0.0%) |
| Law Enforcement | 0 (0.0%) | 0 (0.0%) |
| Food Preparation & Serving | 0 (0.0%) | 3 (100.0%) |
| Cleaning & Maintenance | 0 (0.0%) | 0 (0.0%) |
| Personal Care & Service | 0 (0.0%) | 3 (100.0%) |
| Total (Category) | 0 (0.0%) | 8 (100.0%) |
| Total (Overall) | 19 (45.2%) | 23 (54.8%) |
Sales and Office Occupations
The most common Sales and Office occupations in Kirbyville are , and Sales & Related (9 | 21.4%).
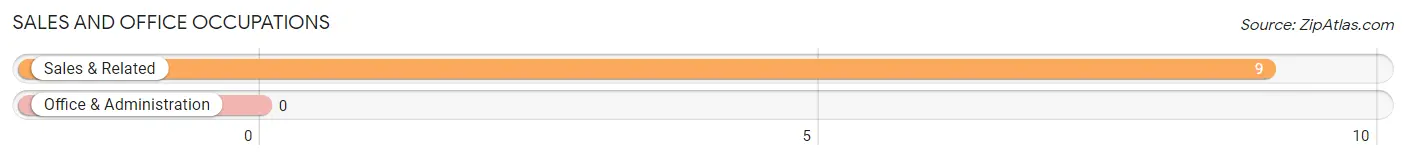
Sales and Office Occupations by Sex
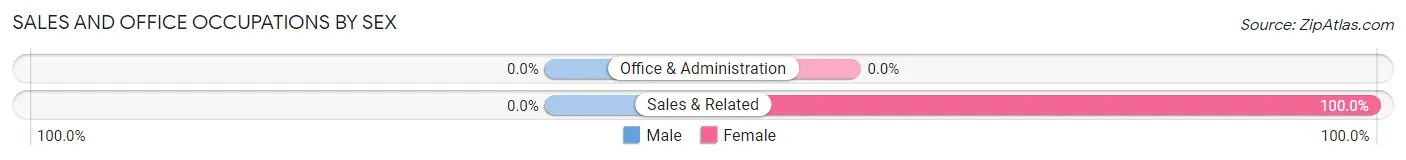
| Occupation | Male | Female |
| Sales & Related | 0 (0.0%) | 9 (100.0%) |
| Office & Administration | 0 (0.0%) | 0 (0.0%) |
| Total (Category) | 0 (0.0%) | 9 (100.0%) |
| Total (Overall) | 19 (45.2%) | 23 (54.8%) |
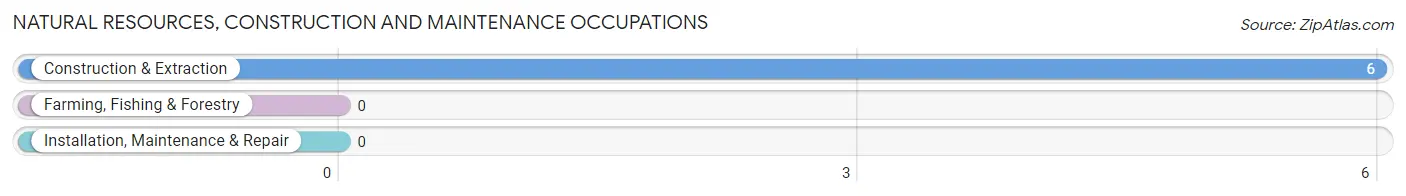
Natural Resources, Construction and Maintenance Occupations
The most common Natural Resources, Construction and Maintenance occupations in Kirbyville are , and Construction & Extraction (6 | 14.3%).
Natural Resources, Construction and Maintenance Occupations by Sex
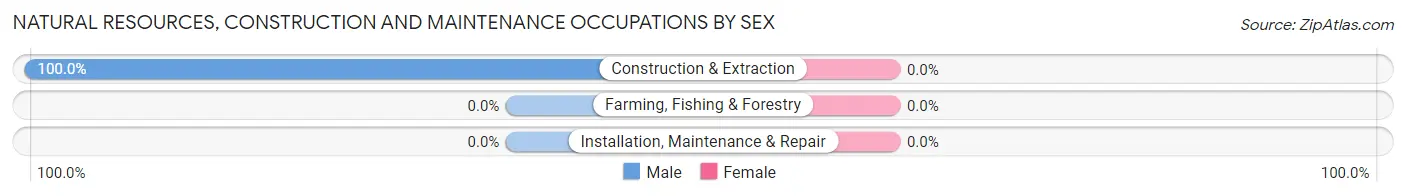
| Occupation | Male | Female |
| Farming, Fishing & Forestry | 0 (0.0%) | 0 (0.0%) |
| Construction & Extraction | 6 (100.0%) | 0 (0.0%) |
| Installation, Maintenance & Repair | 0 (0.0%) | 0 (0.0%) |
| Total (Category) | 6 (100.0%) | 0 (0.0%) |
| Total (Overall) | 19 (45.2%) | 23 (54.8%) |
Production, Transportation and Moving Occupations
The most common Production, Transportation and Moving occupations in Kirbyville are Production (2 | 4.8%), and Material Moving (1 | 2.4%).
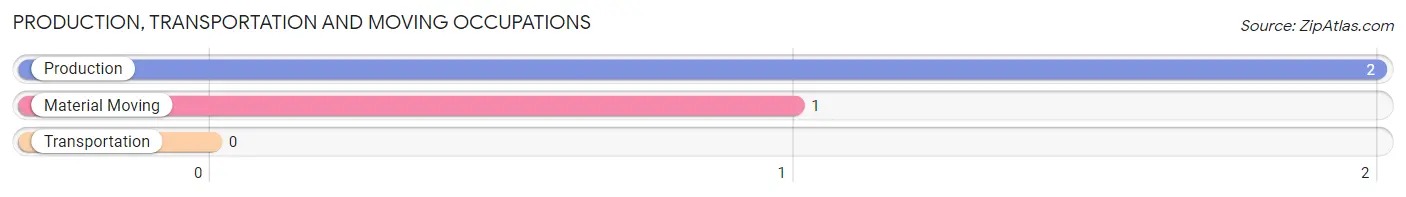
Production, Transportation and Moving Occupations by Sex
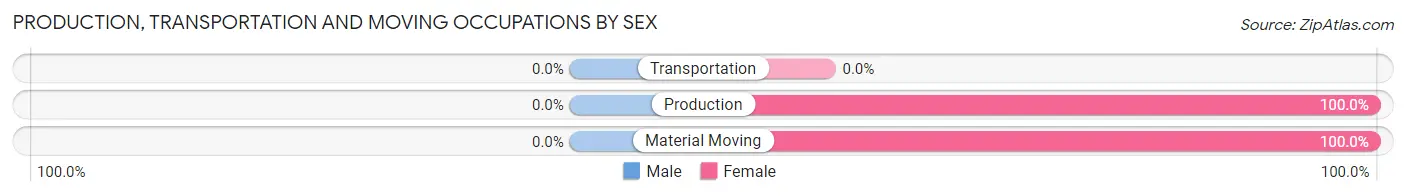
| Occupation | Male | Female |
| Production | 0 (0.0%) | 2 (100.0%) |
| Transportation | 0 (0.0%) | 0 (0.0%) |
| Material Moving | 0 (0.0%) | 1 (100.0%) |
| Total (Category) | 0 (0.0%) | 3 (100.0%) |
| Total (Overall) | 19 (45.2%) | 23 (54.8%) |
Employment Industries by Sex in Kirbyville
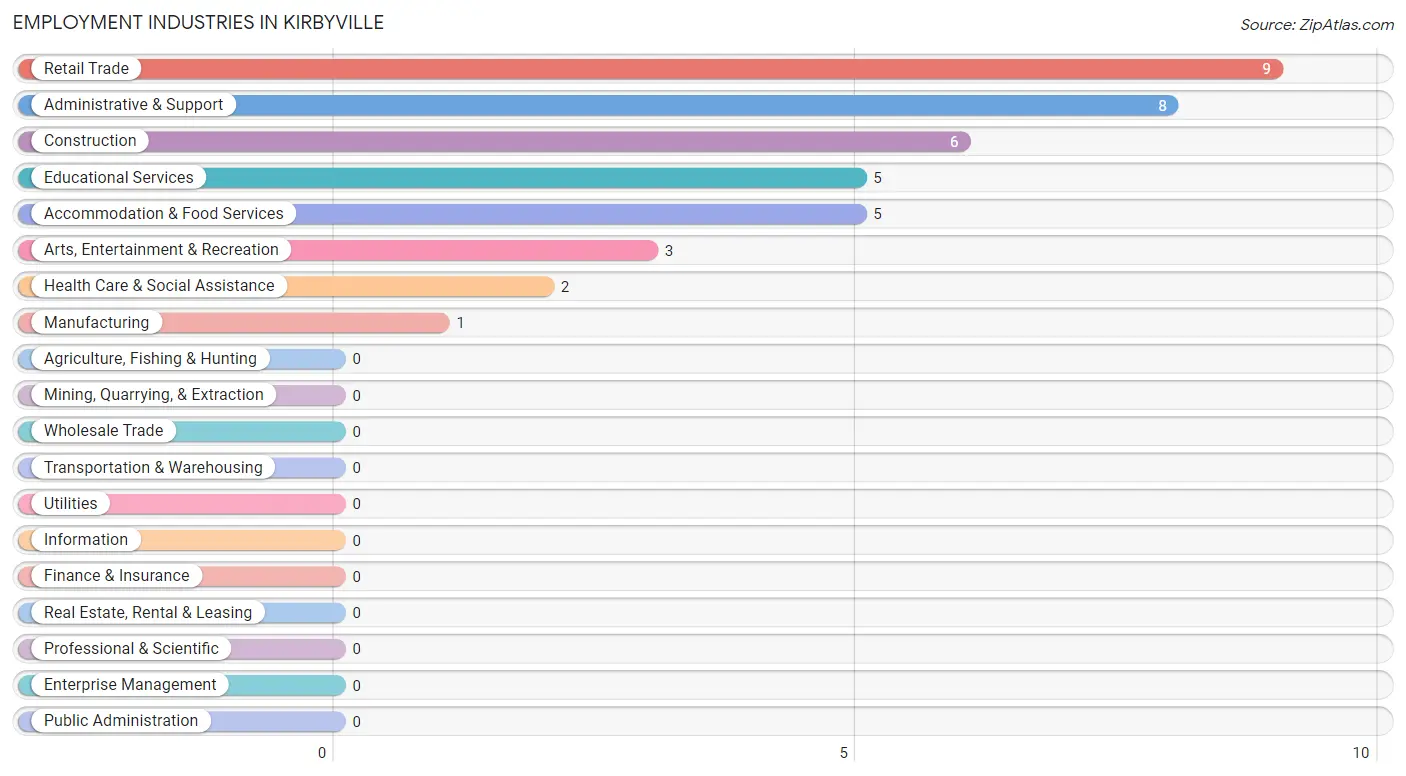
Employment Industries in Kirbyville
The major employment industries in Kirbyville include Retail Trade (9 | 21.4%), Administrative & Support (8 | 19.1%), Construction (6 | 14.3%), Educational Services (5 | 11.9%), and Accommodation & Food Services (5 | 11.9%).
Employment Industries by Sex in Kirbyville
The Kirbyville industries that see more men than women are Construction (100.0%), Educational Services (100.0%), and Arts, Entertainment & Recreation (100.0%), whereas the industries that tend to have a higher number of women are Manufacturing (100.0%), Administrative & Support (100.0%), and Health Care & Social Assistance (100.0%).
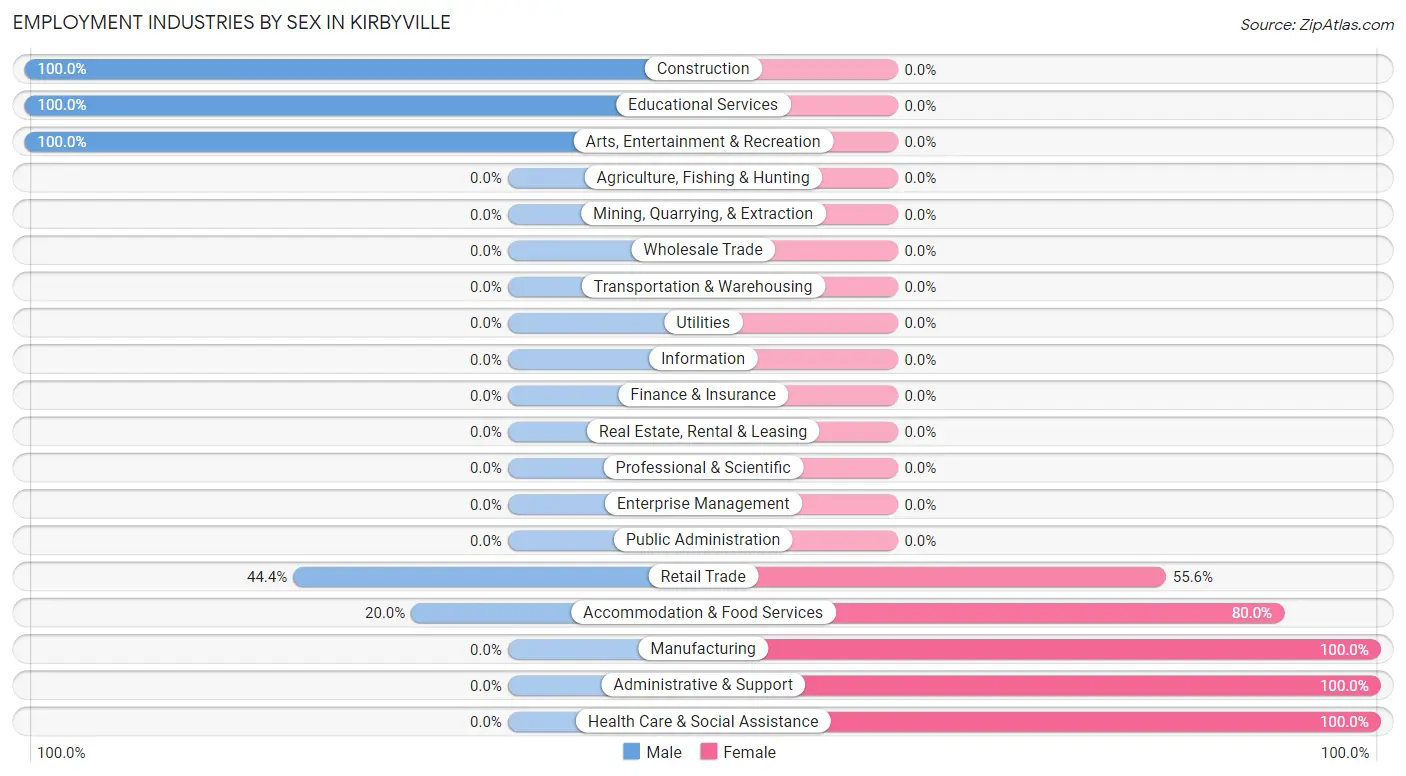
| Industry | Male | Female |
| Agriculture, Fishing & Hunting | 0 (0.0%) | 0 (0.0%) |
| Mining, Quarrying, & Extraction | 0 (0.0%) | 0 (0.0%) |
| Construction | 6 (100.0%) | 0 (0.0%) |
| Manufacturing | 0 (0.0%) | 1 (100.0%) |
| Wholesale Trade | 0 (0.0%) | 0 (0.0%) |
| Retail Trade | 4 (44.4%) | 5 (55.6%) |
| Transportation & Warehousing | 0 (0.0%) | 0 (0.0%) |
| Utilities | 0 (0.0%) | 0 (0.0%) |
| Information | 0 (0.0%) | 0 (0.0%) |
| Finance & Insurance | 0 (0.0%) | 0 (0.0%) |
| Real Estate, Rental & Leasing | 0 (0.0%) | 0 (0.0%) |
| Professional & Scientific | 0 (0.0%) | 0 (0.0%) |
| Enterprise Management | 0 (0.0%) | 0 (0.0%) |
| Administrative & Support | 0 (0.0%) | 8 (100.0%) |
| Educational Services | 5 (100.0%) | 0 (0.0%) |
| Health Care & Social Assistance | 0 (0.0%) | 2 (100.0%) |
| Arts, Entertainment & Recreation | 3 (100.0%) | 0 (0.0%) |
| Accommodation & Food Services | 1 (20.0%) | 4 (80.0%) |
| Public Administration | 0 (0.0%) | 0 (0.0%) |
| Total | 19 (45.2%) | 23 (54.8%) |
Education in Kirbyville
School Enrollment in Kirbyville
The most common levels of schooling among the 18 students in Kirbyville are college / undergraduate (8 | 44.4%), middle school (4 | 22.2%), and high school (4 | 22.2%).
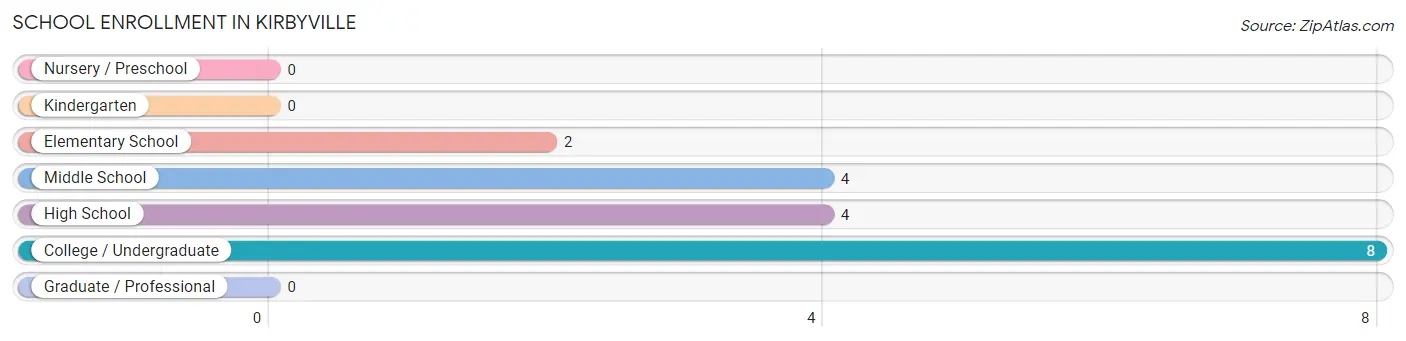
| School Level | # Students | % Students |
| Nursery / Preschool | 0 | 0.0% |
| Kindergarten | 0 | 0.0% |
| Elementary School | 2 | 11.1% |
| Middle School | 4 | 22.2% |
| High School | 4 | 22.2% |
| College / Undergraduate | 8 | 44.4% |
| Graduate / Professional | 0 | 0.0% |
| Total | 18 | 100.0% |
School Enrollment by Age by Funding Source in Kirbyville
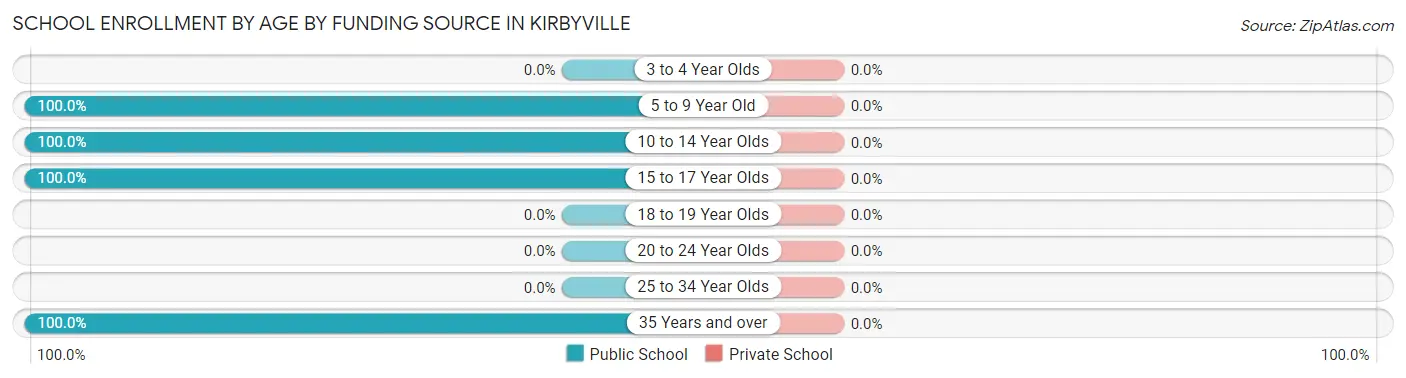
| Age Bracket | Public School | Private School |
| 3 to 4 Year Olds | 0 (0.0%) | 0 (0.0%) |
| 5 to 9 Year Old | 2 (100.0%) | 0 (0.0%) |
| 10 to 14 Year Olds | 4 (100.0%) | 0 (0.0%) |
| 15 to 17 Year Olds | 4 (100.0%) | 0 (0.0%) |
| 18 to 19 Year Olds | 0 (0.0%) | 0 (0.0%) |
| 20 to 24 Year Olds | 0 (0.0%) | 0 (0.0%) |
| 25 to 34 Year Olds | 0 (0.0%) | 0 (0.0%) |
| 35 Years and over | 8 (100.0%) | 0 (0.0%) |
| Total | 18 (100.0%) | 0 (0.0%) |
Educational Attainment by Field of Study in Kirbyville
, and education (5 | 100.0%) are the most common fields of study among 5 individuals in Kirbyville who have obtained a bachelor's degree or higher.
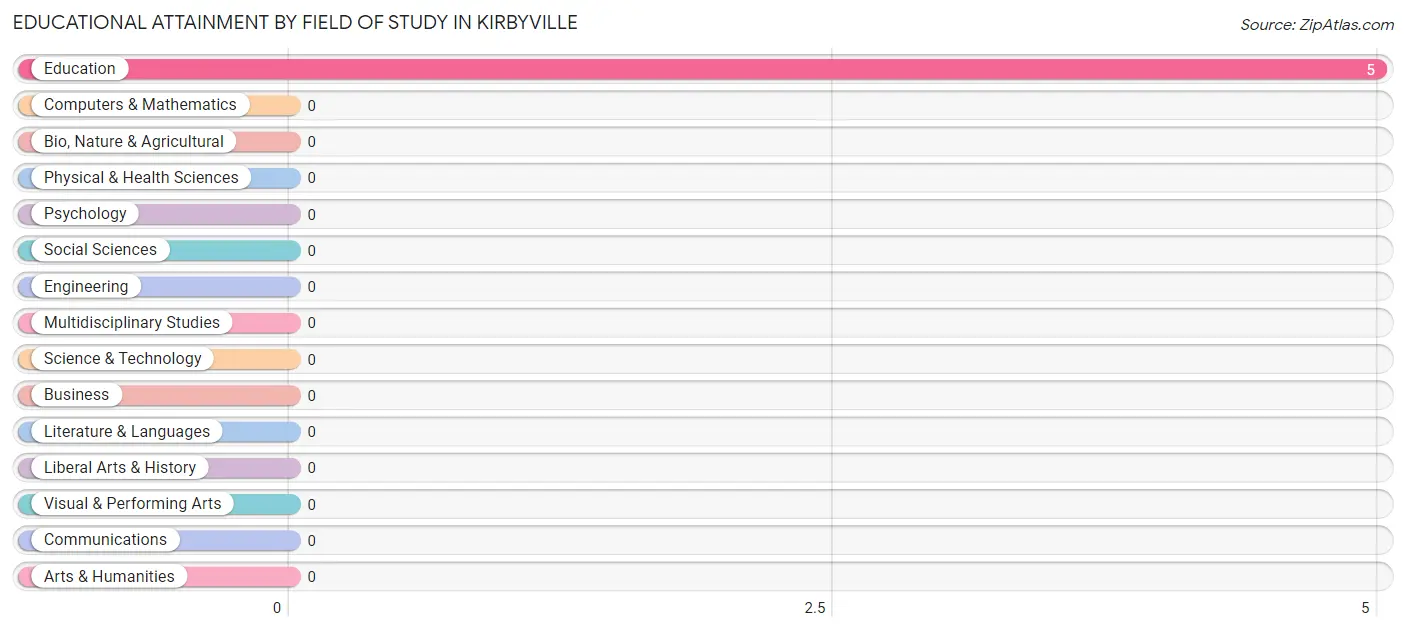
| Field of Study | # Graduates | % Graduates |
| Computers & Mathematics | 0 | 0.0% |
| Bio, Nature & Agricultural | 0 | 0.0% |
| Physical & Health Sciences | 0 | 0.0% |
| Psychology | 0 | 0.0% |
| Social Sciences | 0 | 0.0% |
| Engineering | 0 | 0.0% |
| Multidisciplinary Studies | 0 | 0.0% |
| Science & Technology | 0 | 0.0% |
| Business | 0 | 0.0% |
| Education | 5 | 100.0% |
| Literature & Languages | 0 | 0.0% |
| Liberal Arts & History | 0 | 0.0% |
| Visual & Performing Arts | 0 | 0.0% |
| Communications | 0 | 0.0% |
| Arts & Humanities | 0 | 0.0% |
| Total | 5 | 100.0% |
Transportation & Commute in Kirbyville
Vehicle Availability by Sex in Kirbyville
The most prevalent vehicle ownership categories in Kirbyville are males with 1 vehicle (6, accounting for 31.6%) and females with 1 vehicle (4, making up 26.1%).
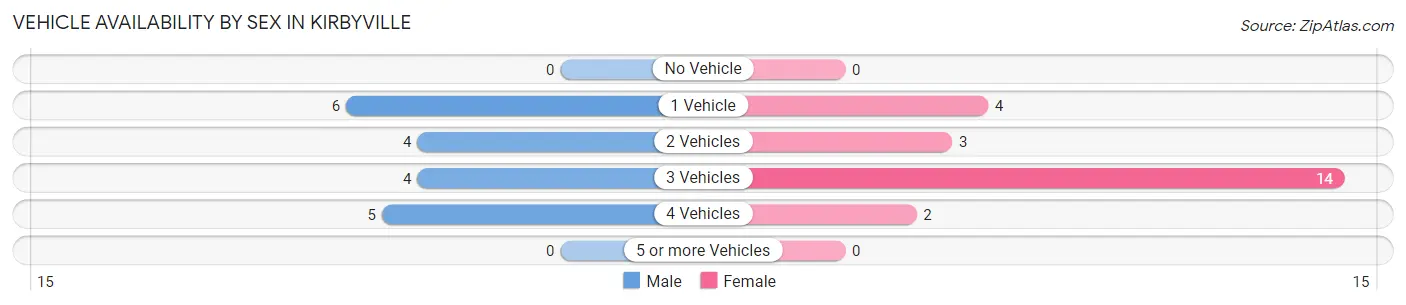
| Vehicles Available | Male | Female |
| No Vehicle | 0 (0.0%) | 0 (0.0%) |
| 1 Vehicle | 6 (31.6%) | 4 (17.4%) |
| 2 Vehicles | 4 (21.0%) | 3 (13.0%) |
| 3 Vehicles | 4 (21.0%) | 14 (60.9%) |
| 4 Vehicles | 5 (26.3%) | 2 (8.7%) |
| 5 or more Vehicles | 0 (0.0%) | 0 (0.0%) |
| Total | 19 (100.0%) | 23 (100.0%) |
Commute Time in Kirbyville
The most frequently occuring commute durations in Kirbyville are 15 to 19 minutes (24 commuters, 57.1%), 10 to 14 minutes (8 commuters, 19.1%), and 5 to 9 minutes (3 commuters, 7.1%).
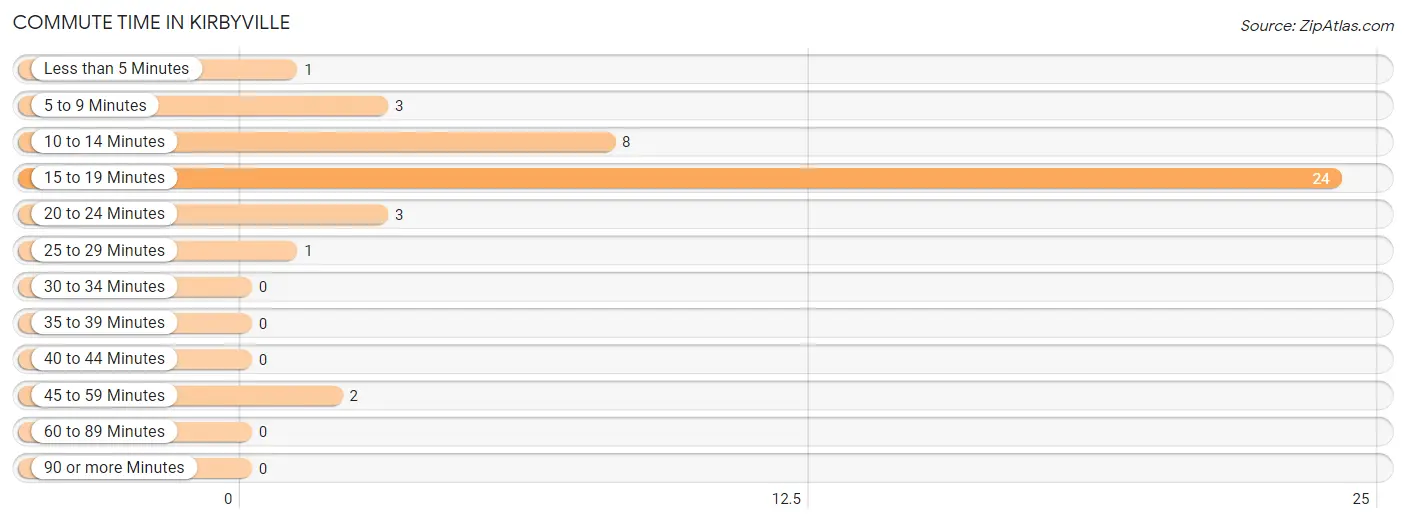
| Commute Time | # Commuters | % Commuters |
| Less than 5 Minutes | 1 | 2.4% |
| 5 to 9 Minutes | 3 | 7.1% |
| 10 to 14 Minutes | 8 | 19.1% |
| 15 to 19 Minutes | 24 | 57.1% |
| 20 to 24 Minutes | 3 | 7.1% |
| 25 to 29 Minutes | 1 | 2.4% |
| 30 to 34 Minutes | 0 | 0.0% |
| 35 to 39 Minutes | 0 | 0.0% |
| 40 to 44 Minutes | 0 | 0.0% |
| 45 to 59 Minutes | 2 | 4.8% |
| 60 to 89 Minutes | 0 | 0.0% |
| 90 or more Minutes | 0 | 0.0% |
Commute Time by Sex in Kirbyville
The most common commute times in Kirbyville are 15 to 19 minutes (10 commuters, 52.6%) for males and 15 to 19 minutes (14 commuters, 60.9%) for females.
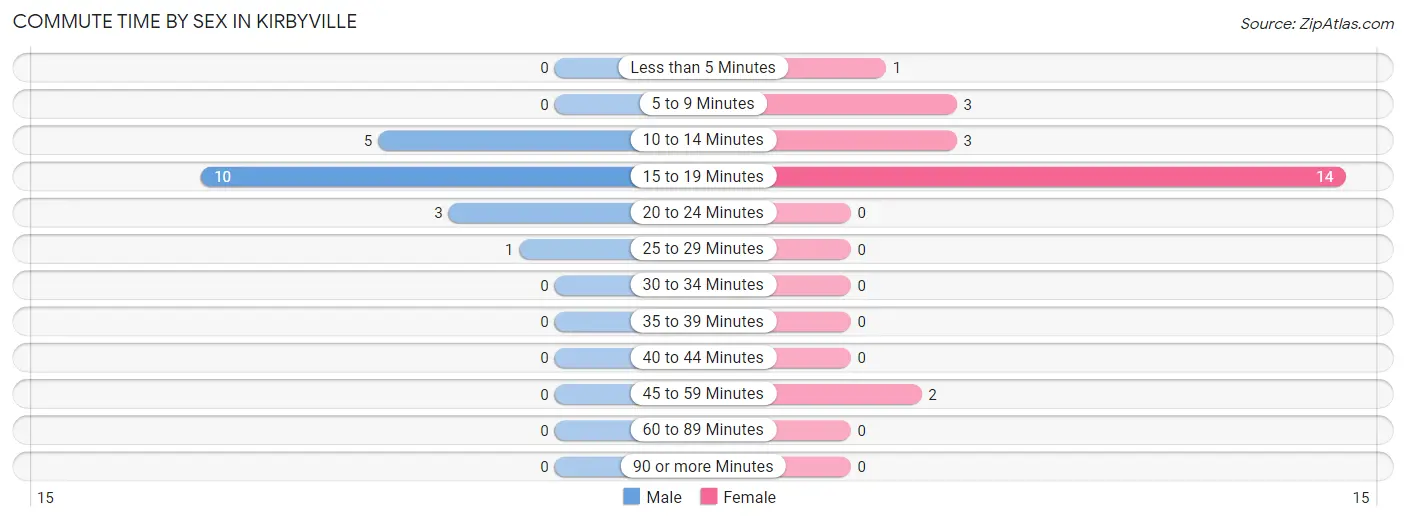
| Commute Time | Male | Female |
| Less than 5 Minutes | 0 (0.0%) | 1 (4.3%) |
| 5 to 9 Minutes | 0 (0.0%) | 3 (13.0%) |
| 10 to 14 Minutes | 5 (26.3%) | 3 (13.0%) |
| 15 to 19 Minutes | 10 (52.6%) | 14 (60.9%) |
| 20 to 24 Minutes | 3 (15.8%) | 0 (0.0%) |
| 25 to 29 Minutes | 1 (5.3%) | 0 (0.0%) |
| 30 to 34 Minutes | 0 (0.0%) | 0 (0.0%) |
| 35 to 39 Minutes | 0 (0.0%) | 0 (0.0%) |
| 40 to 44 Minutes | 0 (0.0%) | 0 (0.0%) |
| 45 to 59 Minutes | 0 (0.0%) | 2 (8.7%) |
| 60 to 89 Minutes | 0 (0.0%) | 0 (0.0%) |
| 90 or more Minutes | 0 (0.0%) | 0 (0.0%) |
Time of Departure to Work by Sex in Kirbyville
The most frequent times of departure to work in Kirbyville are 6:30 AM to 6:59 AM (6, 31.6%) for males and 7:30 AM to 7:59 AM (8, 34.8%) for females.
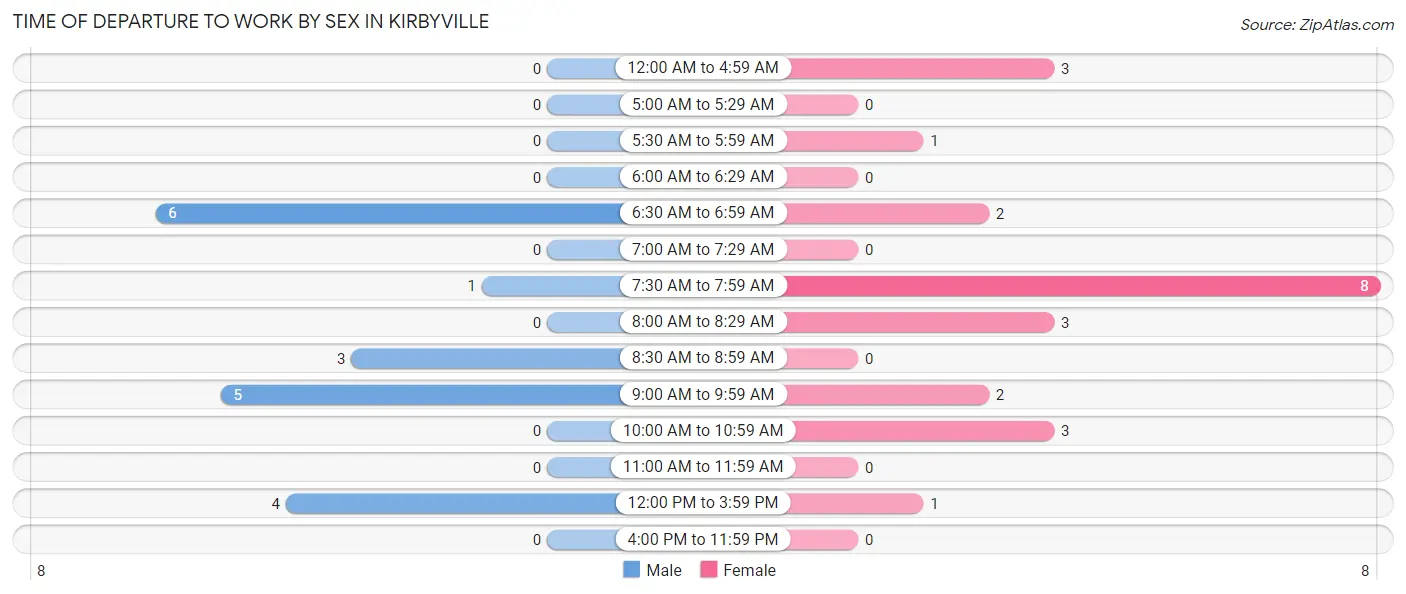
| Time of Departure | Male | Female |
| 12:00 AM to 4:59 AM | 0 (0.0%) | 3 (13.0%) |
| 5:00 AM to 5:29 AM | 0 (0.0%) | 0 (0.0%) |
| 5:30 AM to 5:59 AM | 0 (0.0%) | 1 (4.3%) |
| 6:00 AM to 6:29 AM | 0 (0.0%) | 0 (0.0%) |
| 6:30 AM to 6:59 AM | 6 (31.6%) | 2 (8.7%) |
| 7:00 AM to 7:29 AM | 0 (0.0%) | 0 (0.0%) |
| 7:30 AM to 7:59 AM | 1 (5.3%) | 8 (34.8%) |
| 8:00 AM to 8:29 AM | 0 (0.0%) | 3 (13.0%) |
| 8:30 AM to 8:59 AM | 3 (15.8%) | 0 (0.0%) |
| 9:00 AM to 9:59 AM | 5 (26.3%) | 2 (8.7%) |
| 10:00 AM to 10:59 AM | 0 (0.0%) | 3 (13.0%) |
| 11:00 AM to 11:59 AM | 0 (0.0%) | 0 (0.0%) |
| 12:00 PM to 3:59 PM | 4 (21.0%) | 1 (4.3%) |
| 4:00 PM to 11:59 PM | 0 (0.0%) | 0 (0.0%) |
| Total | 19 (100.0%) | 23 (100.0%) |
Housing Occupancy in Kirbyville
Occupancy by Ownership in Kirbyville
Of the total 42 dwellings in Kirbyville, owner-occupied units account for 30 (71.4%), while renter-occupied units make up 12 (28.6%).
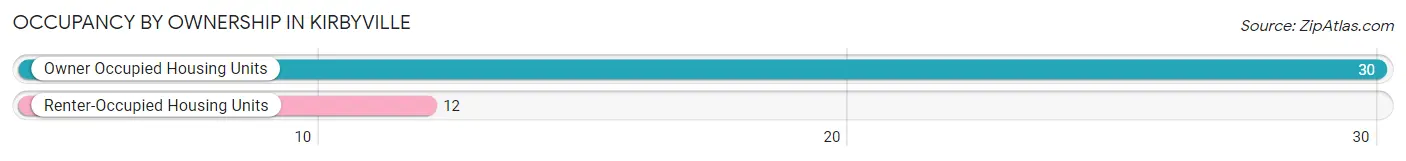
| Occupancy | # Housing Units | % Housing Units |
| Owner Occupied Housing Units | 30 | 71.4% |
| Renter-Occupied Housing Units | 12 | 28.6% |
| Total Occupied Housing Units | 42 | 100.0% |
Occupancy by Household Size in Kirbyville
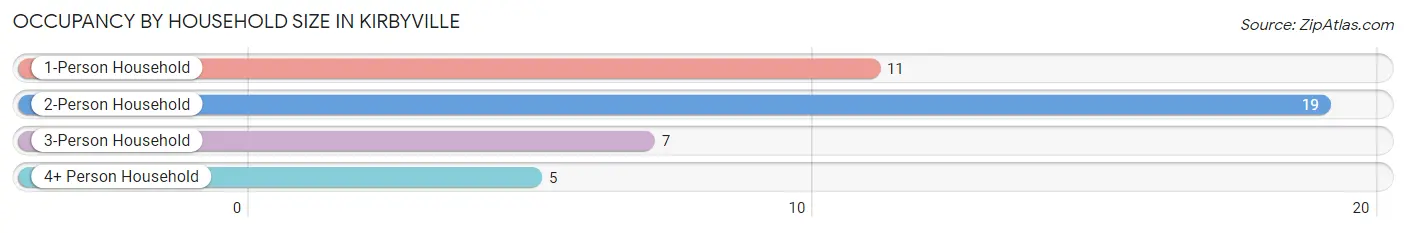
| Household Size | # Housing Units | % Housing Units |
| 1-Person Household | 11 | 26.2% |
| 2-Person Household | 19 | 45.2% |
| 3-Person Household | 7 | 16.7% |
| 4+ Person Household | 5 | 11.9% |
| Total Housing Units | 42 | 100.0% |
Occupancy by Ownership by Household Size in Kirbyville
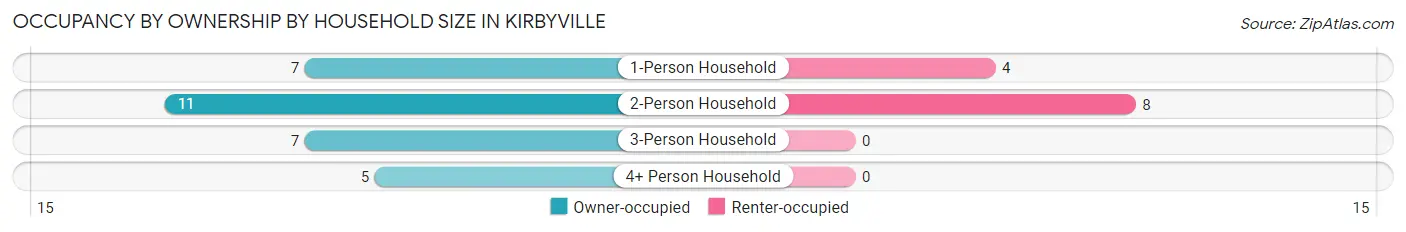
| Household Size | Owner-occupied | Renter-occupied |
| 1-Person Household | 7 (63.6%) | 4 (36.4%) |
| 2-Person Household | 11 (57.9%) | 8 (42.1%) |
| 3-Person Household | 7 (100.0%) | 0 (0.0%) |
| 4+ Person Household | 5 (100.0%) | 0 (0.0%) |
| Total Housing Units | 30 (71.4%) | 12 (28.6%) |
Occupancy by Educational Attainment in Kirbyville
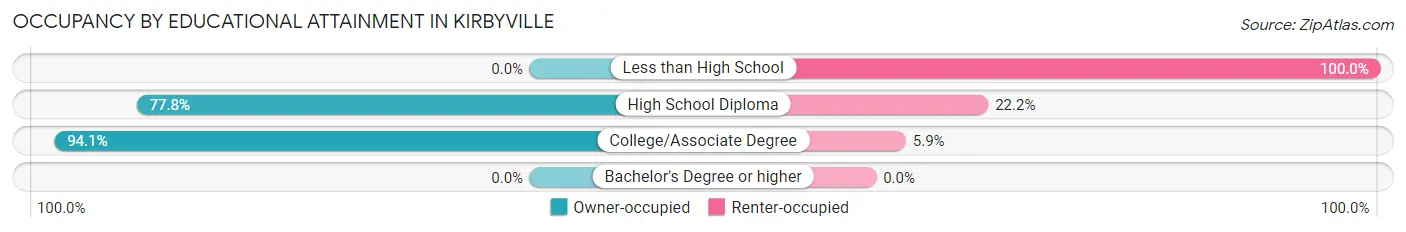
| Household Size | Owner-occupied | Renter-occupied |
| Less than High School | 0 (0.0%) | 7 (100.0%) |
| High School Diploma | 14 (77.8%) | 4 (22.2%) |
| College/Associate Degree | 16 (94.1%) | 1 (5.9%) |
| Bachelor's Degree or higher | 0 (0.0%) | 0 (0.0%) |
Occupancy by Age of Householder in Kirbyville
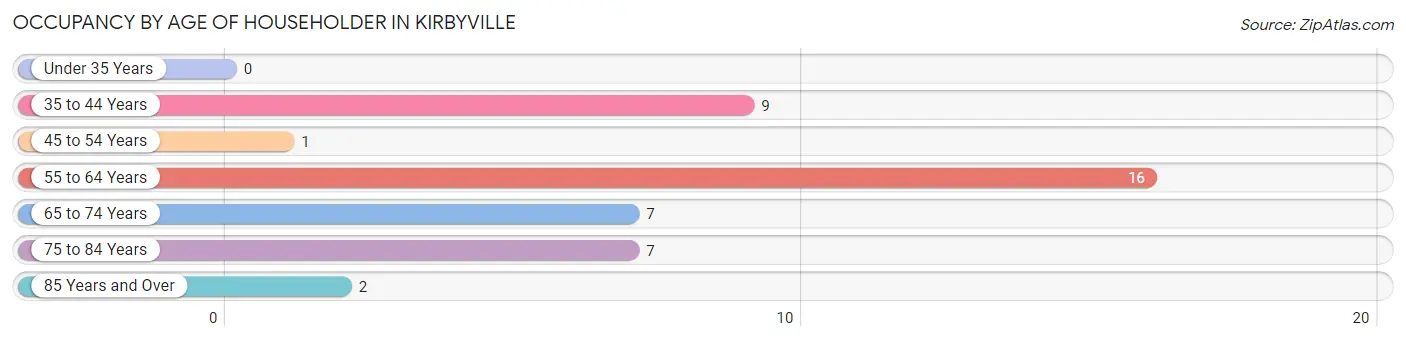
| Age Bracket | # Households | % Households |
| Under 35 Years | 0 | 0.0% |
| 35 to 44 Years | 9 | 21.4% |
| 45 to 54 Years | 1 | 2.4% |
| 55 to 64 Years | 16 | 38.1% |
| 65 to 74 Years | 7 | 16.7% |
| 75 to 84 Years | 7 | 16.7% |
| 85 Years and Over | 2 | 4.8% |
| Total | 42 | 100.0% |
Housing Finances in Kirbyville
Median Income by Occupancy in Kirbyville
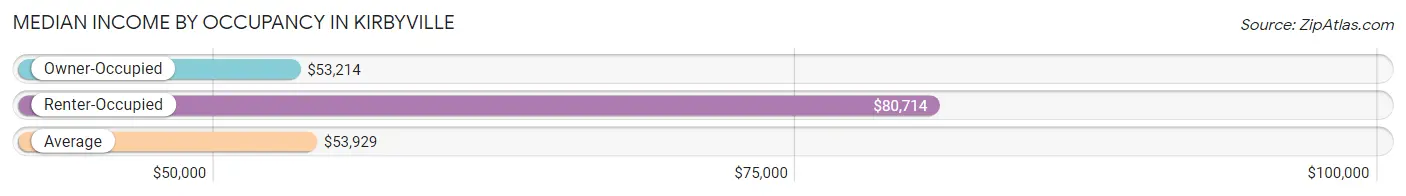
| Occupancy Type | # Households | Median Income |
| Owner-Occupied | 30 (71.4%) | $53,214 |
| Renter-Occupied | 12 (28.6%) | $80,714 |
| Average | 42 (100.0%) | $53,929 |
Occupancy by Householder Income Bracket in Kirbyville
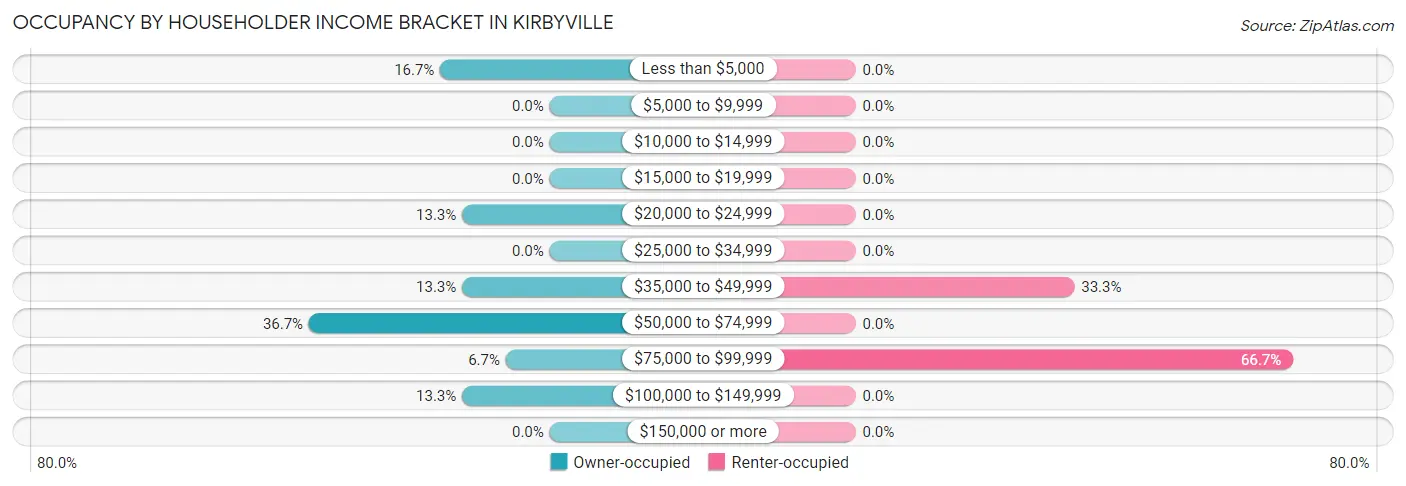
| Income Bracket | Owner-occupied | Renter-occupied |
| Less than $5,000 | 5 (16.7%) | 0 (0.0%) |
| $5,000 to $9,999 | 0 (0.0%) | 0 (0.0%) |
| $10,000 to $14,999 | 0 (0.0%) | 0 (0.0%) |
| $15,000 to $19,999 | 0 (0.0%) | 0 (0.0%) |
| $20,000 to $24,999 | 4 (13.3%) | 0 (0.0%) |
| $25,000 to $34,999 | 0 (0.0%) | 0 (0.0%) |
| $35,000 to $49,999 | 4 (13.3%) | 4 (33.3%) |
| $50,000 to $74,999 | 11 (36.7%) | 0 (0.0%) |
| $75,000 to $99,999 | 2 (6.7%) | 8 (66.7%) |
| $100,000 to $149,999 | 4 (13.3%) | 0 (0.0%) |
| $150,000 or more | 0 (0.0%) | 0 (0.0%) |
| Total | 30 (100.0%) | 12 (100.0%) |
Monthly Housing Cost Tiers in Kirbyville
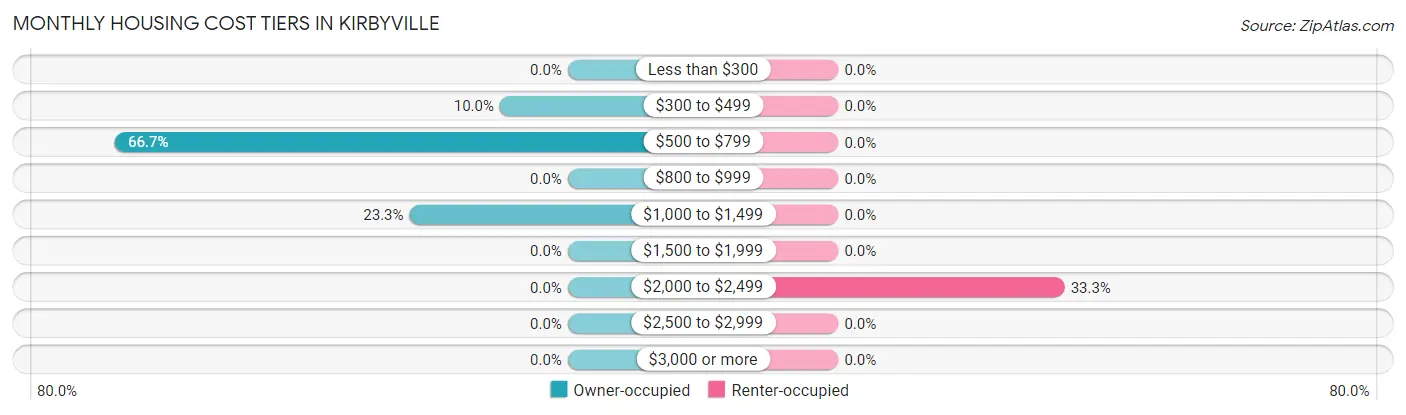
| Monthly Cost | Owner-occupied | Renter-occupied |
| Less than $300 | 0 (0.0%) | 0 (0.0%) |
| $300 to $499 | 3 (10.0%) | 0 (0.0%) |
| $500 to $799 | 20 (66.7%) | 0 (0.0%) |
| $800 to $999 | 0 (0.0%) | 0 (0.0%) |
| $1,000 to $1,499 | 7 (23.3%) | 0 (0.0%) |
| $1,500 to $1,999 | 0 (0.0%) | 0 (0.0%) |
| $2,000 to $2,499 | 0 (0.0%) | 4 (33.3%) |
| $2,500 to $2,999 | 0 (0.0%) | 0 (0.0%) |
| $3,000 or more | 0 (0.0%) | 0 (0.0%) |
| Total | 30 (100.0%) | 12 (100.0%) |
Physical Housing Characteristics in Kirbyville
Housing Structures in Kirbyville
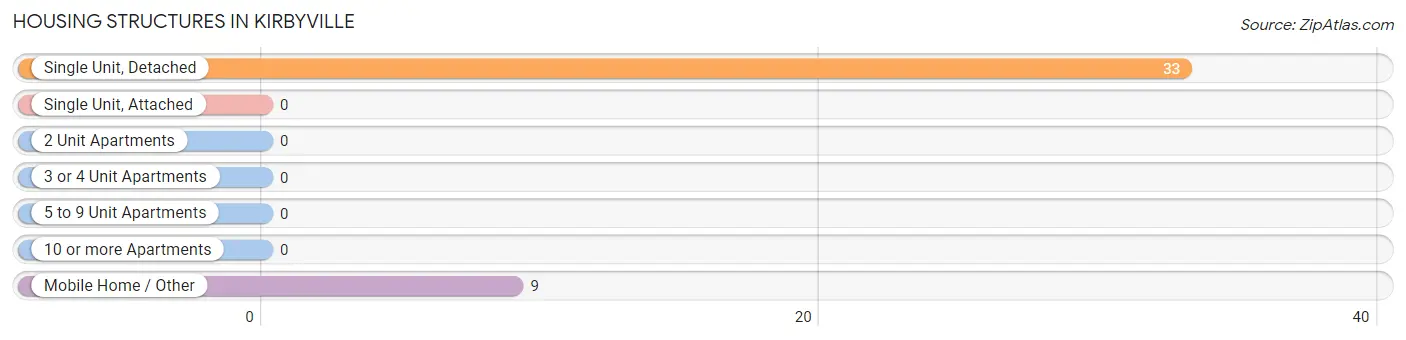
| Structure Type | # Housing Units | % Housing Units |
| Single Unit, Detached | 33 | 78.6% |
| Single Unit, Attached | 0 | 0.0% |
| 2 Unit Apartments | 0 | 0.0% |
| 3 or 4 Unit Apartments | 0 | 0.0% |
| 5 to 9 Unit Apartments | 0 | 0.0% |
| 10 or more Apartments | 0 | 0.0% |
| Mobile Home / Other | 9 | 21.4% |
| Total | 42 | 100.0% |
Housing Structures by Occupancy in Kirbyville
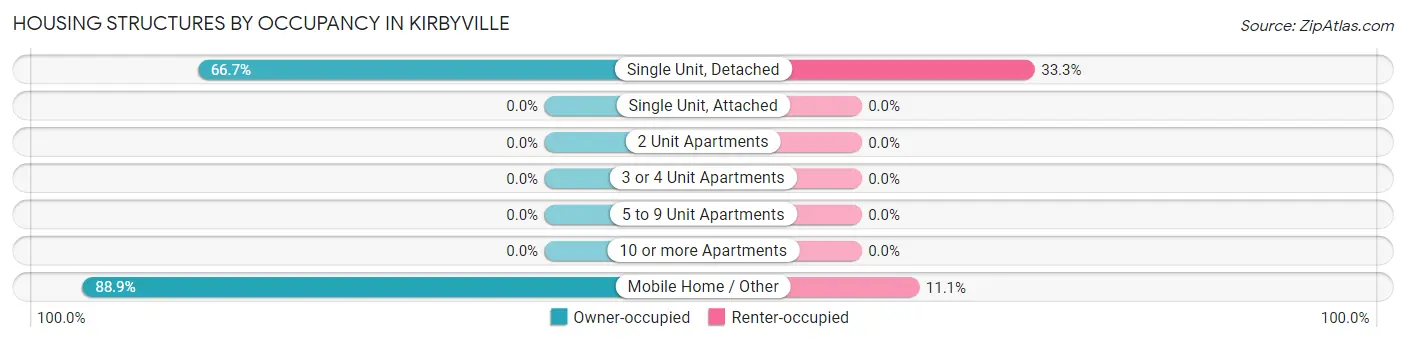
| Structure Type | Owner-occupied | Renter-occupied |
| Single Unit, Detached | 22 (66.7%) | 11 (33.3%) |
| Single Unit, Attached | 0 (0.0%) | 0 (0.0%) |
| 2 Unit Apartments | 0 (0.0%) | 0 (0.0%) |
| 3 or 4 Unit Apartments | 0 (0.0%) | 0 (0.0%) |
| 5 to 9 Unit Apartments | 0 (0.0%) | 0 (0.0%) |
| 10 or more Apartments | 0 (0.0%) | 0 (0.0%) |
| Mobile Home / Other | 8 (88.9%) | 1 (11.1%) |
| Total | 30 (71.4%) | 12 (28.6%) |
Housing Structures by Number of Rooms in Kirbyville
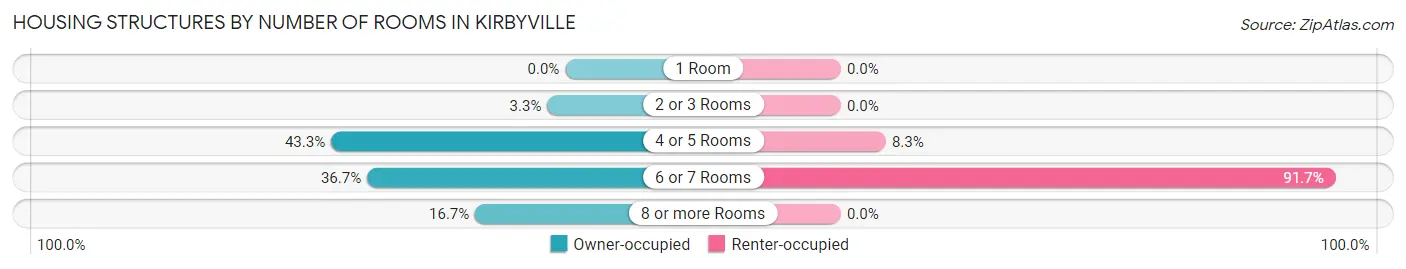
| Number of Rooms | Owner-occupied | Renter-occupied |
| 1 Room | 0 (0.0%) | 0 (0.0%) |
| 2 or 3 Rooms | 1 (3.3%) | 0 (0.0%) |
| 4 or 5 Rooms | 13 (43.3%) | 1 (8.3%) |
| 6 or 7 Rooms | 11 (36.7%) | 11 (91.7%) |
| 8 or more Rooms | 5 (16.7%) | 0 (0.0%) |
| Total | 30 (100.0%) | 12 (100.0%) |
Housing Structure by Heating Type in Kirbyville
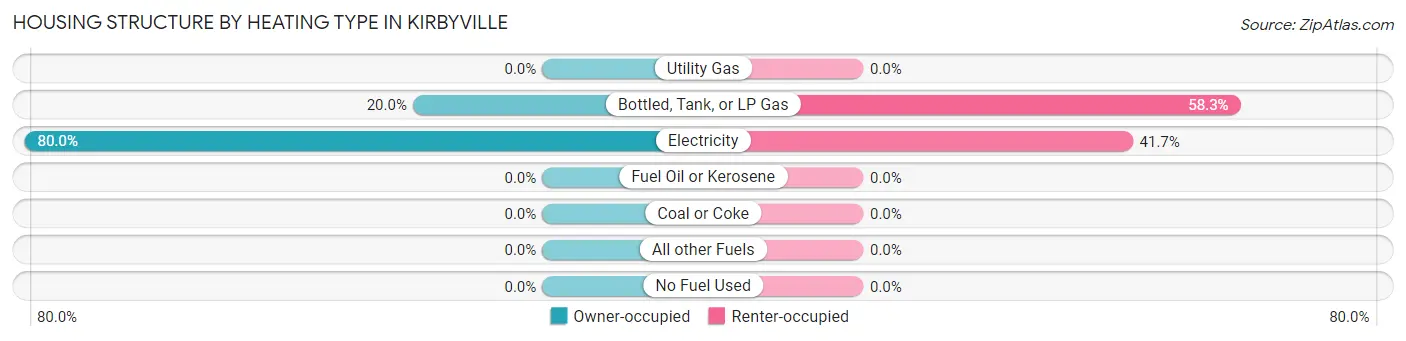
| Heating Type | Owner-occupied | Renter-occupied |
| Utility Gas | 0 (0.0%) | 0 (0.0%) |
| Bottled, Tank, or LP Gas | 6 (20.0%) | 7 (58.3%) |
| Electricity | 24 (80.0%) | 5 (41.7%) |
| Fuel Oil or Kerosene | 0 (0.0%) | 0 (0.0%) |
| Coal or Coke | 0 (0.0%) | 0 (0.0%) |
| All other Fuels | 0 (0.0%) | 0 (0.0%) |
| No Fuel Used | 0 (0.0%) | 0 (0.0%) |
| Total | 30 (100.0%) | 12 (100.0%) |
Household Vehicle Usage in Kirbyville
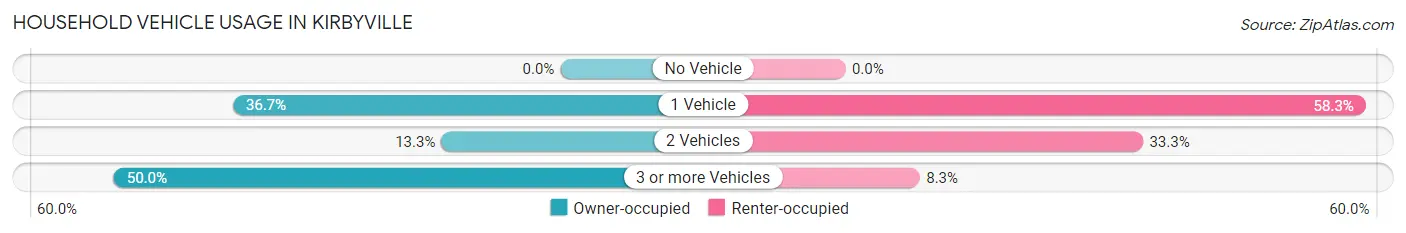
| Vehicles per Household | Owner-occupied | Renter-occupied |
| No Vehicle | 0 (0.0%) | 0 (0.0%) |
| 1 Vehicle | 11 (36.7%) | 7 (58.3%) |
| 2 Vehicles | 4 (13.3%) | 4 (33.3%) |
| 3 or more Vehicles | 15 (50.0%) | 1 (8.3%) |
| Total | 30 (100.0%) | 12 (100.0%) |
Real Estate & Mortgages in Kirbyville
Real Estate and Mortgage Overview in Kirbyville
| Characteristic | Without Mortgage | With Mortgage |
| Housing Units | 25 | 5 |
| Median Property Value | - | - |
| Median Household Income | $52,679 | $0 |
| Monthly Housing Costs | $664 | $0 |
| Real Estate Taxes | $871 | $0 |
Property Value by Mortgage Status in Kirbyville
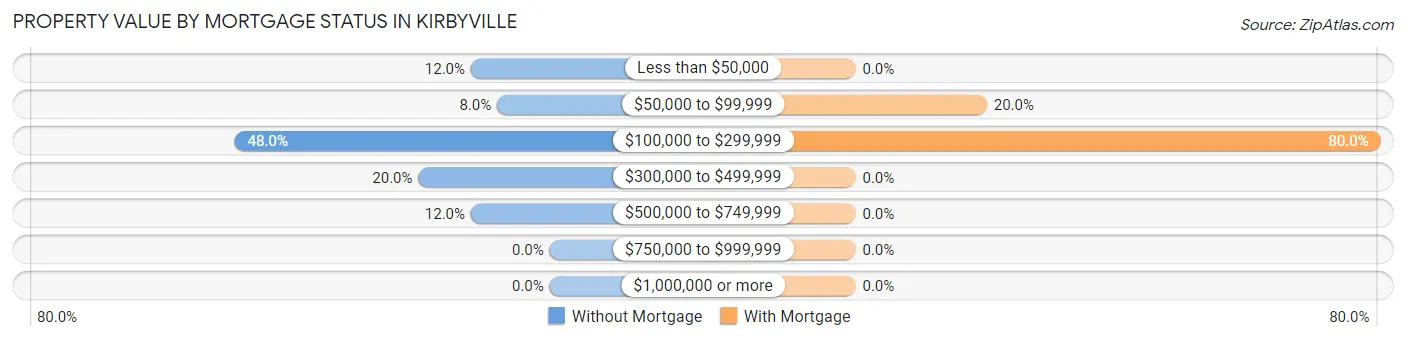
| Property Value | Without Mortgage | With Mortgage |
| Less than $50,000 | 3 (12.0%) | 0 (0.0%) |
| $50,000 to $99,999 | 2 (8.0%) | 1 (20.0%) |
| $100,000 to $299,999 | 12 (48.0%) | 4 (80.0%) |
| $300,000 to $499,999 | 5 (20.0%) | 0 (0.0%) |
| $500,000 to $749,999 | 3 (12.0%) | 0 (0.0%) |
| $750,000 to $999,999 | 0 (0.0%) | 0 (0.0%) |
| $1,000,000 or more | 0 (0.0%) | 0 (0.0%) |
| Total | 25 (100.0%) | 5 (100.0%) |
Household Income by Mortgage Status in Kirbyville
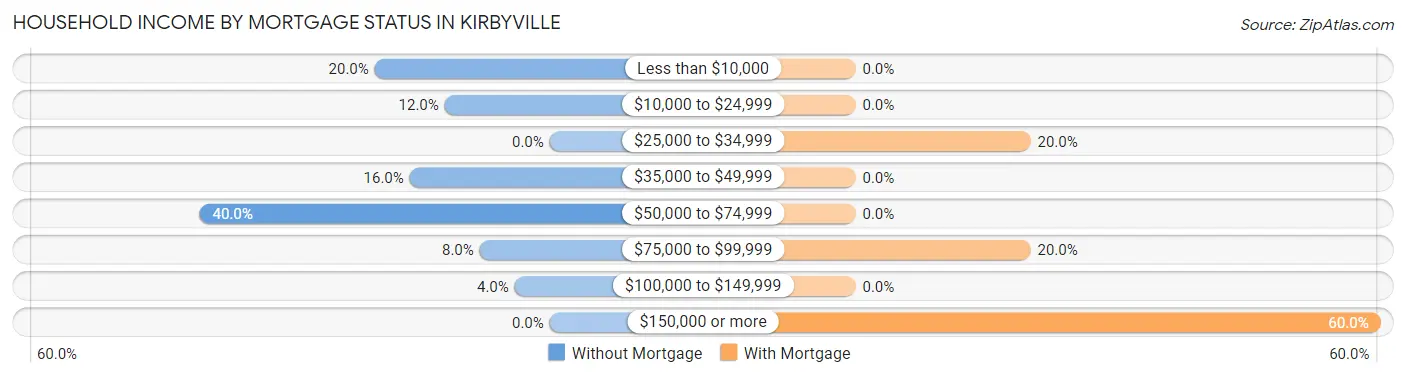
| Household Income | Without Mortgage | With Mortgage |
| Less than $10,000 | 5 (20.0%) | 0 (0.0%) |
| $10,000 to $24,999 | 3 (12.0%) | 0 (0.0%) |
| $25,000 to $34,999 | 0 (0.0%) | 1 (20.0%) |
| $35,000 to $49,999 | 4 (16.0%) | 0 (0.0%) |
| $50,000 to $74,999 | 10 (40.0%) | 0 (0.0%) |
| $75,000 to $99,999 | 2 (8.0%) | 1 (20.0%) |
| $100,000 to $149,999 | 1 (4.0%) | 0 (0.0%) |
| $150,000 or more | 0 (0.0%) | 3 (60.0%) |
| Total | 25 (100.0%) | 5 (100.0%) |
Property Value to Household Income Ratio in Kirbyville
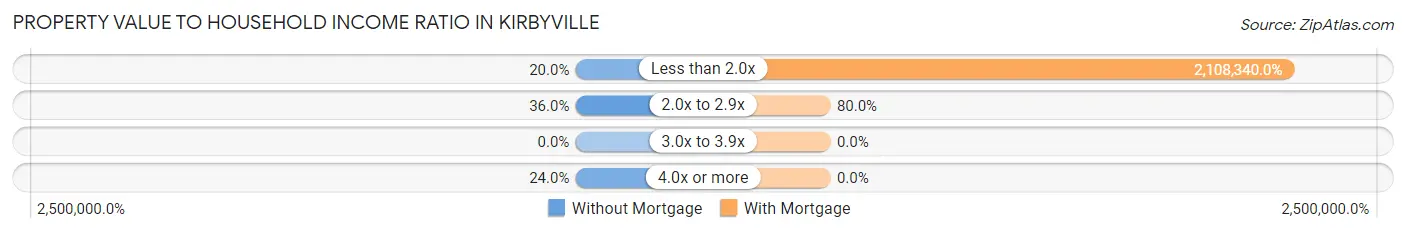
| Value-to-Income Ratio | Without Mortgage | With Mortgage |
| Less than 2.0x | 5 (20.0%) | 105,417 (2,108,340.0%) |
| 2.0x to 2.9x | 9 (36.0%) | 4 (80.0%) |
| 3.0x to 3.9x | 0 (0.0%) | 0 (0.0%) |
| 4.0x or more | 6 (24.0%) | 0 (0.0%) |
| Total | 25 (100.0%) | 5 (100.0%) |
Real Estate Taxes by Mortgage Status in Kirbyville
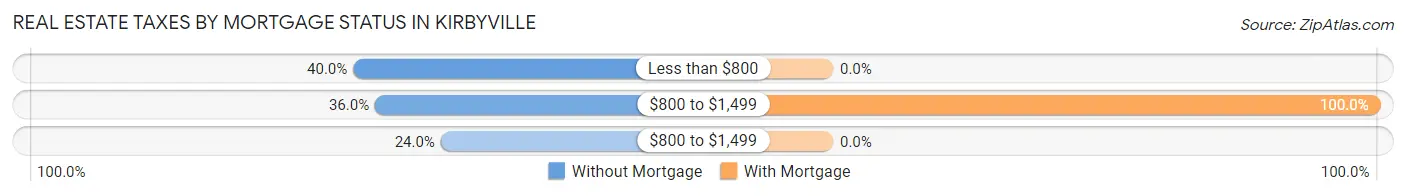
| Property Taxes | Without Mortgage | With Mortgage |
| Less than $800 | 10 (40.0%) | 0 (0.0%) |
| $800 to $1,499 | 9 (36.0%) | 5 (100.0%) |
| $800 to $1,499 | 6 (24.0%) | 0 (0.0%) |
| Total | 25 (100.0%) | 5 (100.0%) |
Health & Disability in Kirbyville
Health Insurance Coverage by Age in Kirbyville
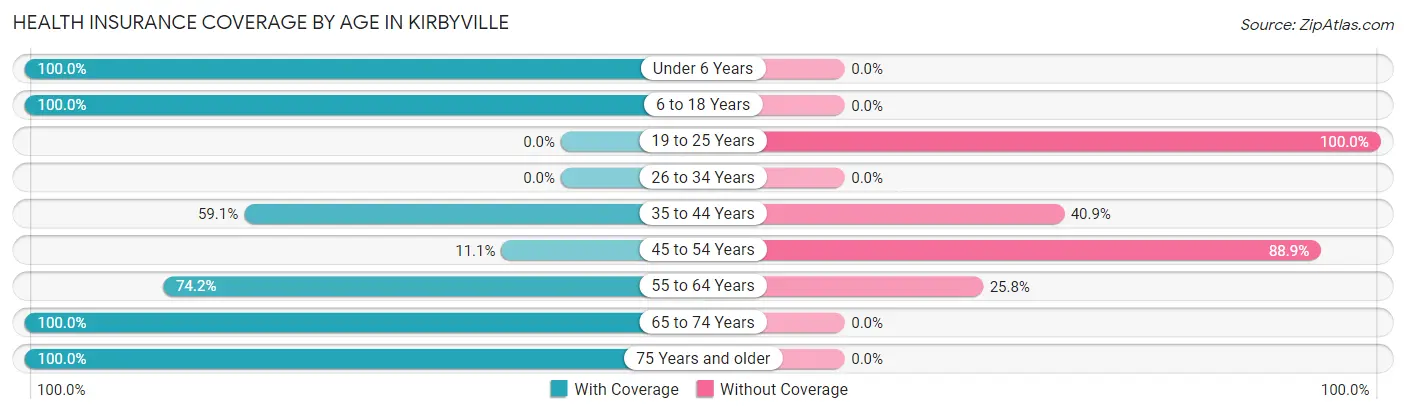
| Age Bracket | With Coverage | Without Coverage |
| Under 6 Years | 5 (100.0%) | 0 (0.0%) |
| 6 to 18 Years | 10 (100.0%) | 0 (0.0%) |
| 19 to 25 Years | 0 (0.0%) | 12 (100.0%) |
| 26 to 34 Years | 0 (0.0%) | 0 (0.0%) |
| 35 to 44 Years | 13 (59.1%) | 9 (40.9%) |
| 45 to 54 Years | 1 (11.1%) | 8 (88.9%) |
| 55 to 64 Years | 23 (74.2%) | 8 (25.8%) |
| 65 to 74 Years | 10 (100.0%) | 0 (0.0%) |
| 75 Years and older | 10 (100.0%) | 0 (0.0%) |
| Total | 72 (66.1%) | 37 (33.9%) |
Health Insurance Coverage by Citizenship Status in Kirbyville
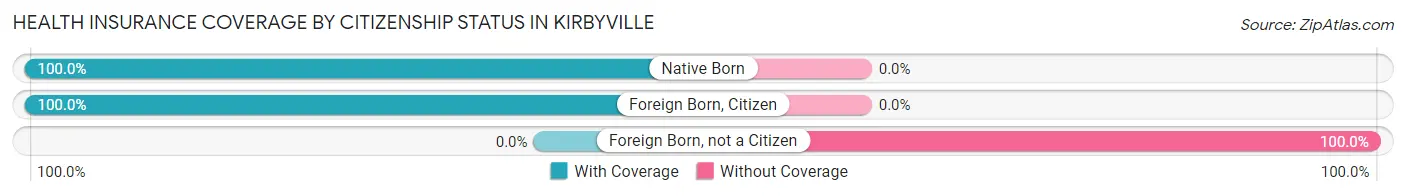
| Citizenship Status | With Coverage | Without Coverage |
| Native Born | 5 (100.0%) | 0 (0.0%) |
| Foreign Born, Citizen | 10 (100.0%) | 0 (0.0%) |
| Foreign Born, not a Citizen | 0 (0.0%) | 12 (100.0%) |
Health Insurance Coverage by Household Income in Kirbyville
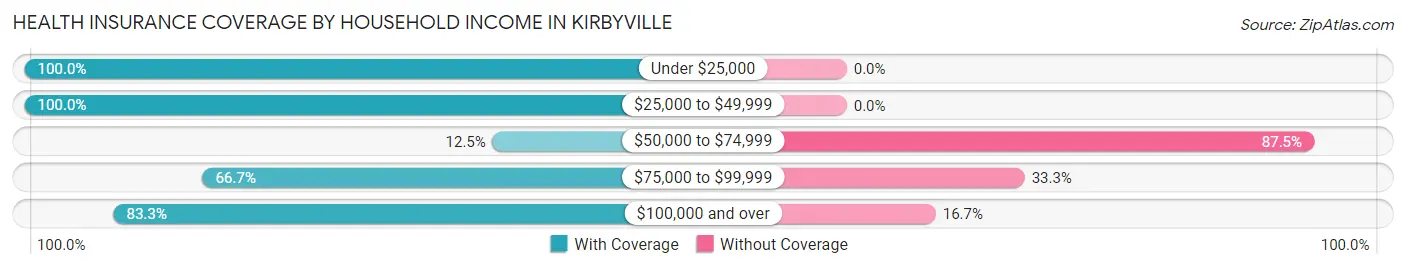
| Household Income | With Coverage | Without Coverage |
| Under $25,000 | 16 (100.0%) | 0 (0.0%) |
| $25,000 to $49,999 | 25 (100.0%) | 0 (0.0%) |
| $50,000 to $74,999 | 4 (12.5%) | 28 (87.5%) |
| $75,000 to $99,999 | 12 (66.7%) | 6 (33.3%) |
| $100,000 and over | 15 (83.3%) | 3 (16.7%) |
Public vs Private Health Insurance Coverage by Age in Kirbyville
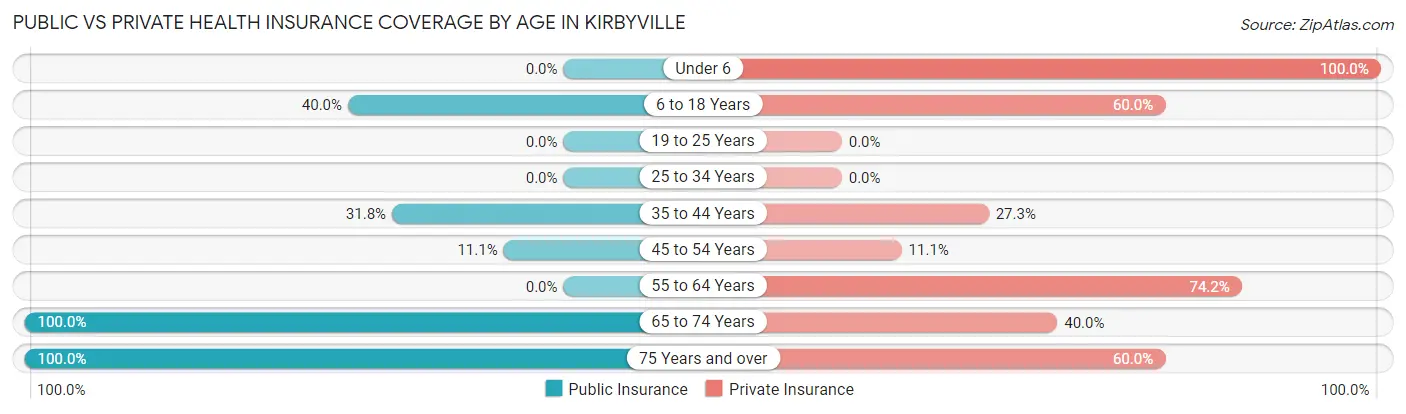
| Age Bracket | Public Insurance | Private Insurance |
| Under 6 | 0 (0.0%) | 5 (100.0%) |
| 6 to 18 Years | 4 (40.0%) | 6 (60.0%) |
| 19 to 25 Years | 0 (0.0%) | 0 (0.0%) |
| 25 to 34 Years | 0 (0.0%) | 0 (0.0%) |
| 35 to 44 Years | 7 (31.8%) | 6 (27.3%) |
| 45 to 54 Years | 1 (11.1%) | 1 (11.1%) |
| 55 to 64 Years | 0 (0.0%) | 23 (74.2%) |
| 65 to 74 Years | 10 (100.0%) | 4 (40.0%) |
| 75 Years and over | 10 (100.0%) | 6 (60.0%) |
| Total | 32 (29.4%) | 51 (46.8%) |
Disability Status by Sex by Age in Kirbyville
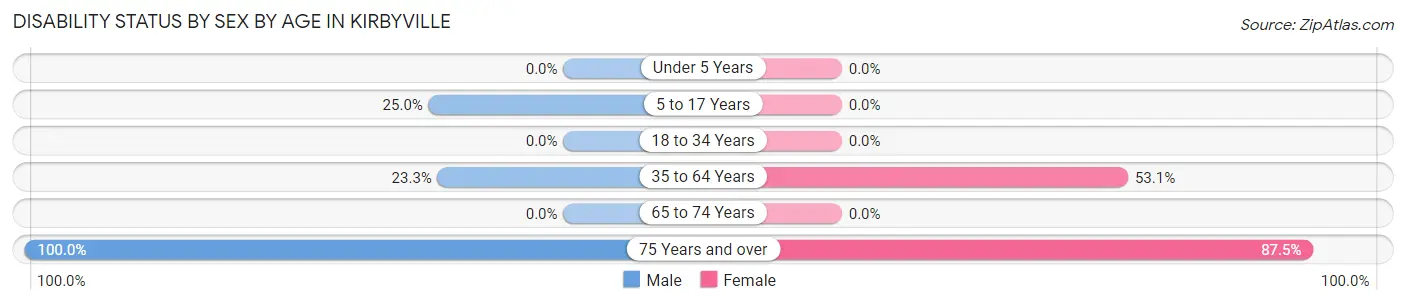
| Age Bracket | Male | Female |
| Under 5 Years | 0 (0.0%) | 0 (0.0%) |
| 5 to 17 Years | 2 (25.0%) | 0 (0.0%) |
| 18 to 34 Years | 0 (0.0%) | 0 (0.0%) |
| 35 to 64 Years | 7 (23.3%) | 17 (53.1%) |
| 65 to 74 Years | 0 (0.0%) | 0 (0.0%) |
| 75 Years and over | 2 (100.0%) | 7 (87.5%) |
Disability Class by Sex by Age in Kirbyville
Disability Class: Hearing Difficulty
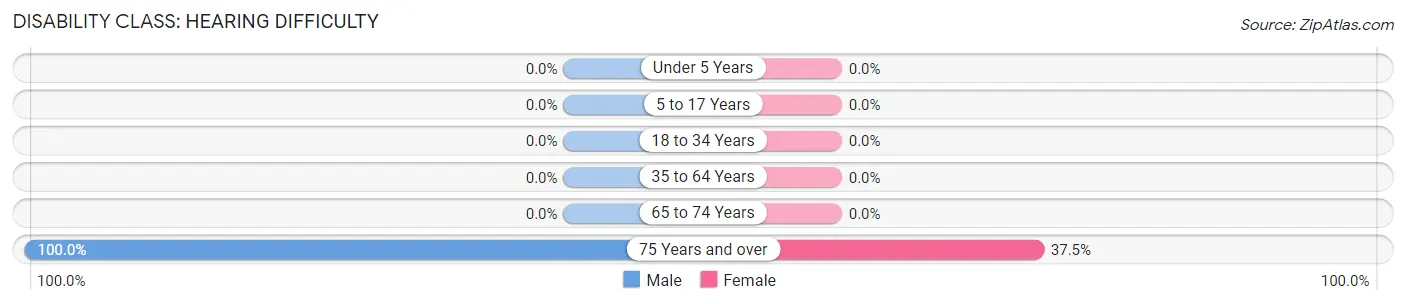
| Age Bracket | Male | Female |
| Under 5 Years | 0 (0.0%) | 0 (0.0%) |
| 5 to 17 Years | 0 (0.0%) | 0 (0.0%) |
| 18 to 34 Years | 0 (0.0%) | 0 (0.0%) |
| 35 to 64 Years | 0 (0.0%) | 0 (0.0%) |
| 65 to 74 Years | 0 (0.0%) | 0 (0.0%) |
| 75 Years and over | 2 (100.0%) | 3 (37.5%) |
Disability Class: Vision Difficulty
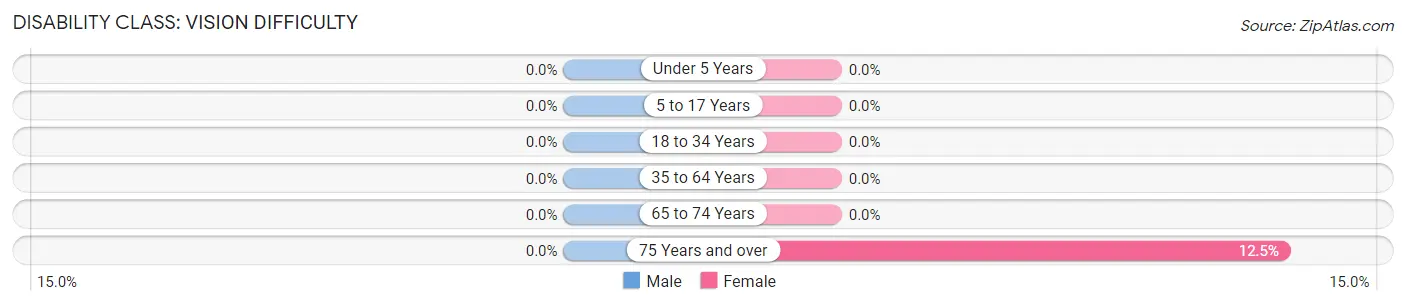
| Age Bracket | Male | Female |
| Under 5 Years | 0 (0.0%) | 0 (0.0%) |
| 5 to 17 Years | 0 (0.0%) | 0 (0.0%) |
| 18 to 34 Years | 0 (0.0%) | 0 (0.0%) |
| 35 to 64 Years | 0 (0.0%) | 0 (0.0%) |
| 65 to 74 Years | 0 (0.0%) | 0 (0.0%) |
| 75 Years and over | 0 (0.0%) | 1 (12.5%) |
Disability Class: Cognitive Difficulty
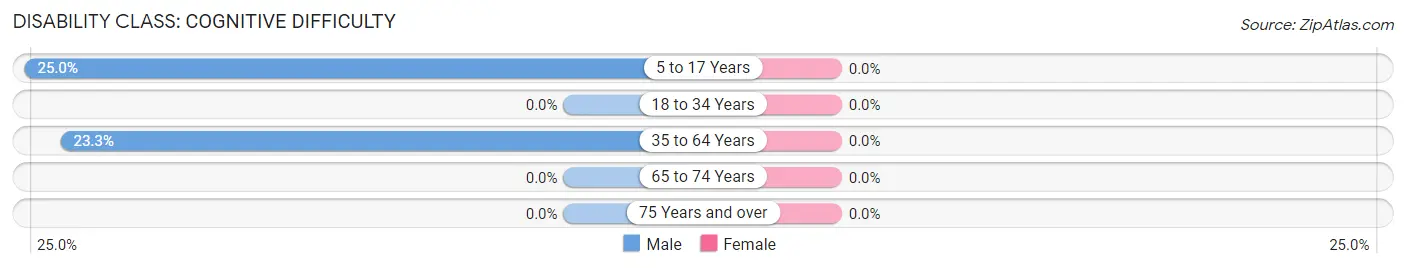
| Age Bracket | Male | Female |
| 5 to 17 Years | 2 (25.0%) | 0 (0.0%) |
| 18 to 34 Years | 0 (0.0%) | 0 (0.0%) |
| 35 to 64 Years | 7 (23.3%) | 0 (0.0%) |
| 65 to 74 Years | 0 (0.0%) | 0 (0.0%) |
| 75 Years and over | 0 (0.0%) | 0 (0.0%) |
Disability Class: Ambulatory Difficulty
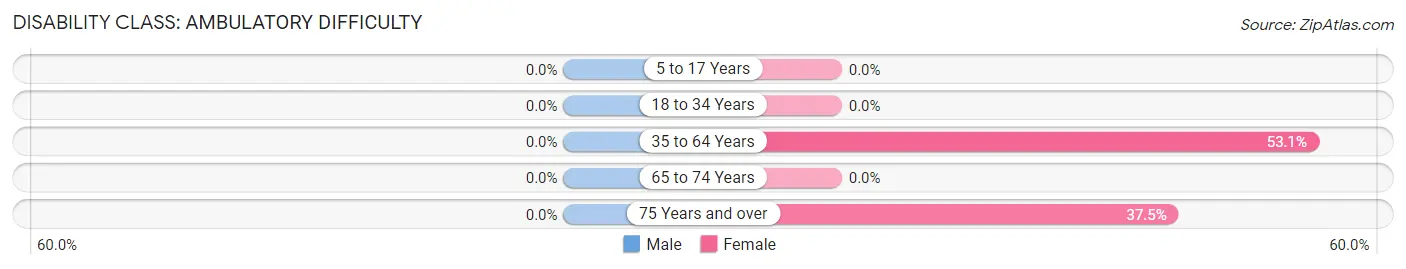
| Age Bracket | Male | Female |
| 5 to 17 Years | 0 (0.0%) | 0 (0.0%) |
| 18 to 34 Years | 0 (0.0%) | 0 (0.0%) |
| 35 to 64 Years | 0 (0.0%) | 17 (53.1%) |
| 65 to 74 Years | 0 (0.0%) | 0 (0.0%) |
| 75 Years and over | 0 (0.0%) | 3 (37.5%) |
Disability Class: Self-Care Difficulty
| Age Bracket | Male | Female |
| 5 to 17 Years | 0 (0.0%) | 0 (0.0%) |
| 18 to 34 Years | 0 (0.0%) | 0 (0.0%) |
| 35 to 64 Years | 0 (0.0%) | 0 (0.0%) |
| 65 to 74 Years | 0 (0.0%) | 0 (0.0%) |
| 75 Years and over | 0 (0.0%) | 1 (12.5%) |
Technology Access in Kirbyville
Computing Device Access in Kirbyville
| Device Type | # Households | % Households |
| Desktop or Laptop | 25 | 59.5% |
| Smartphone | 38 | 90.5% |
| Tablet | 22 | 52.4% |
| No Computing Device | 2 | 4.8% |
| Total | 42 | 100.0% |
Internet Access in Kirbyville
| Internet Type | # Households | % Households |
| Dial-Up Internet | 0 | 0.0% |
| Broadband Home | 23 | 54.8% |
| Cellular Data Only | 9 | 21.4% |
| Satellite Internet | 10 | 23.8% |
| No Internet | 3 | 7.1% |
| Total | 42 | 100.0% |
Kirbyville Summary
Kirbyville is a small town located in Taney County, Missouri, United States. It is situated in the Ozark Mountains, approximately 20 miles south of Branson. The town was founded in 1883 and named after William Kirby, a local landowner. As of the 2010 census, the population of Kirbyville was 1,092.
Geography
Kirbyville is located at 36°37'25"N 93°7'17"W (36.623607, -93.121445). It is situated in the Ozark Mountains, approximately 20 miles south of Branson. The town is located on the banks of the White River, which flows through the area. The town is surrounded by rolling hills and forests, and is home to several small lakes.
The climate in Kirbyville is humid subtropical, with hot, humid summers and mild winters. The average annual temperature is 57°F (14°C), and the average annual precipitation is 44 inches (112 cm).
Demographics
As of the 2010 census, the population of Kirbyville was 1,092. The racial makeup of the town was 97.2% White, 0.7% African American, 0.3% Native American, 0.2% Asian, 0.1% Pacific Islander, 0.3% from other races, and 1.3% from two or more races. Hispanic or Latino of any race were 1.3% of the population.
The median income for a household in Kirbyville was $30,938, and the median income for a family was $37,500. Males had a median income of $27,500 versus $20,000 for females. The per capita income for the town was $15,945. About 11.2% of families and 14.2% of the population were below the poverty line, including 18.2% of those under age 18 and 8.3% of those age 65 or over.
Economy
Kirbyville is a small, rural town with a primarily agricultural economy. The town is home to several small businesses, including a grocery store, a hardware store, and a few restaurants. The town is also home to several small manufacturing companies, including a furniture factory and a woodworking shop.
The town is also home to several tourist attractions, including the White River Valley Museum, the Kirbyville Historical Society, and the Kirbyville Nature Center. The town is also home to several outdoor recreation areas, including the White River National Wildlife Refuge and the Mark Twain National Forest.
History
Kirbyville was founded in 1883 and named after William Kirby, a local landowner. The town was originally a small farming community, but grew rapidly in the early 20th century due to the timber industry. The town was also home to several small manufacturing companies, including a furniture factory and a woodworking shop.
In the 1950s, the town began to decline as the timber industry declined and the population began to move away. The town was revitalized in the late 1970s when the White River Valley Museum was established. The museum has since become a popular tourist attraction, and has helped to bring new life to the town.
Today, Kirbyville is a small, rural town with a primarily agricultural economy. The town is home to several small businesses, including a grocery store, a hardware store, and a few restaurants. The town is also home to several tourist attractions, including the White River Valley Museum, the Kirbyville Historical Society, and the Kirbyville Nature Center. The town is also home to several outdoor recreation areas, including the White River National Wildlife Refuge and the Mark Twain National Forest.
Common Questions
What is Per Capita Income in Kirbyville?
Per Capita income in Kirbyville is $24,718.
What is the Median Family Income in Kirbyville?
Median Family Income in Kirbyville is $54,107.
What is the Median Household income in Kirbyville?
Median Household Income in Kirbyville is $53,929.
What is Income or Wage Gap in Kirbyville?
Income or Wage Gap in Kirbyville is 51.9%.
Women in Kirbyville earn 48.1 cents for every dollar earned by a man.
What is Inequality or Gini Index in Kirbyville?
Inequality or Gini Index in Kirbyville is 0.33.
What is the Total Population of Kirbyville?
Total Population of Kirbyville is 109.
What is the Total Male Population of Kirbyville?
Total Male Population of Kirbyville is 67.
What is the Total Female Population of Kirbyville?
Total Female Population of Kirbyville is 42.
What is the Ratio of Males per 100 Females in Kirbyville?
There are 159.52 Males per 100 Females in Kirbyville.
What is the Ratio of Females per 100 Males in Kirbyville?
There are 62.69 Females per 100 Males in Kirbyville.
What is the Median Population Age in Kirbyville?
Median Population Age in Kirbyville is 48.6 Years.
What is the Average Family Size in Kirbyville
Average Family Size in Kirbyville is 3.1 People.
What is the Average Household Size in Kirbyville
Average Household Size in Kirbyville is 2.6 People.
How Large is the Labor Force in Kirbyville?
There are 42 People in the Labor Forcein in Kirbyville.
What is the Percentage of People in the Labor Force in Kirbyville?
44.7% of People are in the Labor Force in Kirbyville.