Jennings, LA Map & Demographics
Jennings Map
Jennings Overview
$26,074
PER CAPITA INCOME
$60,731
AVG FAMILY INCOME
$39,888
AVG HOUSEHOLD INCOME
50.0%
WAGE / INCOME GAP [ % ]
50.0¢/ $1
WAGE / INCOME GAP [ $ ]
$11,474
FAMILY INCOME DEFICIT
0.50
INEQUALITY / GINI INDEX
9,819
TOTAL POPULATION
4,722
MALE POPULATION
5,097
FEMALE POPULATION
92.64
MALES / 100 FEMALES
107.94
FEMALES / 100 MALES
37.1
MEDIAN AGE
2.9
AVG FAMILY SIZE
2.3
AVG HOUSEHOLD SIZE
3,690
LABOR FORCE [ PEOPLE ]
49.3%
PERCENT IN LABOR FORCE
5.1%
UNEMPLOYMENT RATE
Jennings Zip Codes
Jennings Area Codes
Income in Jennings
Income Overview in Jennings
Per Capita Income in Jennings is $26,074, while median incomes of families and households are $60,731 and $39,888 respectively.
| Characteristic | Number | Measure |
| Per Capita Income | 9,819 | $26,074 |
| Median Family Income | 2,529 | $60,731 |
| Mean Family Income | 2,529 | $78,953 |
| Median Household Income | 4,040 | $39,888 |
| Mean Household Income | 4,040 | $62,566 |
| Income Deficit | 2,529 | $11,474 |
| Wage / Income Gap (%) | 9,819 | 50.01% |
| Wage / Income Gap ($) | 9,819 | 49.99¢ per $1 |
| Gini / Inequality Index | 9,819 | 0.50 |
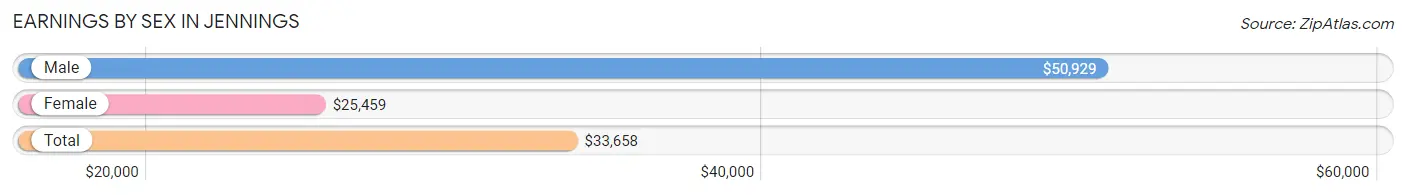
Earnings by Sex in Jennings
Average Earnings in Jennings are $33,658, $50,929 for men and $25,459 for women, a difference of 50.0%.
| Sex | Number | Average Earnings |
| Male | 1,948 (52.8%) | $50,929 |
| Female | 1,743 (47.2%) | $25,459 |
| Total | 3,691 (100.0%) | $33,658 |
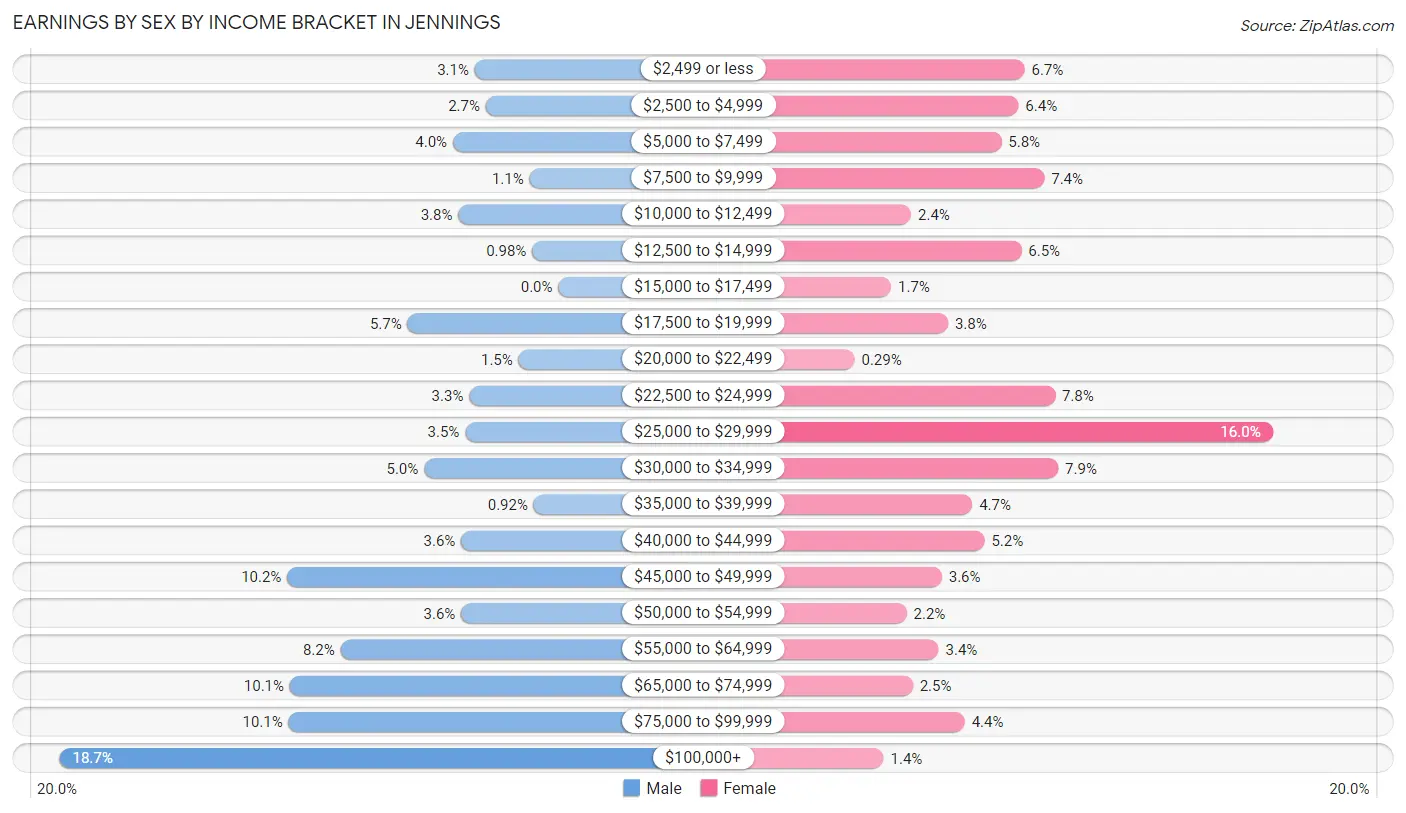
Earnings by Sex by Income Bracket in Jennings
The most common earnings brackets in Jennings are $100,000+ for men (364 | 18.7%) and $25,000 to $29,999 for women (278 | 16.0%).
| Income | Male | Female |
| $2,499 or less | 61 (3.1%) | 116 (6.7%) |
| $2,500 to $4,999 | 53 (2.7%) | 112 (6.4%) |
| $5,000 to $7,499 | 77 (4.0%) | 101 (5.8%) |
| $7,500 to $9,999 | 21 (1.1%) | 129 (7.4%) |
| $10,000 to $12,499 | 73 (3.7%) | 42 (2.4%) |
| $12,500 to $14,999 | 19 (1.0%) | 114 (6.5%) |
| $15,000 to $17,499 | 0 (0.0%) | 29 (1.7%) |
| $17,500 to $19,999 | 110 (5.7%) | 66 (3.8%) |
| $20,000 to $22,499 | 29 (1.5%) | 5 (0.3%) |
| $22,500 to $24,999 | 65 (3.3%) | 136 (7.8%) |
| $25,000 to $29,999 | 68 (3.5%) | 278 (16.0%) |
| $30,000 to $34,999 | 98 (5.0%) | 138 (7.9%) |
| $35,000 to $39,999 | 18 (0.9%) | 82 (4.7%) |
| $40,000 to $44,999 | 71 (3.6%) | 90 (5.2%) |
| $45,000 to $49,999 | 198 (10.2%) | 62 (3.6%) |
| $50,000 to $54,999 | 71 (3.6%) | 39 (2.2%) |
| $55,000 to $64,999 | 159 (8.2%) | 60 (3.4%) |
| $65,000 to $74,999 | 196 (10.1%) | 43 (2.5%) |
| $75,000 to $99,999 | 197 (10.1%) | 77 (4.4%) |
| $100,000+ | 364 (18.7%) | 24 (1.4%) |
| Total | 1,948 (100.0%) | 1,743 (100.0%) |
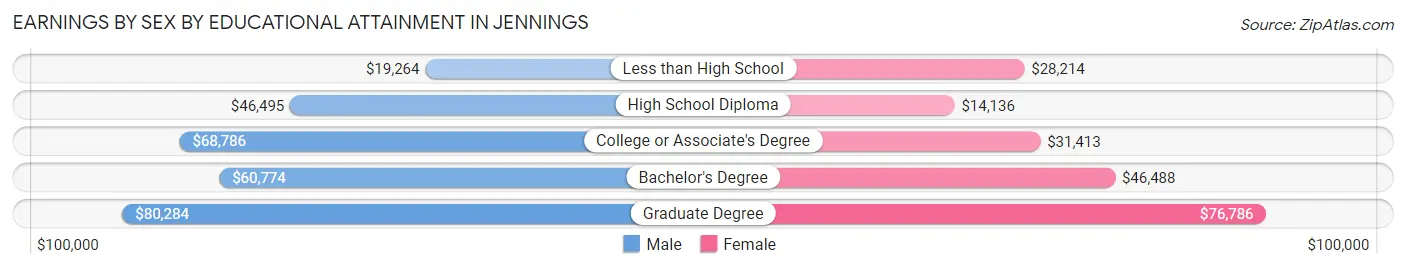
Earnings by Sex by Educational Attainment in Jennings
Average earnings in Jennings are $55,328 for men and $27,950 for women, a difference of 49.5%. Men with an educational attainment of graduate degree enjoy the highest average annual earnings of $80,284, while those with less than high school education earn the least with $19,264. Women with an educational attainment of graduate degree earn the most with the average annual earnings of $76,786, while those with high school diploma education have the smallest earnings of $14,136.
| Educational Attainment | Male Income | Female Income |
| Less than High School | $19,264 | $28,214 |
| High School Diploma | $46,495 | $14,136 |
| College or Associate's Degree | $68,786 | $31,413 |
| Bachelor's Degree | $60,774 | $46,488 |
| Graduate Degree | $80,284 | $76,786 |
| Total | $55,328 | $27,950 |
Family Income in Jennings
Family Income Brackets in Jennings
According to the Jennings family income data, there are 541 families falling into the $100,000 to $149,999 income range, which is the most common income bracket and makes up 21.4% of all families. Conversely, the $10,000 to $14,999 income bracket is the least frequent group with only 109 families (4.3%) belonging to this category.
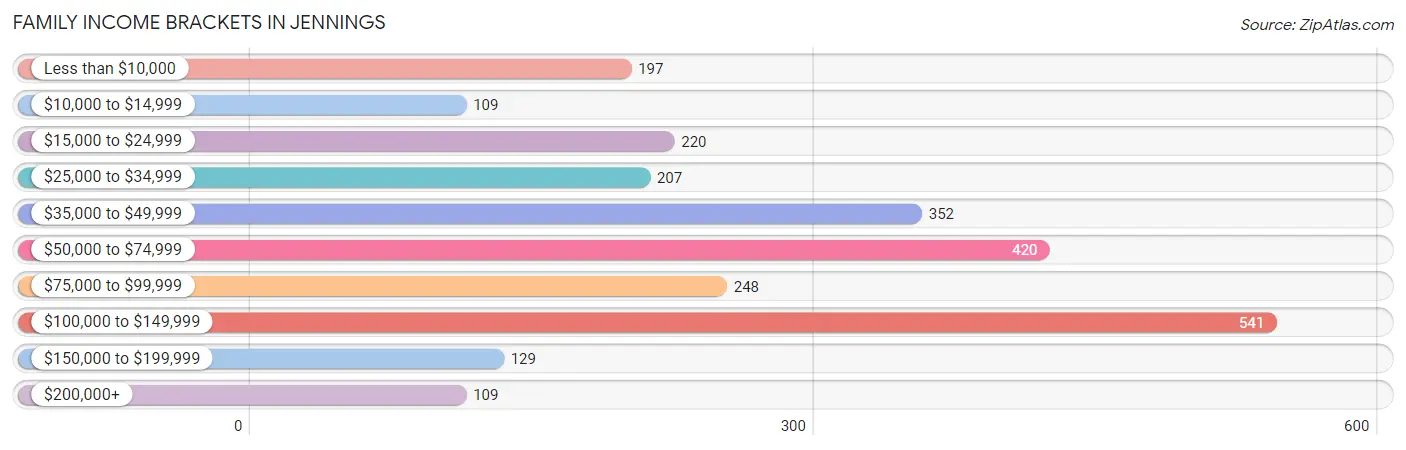
| Income Bracket | # Families | % Families |
| Less than $10,000 | 197 | 7.8% |
| $10,000 to $14,999 | 109 | 4.3% |
| $15,000 to $24,999 | 220 | 8.7% |
| $25,000 to $34,999 | 207 | 8.2% |
| $35,000 to $49,999 | 352 | 13.9% |
| $50,000 to $74,999 | 420 | 16.6% |
| $75,000 to $99,999 | 248 | 9.8% |
| $100,000 to $149,999 | 541 | 21.4% |
| $150,000 to $199,999 | 129 | 5.1% |
| $200,000+ | 109 | 4.3% |
Family Income by Famaliy Size in Jennings
4-person families (292 | 11.6%) account for the highest median family income in Jennings with $98,500 per family, while 2-person families (1,223 | 48.4%) have the highest median income of $26,484 per family member.
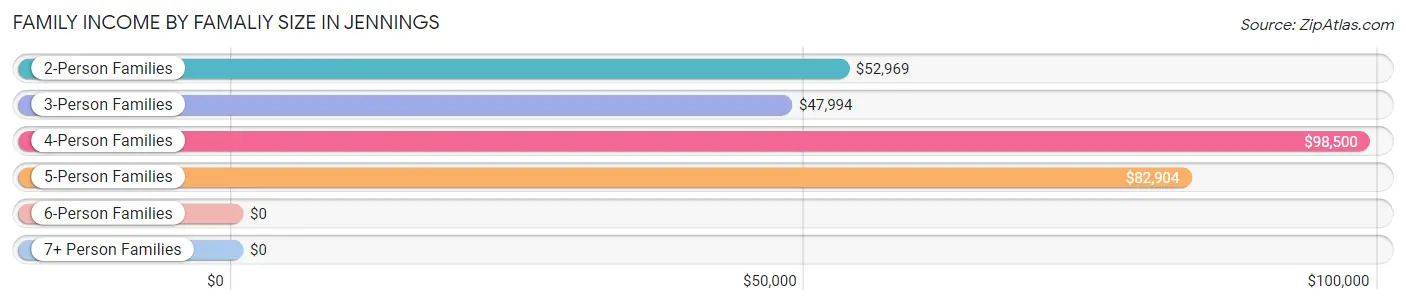
| Income Bracket | # Families | Median Income |
| 2-Person Families | 1,223 (48.4%) | $52,969 |
| 3-Person Families | 603 (23.8%) | $47,994 |
| 4-Person Families | 292 (11.6%) | $98,500 |
| 5-Person Families | 319 (12.6%) | $82,904 |
| 6-Person Families | 24 (0.9%) | $0 |
| 7+ Person Families | 68 (2.7%) | $0 |
| Total | 2,529 (100.0%) | $60,731 |
Family Income by Number of Earners in Jennings
The median family income in Jennings is $60,731, with families comprising 3+ earners (59) having the highest median family income of $116,528, while families with no earners (614) have the lowest median family income of $30,855, accounting for 2.3% and 24.3% of families, respectively.
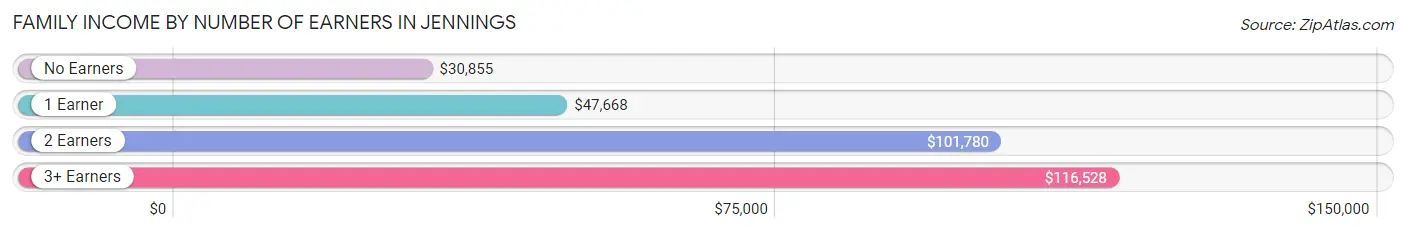
| Number of Earners | # Families | Median Income |
| No Earners | 614 (24.3%) | $30,855 |
| 1 Earner | 1,031 (40.8%) | $47,668 |
| 2 Earners | 825 (32.6%) | $101,780 |
| 3+ Earners | 59 (2.3%) | $116,528 |
| Total | 2,529 (100.0%) | $60,731 |
Household Income in Jennings
Household Income Brackets in Jennings
With 638 households falling in the category, the $15,000 to $24,999 income range is the most frequent in Jennings, accounting for 15.8% of all households. In contrast, only 109 households (2.7%) fall into the $200,000+ income bracket, making it the least populous group.
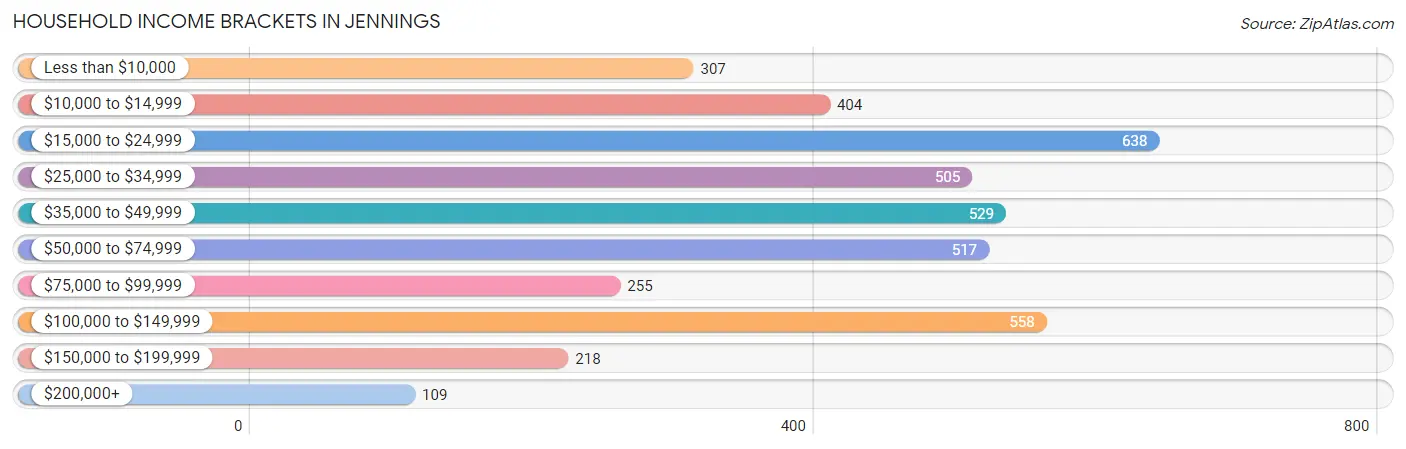
| Income Bracket | # Households | % Households |
| Less than $10,000 | 307 | 7.6% |
| $10,000 to $14,999 | 404 | 10.0% |
| $15,000 to $24,999 | 638 | 15.8% |
| $25,000 to $34,999 | 505 | 12.5% |
| $35,000 to $49,999 | 529 | 13.1% |
| $50,000 to $74,999 | 517 | 12.8% |
| $75,000 to $99,999 | 255 | 6.3% |
| $100,000 to $149,999 | 558 | 13.8% |
| $150,000 to $199,999 | 218 | 5.4% |
| $200,000+ | 109 | 2.7% |
Household Income by Householder Age in Jennings
The median household income in Jennings is $39,888, with the highest median household income of $57,063 found in the 25 to 44 years age bracket for the primary householder. A total of 1,163 households (28.8%) fall into this category. Meanwhile, the 15 to 24 years age bracket for the primary householder has the lowest median household income of $0, with 62 households (1.5%) in this group.
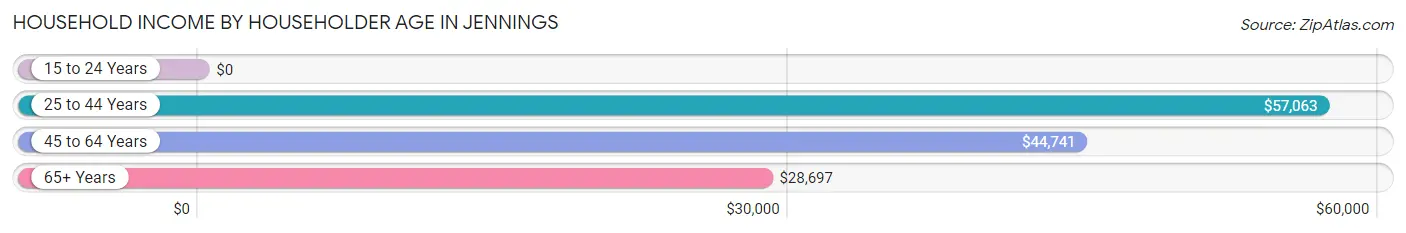
| Income Bracket | # Households | Median Income |
| 15 to 24 Years | 62 (1.5%) | $0 |
| 25 to 44 Years | 1,163 (28.8%) | $57,063 |
| 45 to 64 Years | 1,406 (34.8%) | $44,741 |
| 65+ Years | 1,409 (34.9%) | $28,697 |
| Total | 4,040 (100.0%) | $39,888 |
Poverty in Jennings
Income Below Poverty by Sex and Age in Jennings
With 17.4% poverty level for males and 25.1% for females among the residents of Jennings, 15 year old males and 5 year old females are the most vulnerable to poverty, with 127 males (79.9%) and 39 females (100.0%) in their respective age groups living below the poverty level.
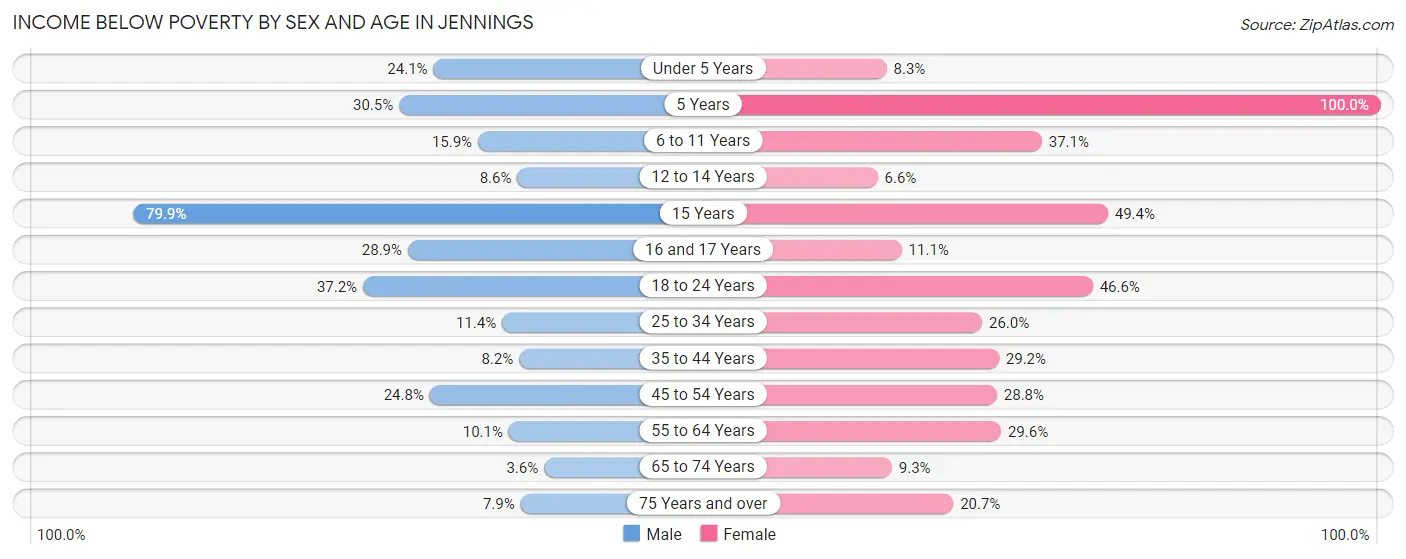
| Age Bracket | Male | Female |
| Under 5 Years | 82 (24.1%) | 32 (8.3%) |
| 5 Years | 25 (30.5%) | 39 (100.0%) |
| 6 to 11 Years | 68 (15.9%) | 157 (37.1%) |
| 12 to 14 Years | 10 (8.6%) | 15 (6.6%) |
| 15 Years | 127 (79.9%) | 39 (49.4%) |
| 16 and 17 Years | 71 (28.9%) | 8 (11.1%) |
| 18 to 24 Years | 93 (37.2%) | 163 (46.6%) |
| 25 to 34 Years | 63 (11.4%) | 145 (26.0%) |
| 35 to 44 Years | 42 (8.2%) | 165 (29.1%) |
| 45 to 54 Years | 93 (24.8%) | 141 (28.8%) |
| 55 to 64 Years | 61 (10.1%) | 172 (29.5%) |
| 65 to 74 Years | 17 (3.6%) | 65 (9.3%) |
| 75 Years and over | 25 (7.9%) | 98 (20.7%) |
| Total | 777 (17.4%) | 1,239 (25.1%) |
Income Above Poverty by Sex and Age in Jennings
According to the poverty statistics in Jennings, males aged 65 to 74 years and females aged 12 to 14 years are the age groups that are most secure financially, with 96.4% of males and 93.4% of females in these age groups living above the poverty line.
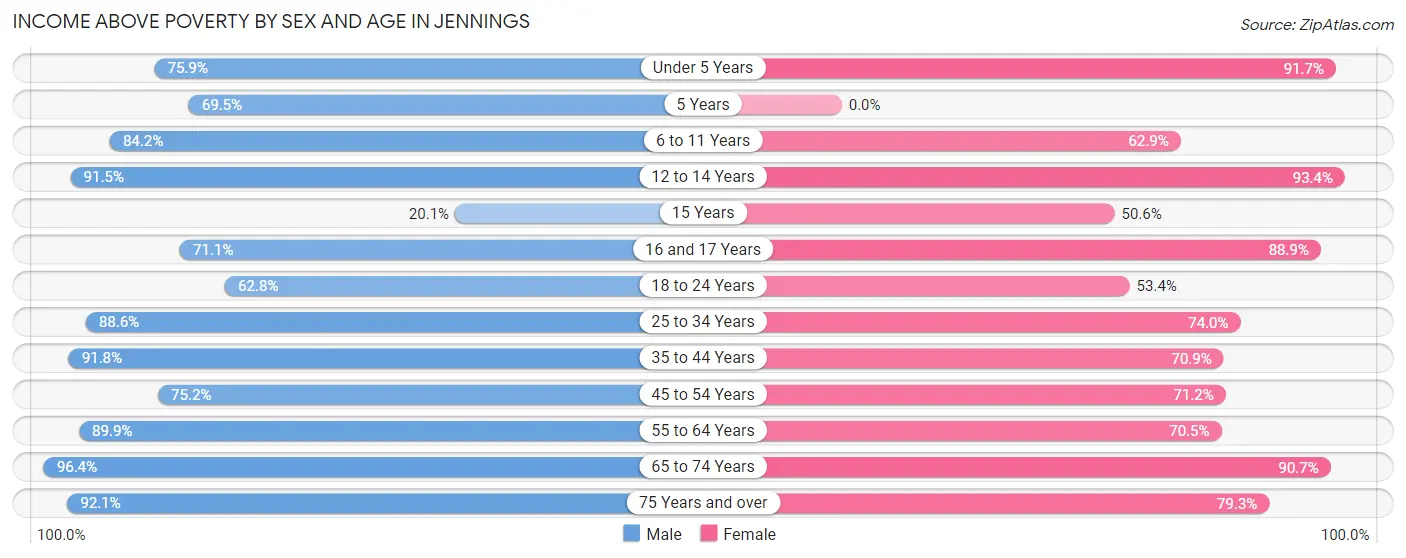
| Age Bracket | Male | Female |
| Under 5 Years | 258 (75.9%) | 353 (91.7%) |
| 5 Years | 57 (69.5%) | 0 (0.0%) |
| 6 to 11 Years | 361 (84.2%) | 266 (62.9%) |
| 12 to 14 Years | 107 (91.4%) | 211 (93.4%) |
| 15 Years | 32 (20.1%) | 40 (50.6%) |
| 16 and 17 Years | 175 (71.1%) | 64 (88.9%) |
| 18 to 24 Years | 157 (62.8%) | 187 (53.4%) |
| 25 to 34 Years | 490 (88.6%) | 412 (74.0%) |
| 35 to 44 Years | 469 (91.8%) | 401 (70.9%) |
| 45 to 54 Years | 282 (75.2%) | 349 (71.2%) |
| 55 to 64 Years | 541 (89.9%) | 410 (70.5%) |
| 65 to 74 Years | 458 (96.4%) | 635 (90.7%) |
| 75 Years and over | 290 (92.1%) | 376 (79.3%) |
| Total | 3,677 (82.6%) | 3,704 (74.9%) |
Income Below Poverty Among Married-Couple Families in Jennings
The poverty statistics for married-couple families in Jennings show that 3.7% or 62 of the total 1,663 families live below the poverty line. Families with 1 or 2 children have the highest poverty rate of 5.3%, comprising of 24 families. On the other hand, families with 3 or 4 children have the lowest poverty rate of 0.0%, which includes 0 families.
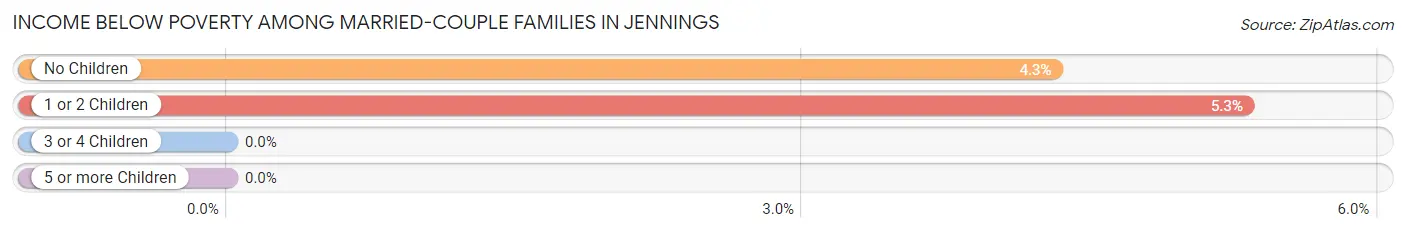
| Children | Above Poverty | Below Poverty |
| No Children | 844 (95.7%) | 38 (4.3%) |
| 1 or 2 Children | 428 (94.7%) | 24 (5.3%) |
| 3 or 4 Children | 329 (100.0%) | 0 (0.0%) |
| 5 or more Children | 0 (0.0%) | 0 (0.0%) |
| Total | 1,601 (96.3%) | 62 (3.7%) |
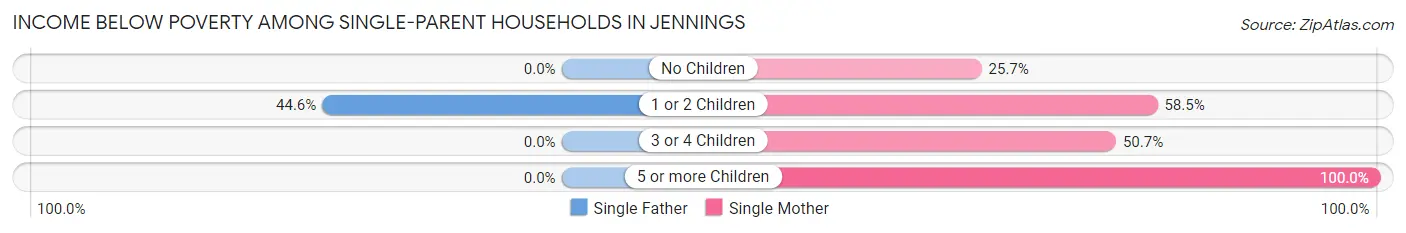
Income Below Poverty Among Single-Parent Households in Jennings
According to the poverty data in Jennings, 27.9% or 74 single-father households and 51.6% or 310 single-mother households are living below the poverty line. Among single-father households, those with 1 or 2 children have the highest poverty rate, with 74 households (44.6%) experiencing poverty. Likewise, among single-mother households, those with 5 or more children have the highest poverty rate, with 27 households (100.0%) falling below the poverty line.
| Children | Single Father | Single Mother |
| No Children | 0 (0.0%) | 37 (25.7%) |
| 1 or 2 Children | 74 (44.6%) | 211 (58.5%) |
| 3 or 4 Children | 0 (0.0%) | 35 (50.7%) |
| 5 or more Children | 0 (0.0%) | 27 (100.0%) |
| Total | 74 (27.9%) | 310 (51.6%) |
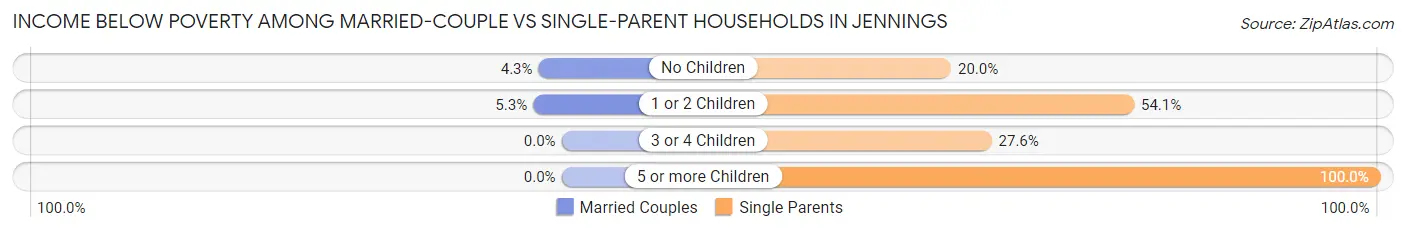
Income Below Poverty Among Married-Couple vs Single-Parent Households in Jennings
The poverty data for Jennings shows that 62 of the married-couple family households (3.7%) and 384 of the single-parent households (44.3%) are living below the poverty level. Within the married-couple family households, those with 1 or 2 children have the highest poverty rate, with 24 households (5.3%) falling below the poverty line. Among the single-parent households, those with 5 or more children have the highest poverty rate, with 27 household (100.0%) living below poverty.
| Children | Married-Couple Families | Single-Parent Households |
| No Children | 38 (4.3%) | 37 (20.0%) |
| 1 or 2 Children | 24 (5.3%) | 285 (54.1%) |
| 3 or 4 Children | 0 (0.0%) | 35 (27.6%) |
| 5 or more Children | 0 (0.0%) | 27 (100.0%) |
| Total | 62 (3.7%) | 384 (44.3%) |
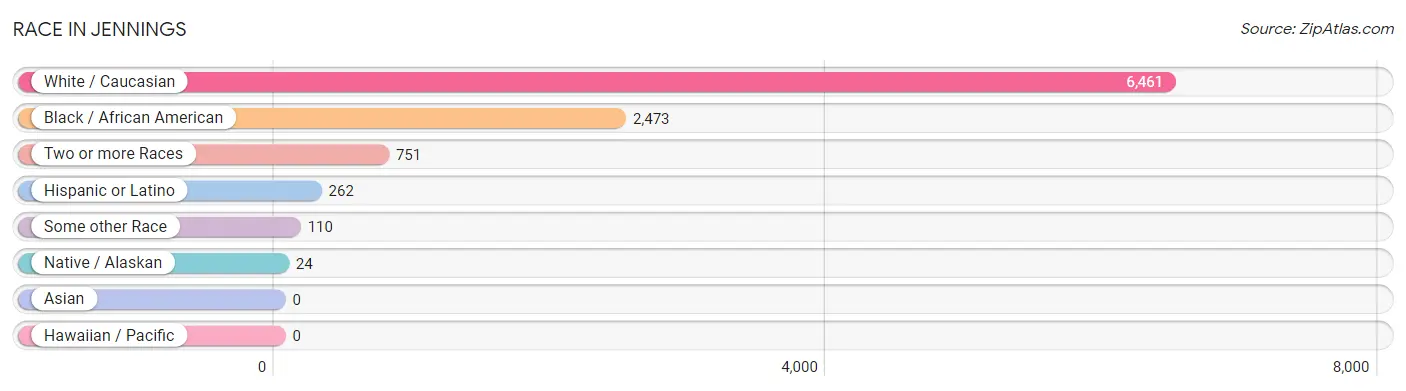
Race in Jennings
The most populous races in Jennings are White / Caucasian (6,461 | 65.8%), Black / African American (2,473 | 25.2%), and Two or more Races (751 | 7.6%).
| Race | # Population | % Population |
| Asian | 0 | 0.0% |
| Black / African American | 2,473 | 25.2% |
| Hawaiian / Pacific | 0 | 0.0% |
| Hispanic or Latino | 262 | 2.7% |
| Native / Alaskan | 24 | 0.2% |
| White / Caucasian | 6,461 | 65.8% |
| Two or more Races | 751 | 7.6% |
| Some other Race | 110 | 1.1% |
| Total | 9,819 | 100.0% |
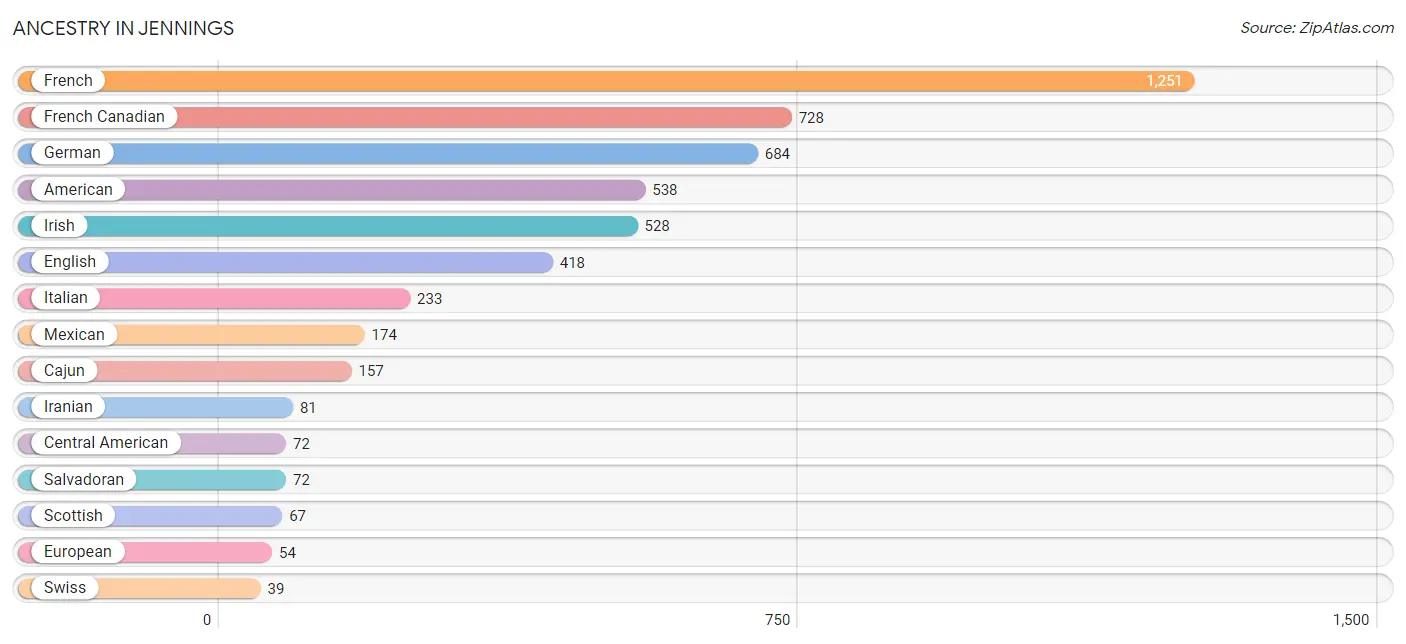
Ancestry in Jennings
The most populous ancestries reported in Jennings are French (1,251 | 12.7%), French Canadian (728 | 7.4%), German (684 | 7.0%), American (538 | 5.5%), and Irish (528 | 5.4%), together accounting for 38.0% of all Jennings residents.
| Ancestry | # Population | % Population |
| African | 8 | 0.1% |
| American | 538 | 5.5% |
| Belgian | 8 | 0.1% |
| Brazilian | 24 | 0.2% |
| British | 4 | 0.0% |
| Cajun | 157 | 1.6% |
| Canadian | 4 | 0.0% |
| Central American | 72 | 0.7% |
| Dutch | 31 | 0.3% |
| English | 418 | 4.3% |
| European | 54 | 0.5% |
| French | 1,251 | 12.7% |
| French Canadian | 728 | 7.4% |
| German | 684 | 7.0% |
| Iranian | 81 | 0.8% |
| Irish | 528 | 5.4% |
| Italian | 233 | 2.4% |
| Jamaican | 6 | 0.1% |
| Lithuanian | 23 | 0.2% |
| Mexican | 174 | 1.8% |
| Norwegian | 12 | 0.1% |
| Polish | 20 | 0.2% |
| Puerto Rican | 16 | 0.2% |
| Salvadoran | 72 | 0.7% |
| Scandinavian | 5 | 0.1% |
| Scottish | 67 | 0.7% |
| Subsaharan African | 8 | 0.1% |
| Swedish | 35 | 0.4% |
| Swiss | 39 | 0.4% |
| Welsh | 29 | 0.3% | View All 30 Rows |
Immigrants in Jennings
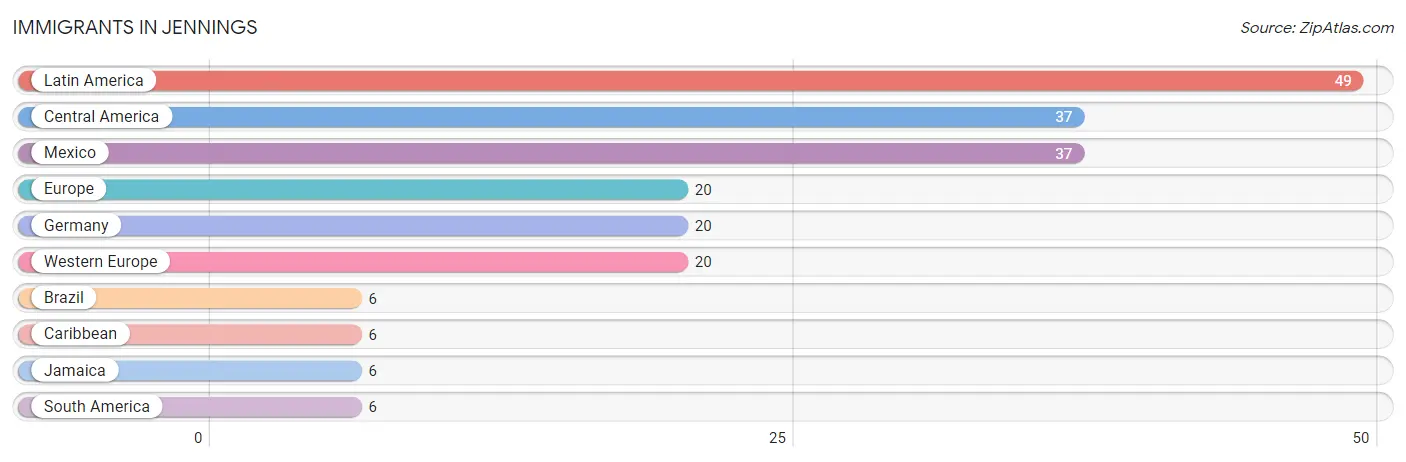
The most numerous immigrant groups reported in Jennings came from Latin America (49 | 0.5%), Central America (37 | 0.4%), Mexico (37 | 0.4%), Europe (20 | 0.2%), and Germany (20 | 0.2%), together accounting for 1.7% of all Jennings residents.
| Immigration Origin | # Population | % Population |
| Brazil | 6 | 0.1% |
| Caribbean | 6 | 0.1% |
| Central America | 37 | 0.4% |
| Europe | 20 | 0.2% |
| Germany | 20 | 0.2% |
| Jamaica | 6 | 0.1% |
| Latin America | 49 | 0.5% |
| Mexico | 37 | 0.4% |
| South America | 6 | 0.1% |
| Western Europe | 20 | 0.2% | View All 10 Rows |
Sex and Age in Jennings
Sex and Age in Jennings
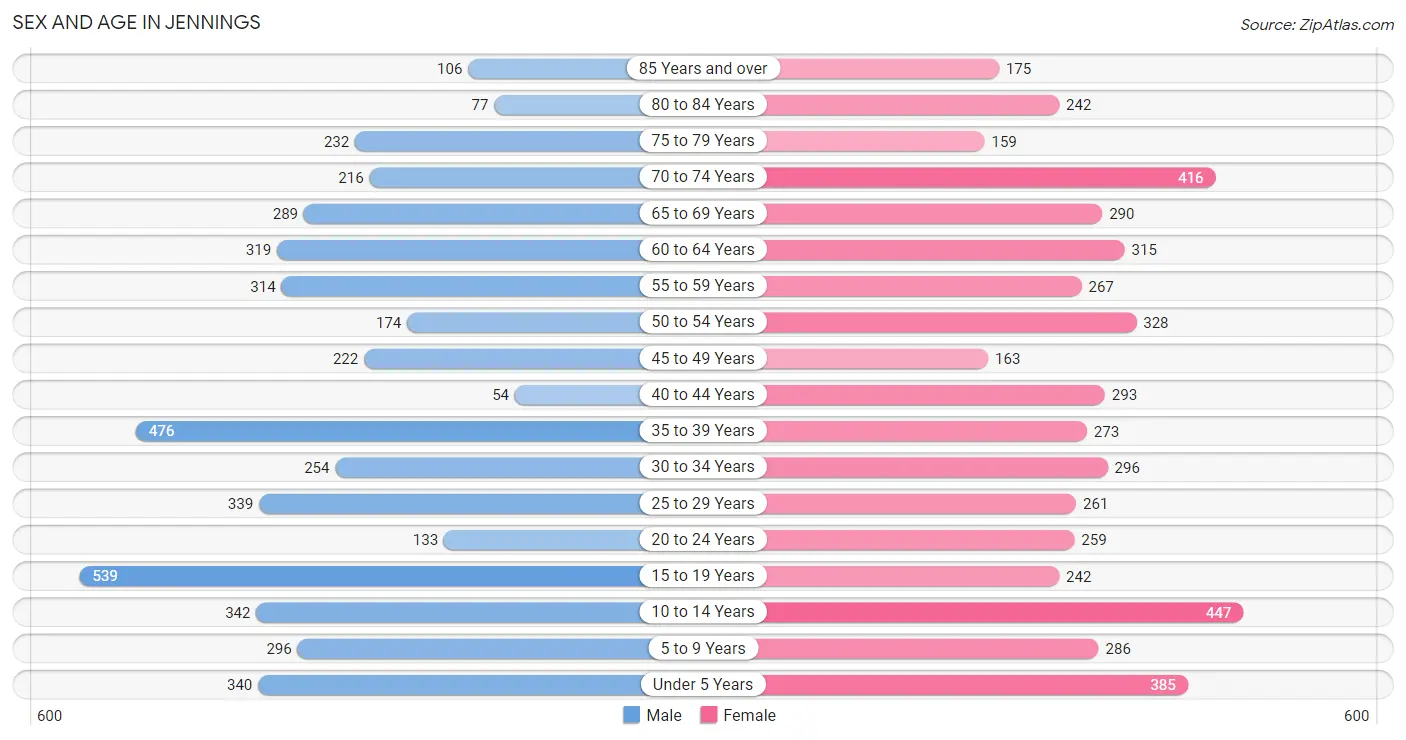
The most populous age groups in Jennings are 15 to 19 Years (539 | 11.4%) for men and 10 to 14 Years (447 | 8.8%) for women.
| Age Bracket | Male | Female |
| Under 5 Years | 340 (7.2%) | 385 (7.5%) |
| 5 to 9 Years | 296 (6.3%) | 286 (5.6%) |
| 10 to 14 Years | 342 (7.2%) | 447 (8.8%) |
| 15 to 19 Years | 539 (11.4%) | 242 (4.8%) |
| 20 to 24 Years | 133 (2.8%) | 259 (5.1%) |
| 25 to 29 Years | 339 (7.2%) | 261 (5.1%) |
| 30 to 34 Years | 254 (5.4%) | 296 (5.8%) |
| 35 to 39 Years | 476 (10.1%) | 273 (5.4%) |
| 40 to 44 Years | 54 (1.1%) | 293 (5.8%) |
| 45 to 49 Years | 222 (4.7%) | 163 (3.2%) |
| 50 to 54 Years | 174 (3.7%) | 328 (6.4%) |
| 55 to 59 Years | 314 (6.7%) | 267 (5.2%) |
| 60 to 64 Years | 319 (6.8%) | 315 (6.2%) |
| 65 to 69 Years | 289 (6.1%) | 290 (5.7%) |
| 70 to 74 Years | 216 (4.6%) | 416 (8.2%) |
| 75 to 79 Years | 232 (4.9%) | 159 (3.1%) |
| 80 to 84 Years | 77 (1.6%) | 242 (4.8%) |
| 85 Years and over | 106 (2.2%) | 175 (3.4%) |
| Total | 4,722 (100.0%) | 5,097 (100.0%) |
Families and Households in Jennings
Median Family Size in Jennings
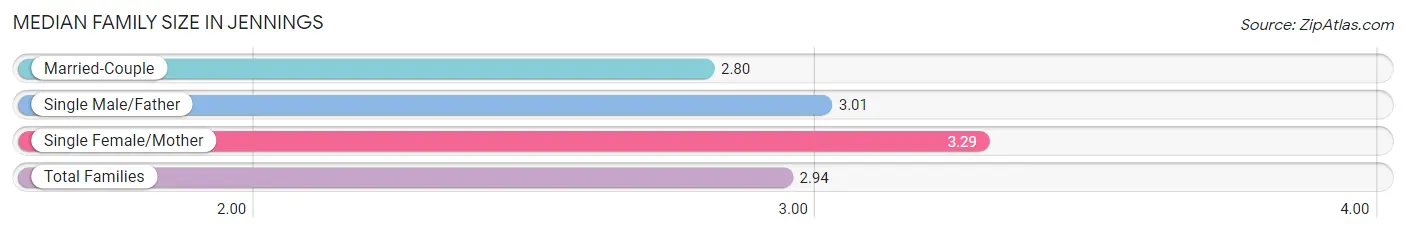
The median family size in Jennings is 2.94 persons per family, with single female/mother families (601 | 23.8%) accounting for the largest median family size of 3.29 persons per family. On the other hand, married-couple families (1,663 | 65.8%) represent the smallest median family size with 2.80 persons per family.
| Family Type | # Families | Family Size |
| Married-Couple | 1,663 (65.8%) | 2.80 |
| Single Male/Father | 265 (10.5%) | 3.01 |
| Single Female/Mother | 601 (23.8%) | 3.29 |
| Total Families | 2,529 (100.0%) | 2.94 |
Median Household Size in Jennings
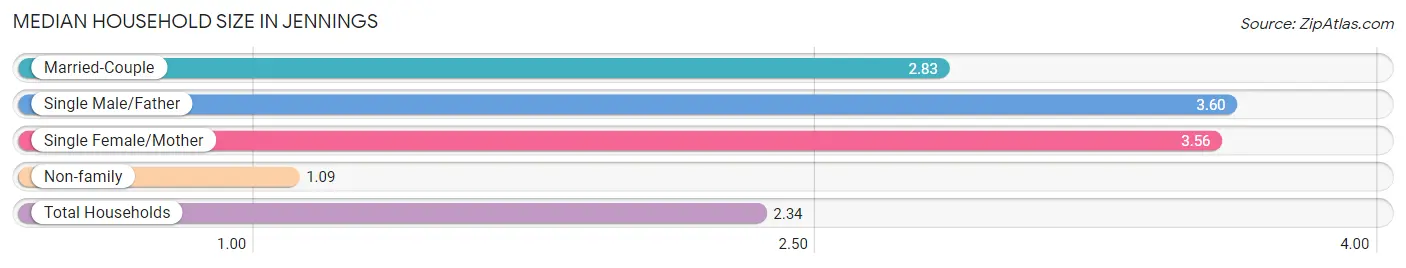
The median household size in Jennings is 2.34 persons per household, with single male/father households (265 | 6.6%) accounting for the largest median household size of 3.6 persons per household. non-family households (1,511 | 37.4%) represent the smallest median household size with 1.09 persons per household.
| Household Type | # Households | Household Size |
| Married-Couple | 1,663 (41.2%) | 2.83 |
| Single Male/Father | 265 (6.6%) | 3.60 |
| Single Female/Mother | 601 (14.9%) | 3.56 |
| Non-family | 1,511 (37.4%) | 1.09 |
| Total Households | 4,040 (100.0%) | 2.34 |
Household Size by Marriage Status in Jennings
Out of a total of 4,040 households in Jennings, 2,529 (62.6%) are family households, while 1,511 (37.4%) are nonfamily households. The most numerous type of family households are 2-person households, comprising 1,183, and the most common type of nonfamily households are 1-person households, comprising 1,407.
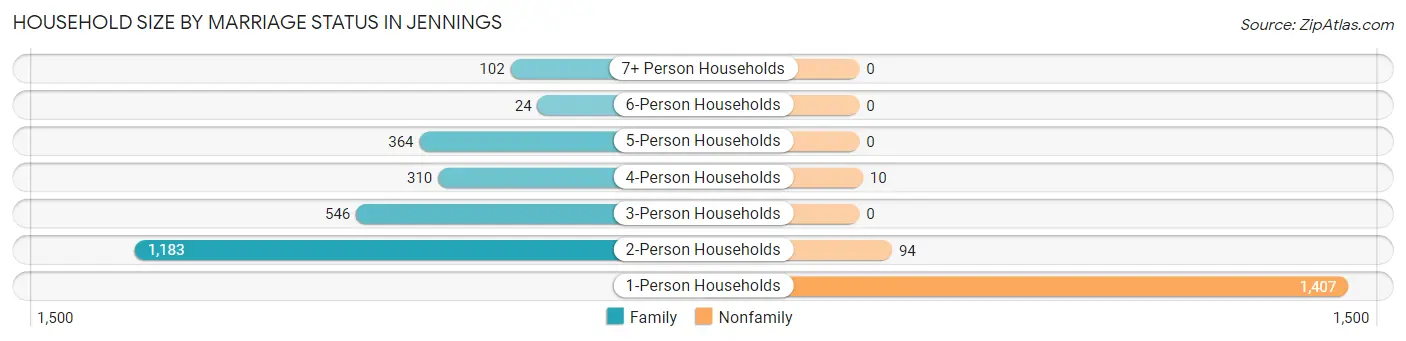
| Household Size | Family Households | Nonfamily Households |
| 1-Person Households | - | 1,407 (34.8%) |
| 2-Person Households | 1,183 (29.3%) | 94 (2.3%) |
| 3-Person Households | 546 (13.5%) | 0 (0.0%) |
| 4-Person Households | 310 (7.7%) | 10 (0.3%) |
| 5-Person Households | 364 (9.0%) | 0 (0.0%) |
| 6-Person Households | 24 (0.6%) | 0 (0.0%) |
| 7+ Person Households | 102 (2.5%) | 0 (0.0%) |
| Total | 2,529 (62.6%) | 1,511 (37.4%) |
Female Fertility in Jennings
Fertility by Age in Jennings
Average fertility rate in Jennings is 63.0 births per 1,000 women. Women in the age bracket of 20 to 34 years have the highest fertility rate with 123.0 births per 1,000 women. Women in the age bracket of 20 to 34 years acount for 84.8% of all women with births.
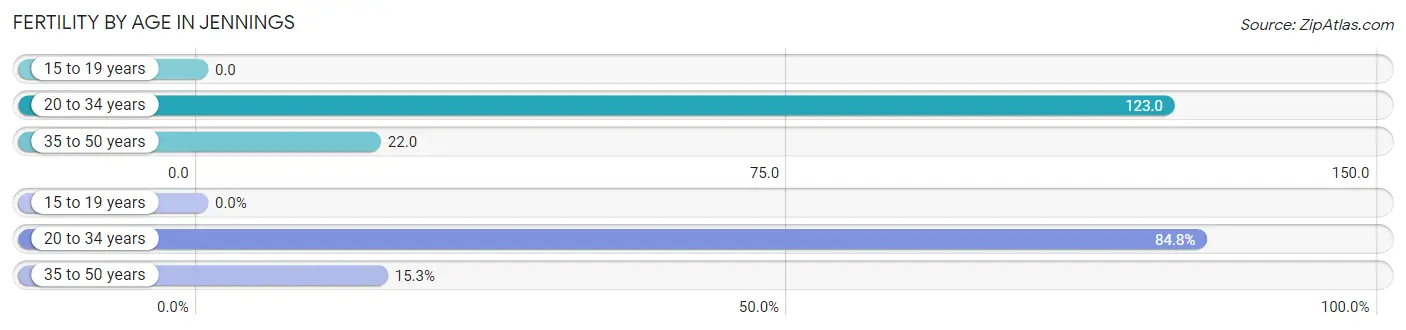
| Age Bracket | Women with Births | Births / 1,000 Women |
| 15 to 19 years | 0 (0.0%) | 0.0 |
| 20 to 34 years | 100 (84.8%) | 123.0 |
| 35 to 50 years | 18 (15.2%) | 22.0 |
| Total | 118 (100.0%) | 63.0 |
Fertility by Age by Marriage Status in Jennings
76.3% of women with births (118) in Jennings are married. The highest percentage of unmarried women with births falls into 20 to 34 years age bracket with 28.0% of them unmarried at the time of birth, while the lowest percentage of unmarried women with births belong to 35 to 50 years age bracket with 0.0% of them unmarried.
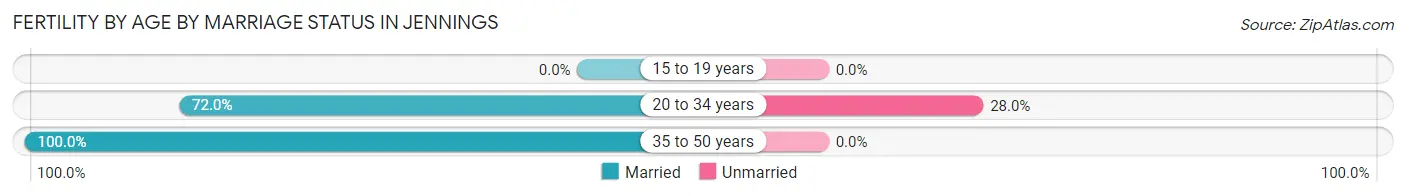
| Age Bracket | Married | Unmarried |
| 15 to 19 years | 0 (0.0%) | 0 (0.0%) |
| 20 to 34 years | 72 (72.0%) | 28 (28.0%) |
| 35 to 50 years | 18 (100.0%) | 0 (0.0%) |
| Total | 90 (76.3%) | 28 (23.7%) |
Fertility by Education in Jennings
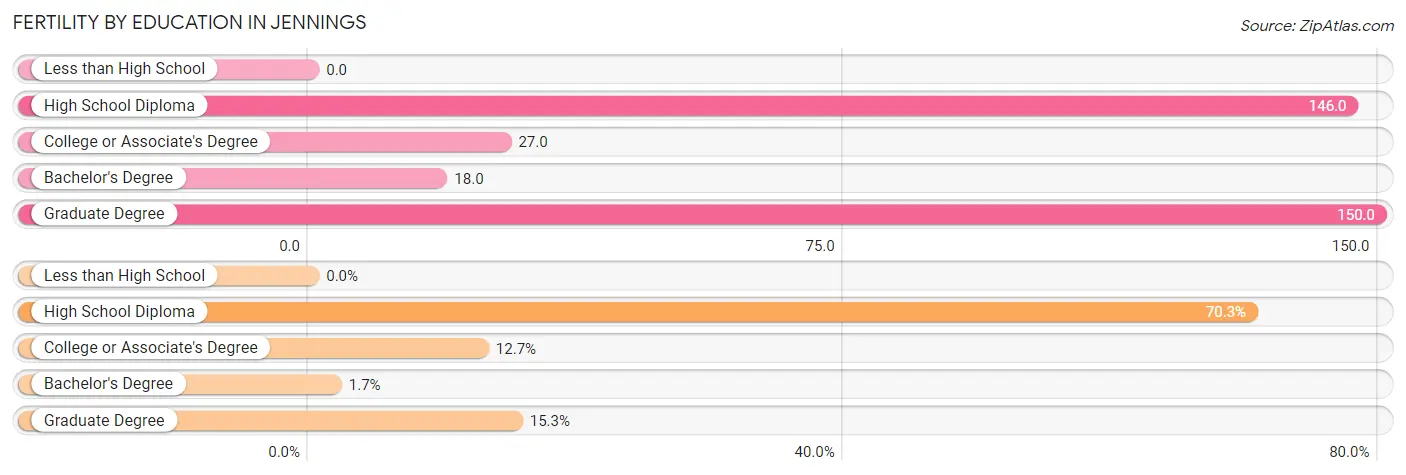
| Educational Attainment | Women with Births | Births / 1,000 Women |
| Less than High School | 0 (0.0%) | 0.0 |
| High School Diploma | 83 (70.3%) | 146.0 |
| College or Associate's Degree | 15 (12.7%) | 27.0 |
| Bachelor's Degree | 2 (1.7%) | 18.0 |
| Graduate Degree | 18 (15.2%) | 150.0 |
| Total | 118 (100.0%) | 63.0 |
Fertility by Education by Marriage Status in Jennings
23.7% of women with births in Jennings are unmarried. Women with the educational attainment of college or associate's degree are most likely to be married with 100.0% of them married at childbirth, while women with the educational attainment of bachelor's degree are least likely to be married with 100.0% of them unmarried at childbirth.
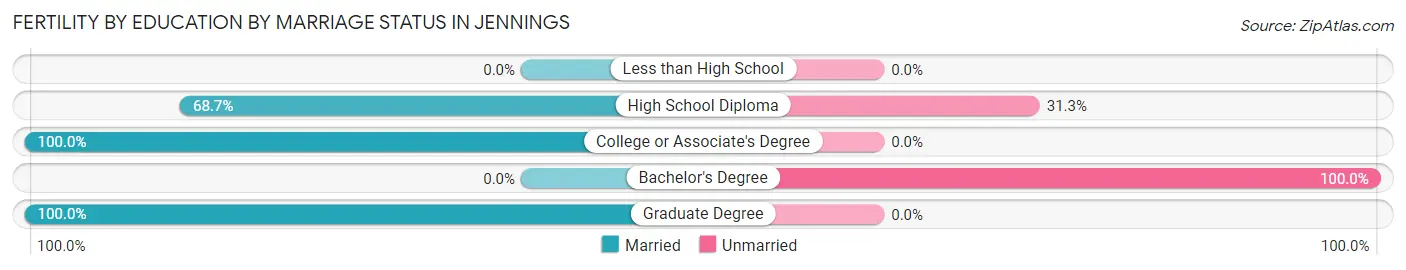
| Educational Attainment | Married | Unmarried |
| Less than High School | 0 (0.0%) | 0 (0.0%) |
| High School Diploma | 57 (68.7%) | 26 (31.3%) |
| College or Associate's Degree | 15 (100.0%) | 0 (0.0%) |
| Bachelor's Degree | 0 (0.0%) | 2 (100.0%) |
| Graduate Degree | 18 (100.0%) | 0 (0.0%) |
| Total | 90 (76.3%) | 28 (23.7%) |
Employment Characteristics in Jennings
Employment by Class of Employer in Jennings
Among the 3,426 employed individuals in Jennings, private company employees (2,444 | 71.3%), local government employees (267 | 7.8%), and self-employed (not incorporated) (255 | 7.4%) make up the most common classes of employment.
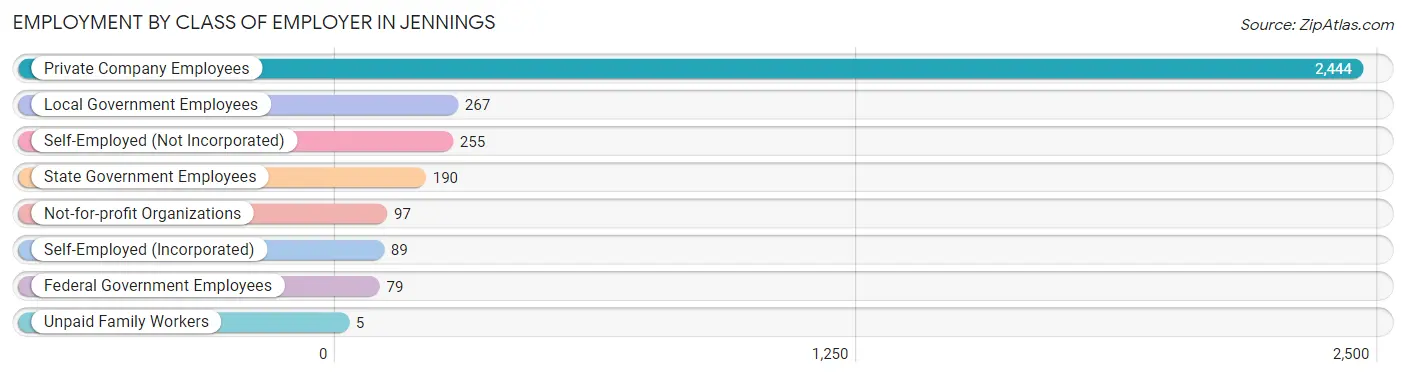
| Employer Class | # Employees | % Employees |
| Private Company Employees | 2,444 | 71.3% |
| Self-Employed (Incorporated) | 89 | 2.6% |
| Self-Employed (Not Incorporated) | 255 | 7.4% |
| Not-for-profit Organizations | 97 | 2.8% |
| Local Government Employees | 267 | 7.8% |
| State Government Employees | 190 | 5.6% |
| Federal Government Employees | 79 | 2.3% |
| Unpaid Family Workers | 5 | 0.2% |
| Total | 3,426 | 100.0% |
Employment Status by Age in Jennings
According to the labor force statistics for Jennings, out of the total population over 16 years of age (7,485), 49.3% or 3,690 individuals are in the labor force, with 5.1% or 188 of them unemployed. The age group with the highest labor force participation rate is 35 to 44 years, with 87.3% or 957 individuals in the labor force. Within the labor force, the 16 to 19 years age range has the highest percentage of unemployed individuals, with 21.6% or 22 of them being unemployed.
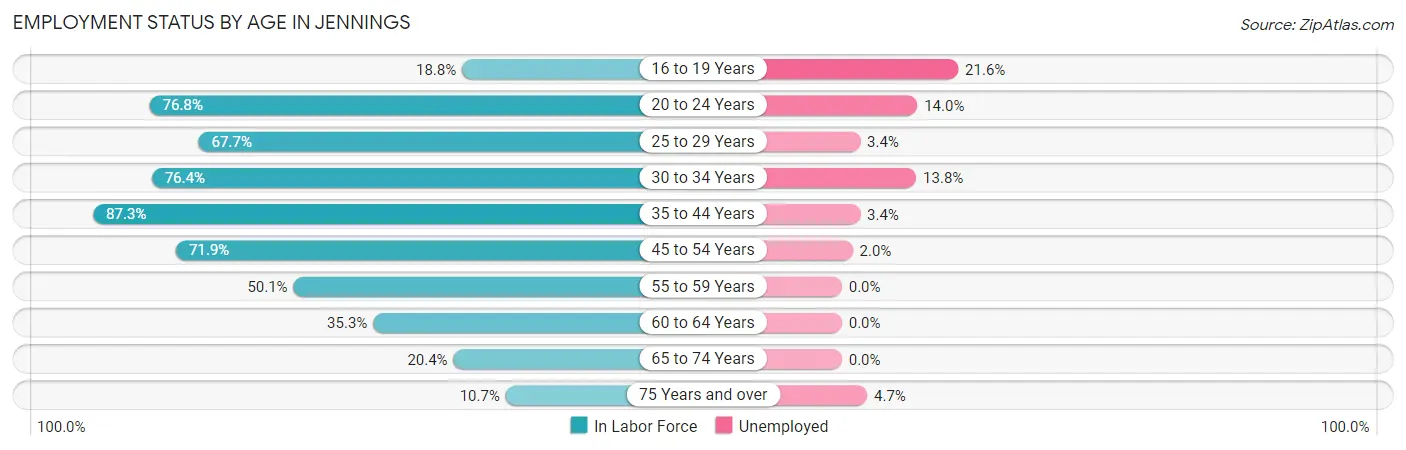
| Age Bracket | In Labor Force | Unemployed |
| 16 to 19 Years | 102 (18.8%) | 22 (21.6%) |
| 20 to 24 Years | 301 (76.8%) | 42 (14.0%) |
| 25 to 29 Years | 406 (67.7%) | 14 (3.4%) |
| 30 to 34 Years | 420 (76.4%) | 58 (13.8%) |
| 35 to 44 Years | 957 (87.3%) | 33 (3.4%) |
| 45 to 54 Years | 638 (71.9%) | 13 (2.0%) |
| 55 to 59 Years | 291 (50.1%) | 0 (0.0%) |
| 60 to 64 Years | 224 (35.3%) | 0 (0.0%) |
| 65 to 74 Years | 247 (20.4%) | 0 (0.0%) |
| 75 Years and over | 106 (10.7%) | 5 (4.7%) |
| Total | 3,690 (49.3%) | 188 (5.1%) |
Employment Status by Educational Attainment in Jennings
According to labor force statistics for Jennings, 67.5% of individuals (2,935) out of the total population between 25 and 64 years of age (4,348) are in the labor force, with 4.0% or 117 of them being unemployed. The group with the highest labor force participation rate are those with the educational attainment of bachelor's degree or higher, with 86.2% or 564 individuals in the labor force. Within the labor force, individuals with less than high school education have the highest percentage of unemployment, with 12.2% or 58 of them being unemployed.
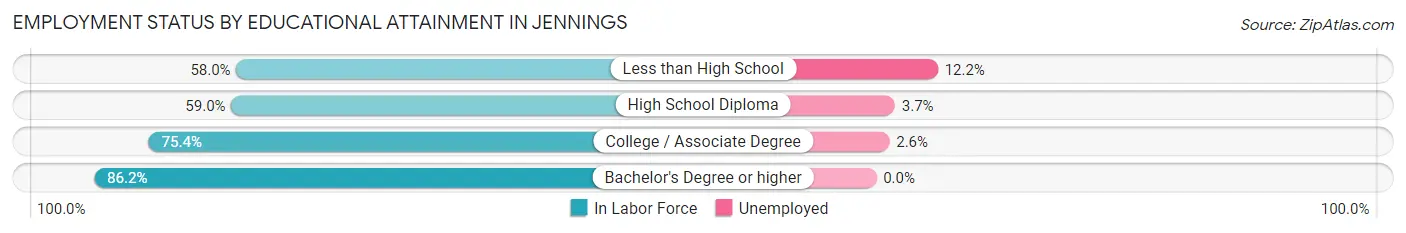
| Educational Attainment | In Labor Force | Unemployed |
| Less than High School | 476 (58.0%) | 100 (12.2%) |
| High School Diploma | 978 (59.0%) | 61 (3.7%) |
| College / Associate Degree | 917 (75.4%) | 32 (2.6%) |
| Bachelor's Degree or higher | 564 (86.2%) | 0 (0.0%) |
| Total | 2,935 (67.5%) | 174 (4.0%) |
Employment Occupations by Sex in Jennings
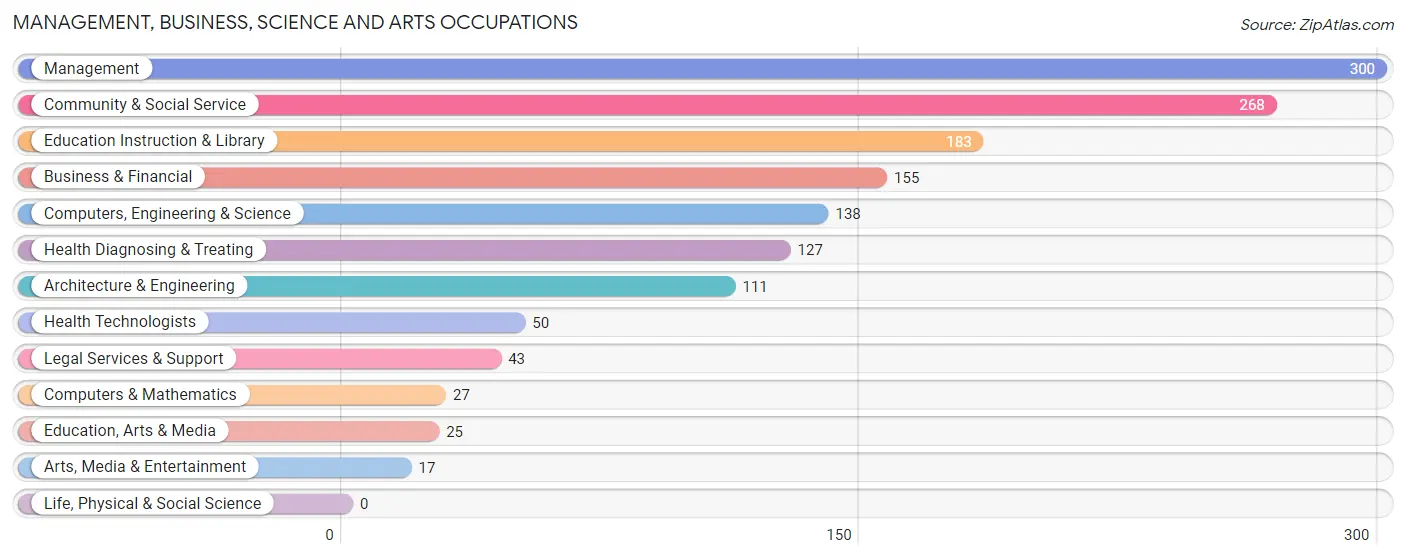
Management, Business, Science and Arts Occupations
The most common Management, Business, Science and Arts occupations in Jennings are Management (300 | 8.6%), Community & Social Service (268 | 7.6%), Education Instruction & Library (183 | 5.2%), Business & Financial (155 | 4.4%), and Computers, Engineering & Science (138 | 3.9%).
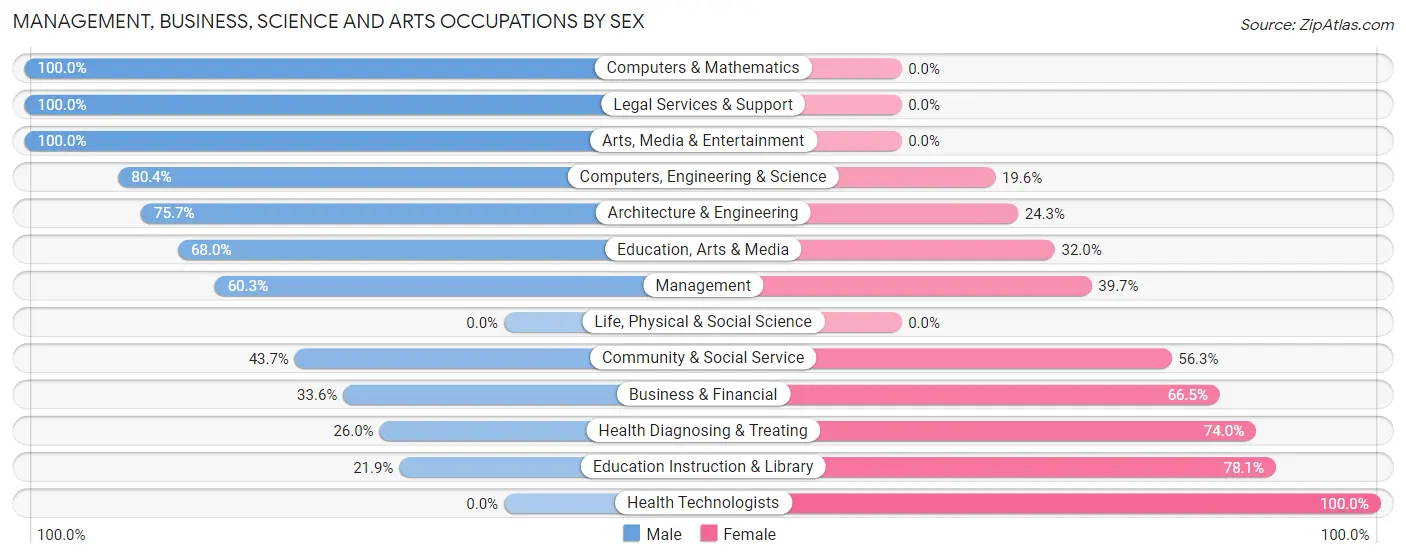
Management, Business, Science and Arts Occupations by Sex
Within the Management, Business, Science and Arts occupations in Jennings, the most male-oriented occupations are Computers & Mathematics (100.0%), Legal Services & Support (100.0%), and Arts, Media & Entertainment (100.0%), while the most female-oriented occupations are Health Technologists (100.0%), Education Instruction & Library (78.1%), and Health Diagnosing & Treating (74.0%).
| Occupation | Male | Female |
| Management | 181 (60.3%) | 119 (39.7%) |
| Business & Financial | 52 (33.6%) | 103 (66.4%) |
| Computers, Engineering & Science | 111 (80.4%) | 27 (19.6%) |
| Computers & Mathematics | 27 (100.0%) | 0 (0.0%) |
| Architecture & Engineering | 84 (75.7%) | 27 (24.3%) |
| Life, Physical & Social Science | 0 (0.0%) | 0 (0.0%) |
| Community & Social Service | 117 (43.7%) | 151 (56.3%) |
| Education, Arts & Media | 17 (68.0%) | 8 (32.0%) |
| Legal Services & Support | 43 (100.0%) | 0 (0.0%) |
| Education Instruction & Library | 40 (21.9%) | 143 (78.1%) |
| Arts, Media & Entertainment | 17 (100.0%) | 0 (0.0%) |
| Health Diagnosing & Treating | 33 (26.0%) | 94 (74.0%) |
| Health Technologists | 0 (0.0%) | 50 (100.0%) |
| Total (Category) | 494 (50.0%) | 494 (50.0%) |
| Total (Overall) | 1,866 (53.2%) | 1,639 (46.8%) |
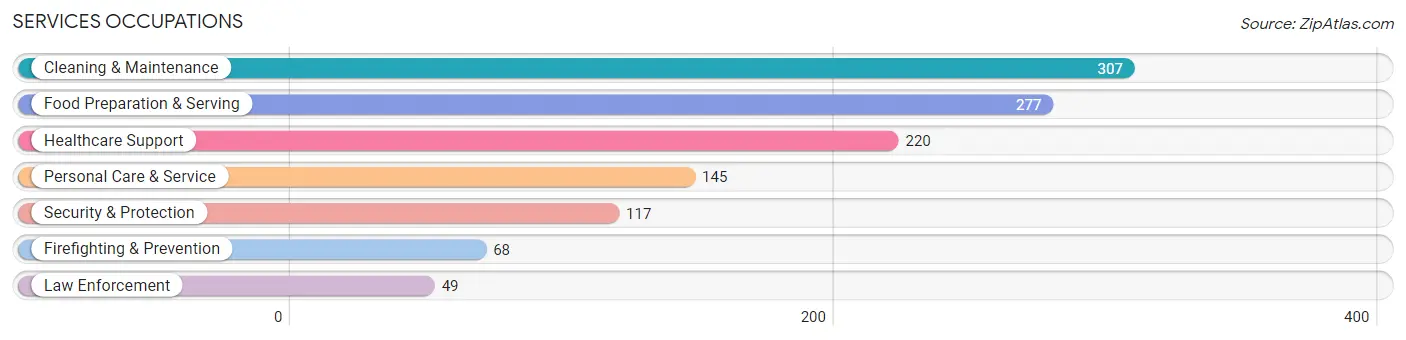
Services Occupations
The most common Services occupations in Jennings are Cleaning & Maintenance (307 | 8.8%), Food Preparation & Serving (277 | 7.9%), Healthcare Support (220 | 6.3%), Personal Care & Service (145 | 4.1%), and Security & Protection (117 | 3.3%).
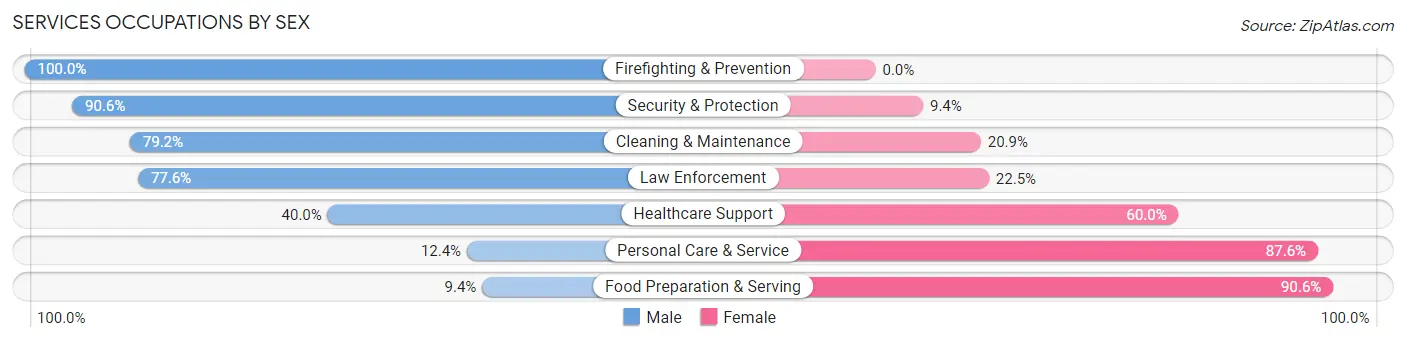
Services Occupations by Sex
Within the Services occupations in Jennings, the most male-oriented occupations are Firefighting & Prevention (100.0%), Security & Protection (90.6%), and Cleaning & Maintenance (79.1%), while the most female-oriented occupations are Food Preparation & Serving (90.6%), Personal Care & Service (87.6%), and Healthcare Support (60.0%).
| Occupation | Male | Female |
| Healthcare Support | 88 (40.0%) | 132 (60.0%) |
| Security & Protection | 106 (90.6%) | 11 (9.4%) |
| Firefighting & Prevention | 68 (100.0%) | 0 (0.0%) |
| Law Enforcement | 38 (77.5%) | 11 (22.5%) |
| Food Preparation & Serving | 26 (9.4%) | 251 (90.6%) |
| Cleaning & Maintenance | 243 (79.1%) | 64 (20.8%) |
| Personal Care & Service | 18 (12.4%) | 127 (87.6%) |
| Total (Category) | 481 (45.1%) | 585 (54.9%) |
| Total (Overall) | 1,866 (53.2%) | 1,639 (46.8%) |
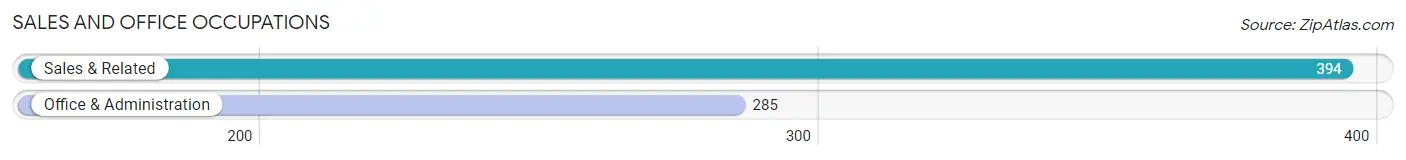
Sales and Office Occupations
The most common Sales and Office occupations in Jennings are Sales & Related (394 | 11.2%), and Office & Administration (285 | 8.1%).
Sales and Office Occupations by Sex
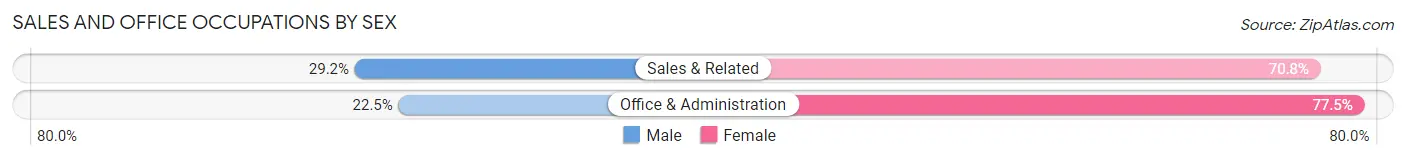
| Occupation | Male | Female |
| Sales & Related | 115 (29.2%) | 279 (70.8%) |
| Office & Administration | 64 (22.5%) | 221 (77.5%) |
| Total (Category) | 179 (26.4%) | 500 (73.6%) |
| Total (Overall) | 1,866 (53.2%) | 1,639 (46.8%) |
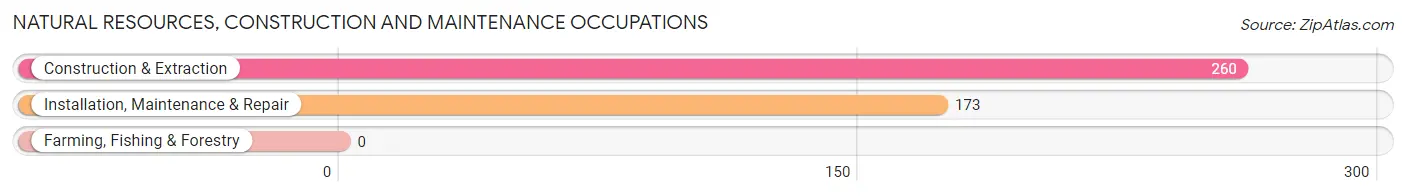
Natural Resources, Construction and Maintenance Occupations
The most common Natural Resources, Construction and Maintenance occupations in Jennings are Construction & Extraction (260 | 7.4%), and Installation, Maintenance & Repair (173 | 4.9%).
Natural Resources, Construction and Maintenance Occupations by Sex
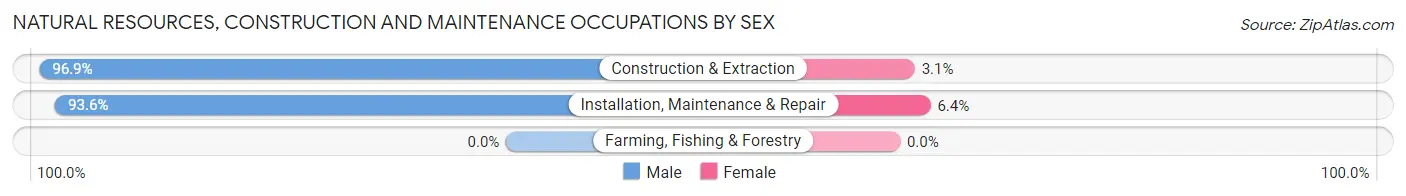
| Occupation | Male | Female |
| Farming, Fishing & Forestry | 0 (0.0%) | 0 (0.0%) |
| Construction & Extraction | 252 (96.9%) | 8 (3.1%) |
| Installation, Maintenance & Repair | 162 (93.6%) | 11 (6.4%) |
| Total (Category) | 414 (95.6%) | 19 (4.4%) |
| Total (Overall) | 1,866 (53.2%) | 1,639 (46.8%) |
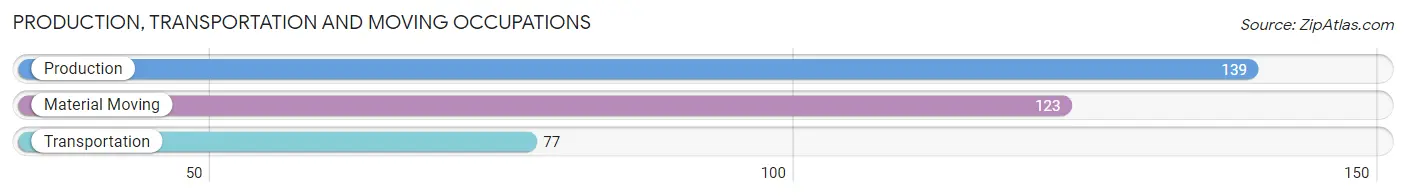
Production, Transportation and Moving Occupations
The most common Production, Transportation and Moving occupations in Jennings are Production (139 | 4.0%), Material Moving (123 | 3.5%), and Transportation (77 | 2.2%).
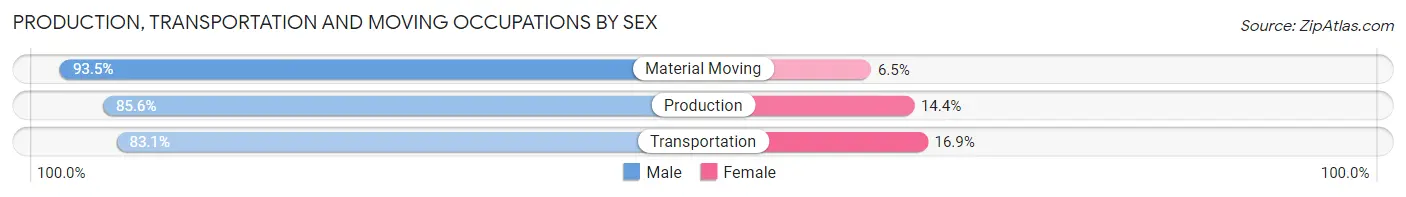
Production, Transportation and Moving Occupations by Sex
| Occupation | Male | Female |
| Production | 119 (85.6%) | 20 (14.4%) |
| Transportation | 64 (83.1%) | 13 (16.9%) |
| Material Moving | 115 (93.5%) | 8 (6.5%) |
| Total (Category) | 298 (87.9%) | 41 (12.1%) |
| Total (Overall) | 1,866 (53.2%) | 1,639 (46.8%) |
Employment Industries by Sex in Jennings
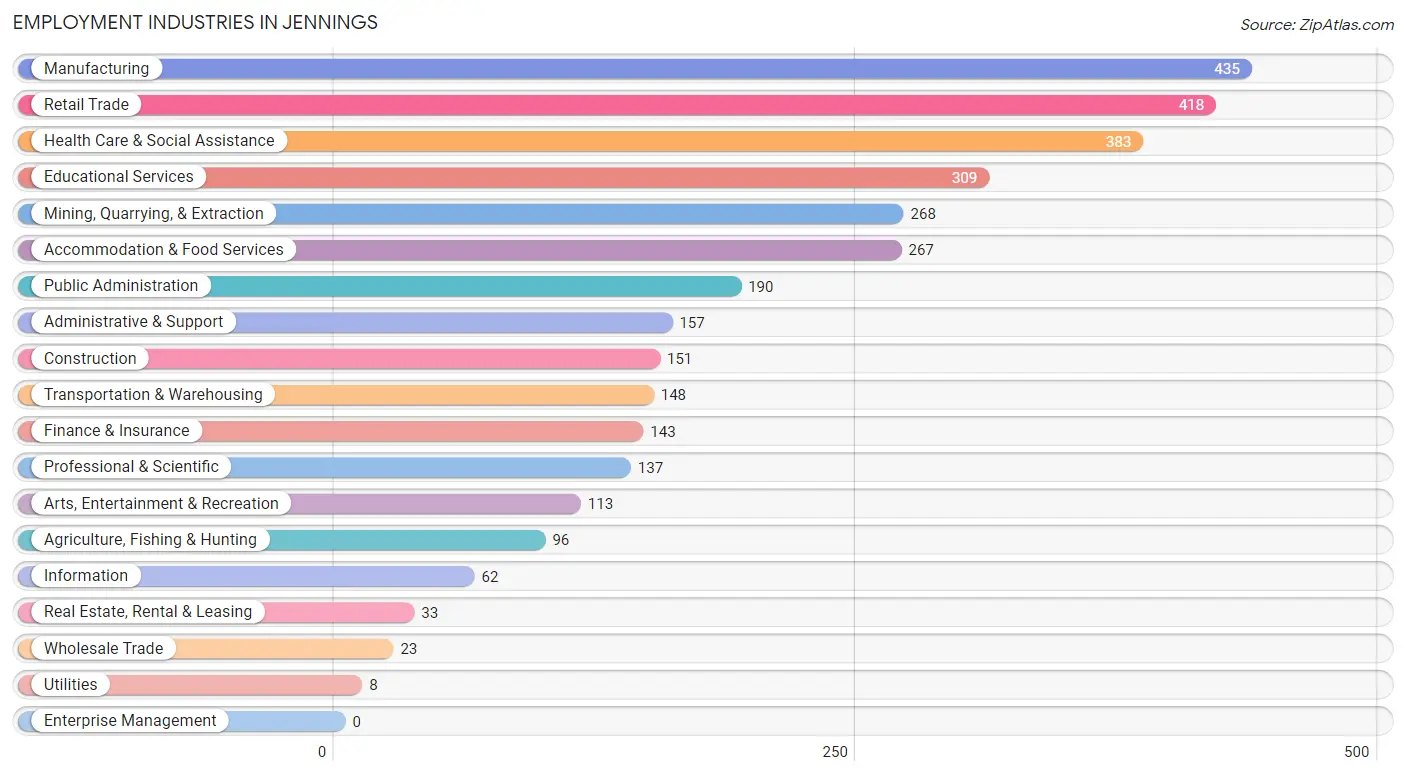
Employment Industries in Jennings
The major employment industries in Jennings include Manufacturing (435 | 12.4%), Retail Trade (418 | 11.9%), Health Care & Social Assistance (383 | 10.9%), Educational Services (309 | 8.8%), and Mining, Quarrying, & Extraction (268 | 7.6%).
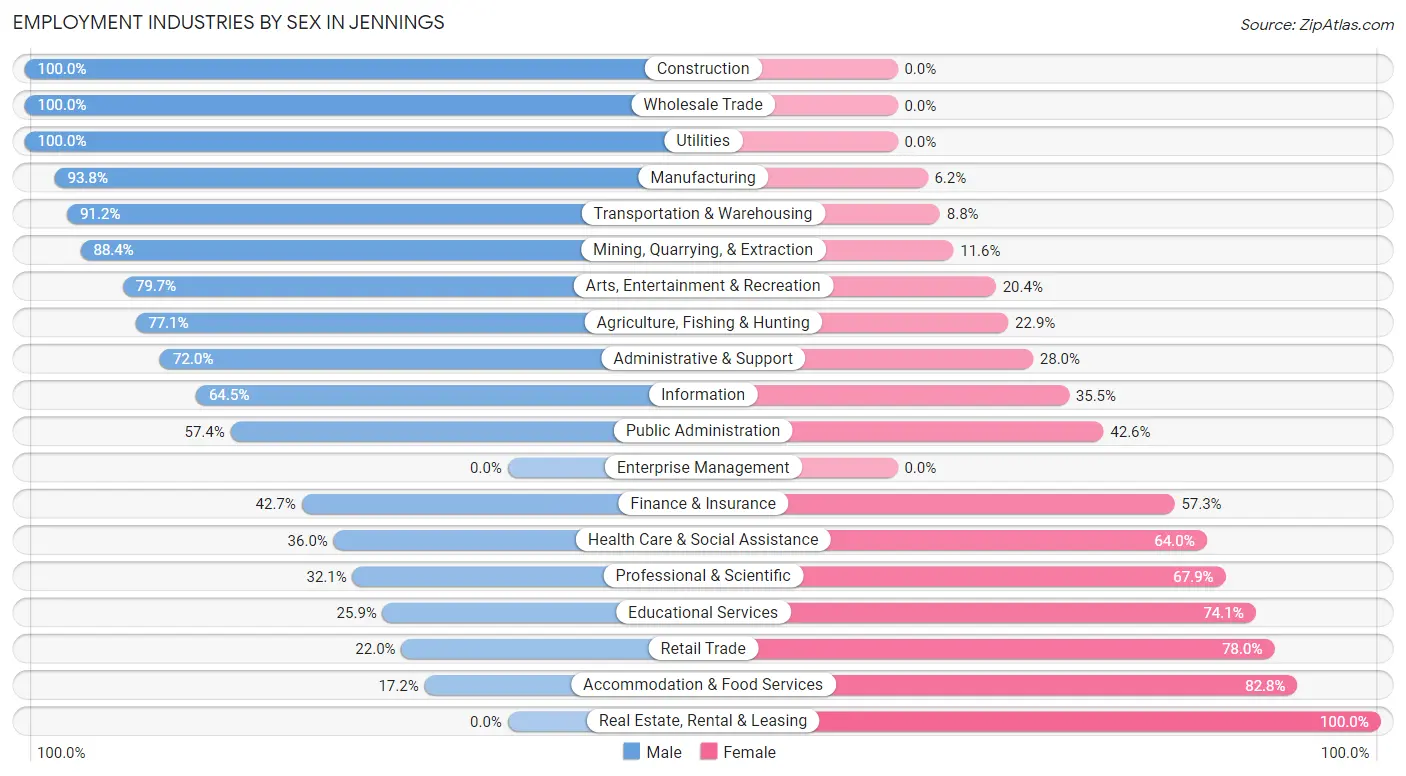
Employment Industries by Sex in Jennings
The Jennings industries that see more men than women are Construction (100.0%), Wholesale Trade (100.0%), and Utilities (100.0%), whereas the industries that tend to have a higher number of women are Real Estate, Rental & Leasing (100.0%), Accommodation & Food Services (82.8%), and Retail Trade (78.0%).
| Industry | Male | Female |
| Agriculture, Fishing & Hunting | 74 (77.1%) | 22 (22.9%) |
| Mining, Quarrying, & Extraction | 237 (88.4%) | 31 (11.6%) |
| Construction | 151 (100.0%) | 0 (0.0%) |
| Manufacturing | 408 (93.8%) | 27 (6.2%) |
| Wholesale Trade | 23 (100.0%) | 0 (0.0%) |
| Retail Trade | 92 (22.0%) | 326 (78.0%) |
| Transportation & Warehousing | 135 (91.2%) | 13 (8.8%) |
| Utilities | 8 (100.0%) | 0 (0.0%) |
| Information | 40 (64.5%) | 22 (35.5%) |
| Finance & Insurance | 61 (42.7%) | 82 (57.3%) |
| Real Estate, Rental & Leasing | 0 (0.0%) | 33 (100.0%) |
| Professional & Scientific | 44 (32.1%) | 93 (67.9%) |
| Enterprise Management | 0 (0.0%) | 0 (0.0%) |
| Administrative & Support | 113 (72.0%) | 44 (28.0%) |
| Educational Services | 80 (25.9%) | 229 (74.1%) |
| Health Care & Social Assistance | 138 (36.0%) | 245 (64.0%) |
| Arts, Entertainment & Recreation | 90 (79.6%) | 23 (20.3%) |
| Accommodation & Food Services | 46 (17.2%) | 221 (82.8%) |
| Public Administration | 109 (57.4%) | 81 (42.6%) |
| Total | 1,866 (53.2%) | 1,639 (46.8%) |
Education in Jennings
School Enrollment in Jennings
The most common levels of schooling among the 2,349 students in Jennings are high school (615 | 26.2%), middle school (591 | 25.2%), and elementary school (541 | 23.0%).
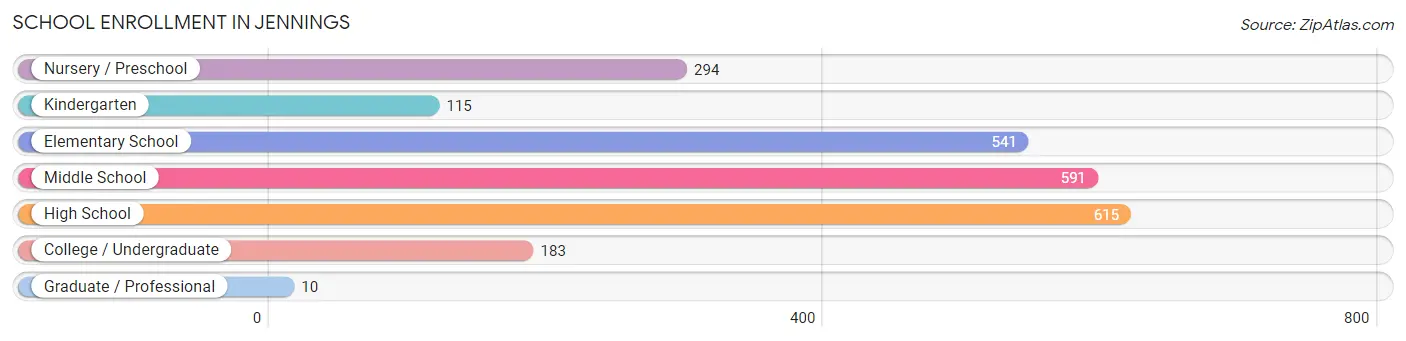
| School Level | # Students | % Students |
| Nursery / Preschool | 294 | 12.5% |
| Kindergarten | 115 | 4.9% |
| Elementary School | 541 | 23.0% |
| Middle School | 591 | 25.2% |
| High School | 615 | 26.2% |
| College / Undergraduate | 183 | 7.8% |
| Graduate / Professional | 10 | 0.4% |
| Total | 2,349 | 100.0% |
School Enrollment by Age by Funding Source in Jennings
Out of a total of 2,349 students who are enrolled in schools in Jennings, 287 (12.2%) attend a private institution, while the remaining 2,062 (87.8%) are enrolled in public schools. The age group of 3 to 4 year olds has the highest likelihood of being enrolled in private schools, with 86 (37.6% in the age bracket) enrolled. Conversely, the age group of 35 years and over has the lowest likelihood of being enrolled in a private school, with 50 (100.0% in the age bracket) attending a public institution.
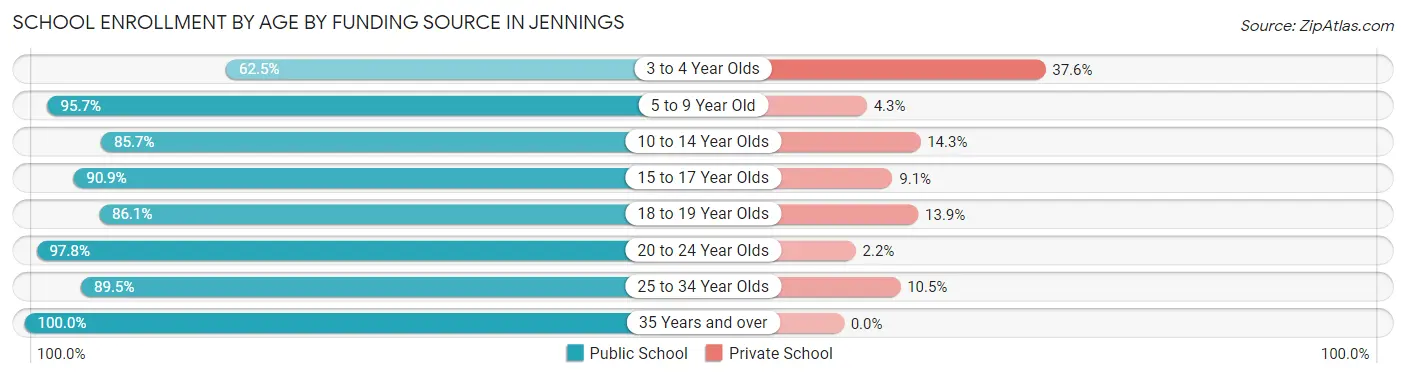
| Age Bracket | Public School | Private School |
| 3 to 4 Year Olds | 143 (62.5%) | 86 (37.6%) |
| 5 to 9 Year Old | 557 (95.7%) | 25 (4.3%) |
| 10 to 14 Year Olds | 589 (85.7%) | 98 (14.3%) |
| 15 to 17 Year Olds | 511 (90.9%) | 51 (9.1%) |
| 18 to 19 Year Olds | 118 (86.1%) | 19 (13.9%) |
| 20 to 24 Year Olds | 44 (97.8%) | 1 (2.2%) |
| 25 to 34 Year Olds | 51 (89.5%) | 6 (10.5%) |
| 35 Years and over | 50 (100.0%) | 0 (0.0%) |
| Total | 2,062 (87.8%) | 287 (12.2%) |
Educational Attainment by Field of Study in Jennings
Education (404 | 35.8%), business (199 | 17.7%), arts & humanities (132 | 11.7%), liberal arts & history (107 | 9.5%), and science & technology (88 | 7.8%) are the most common fields of study among 1,127 individuals in Jennings who have obtained a bachelor's degree or higher.
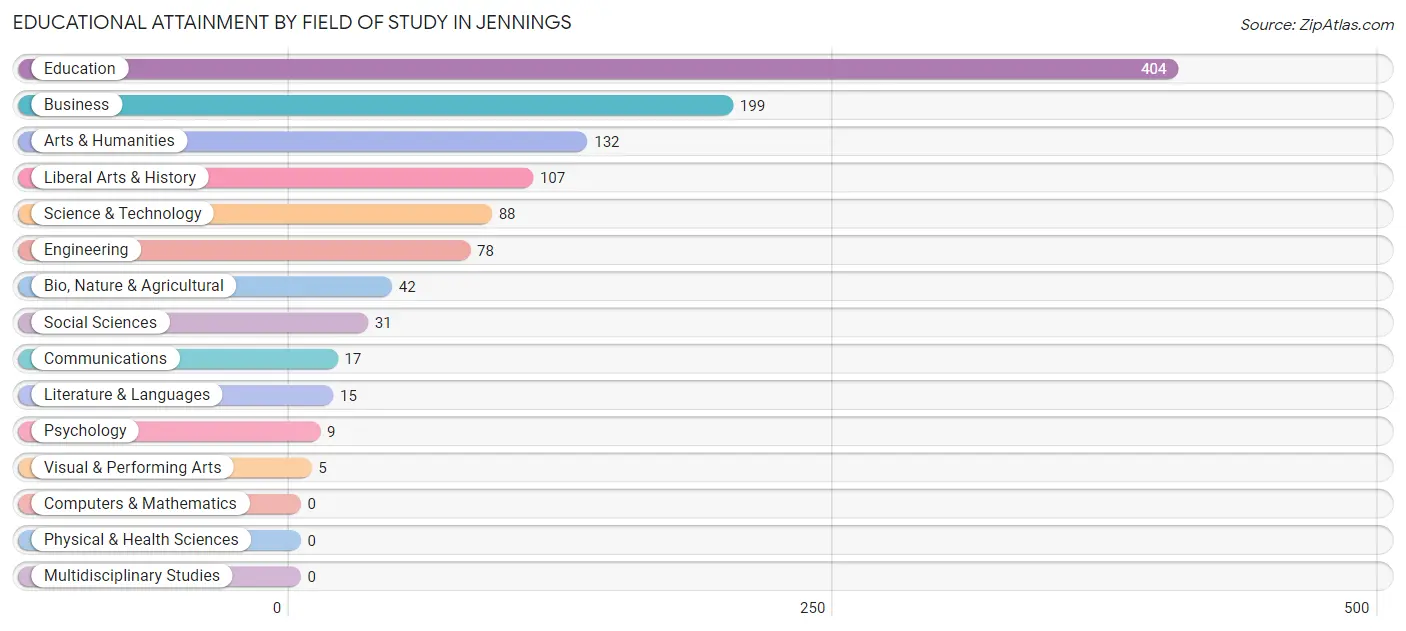
| Field of Study | # Graduates | % Graduates |
| Computers & Mathematics | 0 | 0.0% |
| Bio, Nature & Agricultural | 42 | 3.7% |
| Physical & Health Sciences | 0 | 0.0% |
| Psychology | 9 | 0.8% |
| Social Sciences | 31 | 2.8% |
| Engineering | 78 | 6.9% |
| Multidisciplinary Studies | 0 | 0.0% |
| Science & Technology | 88 | 7.8% |
| Business | 199 | 17.7% |
| Education | 404 | 35.8% |
| Literature & Languages | 15 | 1.3% |
| Liberal Arts & History | 107 | 9.5% |
| Visual & Performing Arts | 5 | 0.4% |
| Communications | 17 | 1.5% |
| Arts & Humanities | 132 | 11.7% |
| Total | 1,127 | 100.0% |
Transportation & Commute in Jennings
Vehicle Availability by Sex in Jennings
The most prevalent vehicle ownership categories in Jennings are males with 2 vehicles (962, accounting for 53.0%) and females with 2 vehicles (572, making up 59.8%).
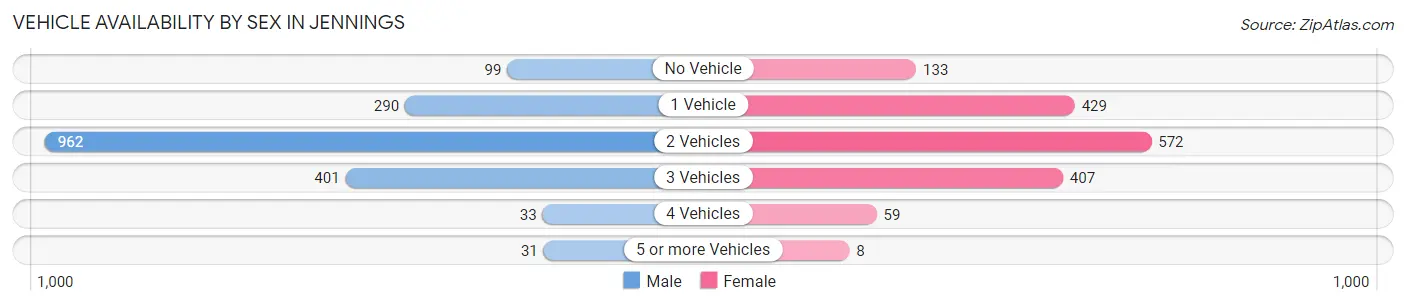
| Vehicles Available | Male | Female |
| No Vehicle | 99 (5.4%) | 133 (8.3%) |
| 1 Vehicle | 290 (16.0%) | 429 (26.7%) |
| 2 Vehicles | 962 (53.0%) | 572 (35.6%) |
| 3 Vehicles | 401 (22.1%) | 407 (25.3%) |
| 4 Vehicles | 33 (1.8%) | 59 (3.7%) |
| 5 or more Vehicles | 31 (1.7%) | 8 (0.5%) |
| Total | 1,816 (100.0%) | 1,608 (100.0%) |
Commute Time in Jennings
The most frequently occuring commute durations in Jennings are 5 to 9 minutes (837 commuters, 25.0%), 10 to 14 minutes (445 commuters, 13.3%), and less than 5 minutes (424 commuters, 12.7%).
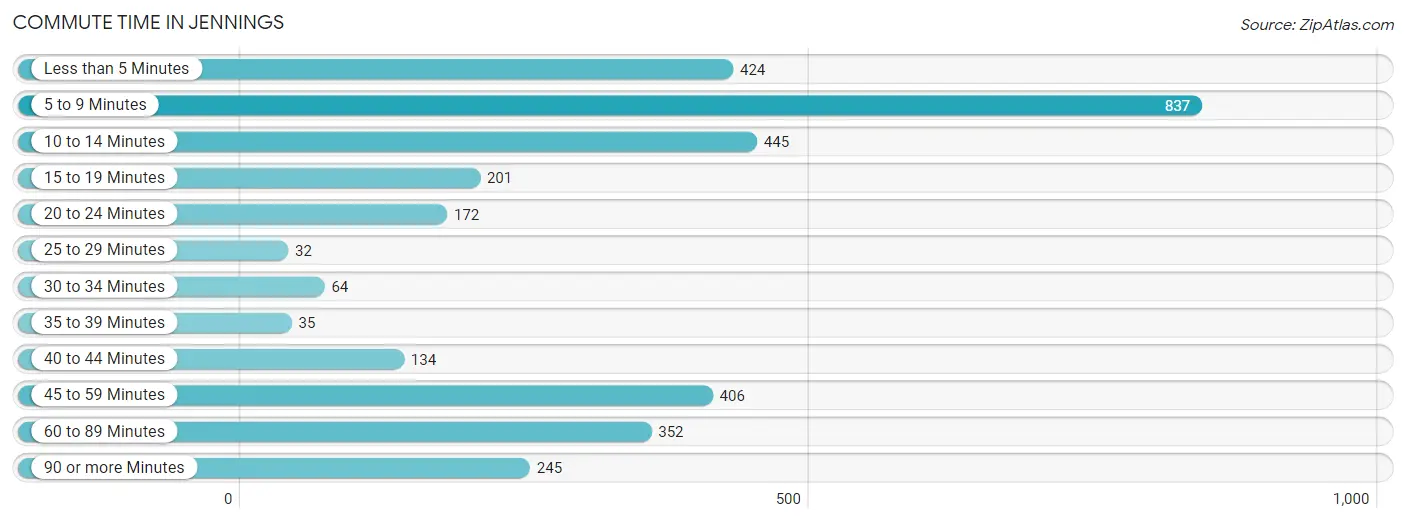
| Commute Time | # Commuters | % Commuters |
| Less than 5 Minutes | 424 | 12.7% |
| 5 to 9 Minutes | 837 | 25.0% |
| 10 to 14 Minutes | 445 | 13.3% |
| 15 to 19 Minutes | 201 | 6.0% |
| 20 to 24 Minutes | 172 | 5.1% |
| 25 to 29 Minutes | 32 | 1.0% |
| 30 to 34 Minutes | 64 | 1.9% |
| 35 to 39 Minutes | 35 | 1.1% |
| 40 to 44 Minutes | 134 | 4.0% |
| 45 to 59 Minutes | 406 | 12.1% |
| 60 to 89 Minutes | 352 | 10.5% |
| 90 or more Minutes | 245 | 7.3% |
Commute Time by Sex in Jennings
The most common commute times in Jennings are 5 to 9 minutes (400 commuters, 22.5%) for males and 5 to 9 minutes (437 commuters, 27.9%) for females.
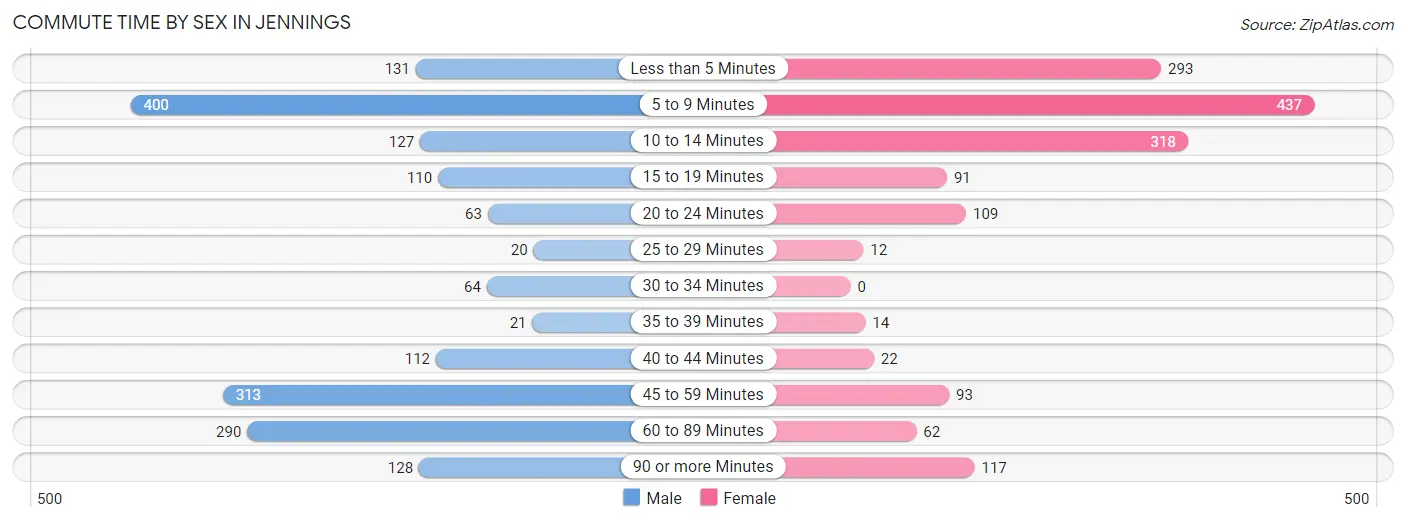
| Commute Time | Male | Female |
| Less than 5 Minutes | 131 (7.4%) | 293 (18.7%) |
| 5 to 9 Minutes | 400 (22.5%) | 437 (27.9%) |
| 10 to 14 Minutes | 127 (7.1%) | 318 (20.3%) |
| 15 to 19 Minutes | 110 (6.2%) | 91 (5.8%) |
| 20 to 24 Minutes | 63 (3.5%) | 109 (7.0%) |
| 25 to 29 Minutes | 20 (1.1%) | 12 (0.8%) |
| 30 to 34 Minutes | 64 (3.6%) | 0 (0.0%) |
| 35 to 39 Minutes | 21 (1.2%) | 14 (0.9%) |
| 40 to 44 Minutes | 112 (6.3%) | 22 (1.4%) |
| 45 to 59 Minutes | 313 (17.6%) | 93 (5.9%) |
| 60 to 89 Minutes | 290 (16.3%) | 62 (4.0%) |
| 90 or more Minutes | 128 (7.2%) | 117 (7.5%) |
Time of Departure to Work by Sex in Jennings
The most frequent times of departure to work in Jennings are 7:00 AM to 7:29 AM (279, 15.7%) for males and 7:30 AM to 7:59 AM (517, 33.0%) for females.
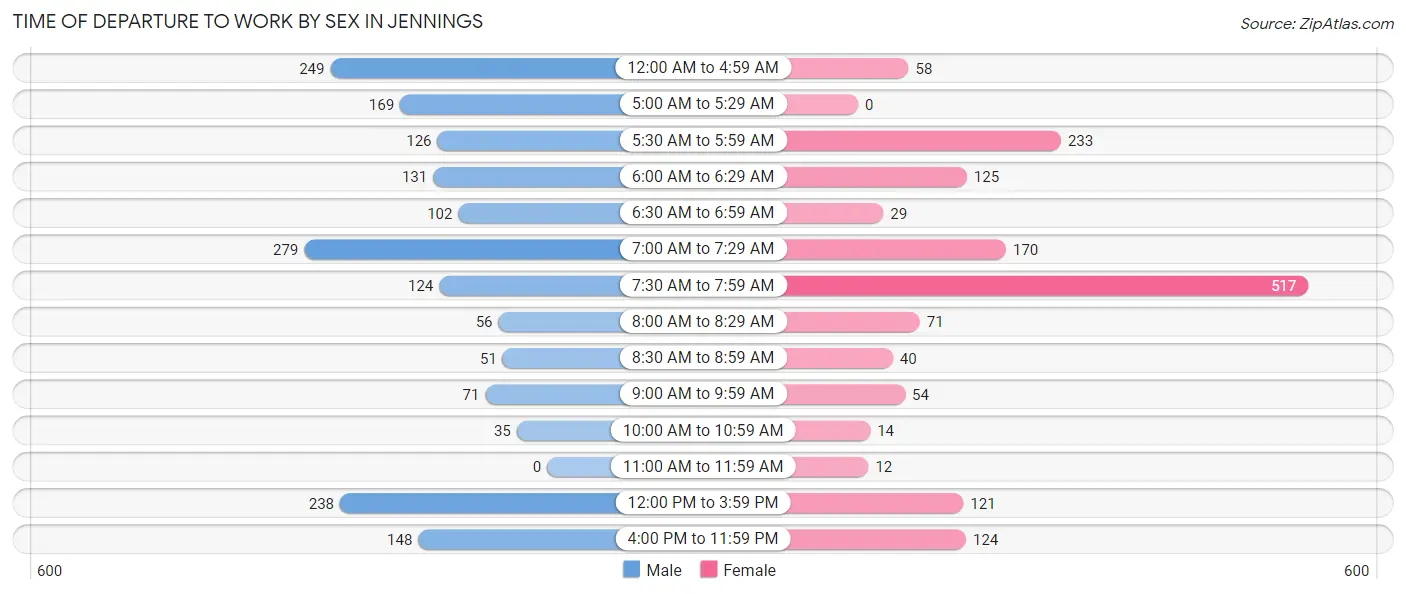
| Time of Departure | Male | Female |
| 12:00 AM to 4:59 AM | 249 (14.0%) | 58 (3.7%) |
| 5:00 AM to 5:29 AM | 169 (9.5%) | 0 (0.0%) |
| 5:30 AM to 5:59 AM | 126 (7.1%) | 233 (14.9%) |
| 6:00 AM to 6:29 AM | 131 (7.4%) | 125 (8.0%) |
| 6:30 AM to 6:59 AM | 102 (5.7%) | 29 (1.8%) |
| 7:00 AM to 7:29 AM | 279 (15.7%) | 170 (10.8%) |
| 7:30 AM to 7:59 AM | 124 (7.0%) | 517 (33.0%) |
| 8:00 AM to 8:29 AM | 56 (3.2%) | 71 (4.5%) |
| 8:30 AM to 8:59 AM | 51 (2.9%) | 40 (2.5%) |
| 9:00 AM to 9:59 AM | 71 (4.0%) | 54 (3.4%) |
| 10:00 AM to 10:59 AM | 35 (2.0%) | 14 (0.9%) |
| 11:00 AM to 11:59 AM | 0 (0.0%) | 12 (0.8%) |
| 12:00 PM to 3:59 PM | 238 (13.4%) | 121 (7.7%) |
| 4:00 PM to 11:59 PM | 148 (8.3%) | 124 (7.9%) |
| Total | 1,779 (100.0%) | 1,568 (100.0%) |
Housing Occupancy in Jennings
Occupancy by Ownership in Jennings
Of the total 4,040 dwellings in Jennings, owner-occupied units account for 2,689 (66.6%), while renter-occupied units make up 1,351 (33.4%).
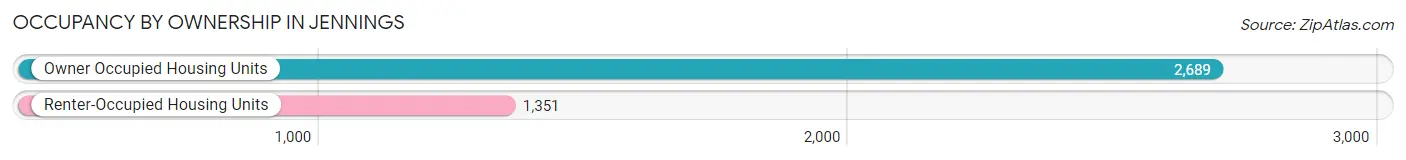
| Occupancy | # Housing Units | % Housing Units |
| Owner Occupied Housing Units | 2,689 | 66.6% |
| Renter-Occupied Housing Units | 1,351 | 33.4% |
| Total Occupied Housing Units | 4,040 | 100.0% |
Occupancy by Household Size in Jennings
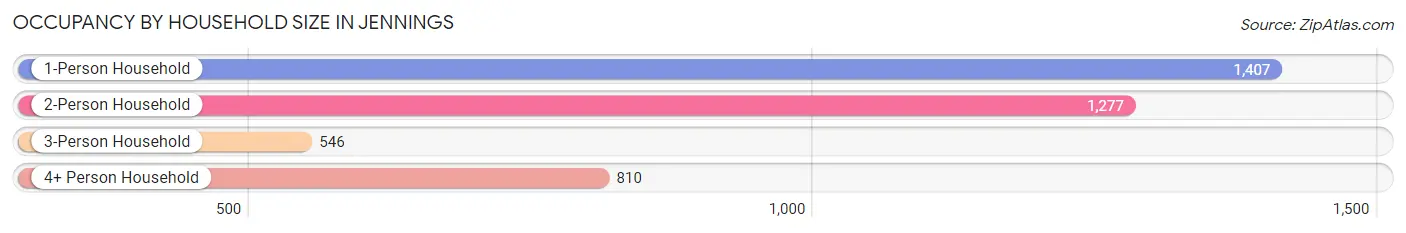
| Household Size | # Housing Units | % Housing Units |
| 1-Person Household | 1,407 | 34.8% |
| 2-Person Household | 1,277 | 31.6% |
| 3-Person Household | 546 | 13.5% |
| 4+ Person Household | 810 | 20.1% |
| Total Housing Units | 4,040 | 100.0% |
Occupancy by Ownership by Household Size in Jennings
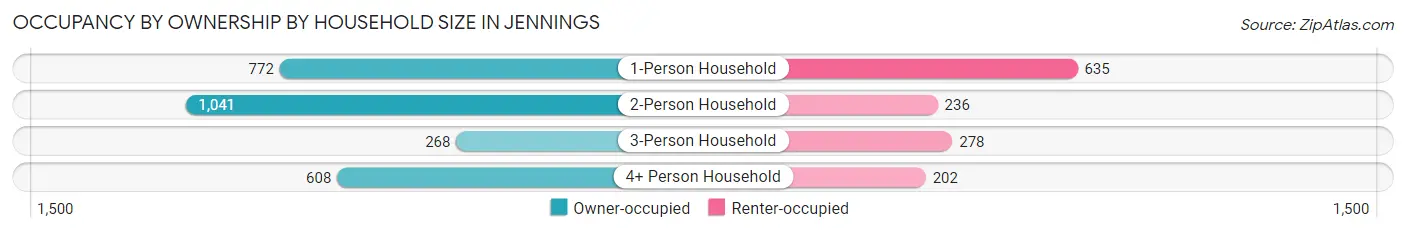
| Household Size | Owner-occupied | Renter-occupied |
| 1-Person Household | 772 (54.9%) | 635 (45.1%) |
| 2-Person Household | 1,041 (81.5%) | 236 (18.5%) |
| 3-Person Household | 268 (49.1%) | 278 (50.9%) |
| 4+ Person Household | 608 (75.1%) | 202 (24.9%) |
| Total Housing Units | 2,689 (66.6%) | 1,351 (33.4%) |
Occupancy by Educational Attainment in Jennings
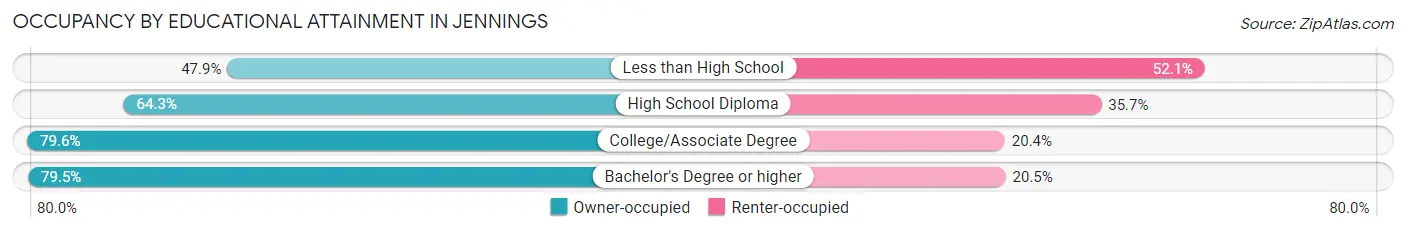
| Household Size | Owner-occupied | Renter-occupied |
| Less than High School | 437 (47.9%) | 476 (52.1%) |
| High School Diploma | 992 (64.3%) | 551 (35.7%) |
| College/Associate Degree | 784 (79.6%) | 201 (20.4%) |
| Bachelor's Degree or higher | 476 (79.5%) | 123 (20.5%) |
Occupancy by Age of Householder in Jennings
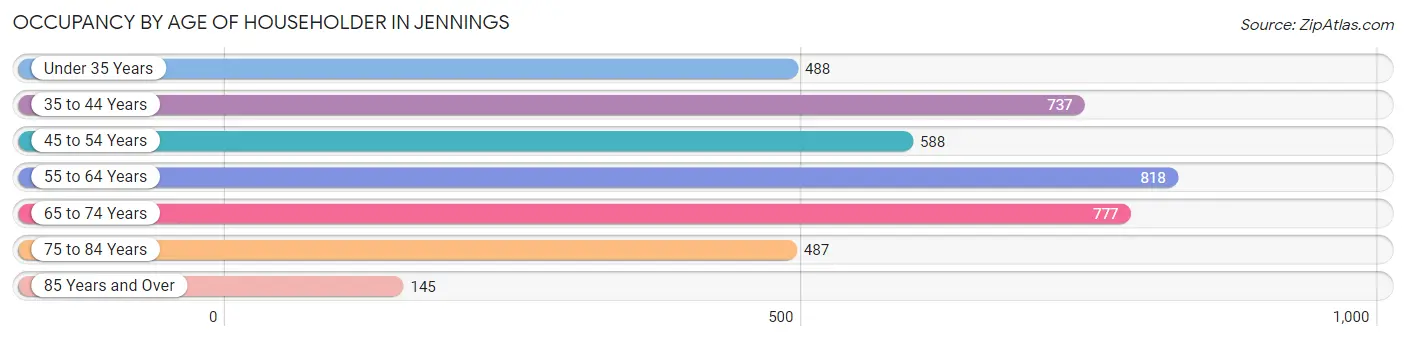
| Age Bracket | # Households | % Households |
| Under 35 Years | 488 | 12.1% |
| 35 to 44 Years | 737 | 18.2% |
| 45 to 54 Years | 588 | 14.5% |
| 55 to 64 Years | 818 | 20.3% |
| 65 to 74 Years | 777 | 19.2% |
| 75 to 84 Years | 487 | 12.0% |
| 85 Years and Over | 145 | 3.6% |
| Total | 4,040 | 100.0% |
Housing Finances in Jennings
Median Income by Occupancy in Jennings
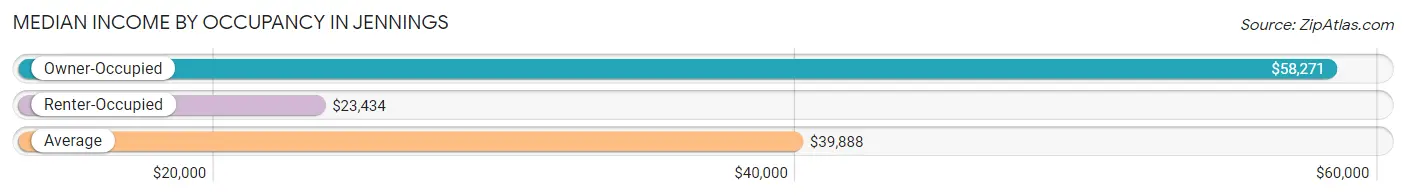
| Occupancy Type | # Households | Median Income |
| Owner-Occupied | 2,689 (66.6%) | $58,271 |
| Renter-Occupied | 1,351 (33.4%) | $23,434 |
| Average | 4,040 (100.0%) | $39,888 |
Occupancy by Householder Income Bracket in Jennings
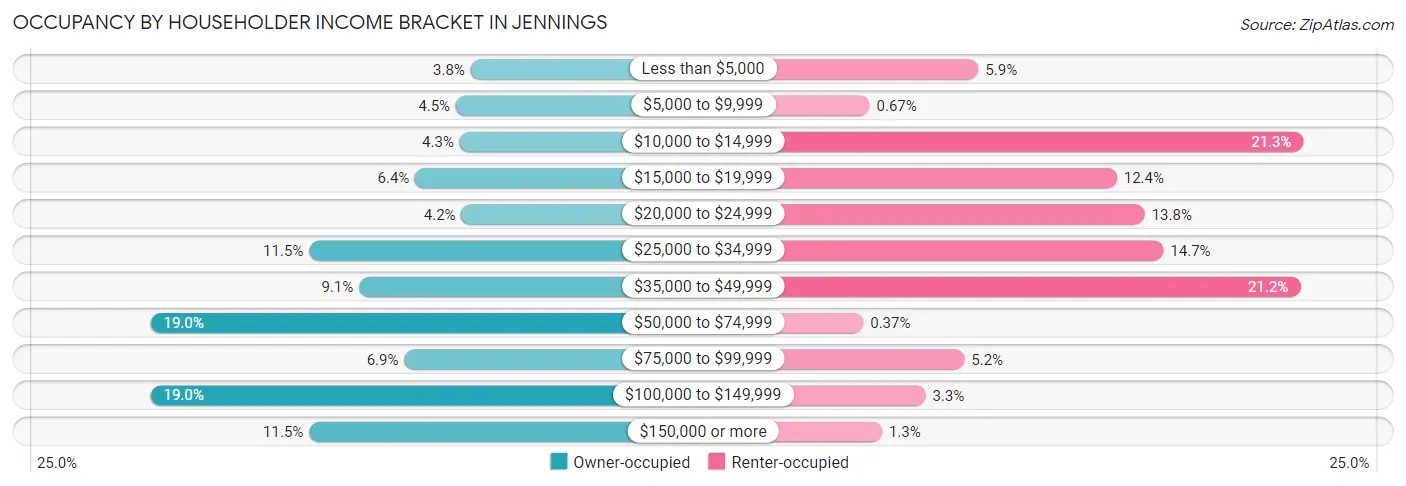
| Income Bracket | Owner-occupied | Renter-occupied |
| Less than $5,000 | 101 (3.8%) | 79 (5.9%) |
| $5,000 to $9,999 | 120 (4.5%) | 9 (0.7%) |
| $10,000 to $14,999 | 115 (4.3%) | 288 (21.3%) |
| $15,000 to $19,999 | 172 (6.4%) | 168 (12.4%) |
| $20,000 to $24,999 | 113 (4.2%) | 186 (13.8%) |
| $25,000 to $34,999 | 308 (11.5%) | 198 (14.7%) |
| $35,000 to $49,999 | 244 (9.1%) | 286 (21.2%) |
| $50,000 to $74,999 | 511 (19.0%) | 5 (0.4%) |
| $75,000 to $99,999 | 186 (6.9%) | 70 (5.2%) |
| $100,000 to $149,999 | 511 (19.0%) | 45 (3.3%) |
| $150,000 or more | 308 (11.5%) | 17 (1.3%) |
| Total | 2,689 (100.0%) | 1,351 (100.0%) |
Monthly Housing Cost Tiers in Jennings
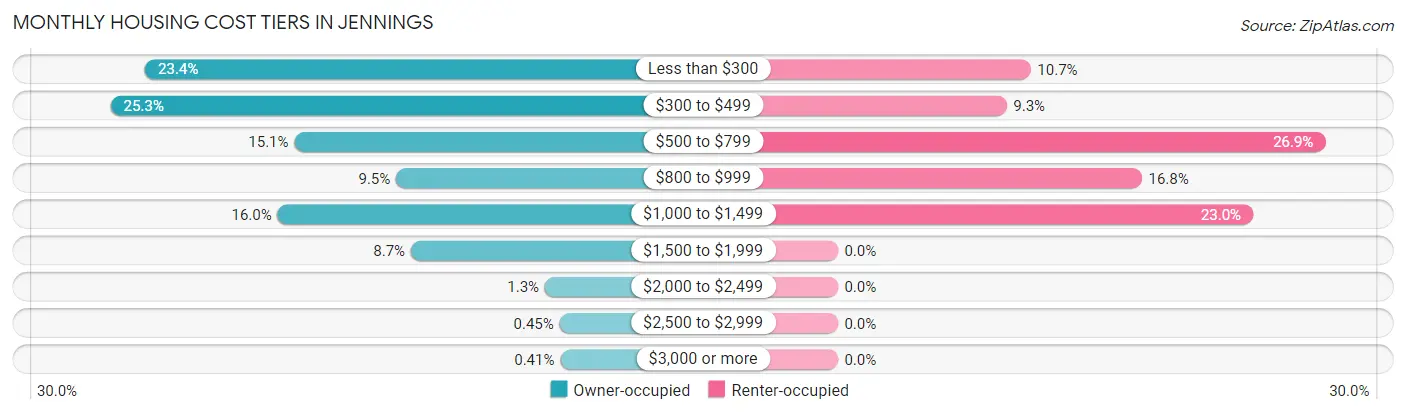
| Monthly Cost | Owner-occupied | Renter-occupied |
| Less than $300 | 628 (23.4%) | 144 (10.7%) |
| $300 to $499 | 679 (25.3%) | 126 (9.3%) |
| $500 to $799 | 406 (15.1%) | 364 (26.9%) |
| $800 to $999 | 255 (9.5%) | 227 (16.8%) |
| $1,000 to $1,499 | 431 (16.0%) | 310 (23.0%) |
| $1,500 to $1,999 | 233 (8.7%) | 0 (0.0%) |
| $2,000 to $2,499 | 34 (1.3%) | 0 (0.0%) |
| $2,500 to $2,999 | 12 (0.4%) | 0 (0.0%) |
| $3,000 or more | 11 (0.4%) | 0 (0.0%) |
| Total | 2,689 (100.0%) | 1,351 (100.0%) |
Physical Housing Characteristics in Jennings
Housing Structures in Jennings
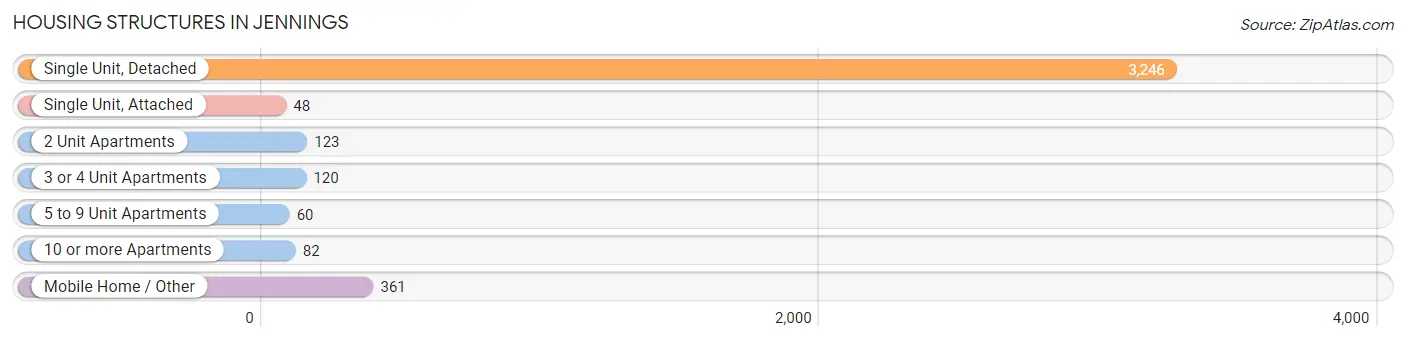
| Structure Type | # Housing Units | % Housing Units |
| Single Unit, Detached | 3,246 | 80.3% |
| Single Unit, Attached | 48 | 1.2% |
| 2 Unit Apartments | 123 | 3.0% |
| 3 or 4 Unit Apartments | 120 | 3.0% |
| 5 to 9 Unit Apartments | 60 | 1.5% |
| 10 or more Apartments | 82 | 2.0% |
| Mobile Home / Other | 361 | 8.9% |
| Total | 4,040 | 100.0% |
Housing Structures by Occupancy in Jennings
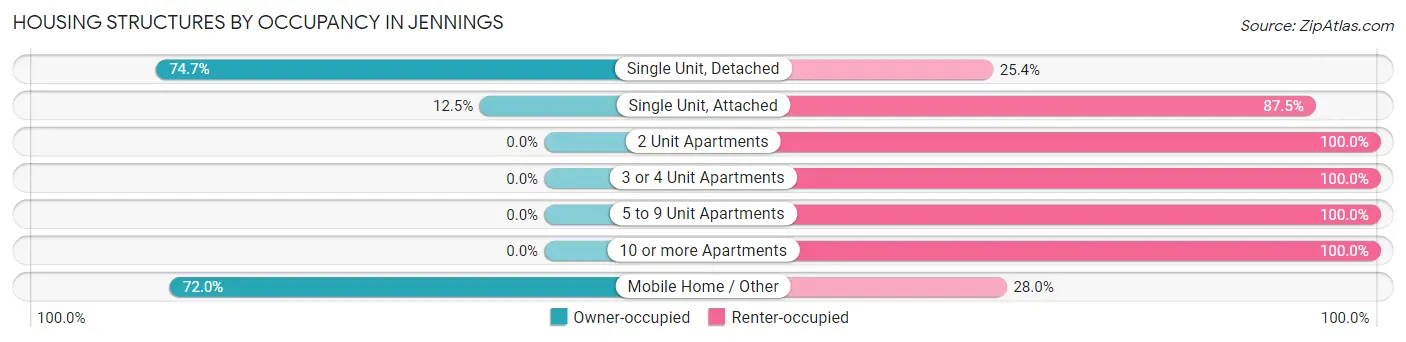
| Structure Type | Owner-occupied | Renter-occupied |
| Single Unit, Detached | 2,423 (74.7%) | 823 (25.4%) |
| Single Unit, Attached | 6 (12.5%) | 42 (87.5%) |
| 2 Unit Apartments | 0 (0.0%) | 123 (100.0%) |
| 3 or 4 Unit Apartments | 0 (0.0%) | 120 (100.0%) |
| 5 to 9 Unit Apartments | 0 (0.0%) | 60 (100.0%) |
| 10 or more Apartments | 0 (0.0%) | 82 (100.0%) |
| Mobile Home / Other | 260 (72.0%) | 101 (28.0%) |
| Total | 2,689 (66.6%) | 1,351 (33.4%) |
Housing Structures by Number of Rooms in Jennings
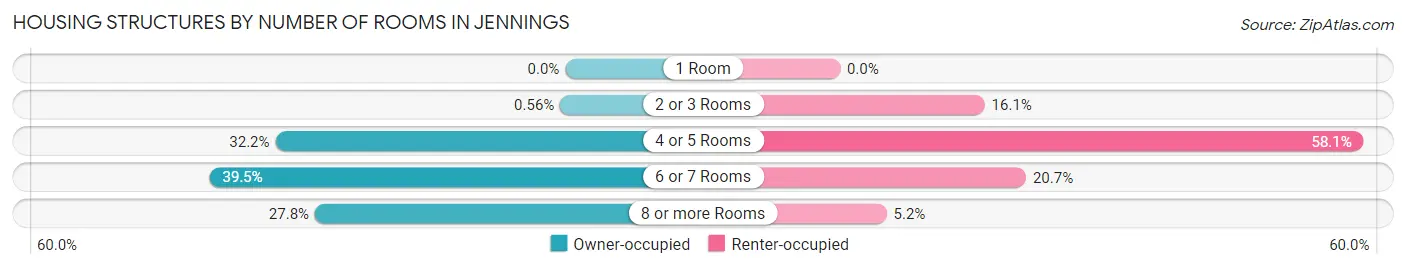
| Number of Rooms | Owner-occupied | Renter-occupied |
| 1 Room | 0 (0.0%) | 0 (0.0%) |
| 2 or 3 Rooms | 15 (0.6%) | 217 (16.1%) |
| 4 or 5 Rooms | 865 (32.2%) | 785 (58.1%) |
| 6 or 7 Rooms | 1,062 (39.5%) | 279 (20.6%) |
| 8 or more Rooms | 747 (27.8%) | 70 (5.2%) |
| Total | 2,689 (100.0%) | 1,351 (100.0%) |
Housing Structure by Heating Type in Jennings
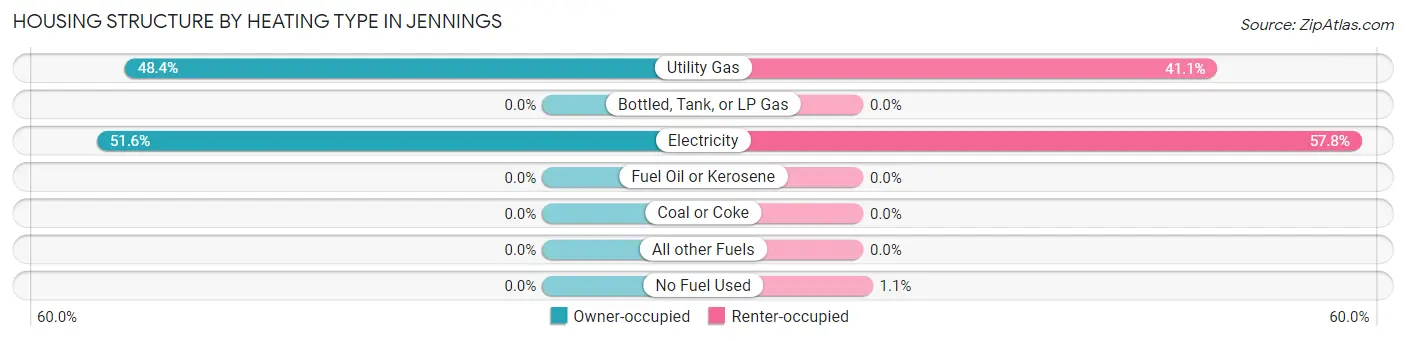
| Heating Type | Owner-occupied | Renter-occupied |
| Utility Gas | 1,301 (48.4%) | 555 (41.1%) |
| Bottled, Tank, or LP Gas | 0 (0.0%) | 0 (0.0%) |
| Electricity | 1,388 (51.6%) | 781 (57.8%) |
| Fuel Oil or Kerosene | 0 (0.0%) | 0 (0.0%) |
| Coal or Coke | 0 (0.0%) | 0 (0.0%) |
| All other Fuels | 0 (0.0%) | 0 (0.0%) |
| No Fuel Used | 0 (0.0%) | 15 (1.1%) |
| Total | 2,689 (100.0%) | 1,351 (100.0%) |
Household Vehicle Usage in Jennings
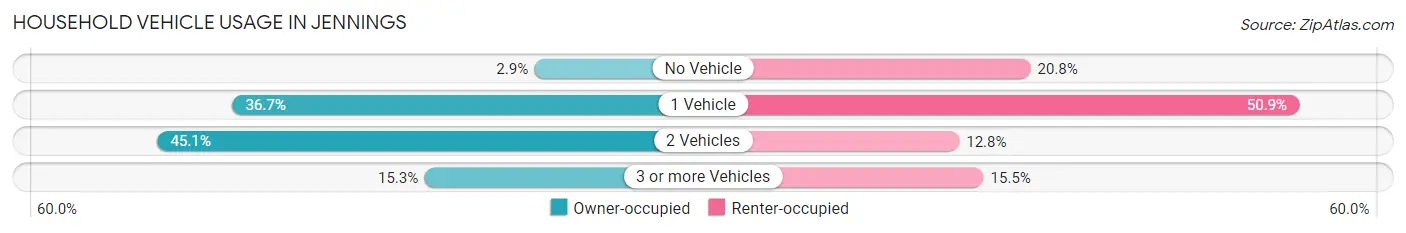
| Vehicles per Household | Owner-occupied | Renter-occupied |
| No Vehicle | 79 (2.9%) | 281 (20.8%) |
| 1 Vehicle | 987 (36.7%) | 687 (50.8%) |
| 2 Vehicles | 1,213 (45.1%) | 173 (12.8%) |
| 3 or more Vehicles | 410 (15.2%) | 210 (15.5%) |
| Total | 2,689 (100.0%) | 1,351 (100.0%) |
Real Estate & Mortgages in Jennings
Real Estate and Mortgage Overview in Jennings
| Characteristic | Without Mortgage | With Mortgage |
| Housing Units | 1,546 | 1,143 |
| Median Property Value | $122,500 | $145,800 |
| Median Household Income | $50,069 | $185 |
| Monthly Housing Costs | $336 | $11 |
| Real Estate Taxes | $229 | $31 |
Property Value by Mortgage Status in Jennings
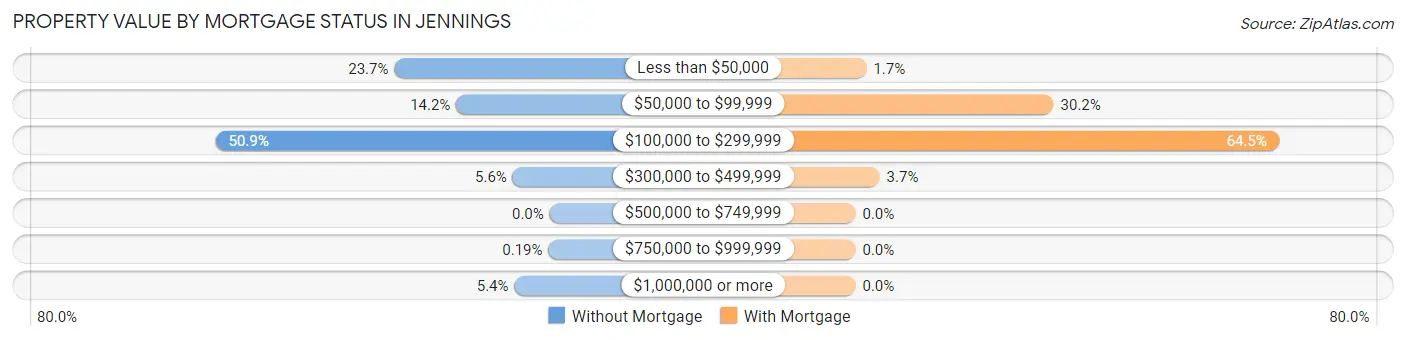
| Property Value | Without Mortgage | With Mortgage |
| Less than $50,000 | 366 (23.7%) | 19 (1.7%) |
| $50,000 to $99,999 | 220 (14.2%) | 345 (30.2%) |
| $100,000 to $299,999 | 787 (50.9%) | 737 (64.5%) |
| $300,000 to $499,999 | 87 (5.6%) | 42 (3.7%) |
| $500,000 to $749,999 | 0 (0.0%) | 0 (0.0%) |
| $750,000 to $999,999 | 3 (0.2%) | 0 (0.0%) |
| $1,000,000 or more | 83 (5.4%) | 0 (0.0%) |
| Total | 1,546 (100.0%) | 1,143 (100.0%) |
Household Income by Mortgage Status in Jennings
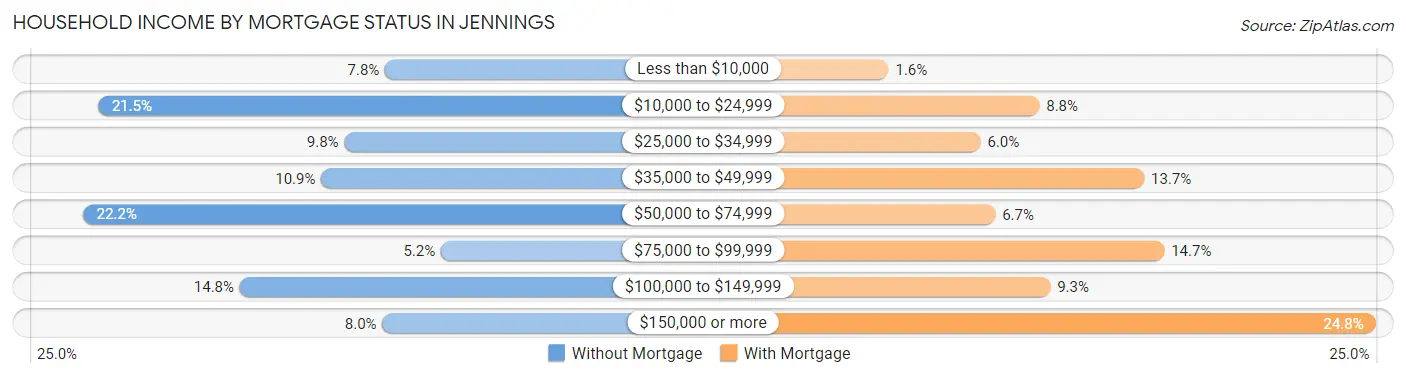
| Household Income | Without Mortgage | With Mortgage |
| Less than $10,000 | 121 (7.8%) | 18 (1.6%) |
| $10,000 to $24,999 | 332 (21.5%) | 100 (8.7%) |
| $25,000 to $34,999 | 151 (9.8%) | 68 (5.9%) |
| $35,000 to $49,999 | 168 (10.9%) | 157 (13.7%) |
| $50,000 to $74,999 | 343 (22.2%) | 76 (6.7%) |
| $75,000 to $99,999 | 80 (5.2%) | 168 (14.7%) |
| $100,000 to $149,999 | 228 (14.7%) | 106 (9.3%) |
| $150,000 or more | 123 (8.0%) | 283 (24.8%) |
| Total | 1,546 (100.0%) | 1,143 (100.0%) |
Property Value to Household Income Ratio in Jennings
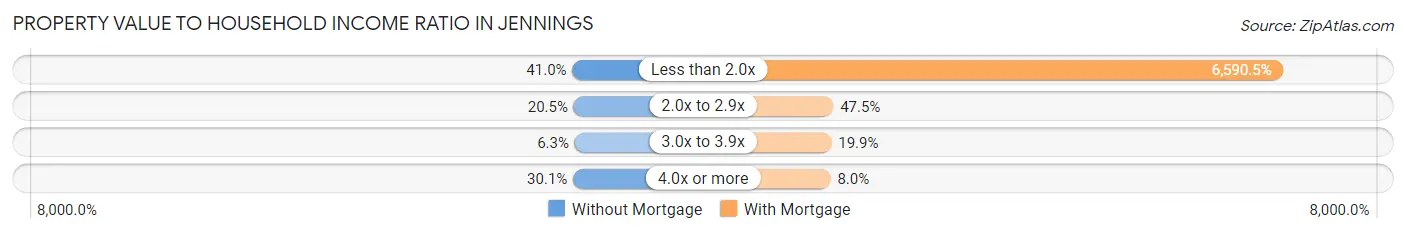
| Value-to-Income Ratio | Without Mortgage | With Mortgage |
| Less than 2.0x | 634 (41.0%) | 75,329 (6,590.5%) |
| 2.0x to 2.9x | 317 (20.5%) | 543 (47.5%) |
| 3.0x to 3.9x | 97 (6.3%) | 227 (19.9%) |
| 4.0x or more | 465 (30.1%) | 91 (8.0%) |
| Total | 1,546 (100.0%) | 1,143 (100.0%) |
Real Estate Taxes by Mortgage Status in Jennings
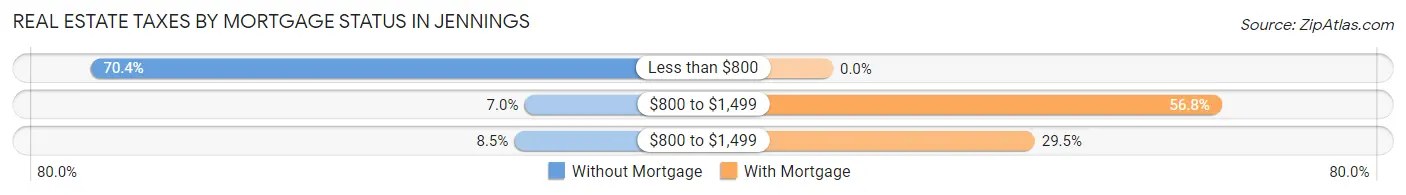
| Property Taxes | Without Mortgage | With Mortgage |
| Less than $800 | 1,088 (70.4%) | 0 (0.0%) |
| $800 to $1,499 | 108 (7.0%) | 649 (56.8%) |
| $800 to $1,499 | 131 (8.5%) | 337 (29.5%) |
| Total | 1,546 (100.0%) | 1,143 (100.0%) |
Health & Disability in Jennings
Health Insurance Coverage by Age in Jennings
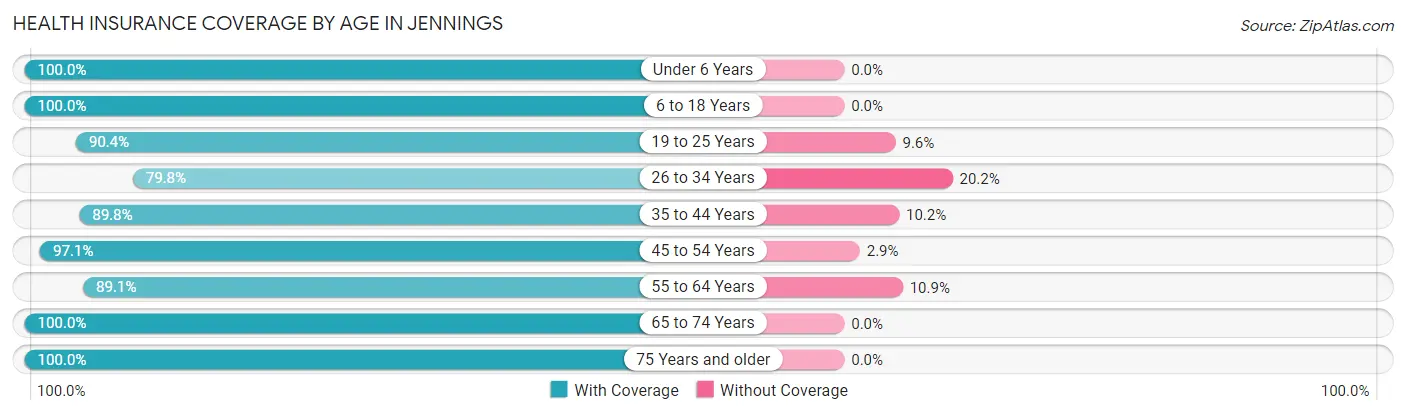
| Age Bracket | With Coverage | Without Coverage |
| Under 6 Years | 846 (100.0%) | 0 (0.0%) |
| 6 to 18 Years | 1,919 (100.0%) | 0 (0.0%) |
| 19 to 25 Years | 539 (90.4%) | 57 (9.6%) |
| 26 to 34 Years | 799 (79.8%) | 202 (20.2%) |
| 35 to 44 Years | 967 (89.8%) | 110 (10.2%) |
| 45 to 54 Years | 840 (97.1%) | 25 (2.9%) |
| 55 to 64 Years | 1,055 (89.1%) | 129 (10.9%) |
| 65 to 74 Years | 1,175 (100.0%) | 0 (0.0%) |
| 75 Years and older | 789 (100.0%) | 0 (0.0%) |
| Total | 8,929 (94.5%) | 523 (5.5%) |
Health Insurance Coverage by Citizenship Status in Jennings
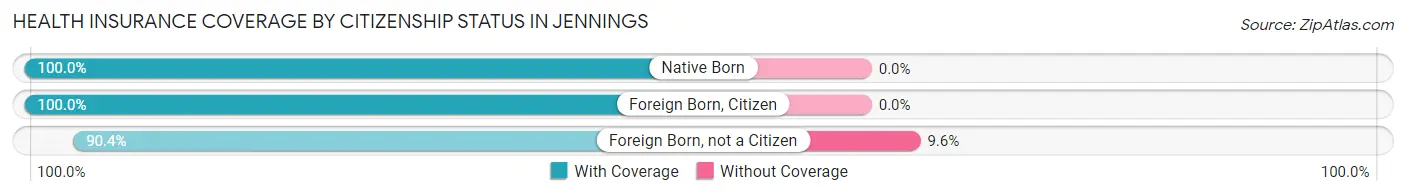
| Citizenship Status | With Coverage | Without Coverage |
| Native Born | 846 (100.0%) | 0 (0.0%) |
| Foreign Born, Citizen | 1,919 (100.0%) | 0 (0.0%) |
| Foreign Born, not a Citizen | 539 (90.4%) | 57 (9.6%) |
Health Insurance Coverage by Household Income in Jennings
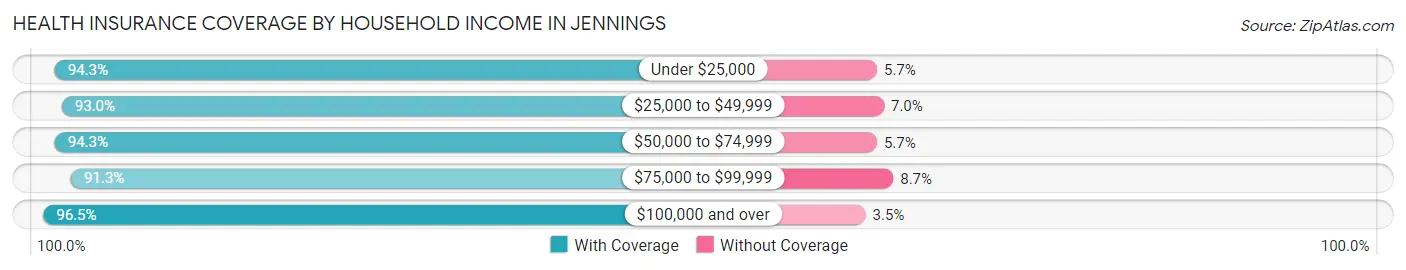
| Household Income | With Coverage | Without Coverage |
| Under $25,000 | 2,312 (94.3%) | 139 (5.7%) |
| $25,000 to $49,999 | 1,746 (93.0%) | 131 (7.0%) |
| $50,000 to $74,999 | 1,166 (94.3%) | 70 (5.7%) |
| $75,000 to $99,999 | 818 (91.3%) | 78 (8.7%) |
| $100,000 and over | 2,874 (96.5%) | 105 (3.5%) |
Public vs Private Health Insurance Coverage by Age in Jennings
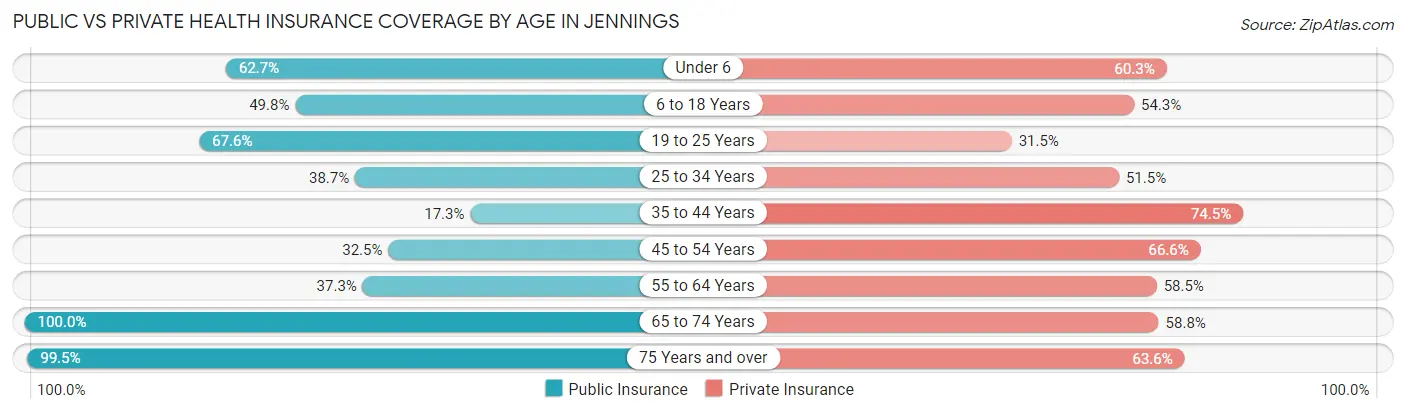
| Age Bracket | Public Insurance | Private Insurance |
| Under 6 | 530 (62.6%) | 510 (60.3%) |
| 6 to 18 Years | 955 (49.8%) | 1,041 (54.2%) |
| 19 to 25 Years | 403 (67.6%) | 188 (31.5%) |
| 25 to 34 Years | 387 (38.7%) | 515 (51.4%) |
| 35 to 44 Years | 186 (17.3%) | 802 (74.5%) |
| 45 to 54 Years | 281 (32.5%) | 576 (66.6%) |
| 55 to 64 Years | 441 (37.2%) | 692 (58.5%) |
| 65 to 74 Years | 1,175 (100.0%) | 691 (58.8%) |
| 75 Years and over | 785 (99.5%) | 502 (63.6%) |
| Total | 5,143 (54.4%) | 5,517 (58.4%) |
Disability Status by Sex by Age in Jennings
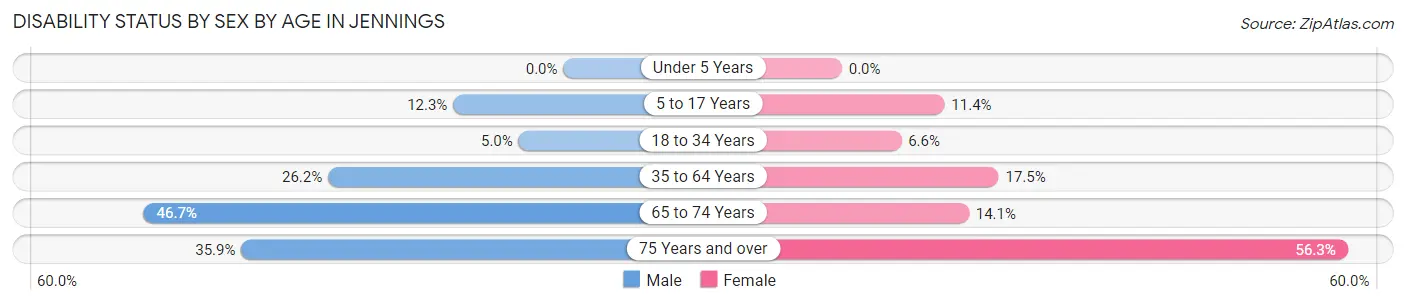
| Age Bracket | Male | Female |
| Under 5 Years | 0 (0.0%) | 0 (0.0%) |
| 5 to 17 Years | 128 (12.3%) | 101 (11.4%) |
| 18 to 34 Years | 40 (5.0%) | 60 (6.6%) |
| 35 to 64 Years | 390 (26.2%) | 286 (17.5%) |
| 65 to 74 Years | 222 (46.7%) | 99 (14.1%) |
| 75 Years and over | 113 (35.9%) | 267 (56.3%) |
Disability Class by Sex by Age in Jennings
Disability Class: Hearing Difficulty
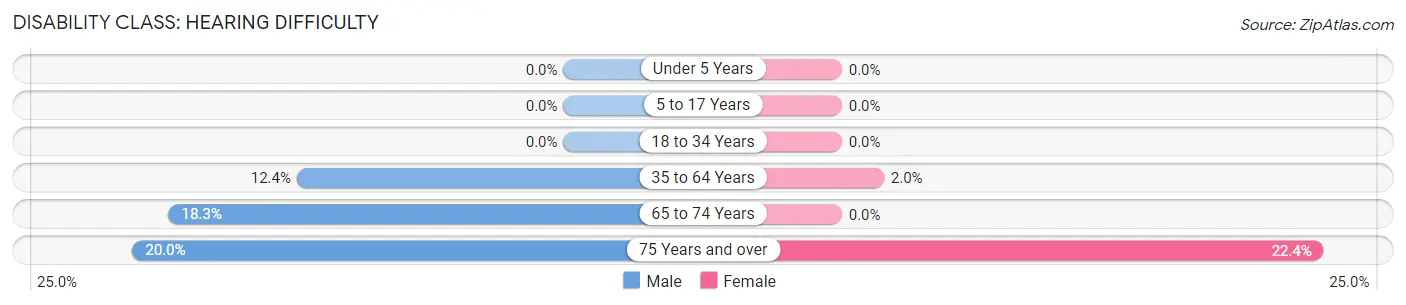
| Age Bracket | Male | Female |
| Under 5 Years | 0 (0.0%) | 0 (0.0%) |
| 5 to 17 Years | 0 (0.0%) | 0 (0.0%) |
| 18 to 34 Years | 0 (0.0%) | 0 (0.0%) |
| 35 to 64 Years | 184 (12.4%) | 32 (1.9%) |
| 65 to 74 Years | 87 (18.3%) | 0 (0.0%) |
| 75 Years and over | 63 (20.0%) | 106 (22.4%) |
Disability Class: Vision Difficulty
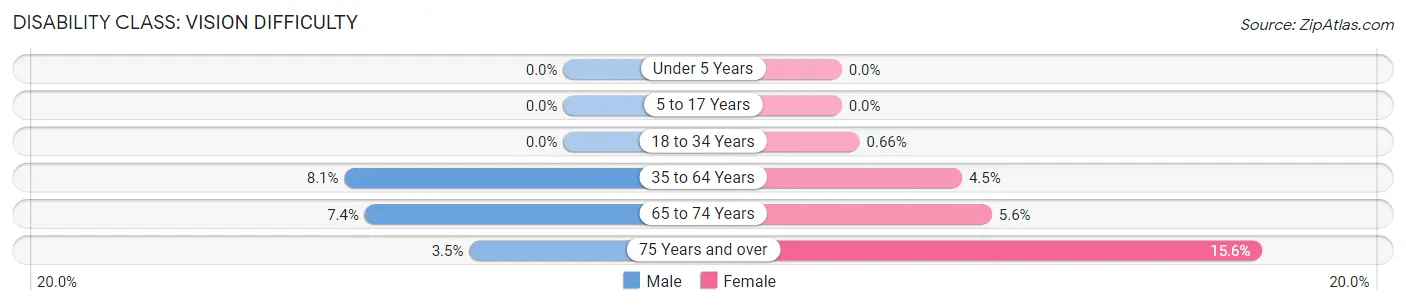
| Age Bracket | Male | Female |
| Under 5 Years | 0 (0.0%) | 0 (0.0%) |
| 5 to 17 Years | 0 (0.0%) | 0 (0.0%) |
| 18 to 34 Years | 0 (0.0%) | 6 (0.7%) |
| 35 to 64 Years | 121 (8.1%) | 73 (4.5%) |
| 65 to 74 Years | 35 (7.4%) | 39 (5.6%) |
| 75 Years and over | 11 (3.5%) | 74 (15.6%) |
Disability Class: Cognitive Difficulty
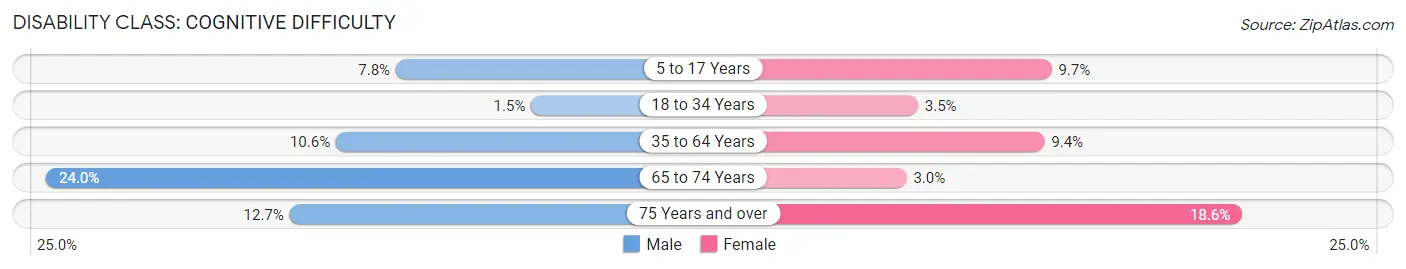
| Age Bracket | Male | Female |
| 5 to 17 Years | 81 (7.8%) | 86 (9.7%) |
| 18 to 34 Years | 12 (1.5%) | 32 (3.5%) |
| 35 to 64 Years | 157 (10.5%) | 154 (9.4%) |
| 65 to 74 Years | 114 (24.0%) | 21 (3.0%) |
| 75 Years and over | 40 (12.7%) | 88 (18.6%) |
Disability Class: Ambulatory Difficulty
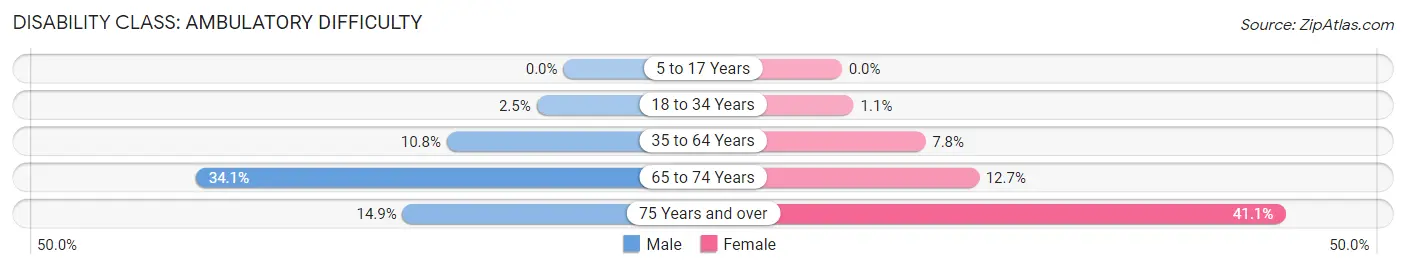
| Age Bracket | Male | Female |
| 5 to 17 Years | 0 (0.0%) | 0 (0.0%) |
| 18 to 34 Years | 20 (2.5%) | 10 (1.1%) |
| 35 to 64 Years | 161 (10.8%) | 127 (7.7%) |
| 65 to 74 Years | 162 (34.1%) | 89 (12.7%) |
| 75 Years and over | 47 (14.9%) | 195 (41.1%) |
Disability Class: Self-Care Difficulty
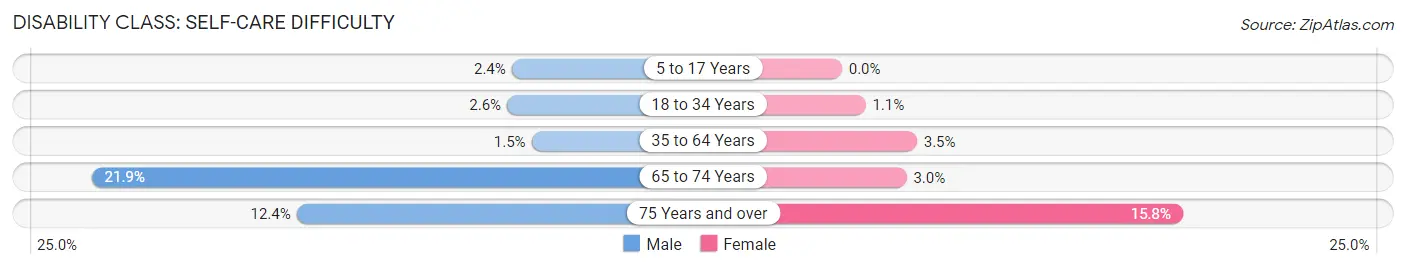
| Age Bracket | Male | Female |
| 5 to 17 Years | 25 (2.4%) | 0 (0.0%) |
| 18 to 34 Years | 21 (2.6%) | 10 (1.1%) |
| 35 to 64 Years | 22 (1.5%) | 57 (3.5%) |
| 65 to 74 Years | 104 (21.9%) | 21 (3.0%) |
| 75 Years and over | 39 (12.4%) | 75 (15.8%) |
Technology Access in Jennings
Computing Device Access in Jennings
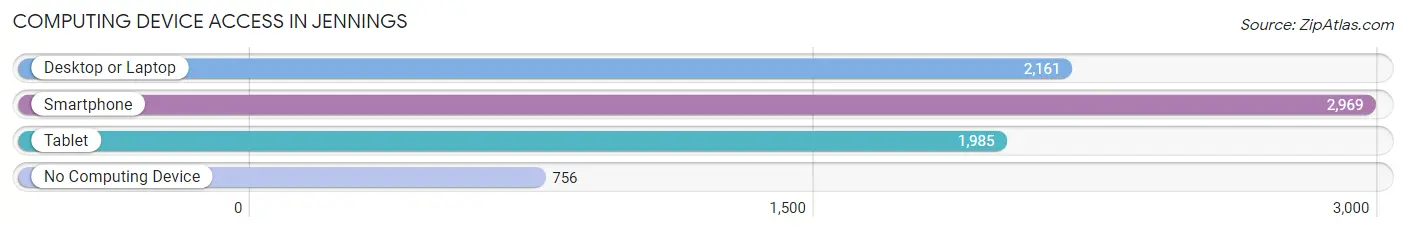
| Device Type | # Households | % Households |
| Desktop or Laptop | 2,161 | 53.5% |
| Smartphone | 2,969 | 73.5% |
| Tablet | 1,985 | 49.1% |
| No Computing Device | 756 | 18.7% |
| Total | 4,040 | 100.0% |
Internet Access in Jennings
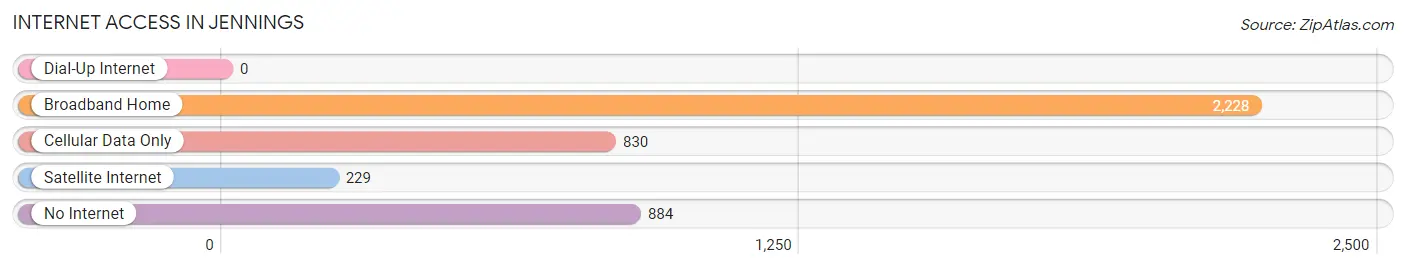
| Internet Type | # Households | % Households |
| Dial-Up Internet | 0 | 0.0% |
| Broadband Home | 2,228 | 55.1% |
| Cellular Data Only | 830 | 20.5% |
| Satellite Internet | 229 | 5.7% |
| No Internet | 884 | 21.9% |
| Total | 4,040 | 100.0% |
Jennings Summary
Jennings is a city located in Jefferson Davis Parish, Louisiana. It is the parish seat and the largest city in the parish. The population of Jennings was 10,383 at the 2010 census, an increase of 4.3% since 2000.
History
Jennings was founded in 1883 by the Jennings Land and Lumber Company. The company was owned by brothers John and William Jennings, who had moved to the area from Mississippi. The brothers had purchased the land from the heirs of the original Spanish land grant. The town was named after the brothers and was incorporated in 1892.
In the early 1900s, Jennings became a center for the lumber industry. The town was also home to a number of sawmills and other businesses related to the lumber industry. The town also had a number of stores, hotels, and other businesses.
In the 1920s, Jennings began to experience a decline in the lumber industry. This was due to the depletion of the local timber resources and the Great Depression. The town was able to survive this period by diversifying its economy.
In the 1950s, Jennings experienced a resurgence in the lumber industry. This was due to the discovery of new timber resources in the area. The town also experienced a population boom during this time.
Geography
Jennings is located in the southwestern corner of Jefferson Davis Parish. It is situated on the banks of the Mermentau River. The city is located about 30 miles south of Lake Charles and about 50 miles east of Lafayette.
The city has a total area of 5.3 square miles, all of which is land. The terrain is mostly flat with some rolling hills. The climate is humid subtropical, with hot, humid summers and mild winters.
Economy
The economy of Jennings is largely based on the oil and gas industry. The city is home to several oil and gas companies, including Chevron, Shell, and ExxonMobil. The city is also home to a number of other businesses, including manufacturing, retail, and healthcare.
The city is also home to a number of educational institutions, including McNeese State University and the Jennings Technical Institute.
Demographics
As of the 2010 census, the population of Jennings was 10,383. The racial makeup of the city was 70.3% White, 24.2% African American, 0.4% Native American, 0.7% Asian, 0.1% Pacific Islander, 2.2% from other races, and 2.1% from two or more races. Hispanic or Latino of any race were 4.7% of the population.
The median income for a household in the city was $30,945, and the median income for a family was $37,917. The per capita income for the city was $17,845. About 19.2% of the population was below the poverty line.
Jennings is a diverse city with a rich history and a vibrant economy. The city is home to a number of businesses, educational institutions, and other attractions. The city is also home to a number of cultural and recreational activities, making it an ideal place to live and work.
Common Questions
What is Per Capita Income in Jennings?
Per Capita income in Jennings is $26,074.
What is the Median Family Income in Jennings?
Median Family Income in Jennings is $60,731.
What is the Median Household income in Jennings?
Median Household Income in Jennings is $39,888.
What is Income or Wage Gap in Jennings?
Income or Wage Gap in Jennings is 50.0%.
Women in Jennings earn 50.0 cents for every dollar earned by a man.
What is Family Income Deficit in Jennings?
Family Income Deficit in Jennings is $11,474.
Families that are below poverty line in Jennings earn $11,474 less on average than the poverty threshold level.
What is Inequality or Gini Index in Jennings?
Inequality or Gini Index in Jennings is 0.50.
What is the Total Population of Jennings?
Total Population of Jennings is 9,819.
What is the Total Male Population of Jennings?
Total Male Population of Jennings is 4,722.
What is the Total Female Population of Jennings?
Total Female Population of Jennings is 5,097.
What is the Ratio of Males per 100 Females in Jennings?
There are 92.64 Males per 100 Females in Jennings.
What is the Ratio of Females per 100 Males in Jennings?
There are 107.94 Females per 100 Males in Jennings.
What is the Median Population Age in Jennings?
Median Population Age in Jennings is 37.1 Years.
What is the Average Family Size in Jennings
Average Family Size in Jennings is 2.9 People.
What is the Average Household Size in Jennings
Average Household Size in Jennings is 2.3 People.
How Large is the Labor Force in Jennings?
There are 3,690 People in the Labor Forcein in Jennings.
What is the Percentage of People in the Labor Force in Jennings?
49.3% of People are in the Labor Force in Jennings.
What is the Unemployment Rate in Jennings?
Unemployment Rate in Jennings is 5.1%.