Belle Chasse, LA Map & Demographics
Belle Chasse Map
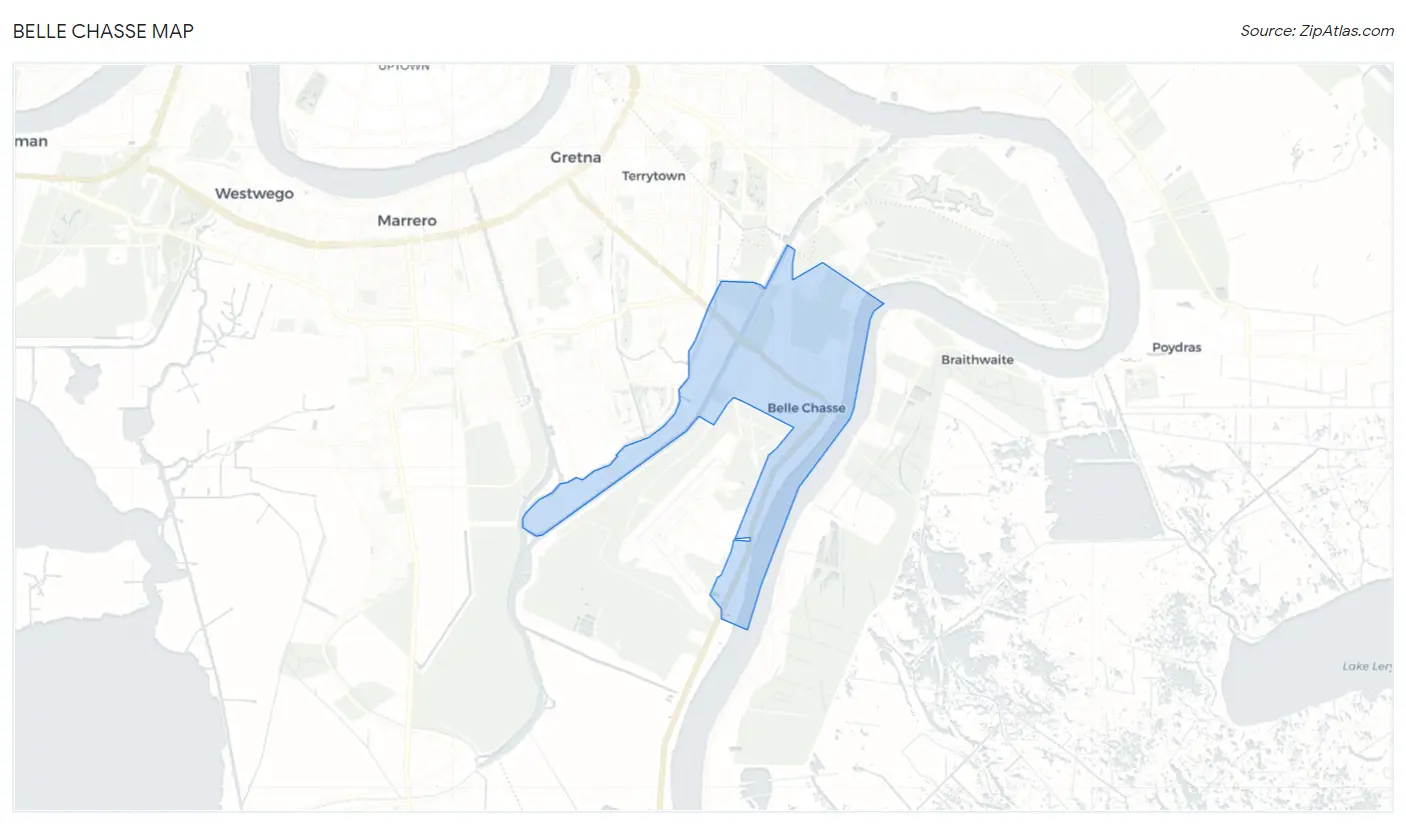
Belle Chasse Overview
$41,226
PER CAPITA INCOME
$109,151
AVG FAMILY INCOME
$92,059
AVG HOUSEHOLD INCOME
52.1%
WAGE / INCOME GAP [ % ]
47.9¢/ $1
WAGE / INCOME GAP [ $ ]
0.43
INEQUALITY / GINI INDEX
10,781
TOTAL POPULATION
5,236
MALE POPULATION
5,545
FEMALE POPULATION
94.43
MALES / 100 FEMALES
105.90
FEMALES / 100 MALES
39.2
MEDIAN AGE
3.2
AVG FAMILY SIZE
2.8
AVG HOUSEHOLD SIZE
5,836
LABOR FORCE [ PEOPLE ]
66.3%
PERCENT IN LABOR FORCE
3.0%
UNEMPLOYMENT RATE
Belle Chasse Zip Codes
Belle Chasse Area Codes
Income in Belle Chasse
Income Overview in Belle Chasse
Per Capita Income in Belle Chasse is $41,226, while median incomes of families and households are $109,151 and $92,059 respectively.
| Characteristic | Number | Measure |
| Per Capita Income | 10,781 | $41,226 |
| Median Family Income | 3,029 | $109,151 |
| Mean Family Income | 3,029 | $134,711 |
| Median Household Income | 3,794 | $92,059 |
| Mean Household Income | 3,794 | $117,032 |
| Income Deficit | 3,029 | $0 |
| Wage / Income Gap (%) | 10,781 | 52.08% |
| Wage / Income Gap ($) | 10,781 | 47.92¢ per $1 |
| Gini / Inequality Index | 10,781 | 0.43 |
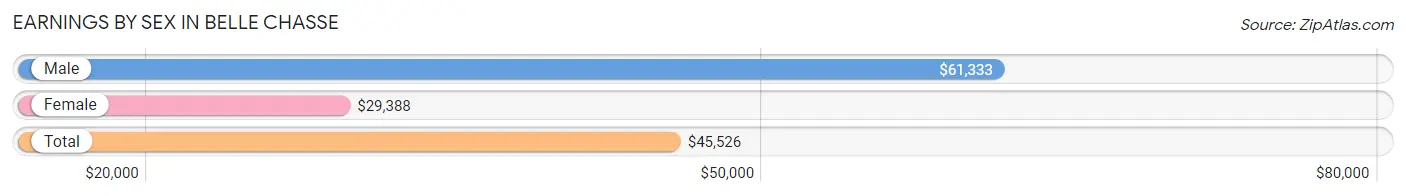
Earnings by Sex in Belle Chasse
Average Earnings in Belle Chasse are $45,526, $61,333 for men and $29,388 for women, a difference of 52.1%.
| Sex | Number | Average Earnings |
| Male | 3,160 (53.4%) | $61,333 |
| Female | 2,761 (46.6%) | $29,388 |
| Total | 5,921 (100.0%) | $45,526 |
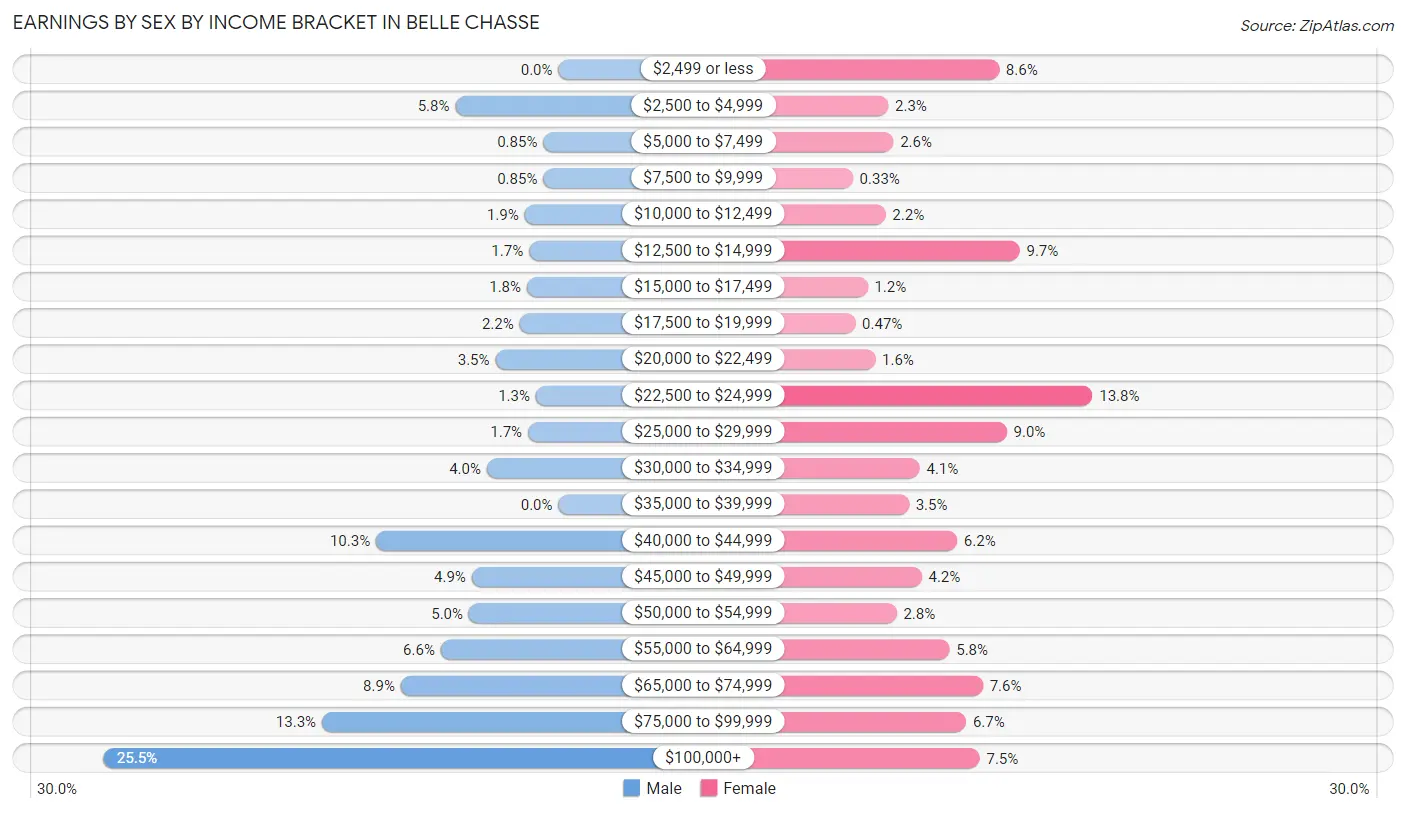
Earnings by Sex by Income Bracket in Belle Chasse
The most common earnings brackets in Belle Chasse are $100,000+ for men (807 | 25.5%) and $22,500 to $24,999 for women (381 | 13.8%).
| Income | Male | Female |
| $2,499 or less | 0 (0.0%) | 236 (8.6%) |
| $2,500 to $4,999 | 183 (5.8%) | 64 (2.3%) |
| $5,000 to $7,499 | 27 (0.9%) | 72 (2.6%) |
| $7,500 to $9,999 | 27 (0.9%) | 9 (0.3%) |
| $10,000 to $12,499 | 60 (1.9%) | 60 (2.2%) |
| $12,500 to $14,999 | 52 (1.7%) | 268 (9.7%) |
| $15,000 to $17,499 | 56 (1.8%) | 32 (1.2%) |
| $17,500 to $19,999 | 69 (2.2%) | 13 (0.5%) |
| $20,000 to $22,499 | 112 (3.5%) | 44 (1.6%) |
| $22,500 to $24,999 | 40 (1.3%) | 381 (13.8%) |
| $25,000 to $29,999 | 54 (1.7%) | 248 (9.0%) |
| $30,000 to $34,999 | 127 (4.0%) | 113 (4.1%) |
| $35,000 to $39,999 | 0 (0.0%) | 96 (3.5%) |
| $40,000 to $44,999 | 324 (10.2%) | 171 (6.2%) |
| $45,000 to $49,999 | 154 (4.9%) | 116 (4.2%) |
| $50,000 to $54,999 | 159 (5.0%) | 77 (2.8%) |
| $55,000 to $64,999 | 209 (6.6%) | 159 (5.8%) |
| $65,000 to $74,999 | 280 (8.9%) | 211 (7.6%) |
| $75,000 to $99,999 | 420 (13.3%) | 185 (6.7%) |
| $100,000+ | 807 (25.5%) | 206 (7.5%) |
| Total | 3,160 (100.0%) | 2,761 (100.0%) |
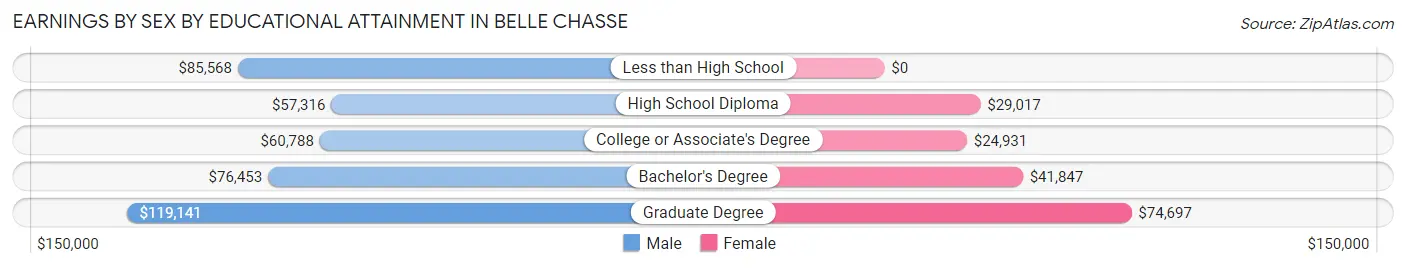
Earnings by Sex by Educational Attainment in Belle Chasse
Average earnings in Belle Chasse are $71,914 for men and $31,090 for women, a difference of 56.8%. Men with an educational attainment of graduate degree enjoy the highest average annual earnings of $119,141, while those with high school diploma education earn the least with $57,316. Women with an educational attainment of graduate degree earn the most with the average annual earnings of $74,697, while those with college or associate's degree education have the smallest earnings of $24,931.
| Educational Attainment | Male Income | Female Income |
| Less than High School | $85,568 | $0 |
| High School Diploma | $57,316 | $29,017 |
| College or Associate's Degree | $60,788 | $24,931 |
| Bachelor's Degree | $76,453 | $41,847 |
| Graduate Degree | $119,141 | $74,697 |
| Total | $71,914 | $31,090 |
Family Income in Belle Chasse
Family Income Brackets in Belle Chasse
According to the Belle Chasse family income data, there are 727 families falling into the $100,000 to $149,999 income range, which is the most common income bracket and makes up 24.0% of all families.
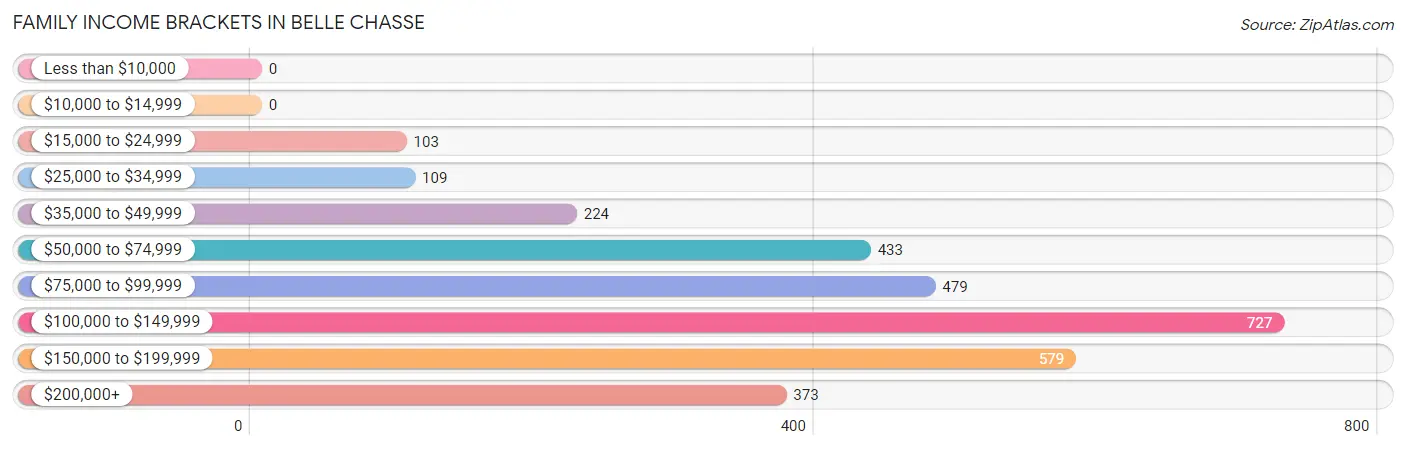
| Income Bracket | # Families | % Families |
| Less than $10,000 | 0 | 0.0% |
| $10,000 to $14,999 | 0 | 0.0% |
| $15,000 to $24,999 | 103 | 3.4% |
| $25,000 to $34,999 | 109 | 3.6% |
| $35,000 to $49,999 | 224 | 7.4% |
| $50,000 to $74,999 | 433 | 14.3% |
| $75,000 to $99,999 | 479 | 15.8% |
| $100,000 to $149,999 | 727 | 24.0% |
| $150,000 to $199,999 | 579 | 19.1% |
| $200,000+ | 373 | 12.3% |
Family Income by Famaliy Size in Belle Chasse
4-person families (534 | 17.6%) account for the highest median family income in Belle Chasse with $160,192 per family, while 2-person families (1,389 | 45.9%) have the highest median income of $40,553 per family member.
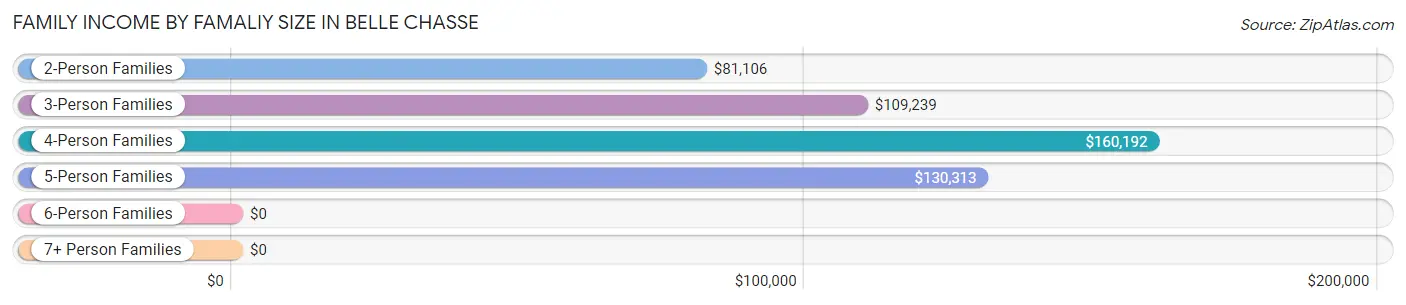
| Income Bracket | # Families | Median Income |
| 2-Person Families | 1,389 (45.9%) | $81,106 |
| 3-Person Families | 686 (22.7%) | $109,239 |
| 4-Person Families | 534 (17.6%) | $160,192 |
| 5-Person Families | 347 (11.5%) | $130,313 |
| 6-Person Families | 73 (2.4%) | $0 |
| 7+ Person Families | 0 (0.0%) | $0 |
| Total | 3,029 (100.0%) | $109,151 |
Family Income by Number of Earners in Belle Chasse
The median family income in Belle Chasse is $109,151, with families comprising 3+ earners (431) having the highest median family income of $222,875, while families with no earners (490) have the lowest median family income of $68,115, accounting for 14.2% and 16.2% of families, respectively.
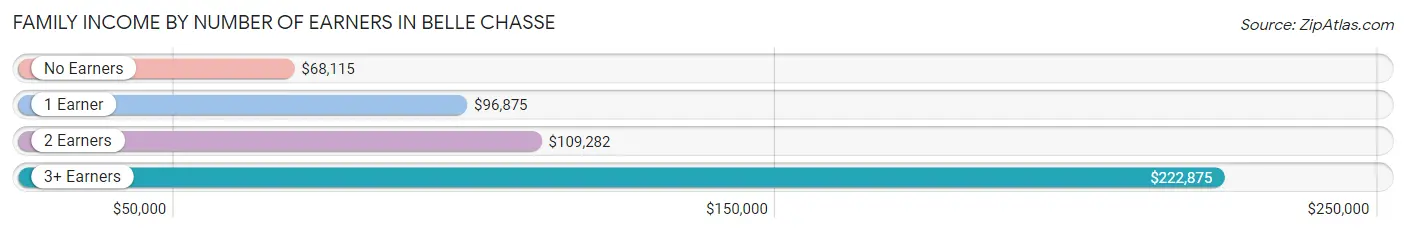
| Number of Earners | # Families | Median Income |
| No Earners | 490 (16.2%) | $68,115 |
| 1 Earner | 902 (29.8%) | $96,875 |
| 2 Earners | 1,206 (39.8%) | $109,282 |
| 3+ Earners | 431 (14.2%) | $222,875 |
| Total | 3,029 (100.0%) | $109,151 |
Household Income in Belle Chasse
Household Income Brackets in Belle Chasse
With 835 households falling in the category, the $100,000 to $149,999 income range is the most frequent in Belle Chasse, accounting for 22.0% of all households. In contrast, only 80 households (2.1%) fall into the less than $10,000 income bracket, making it the least populous group.
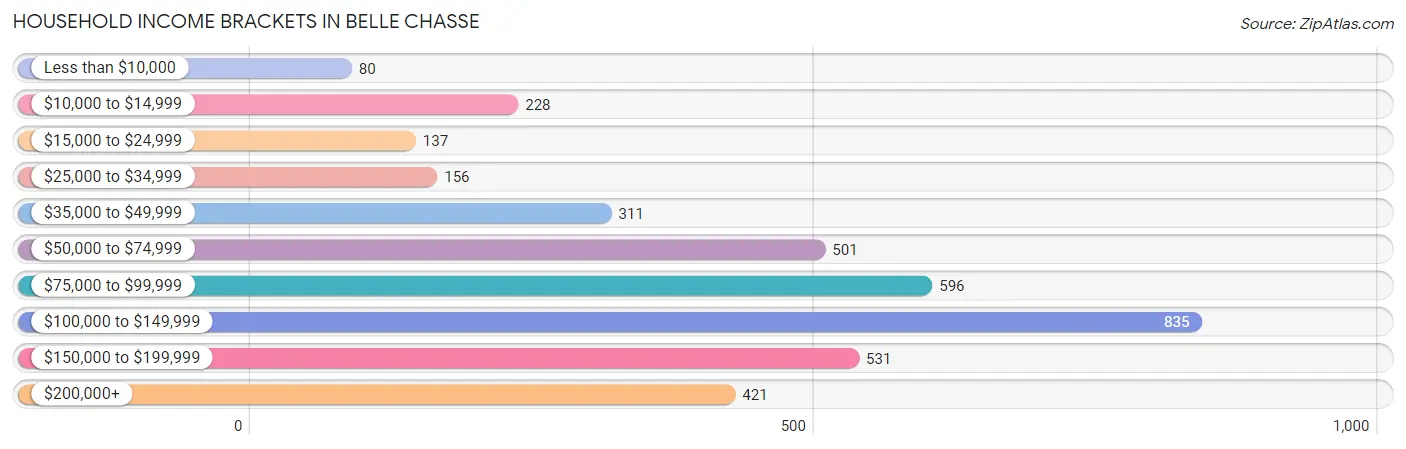
| Income Bracket | # Households | % Households |
| Less than $10,000 | 80 | 2.1% |
| $10,000 to $14,999 | 228 | 6.0% |
| $15,000 to $24,999 | 137 | 3.6% |
| $25,000 to $34,999 | 156 | 4.1% |
| $35,000 to $49,999 | 311 | 8.2% |
| $50,000 to $74,999 | 501 | 13.2% |
| $75,000 to $99,999 | 596 | 15.7% |
| $100,000 to $149,999 | 835 | 22.0% |
| $150,000 to $199,999 | 531 | 14.0% |
| $200,000+ | 421 | 11.1% |
Household Income by Householder Age in Belle Chasse
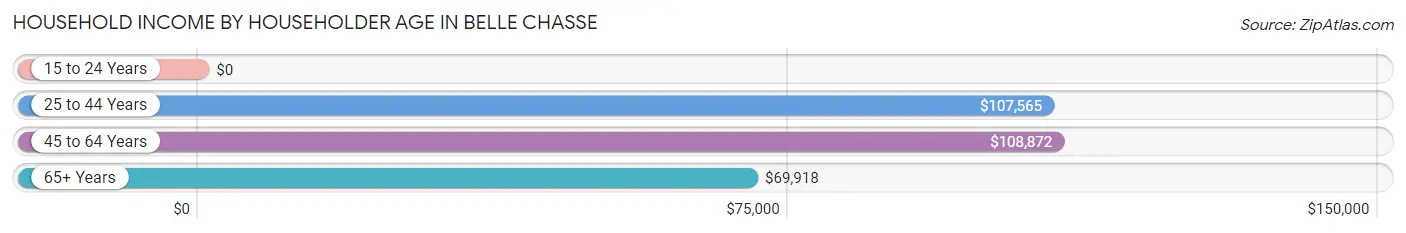
The median household income in Belle Chasse is $92,059, with the highest median household income of $108,872 found in the 45 to 64 years age bracket for the primary householder. A total of 1,519 households (40.0%) fall into this category.
| Income Bracket | # Households | Median Income |
| 15 to 24 Years | 0 (0.0%) | $0 |
| 25 to 44 Years | 1,199 (31.6%) | $107,565 |
| 45 to 64 Years | 1,519 (40.0%) | $108,872 |
| 65+ Years | 1,076 (28.4%) | $69,918 |
| Total | 3,794 (100.0%) | $92,059 |
Poverty in Belle Chasse
Income Below Poverty by Sex and Age in Belle Chasse
With 4.1% poverty level for males and 7.5% for females among the residents of Belle Chasse, 55 to 64 year old males and 45 to 54 year old females are the most vulnerable to poverty, with 97 males (14.7%) and 188 females (26.5%) in their respective age groups living below the poverty level.
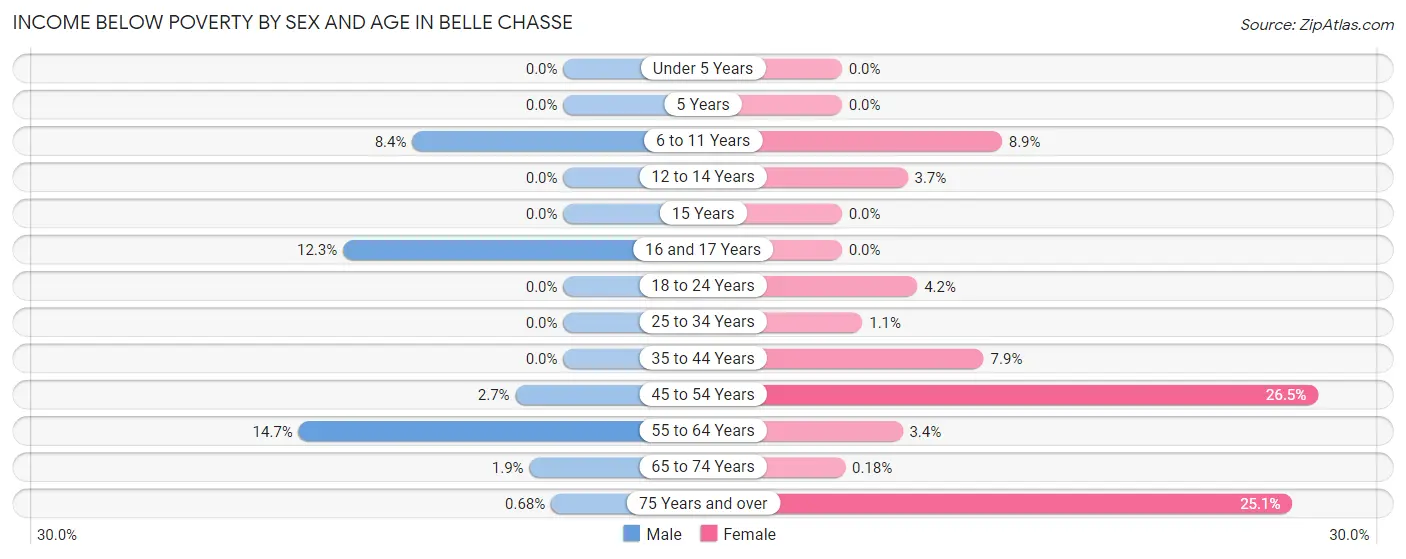
| Age Bracket | Male | Female |
| Under 5 Years | 0 (0.0%) | 0 (0.0%) |
| 5 Years | 0 (0.0%) | 0 (0.0%) |
| 6 to 11 Years | 56 (8.4%) | 22 (8.9%) |
| 12 to 14 Years | 0 (0.0%) | 12 (3.7%) |
| 15 Years | 0 (0.0%) | 0 (0.0%) |
| 16 and 17 Years | 33 (12.3%) | 0 (0.0%) |
| 18 to 24 Years | 0 (0.0%) | 10 (4.2%) |
| 25 to 34 Years | 0 (0.0%) | 9 (1.1%) |
| 35 to 44 Years | 0 (0.0%) | 63 (7.9%) |
| 45 to 54 Years | 18 (2.7%) | 188 (26.5%) |
| 55 to 64 Years | 97 (14.7%) | 29 (3.4%) |
| 65 to 74 Years | 10 (1.9%) | 1 (0.2%) |
| 75 Years and over | 2 (0.7%) | 82 (25.1%) |
| Total | 216 (4.1%) | 416 (7.5%) |
Income Above Poverty by Sex and Age in Belle Chasse
According to the poverty statistics in Belle Chasse, males aged under 5 years and females aged under 5 years are the age groups that are most secure financially, with 100.0% of males and 100.0% of females in these age groups living above the poverty line.
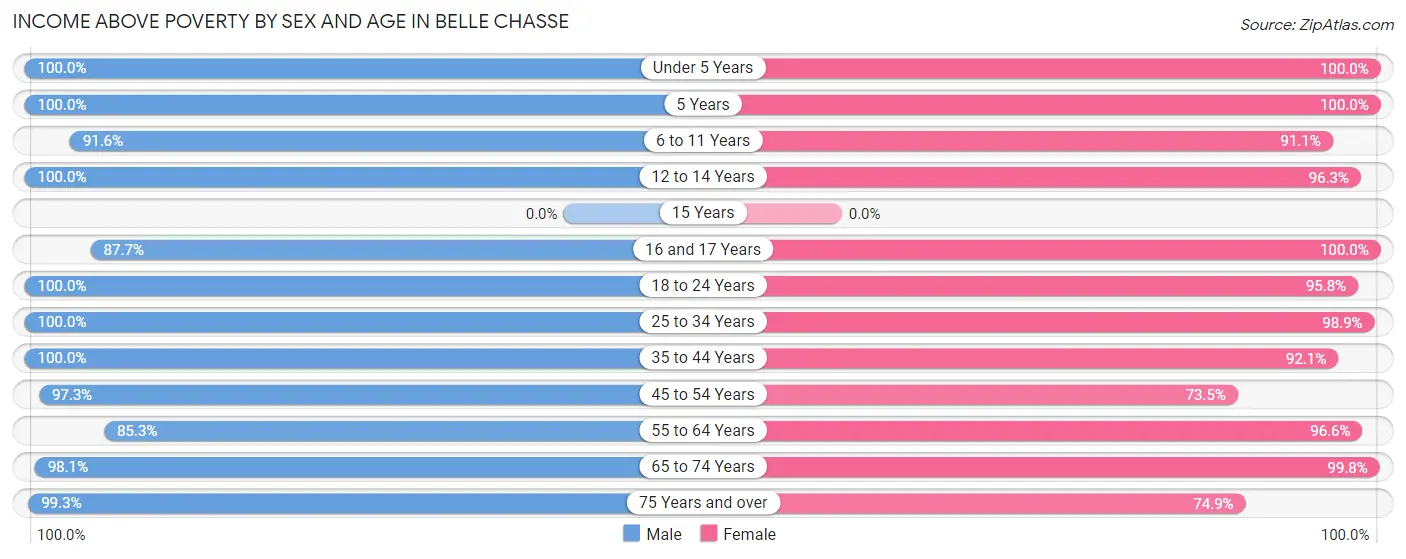
| Age Bracket | Male | Female |
| Under 5 Years | 106 (100.0%) | 399 (100.0%) |
| 5 Years | 71 (100.0%) | 14 (100.0%) |
| 6 to 11 Years | 610 (91.6%) | 225 (91.1%) |
| 12 to 14 Years | 147 (100.0%) | 316 (96.3%) |
| 15 Years | 0 (0.0%) | 0 (0.0%) |
| 16 and 17 Years | 236 (87.7%) | 273 (100.0%) |
| 18 to 24 Years | 524 (100.0%) | 228 (95.8%) |
| 25 to 34 Years | 585 (100.0%) | 780 (98.9%) |
| 35 to 44 Years | 692 (100.0%) | 734 (92.1%) |
| 45 to 54 Years | 656 (97.3%) | 521 (73.5%) |
| 55 to 64 Years | 561 (85.3%) | 830 (96.6%) |
| 65 to 74 Years | 518 (98.1%) | 563 (99.8%) |
| 75 Years and over | 293 (99.3%) | 245 (74.9%) |
| Total | 4,999 (95.9%) | 5,128 (92.5%) |
Income Below Poverty Among Married-Couple Families in Belle Chasse
The poverty statistics for married-couple families in Belle Chasse show that 0.5% or 14 of the total 2,596 families live below the poverty line. Families with no children have the highest poverty rate of 0.9%, comprising of 14 families. On the other hand, families with 1 or 2 children have the lowest poverty rate of 0.0%, which includes 0 families.
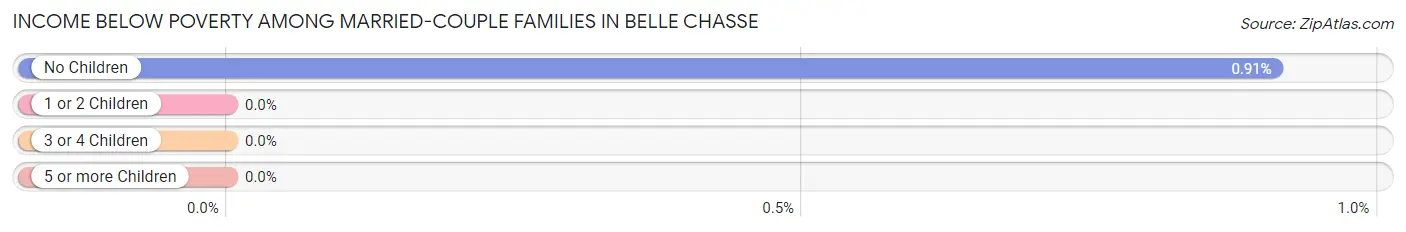
| Children | Above Poverty | Below Poverty |
| No Children | 1,528 (99.1%) | 14 (0.9%) |
| 1 or 2 Children | 752 (100.0%) | 0 (0.0%) |
| 3 or 4 Children | 302 (100.0%) | 0 (0.0%) |
| 5 or more Children | 0 (0.0%) | 0 (0.0%) |
| Total | 2,582 (99.5%) | 14 (0.5%) |
Income Below Poverty Among Single-Parent Households in Belle Chasse
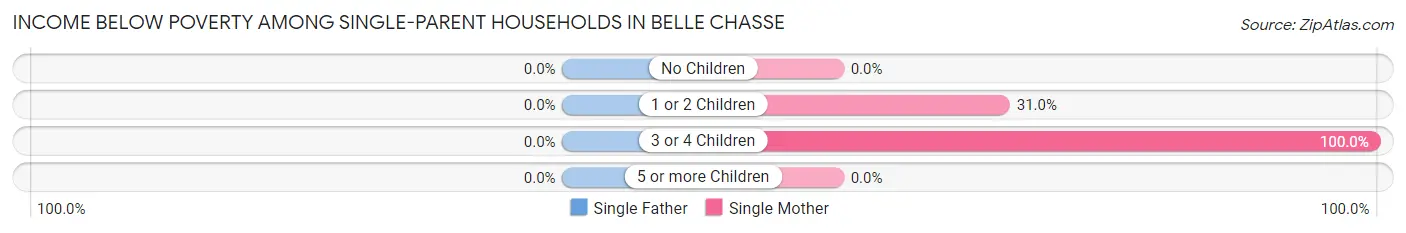
| Children | Single Father | Single Mother |
| No Children | 0 (0.0%) | 0 (0.0%) |
| 1 or 2 Children | 0 (0.0%) | 52 (30.9%) |
| 3 or 4 Children | 0 (0.0%) | 9 (100.0%) |
| 5 or more Children | 0 (0.0%) | 0 (0.0%) |
| Total | 0 (0.0%) | 61 (19.7%) |
Income Below Poverty Among Married-Couple vs Single-Parent Households in Belle Chasse
The poverty data for Belle Chasse shows that 14 of the married-couple family households (0.5%) and 61 of the single-parent households (14.1%) are living below the poverty level. Within the married-couple family households, those with no children have the highest poverty rate, with 14 households (0.9%) falling below the poverty line. Among the single-parent households, those with 3 or 4 children have the highest poverty rate, with 9 household (100.0%) living below poverty.
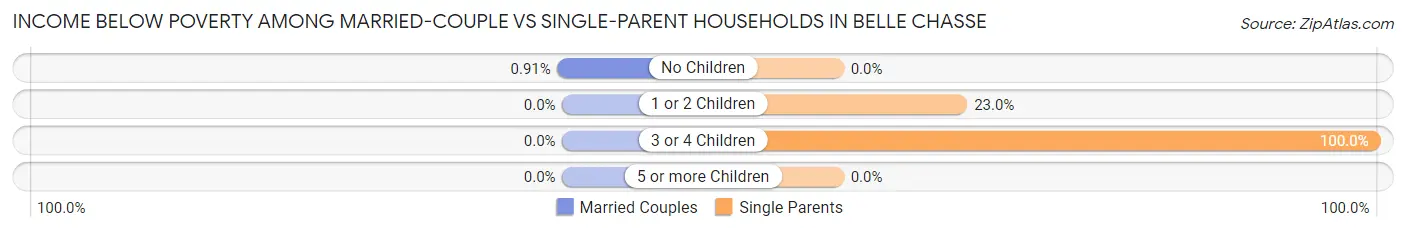
| Children | Married-Couple Families | Single-Parent Households |
| No Children | 14 (0.9%) | 0 (0.0%) |
| 1 or 2 Children | 0 (0.0%) | 52 (23.0%) |
| 3 or 4 Children | 0 (0.0%) | 9 (100.0%) |
| 5 or more Children | 0 (0.0%) | 0 (0.0%) |
| Total | 14 (0.5%) | 61 (14.1%) |
Race in Belle Chasse
The most populous races in Belle Chasse are White / Caucasian (8,620 | 80.0%), Black / African American (1,192 | 11.1%), and Hispanic or Latino (721 | 6.7%).
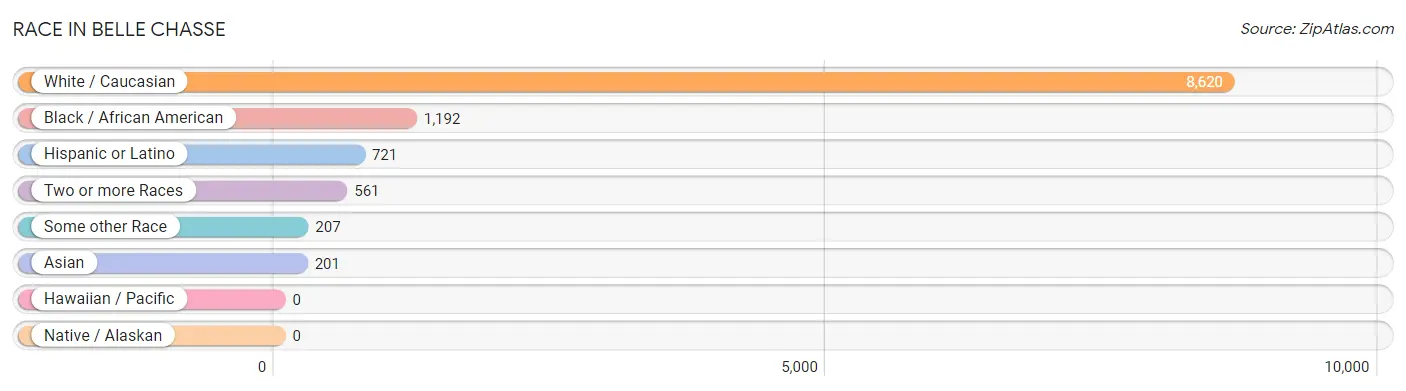
| Race | # Population | % Population |
| Asian | 201 | 1.9% |
| Black / African American | 1,192 | 11.1% |
| Hawaiian / Pacific | 0 | 0.0% |
| Hispanic or Latino | 721 | 6.7% |
| Native / Alaskan | 0 | 0.0% |
| White / Caucasian | 8,620 | 80.0% |
| Two or more Races | 561 | 5.2% |
| Some other Race | 207 | 1.9% |
| Total | 10,781 | 100.0% |
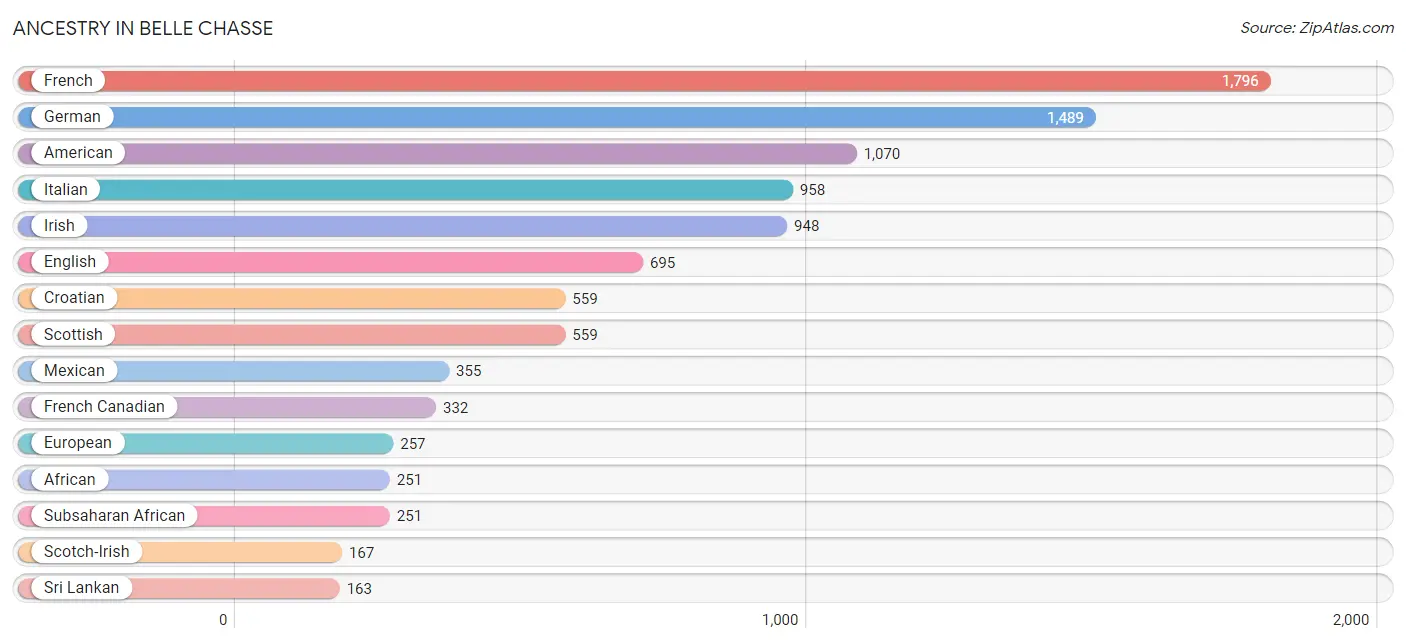
Ancestry in Belle Chasse
The most populous ancestries reported in Belle Chasse are French (1,796 | 16.7%), German (1,489 | 13.8%), American (1,070 | 9.9%), Italian (958 | 8.9%), and Irish (948 | 8.8%), together accounting for 58.1% of all Belle Chasse residents.
| Ancestry | # Population | % Population |
| African | 251 | 2.3% |
| American | 1,070 | 9.9% |
| Belizean | 6 | 0.1% |
| Cajun | 8 | 0.1% |
| Central American | 58 | 0.5% |
| Croatian | 559 | 5.2% |
| Cuban | 105 | 1.0% |
| Dominican | 23 | 0.2% |
| Dutch | 72 | 0.7% |
| Eastern European | 118 | 1.1% |
| English | 695 | 6.5% |
| European | 257 | 2.4% |
| Filipino | 62 | 0.6% |
| Finnish | 11 | 0.1% |
| French | 1,796 | 16.7% |
| French Canadian | 332 | 3.1% |
| German | 1,489 | 13.8% |
| Greek | 10 | 0.1% |
| Honduran | 19 | 0.2% |
| Hungarian | 48 | 0.4% |
| Irish | 948 | 8.8% |
| Italian | 958 | 8.9% |
| Mexican | 355 | 3.3% |
| Nicaraguan | 39 | 0.4% |
| Norwegian | 38 | 0.4% |
| Polish | 92 | 0.9% |
| Portuguese | 27 | 0.3% |
| Puerto Rican | 50 | 0.5% |
| Scotch-Irish | 167 | 1.5% |
| Scottish | 559 | 5.2% |
| Spaniard | 1 | 0.0% |
| Spanish | 96 | 0.9% |
| Sri Lankan | 163 | 1.5% |
| Subsaharan African | 251 | 2.3% |
| Swedish | 44 | 0.4% |
| Welsh | 40 | 0.4% | View All 36 Rows |
Immigrants in Belle Chasse
The most numerous immigrant groups reported in Belle Chasse came from Latin America (225 | 2.1%), Central America (151 | 1.4%), Asia (123 | 1.1%), South Eastern Asia (123 | 1.1%), and Vietnam (111 | 1.0%), together accounting for 6.8% of all Belle Chasse residents.
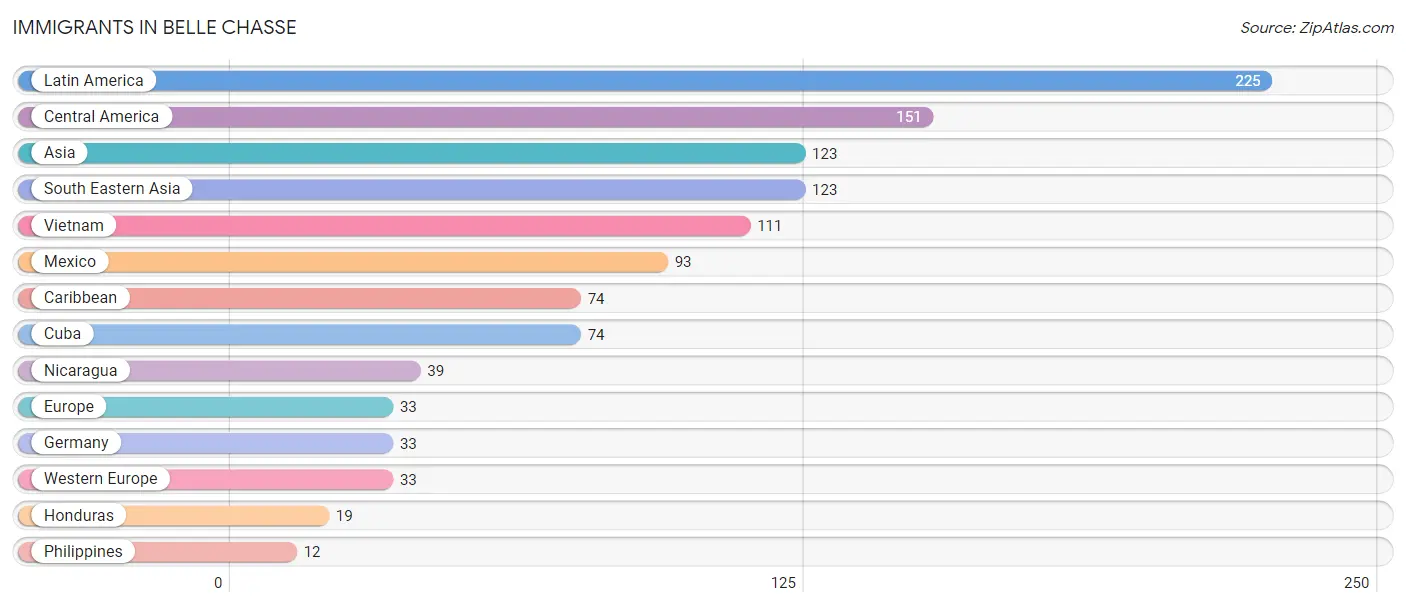
| Immigration Origin | # Population | % Population |
| Asia | 123 | 1.1% |
| Caribbean | 74 | 0.7% |
| Central America | 151 | 1.4% |
| Cuba | 74 | 0.7% |
| Europe | 33 | 0.3% |
| Germany | 33 | 0.3% |
| Honduras | 19 | 0.2% |
| Latin America | 225 | 2.1% |
| Mexico | 93 | 0.9% |
| Nicaragua | 39 | 0.4% |
| Philippines | 12 | 0.1% |
| South Eastern Asia | 123 | 1.1% |
| Vietnam | 111 | 1.0% |
| Western Europe | 33 | 0.3% | View All 14 Rows |
Sex and Age in Belle Chasse
Sex and Age in Belle Chasse
The most populous age groups in Belle Chasse are 10 to 14 Years (494 | 9.4%) for men and 55 to 59 Years (458 | 8.3%) for women.
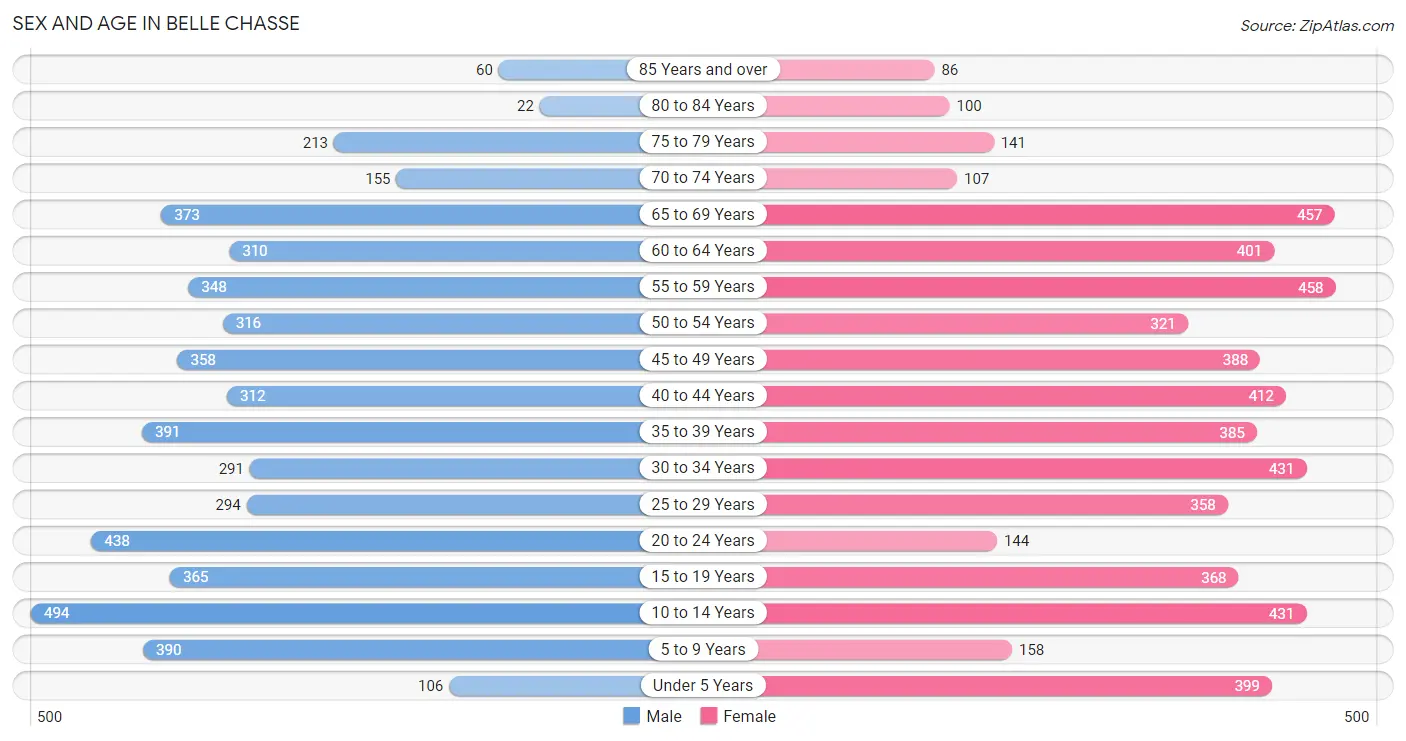
| Age Bracket | Male | Female |
| Under 5 Years | 106 (2.0%) | 399 (7.2%) |
| 5 to 9 Years | 390 (7.4%) | 158 (2.9%) |
| 10 to 14 Years | 494 (9.4%) | 431 (7.8%) |
| 15 to 19 Years | 365 (7.0%) | 368 (6.6%) |
| 20 to 24 Years | 438 (8.4%) | 144 (2.6%) |
| 25 to 29 Years | 294 (5.6%) | 358 (6.5%) |
| 30 to 34 Years | 291 (5.6%) | 431 (7.8%) |
| 35 to 39 Years | 391 (7.5%) | 385 (6.9%) |
| 40 to 44 Years | 312 (6.0%) | 412 (7.4%) |
| 45 to 49 Years | 358 (6.8%) | 388 (7.0%) |
| 50 to 54 Years | 316 (6.0%) | 321 (5.8%) |
| 55 to 59 Years | 348 (6.7%) | 458 (8.3%) |
| 60 to 64 Years | 310 (5.9%) | 401 (7.2%) |
| 65 to 69 Years | 373 (7.1%) | 457 (8.2%) |
| 70 to 74 Years | 155 (3.0%) | 107 (1.9%) |
| 75 to 79 Years | 213 (4.1%) | 141 (2.5%) |
| 80 to 84 Years | 22 (0.4%) | 100 (1.8%) |
| 85 Years and over | 60 (1.1%) | 86 (1.5%) |
| Total | 5,236 (100.0%) | 5,545 (100.0%) |
Families and Households in Belle Chasse
Median Family Size in Belle Chasse
The median family size in Belle Chasse is 3.24 persons per family, with single female/mother families (309 | 10.2%) accounting for the largest median family size of 3.36 persons per family. On the other hand, single male/father families (124 | 4.1%) represent the smallest median family size with 2.65 persons per family.
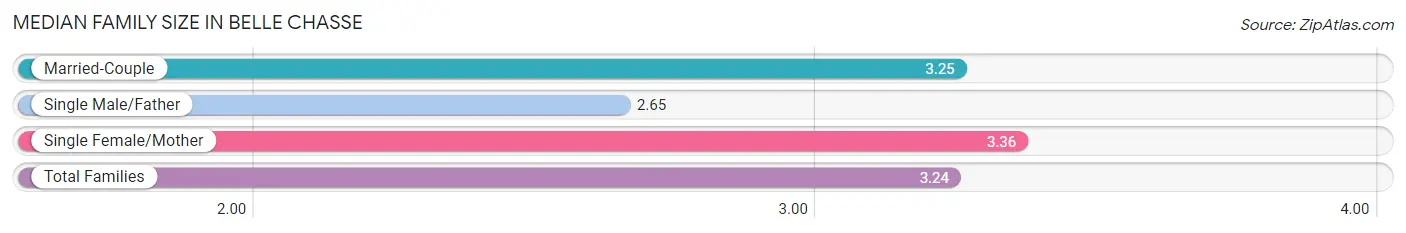
| Family Type | # Families | Family Size |
| Married-Couple | 2,596 (85.7%) | 3.25 |
| Single Male/Father | 124 (4.1%) | 2.65 |
| Single Female/Mother | 309 (10.2%) | 3.36 |
| Total Families | 3,029 (100.0%) | 3.24 |
Median Household Size in Belle Chasse
The median household size in Belle Chasse is 2.83 persons per household, with single female/mother households (309 | 8.1%) accounting for the largest median household size of 3.64 persons per household. non-family households (765 | 20.2%) represent the smallest median household size with 1.06 persons per household.
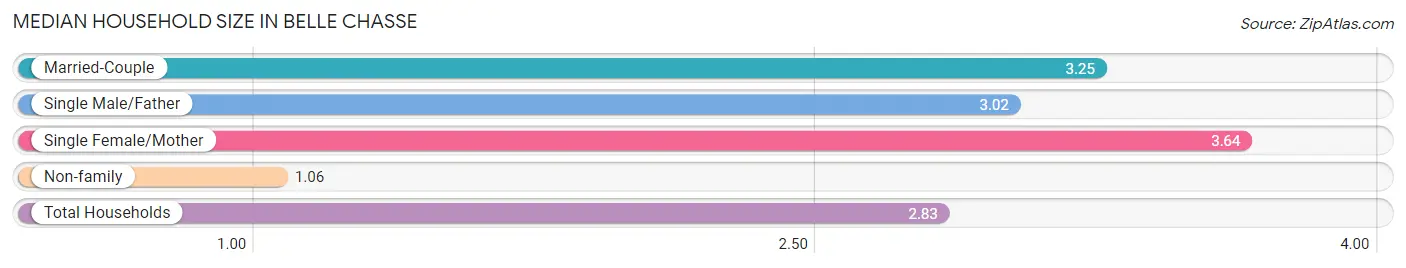
| Household Type | # Households | Household Size |
| Married-Couple | 2,596 (68.4%) | 3.25 |
| Single Male/Father | 124 (3.3%) | 3.02 |
| Single Female/Mother | 309 (8.1%) | 3.64 |
| Non-family | 765 (20.2%) | 1.06 |
| Total Households | 3,794 (100.0%) | 2.83 |
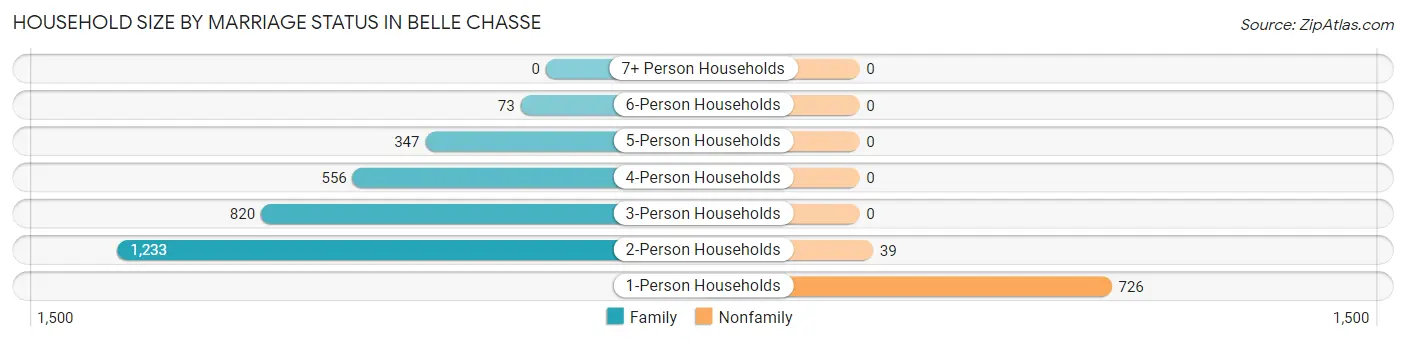
Household Size by Marriage Status in Belle Chasse
Out of a total of 3,794 households in Belle Chasse, 3,029 (79.8%) are family households, while 765 (20.2%) are nonfamily households. The most numerous type of family households are 2-person households, comprising 1,233, and the most common type of nonfamily households are 1-person households, comprising 726.
| Household Size | Family Households | Nonfamily Households |
| 1-Person Households | - | 726 (19.1%) |
| 2-Person Households | 1,233 (32.5%) | 39 (1.0%) |
| 3-Person Households | 820 (21.6%) | 0 (0.0%) |
| 4-Person Households | 556 (14.6%) | 0 (0.0%) |
| 5-Person Households | 347 (9.1%) | 0 (0.0%) |
| 6-Person Households | 73 (1.9%) | 0 (0.0%) |
| 7+ Person Households | 0 (0.0%) | 0 (0.0%) |
| Total | 3,029 (79.8%) | 765 (20.2%) |
Female Fertility in Belle Chasse
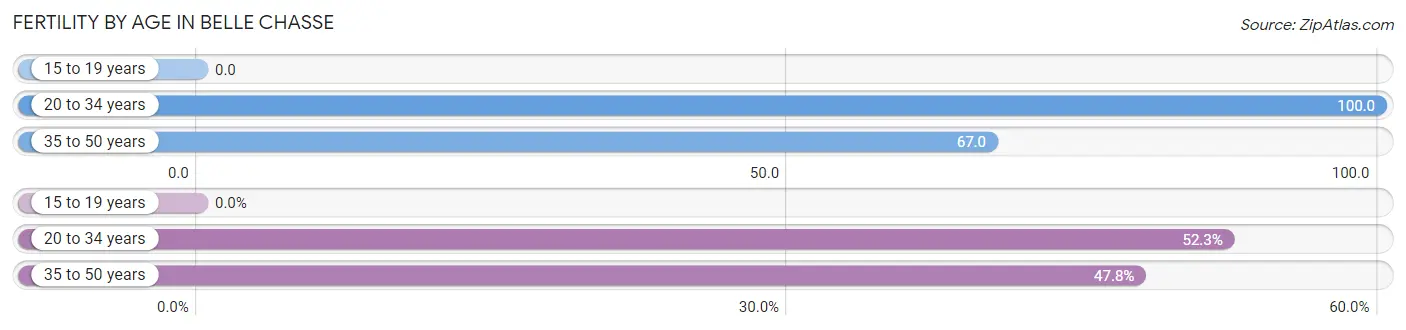
Fertility by Age in Belle Chasse
Average fertility rate in Belle Chasse is 69.0 births per 1,000 women. Women in the age bracket of 20 to 34 years have the highest fertility rate with 100.0 births per 1,000 women. Women in the age bracket of 20 to 34 years acount for 52.2% of all women with births.
| Age Bracket | Women with Births | Births / 1,000 Women |
| 15 to 19 years | 0 (0.0%) | 0.0 |
| 20 to 34 years | 93 (52.2%) | 100.0 |
| 35 to 50 years | 85 (47.7%) | 67.0 |
| Total | 178 (100.0%) | 69.0 |
Fertility by Age by Marriage Status in Belle Chasse
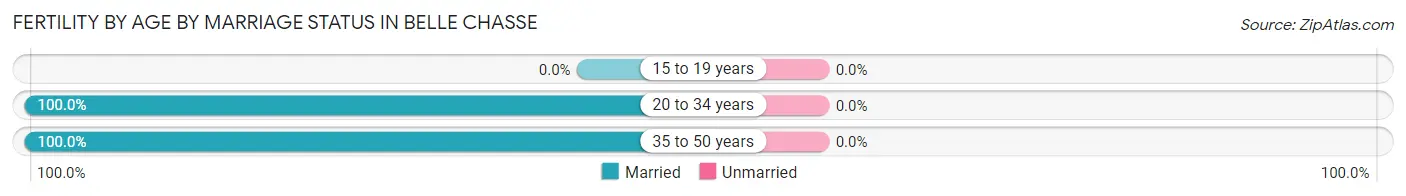
| Age Bracket | Married | Unmarried |
| 15 to 19 years | 0 (0.0%) | 0 (0.0%) |
| 20 to 34 years | 93 (100.0%) | 0 (0.0%) |
| 35 to 50 years | 85 (100.0%) | 0 (0.0%) |
| Total | 178 (100.0%) | 0 (0.0%) |
Fertility by Education in Belle Chasse
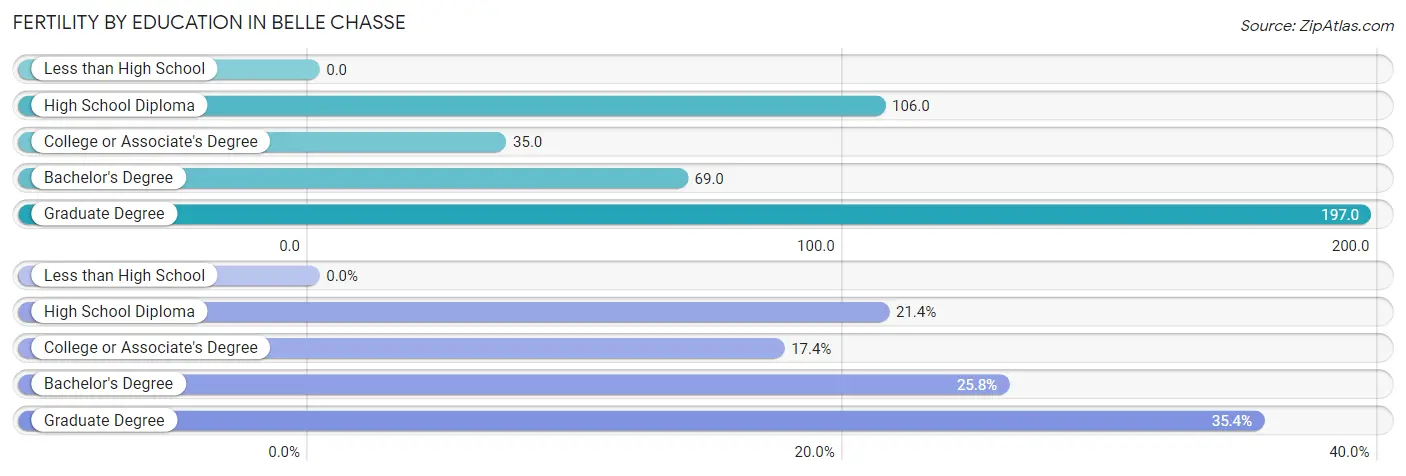
| Educational Attainment | Women with Births | Births / 1,000 Women |
| Less than High School | 0 (0.0%) | 0.0 |
| High School Diploma | 38 (21.3%) | 106.0 |
| College or Associate's Degree | 31 (17.4%) | 35.0 |
| Bachelor's Degree | 46 (25.8%) | 69.0 |
| Graduate Degree | 63 (35.4%) | 197.0 |
| Total | 178 (100.0%) | 69.0 |
Fertility by Education by Marriage Status in Belle Chasse
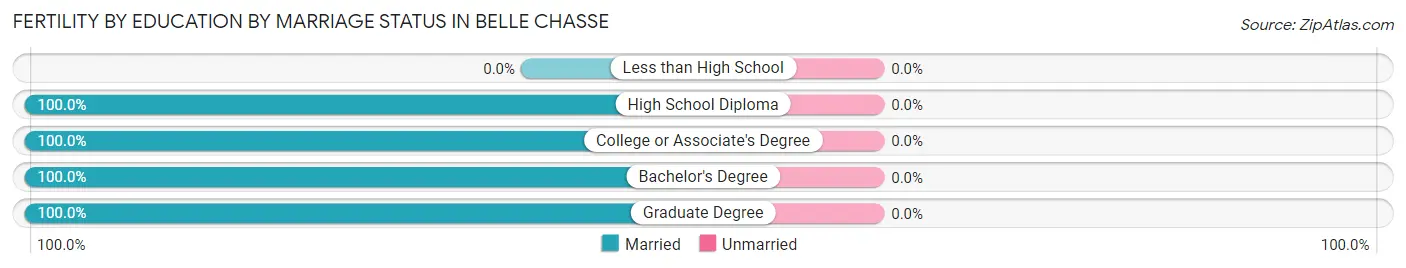
| Educational Attainment | Married | Unmarried |
| Less than High School | 0 (0.0%) | 0 (0.0%) |
| High School Diploma | 38 (100.0%) | 0 (0.0%) |
| College or Associate's Degree | 31 (100.0%) | 0 (0.0%) |
| Bachelor's Degree | 46 (100.0%) | 0 (0.0%) |
| Graduate Degree | 63 (100.0%) | 0 (0.0%) |
| Total | 178 (100.0%) | 0 (0.0%) |
Employment Characteristics in Belle Chasse
Employment by Class of Employer in Belle Chasse
Among the 5,584 employed individuals in Belle Chasse, private company employees (3,556 | 63.7%), local government employees (597 | 10.7%), and not-for-profit organizations (456 | 8.2%) make up the most common classes of employment.
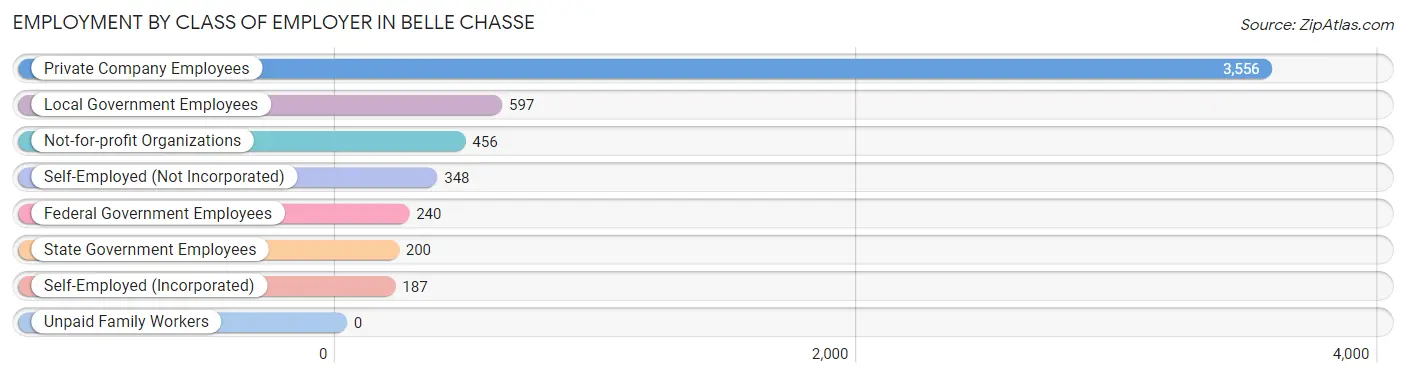
| Employer Class | # Employees | % Employees |
| Private Company Employees | 3,556 | 63.7% |
| Self-Employed (Incorporated) | 187 | 3.4% |
| Self-Employed (Not Incorporated) | 348 | 6.2% |
| Not-for-profit Organizations | 456 | 8.2% |
| Local Government Employees | 597 | 10.7% |
| State Government Employees | 200 | 3.6% |
| Federal Government Employees | 240 | 4.3% |
| Unpaid Family Workers | 0 | 0.0% |
| Total | 5,584 | 100.0% |
Employment Status by Age in Belle Chasse
According to the labor force statistics for Belle Chasse, out of the total population over 16 years of age (8,802), 66.3% or 5,836 individuals are in the labor force, with 3.0% or 175 of them unemployed. The age group with the highest labor force participation rate is 30 to 34 years, with 93.6% or 676 individuals in the labor force. Within the labor force, the 25 to 29 years age range has the highest percentage of unemployed individuals, with 14.0% or 85 of them being unemployed.
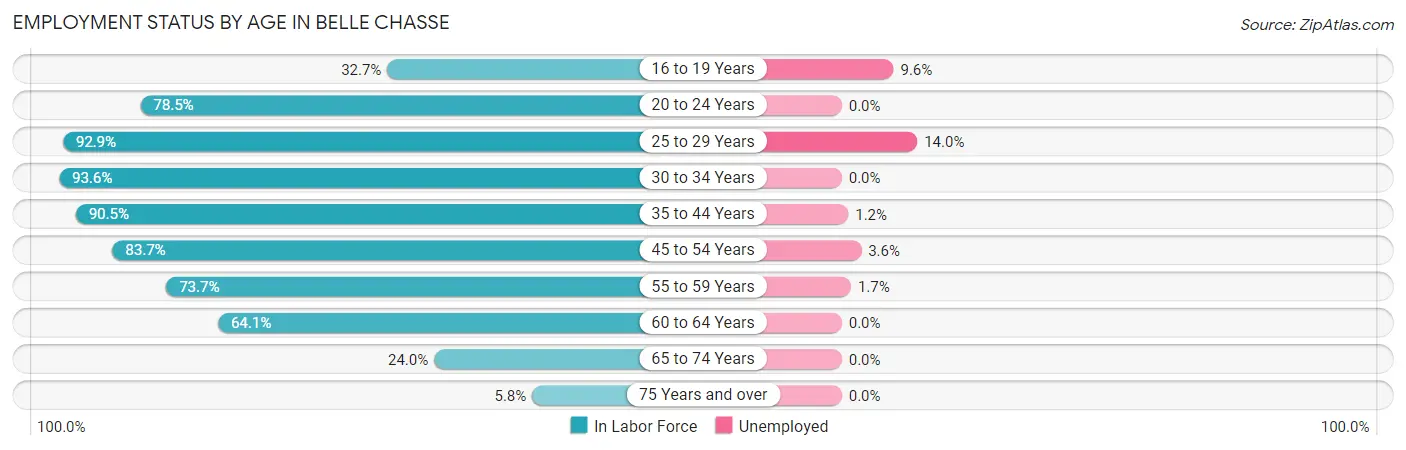
| Age Bracket | In Labor Force | Unemployed |
| 16 to 19 Years | 239 (32.7%) | 23 (9.6%) |
| 20 to 24 Years | 457 (78.5%) | 0 (0.0%) |
| 25 to 29 Years | 606 (92.9%) | 85 (14.0%) |
| 30 to 34 Years | 676 (93.6%) | 0 (0.0%) |
| 35 to 44 Years | 1,358 (90.5%) | 16 (1.2%) |
| 45 to 54 Years | 1,158 (83.7%) | 42 (3.6%) |
| 55 to 59 Years | 594 (73.7%) | 10 (1.7%) |
| 60 to 64 Years | 456 (64.1%) | 0 (0.0%) |
| 65 to 74 Years | 262 (24.0%) | 0 (0.0%) |
| 75 Years and over | 36 (5.8%) | 0 (0.0%) |
| Total | 5,836 (66.3%) | 175 (3.0%) |
Employment Status by Educational Attainment in Belle Chasse
According to labor force statistics for Belle Chasse, 83.9% of individuals (4,844) out of the total population between 25 and 64 years of age (5,774) are in the labor force, with 3.2% or 155 of them being unemployed. The group with the highest labor force participation rate are those with the educational attainment of bachelor's degree or higher, with 94.6% or 1,720 individuals in the labor force. Within the labor force, individuals with high school diploma education have the highest percentage of unemployment, with 8.8% or 126 of them being unemployed.
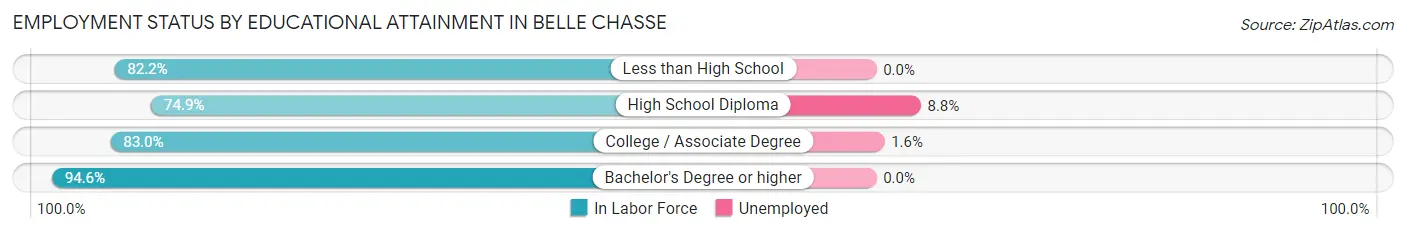
| Educational Attainment | In Labor Force | Unemployed |
| Less than High School | 74 (82.2%) | 0 (0.0%) |
| High School Diploma | 1,434 (74.9%) | 169 (8.8%) |
| College / Associate Degree | 1,619 (83.0%) | 31 (1.6%) |
| Bachelor's Degree or higher | 1,720 (94.6%) | 0 (0.0%) |
| Total | 4,844 (83.9%) | 185 (3.2%) |
Employment Occupations by Sex in Belle Chasse
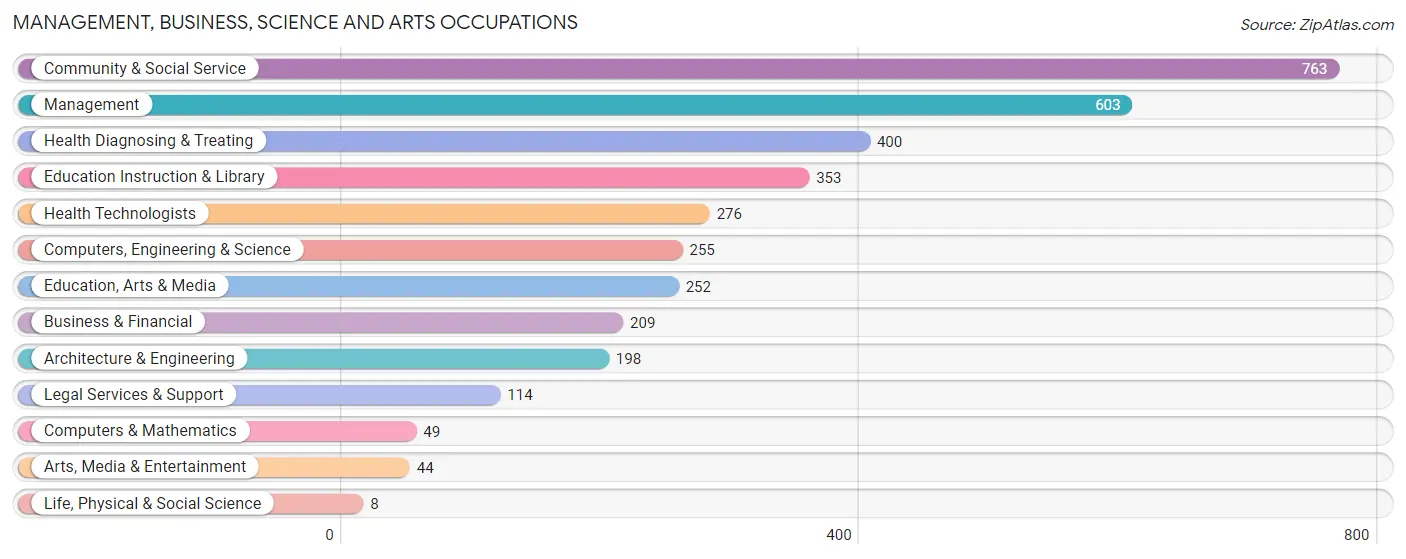
Management, Business, Science and Arts Occupations
The most common Management, Business, Science and Arts occupations in Belle Chasse are Community & Social Service (763 | 13.7%), Management (603 | 10.8%), Health Diagnosing & Treating (400 | 7.2%), Education Instruction & Library (353 | 6.3%), and Health Technologists (276 | 4.9%).
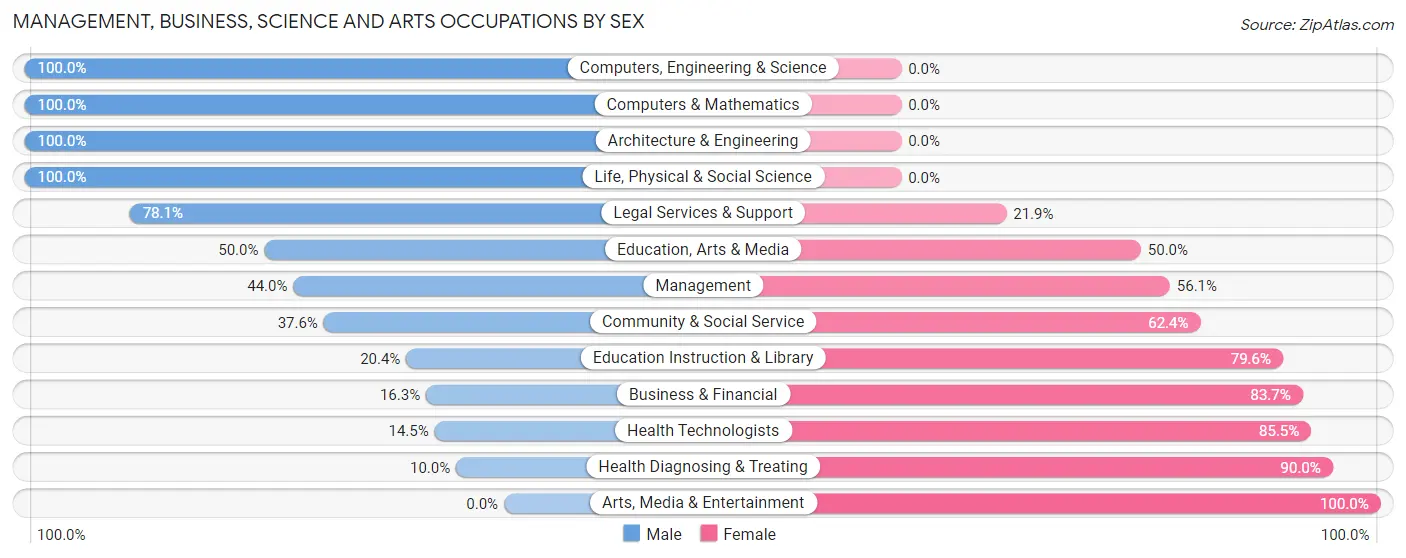
Management, Business, Science and Arts Occupations by Sex
Within the Management, Business, Science and Arts occupations in Belle Chasse, the most male-oriented occupations are Computers, Engineering & Science (100.0%), Computers & Mathematics (100.0%), and Architecture & Engineering (100.0%), while the most female-oriented occupations are Arts, Media & Entertainment (100.0%), Health Diagnosing & Treating (90.0%), and Health Technologists (85.5%).
| Occupation | Male | Female |
| Management | 265 (44.0%) | 338 (56.0%) |
| Business & Financial | 34 (16.3%) | 175 (83.7%) |
| Computers, Engineering & Science | 255 (100.0%) | 0 (0.0%) |
| Computers & Mathematics | 49 (100.0%) | 0 (0.0%) |
| Architecture & Engineering | 198 (100.0%) | 0 (0.0%) |
| Life, Physical & Social Science | 8 (100.0%) | 0 (0.0%) |
| Community & Social Service | 287 (37.6%) | 476 (62.4%) |
| Education, Arts & Media | 126 (50.0%) | 126 (50.0%) |
| Legal Services & Support | 89 (78.1%) | 25 (21.9%) |
| Education Instruction & Library | 72 (20.4%) | 281 (79.6%) |
| Arts, Media & Entertainment | 0 (0.0%) | 44 (100.0%) |
| Health Diagnosing & Treating | 40 (10.0%) | 360 (90.0%) |
| Health Technologists | 40 (14.5%) | 236 (85.5%) |
| Total (Category) | 881 (39.5%) | 1,349 (60.5%) |
| Total (Overall) | 2,976 (53.2%) | 2,614 (46.8%) |
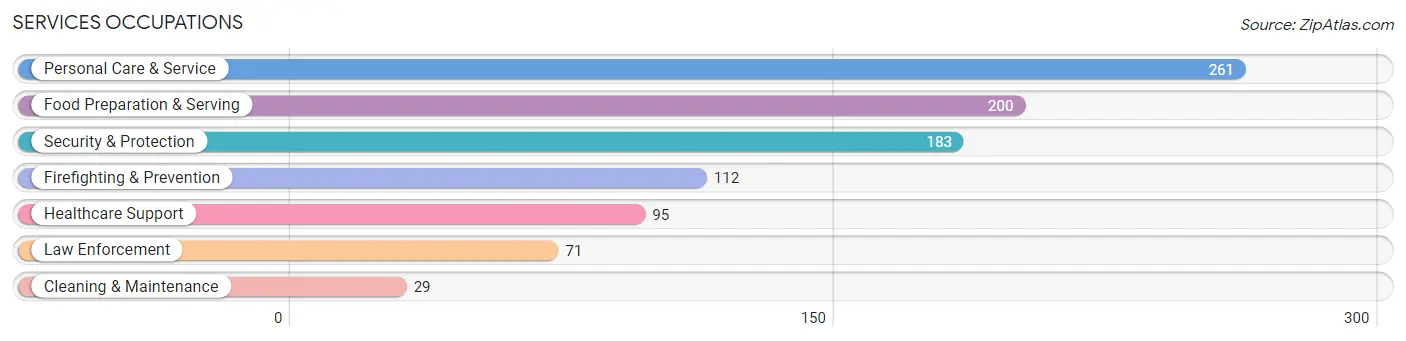
Services Occupations
The most common Services occupations in Belle Chasse are Personal Care & Service (261 | 4.7%), Food Preparation & Serving (200 | 3.6%), Security & Protection (183 | 3.3%), Firefighting & Prevention (112 | 2.0%), and Healthcare Support (95 | 1.7%).
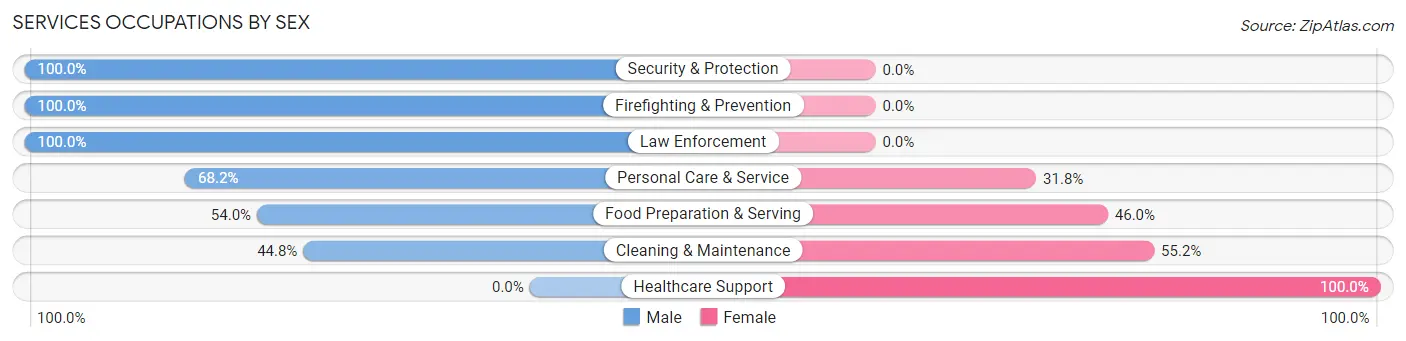
Services Occupations by Sex
Within the Services occupations in Belle Chasse, the most male-oriented occupations are Security & Protection (100.0%), Firefighting & Prevention (100.0%), and Law Enforcement (100.0%), while the most female-oriented occupations are Healthcare Support (100.0%), Cleaning & Maintenance (55.2%), and Food Preparation & Serving (46.0%).
| Occupation | Male | Female |
| Healthcare Support | 0 (0.0%) | 95 (100.0%) |
| Security & Protection | 183 (100.0%) | 0 (0.0%) |
| Firefighting & Prevention | 112 (100.0%) | 0 (0.0%) |
| Law Enforcement | 71 (100.0%) | 0 (0.0%) |
| Food Preparation & Serving | 108 (54.0%) | 92 (46.0%) |
| Cleaning & Maintenance | 13 (44.8%) | 16 (55.2%) |
| Personal Care & Service | 178 (68.2%) | 83 (31.8%) |
| Total (Category) | 482 (62.8%) | 286 (37.2%) |
| Total (Overall) | 2,976 (53.2%) | 2,614 (46.8%) |
Sales and Office Occupations
The most common Sales and Office occupations in Belle Chasse are Office & Administration (807 | 14.4%), and Sales & Related (373 | 6.7%).

Sales and Office Occupations by Sex
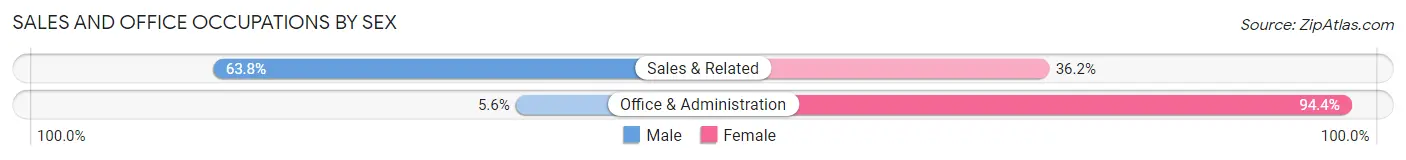
| Occupation | Male | Female |
| Sales & Related | 238 (63.8%) | 135 (36.2%) |
| Office & Administration | 45 (5.6%) | 762 (94.4%) |
| Total (Category) | 283 (24.0%) | 897 (76.0%) |
| Total (Overall) | 2,976 (53.2%) | 2,614 (46.8%) |
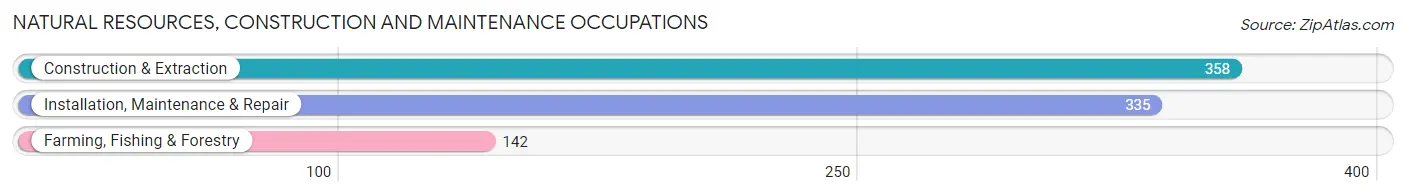
Natural Resources, Construction and Maintenance Occupations
The most common Natural Resources, Construction and Maintenance occupations in Belle Chasse are Construction & Extraction (358 | 6.4%), Installation, Maintenance & Repair (335 | 6.0%), and Farming, Fishing & Forestry (142 | 2.5%).
Natural Resources, Construction and Maintenance Occupations by Sex
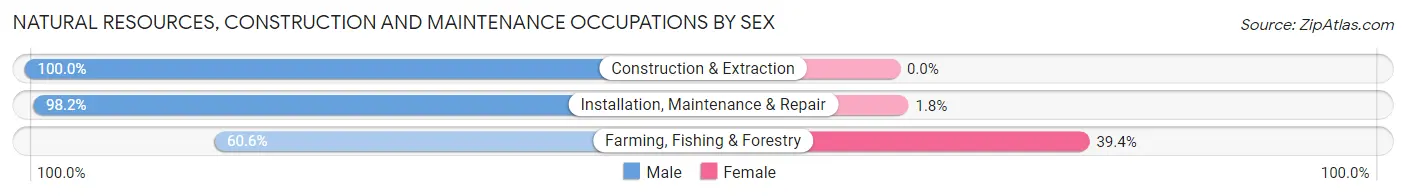
| Occupation | Male | Female |
| Farming, Fishing & Forestry | 86 (60.6%) | 56 (39.4%) |
| Construction & Extraction | 358 (100.0%) | 0 (0.0%) |
| Installation, Maintenance & Repair | 329 (98.2%) | 6 (1.8%) |
| Total (Category) | 773 (92.6%) | 62 (7.4%) |
| Total (Overall) | 2,976 (53.2%) | 2,614 (46.8%) |
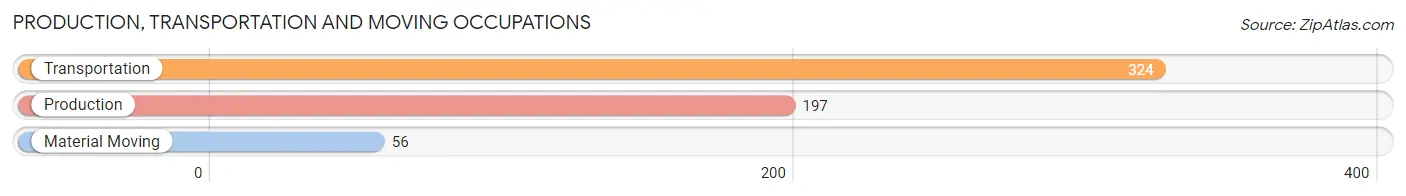
Production, Transportation and Moving Occupations
The most common Production, Transportation and Moving occupations in Belle Chasse are Transportation (324 | 5.8%), Production (197 | 3.5%), and Material Moving (56 | 1.0%).
Production, Transportation and Moving Occupations by Sex
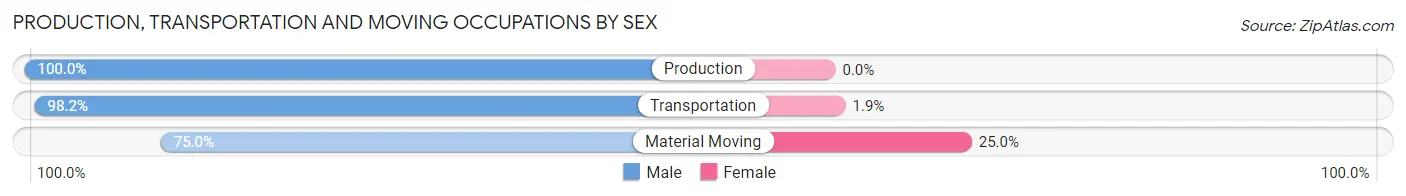
| Occupation | Male | Female |
| Production | 197 (100.0%) | 0 (0.0%) |
| Transportation | 318 (98.2%) | 6 (1.8%) |
| Material Moving | 42 (75.0%) | 14 (25.0%) |
| Total (Category) | 557 (96.5%) | 20 (3.5%) |
| Total (Overall) | 2,976 (53.2%) | 2,614 (46.8%) |
Employment Industries by Sex in Belle Chasse
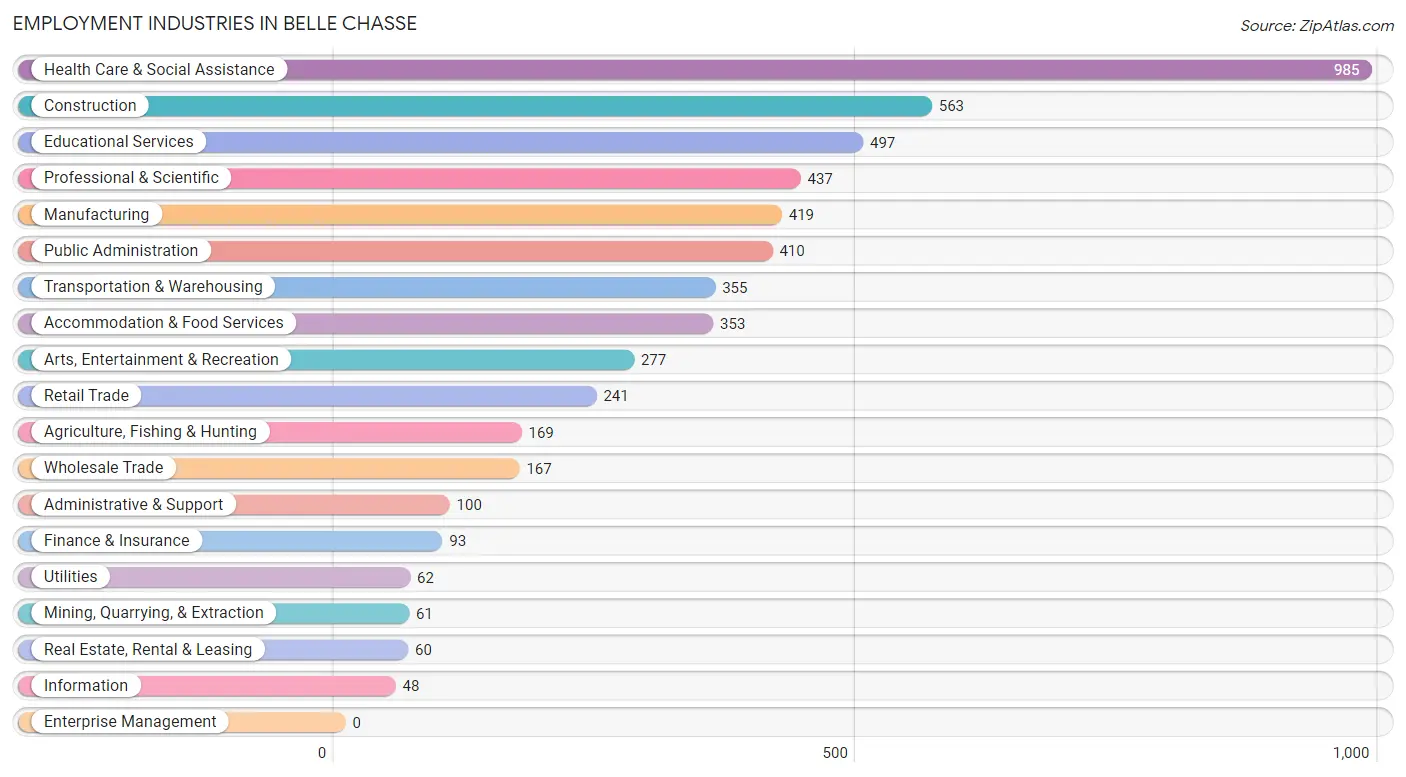
Employment Industries in Belle Chasse
The major employment industries in Belle Chasse include Health Care & Social Assistance (985 | 17.6%), Construction (563 | 10.1%), Educational Services (497 | 8.9%), Professional & Scientific (437 | 7.8%), and Manufacturing (419 | 7.5%).
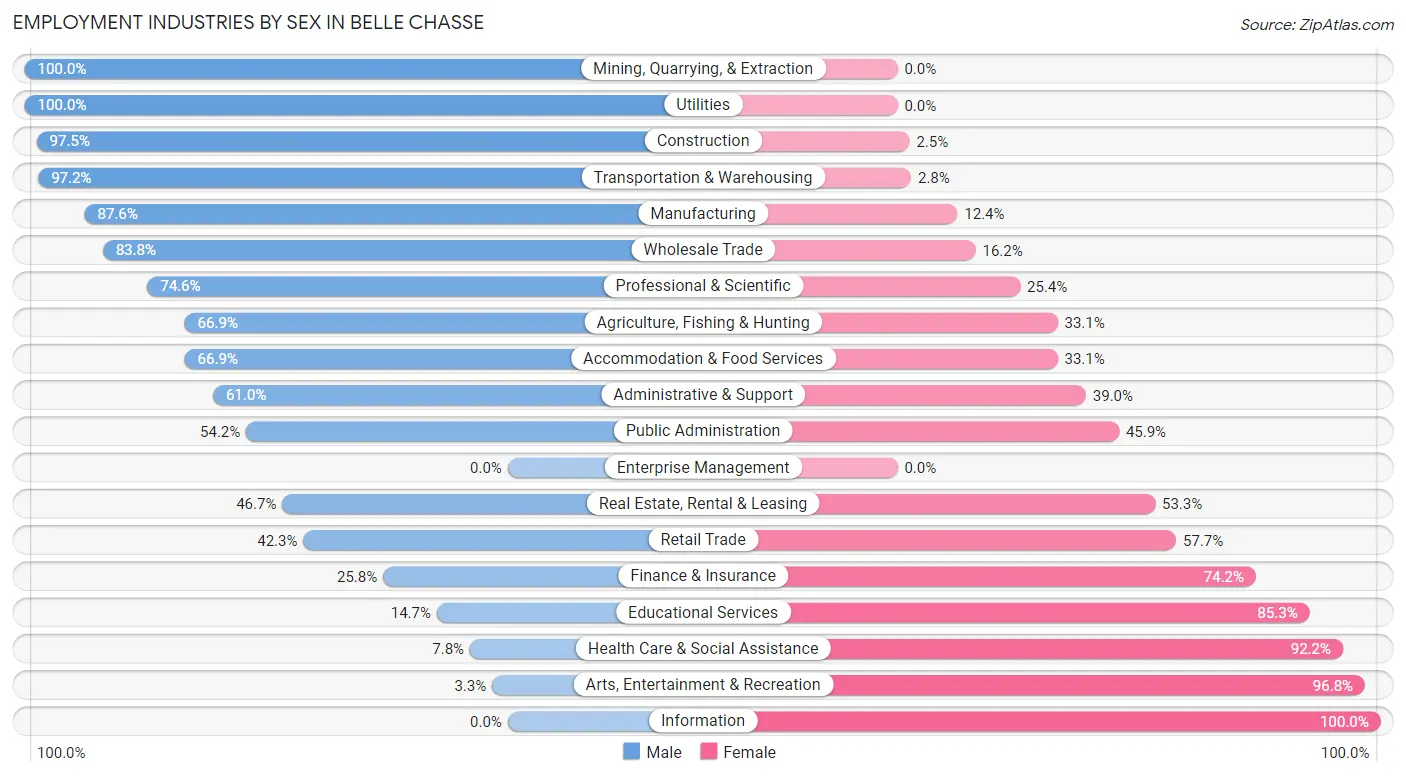
Employment Industries by Sex in Belle Chasse
The Belle Chasse industries that see more men than women are Mining, Quarrying, & Extraction (100.0%), Utilities (100.0%), and Construction (97.5%), whereas the industries that tend to have a higher number of women are Information (100.0%), Arts, Entertainment & Recreation (96.8%), and Health Care & Social Assistance (92.2%).
| Industry | Male | Female |
| Agriculture, Fishing & Hunting | 113 (66.9%) | 56 (33.1%) |
| Mining, Quarrying, & Extraction | 61 (100.0%) | 0 (0.0%) |
| Construction | 549 (97.5%) | 14 (2.5%) |
| Manufacturing | 367 (87.6%) | 52 (12.4%) |
| Wholesale Trade | 140 (83.8%) | 27 (16.2%) |
| Retail Trade | 102 (42.3%) | 139 (57.7%) |
| Transportation & Warehousing | 345 (97.2%) | 10 (2.8%) |
| Utilities | 62 (100.0%) | 0 (0.0%) |
| Information | 0 (0.0%) | 48 (100.0%) |
| Finance & Insurance | 24 (25.8%) | 69 (74.2%) |
| Real Estate, Rental & Leasing | 28 (46.7%) | 32 (53.3%) |
| Professional & Scientific | 326 (74.6%) | 111 (25.4%) |
| Enterprise Management | 0 (0.0%) | 0 (0.0%) |
| Administrative & Support | 61 (61.0%) | 39 (39.0%) |
| Educational Services | 73 (14.7%) | 424 (85.3%) |
| Health Care & Social Assistance | 77 (7.8%) | 908 (92.2%) |
| Arts, Entertainment & Recreation | 9 (3.3%) | 268 (96.8%) |
| Accommodation & Food Services | 236 (66.9%) | 117 (33.1%) |
| Public Administration | 222 (54.1%) | 188 (45.9%) |
| Total | 2,976 (53.2%) | 2,614 (46.8%) |
Education in Belle Chasse
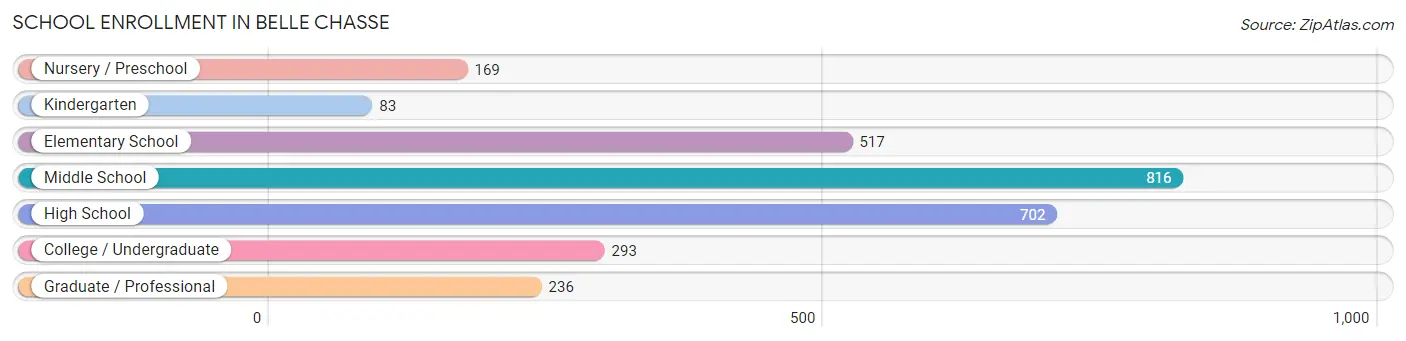
School Enrollment in Belle Chasse
The most common levels of schooling among the 2,816 students in Belle Chasse are middle school (816 | 29.0%), high school (702 | 24.9%), and elementary school (517 | 18.4%).
| School Level | # Students | % Students |
| Nursery / Preschool | 169 | 6.0% |
| Kindergarten | 83 | 2.9% |
| Elementary School | 517 | 18.4% |
| Middle School | 816 | 29.0% |
| High School | 702 | 24.9% |
| College / Undergraduate | 293 | 10.4% |
| Graduate / Professional | 236 | 8.4% |
| Total | 2,816 | 100.0% |
School Enrollment by Age by Funding Source in Belle Chasse
Out of a total of 2,816 students who are enrolled in schools in Belle Chasse, 977 (34.7%) attend a private institution, while the remaining 1,839 (65.3%) are enrolled in public schools. The age group of 3 to 4 year olds has the highest likelihood of being enrolled in private schools, with 100 (73.0% in the age bracket) enrolled. Conversely, the age group of 18 to 19 year olds has the lowest likelihood of being enrolled in a private school, with 187 (100.0% in the age bracket) attending a public institution.
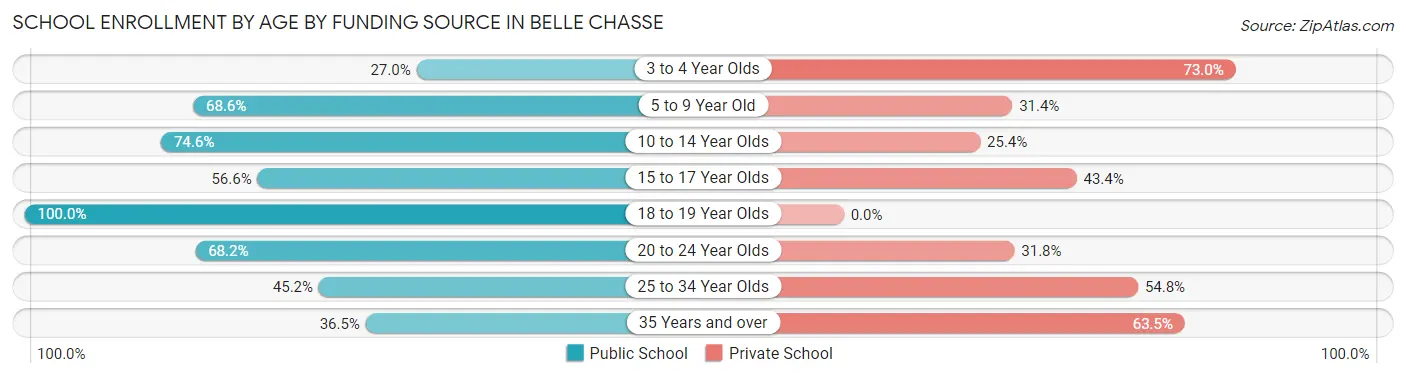
| Age Bracket | Public School | Private School |
| 3 to 4 Year Olds | 37 (27.0%) | 100 (73.0%) |
| 5 to 9 Year Old | 376 (68.6%) | 172 (31.4%) |
| 10 to 14 Year Olds | 690 (74.6%) | 235 (25.4%) |
| 15 to 17 Year Olds | 308 (56.6%) | 236 (43.4%) |
| 18 to 19 Year Olds | 187 (100.0%) | 0 (0.0%) |
| 20 to 24 Year Olds | 103 (68.2%) | 48 (31.8%) |
| 25 to 34 Year Olds | 108 (45.2%) | 131 (54.8%) |
| 35 Years and over | 31 (36.5%) | 54 (63.5%) |
| Total | 1,839 (65.3%) | 977 (34.7%) |
Educational Attainment by Field of Study in Belle Chasse
Business (581 | 26.3%), education (298 | 13.5%), arts & humanities (255 | 11.5%), science & technology (232 | 10.5%), and liberal arts & history (172 | 7.8%) are the most common fields of study among 2,210 individuals in Belle Chasse who have obtained a bachelor's degree or higher.
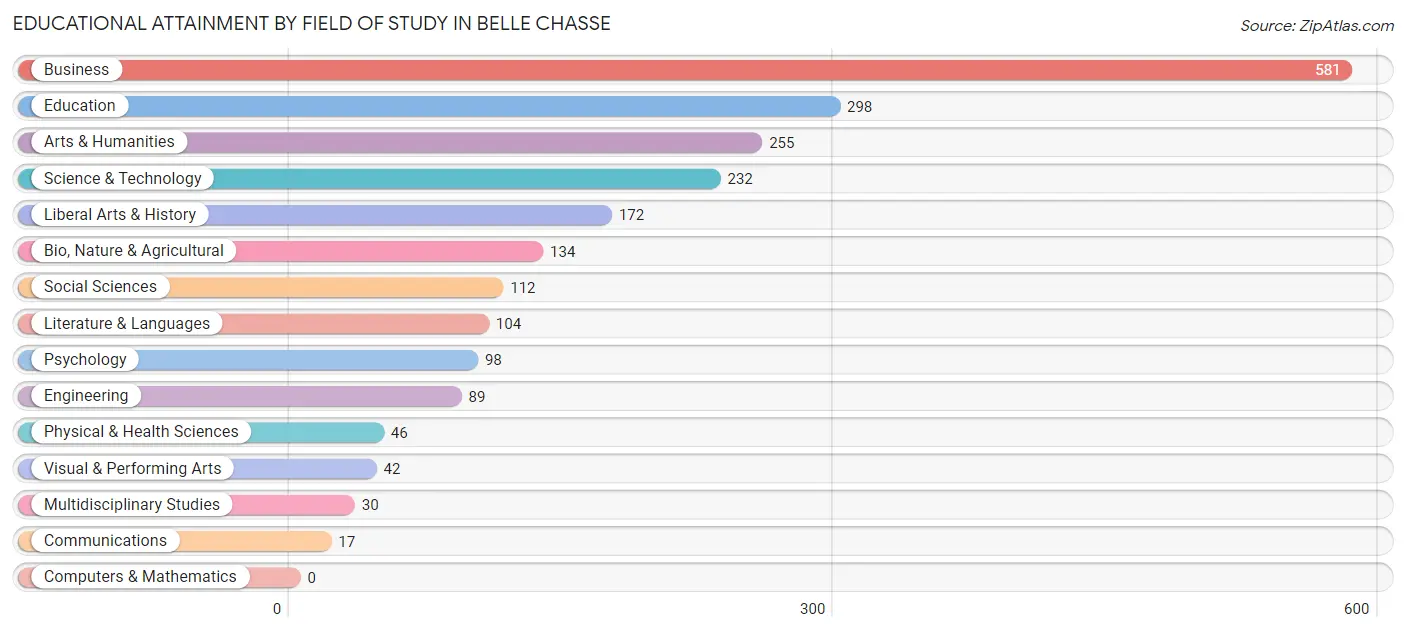
| Field of Study | # Graduates | % Graduates |
| Computers & Mathematics | 0 | 0.0% |
| Bio, Nature & Agricultural | 134 | 6.1% |
| Physical & Health Sciences | 46 | 2.1% |
| Psychology | 98 | 4.4% |
| Social Sciences | 112 | 5.1% |
| Engineering | 89 | 4.0% |
| Multidisciplinary Studies | 30 | 1.4% |
| Science & Technology | 232 | 10.5% |
| Business | 581 | 26.3% |
| Education | 298 | 13.5% |
| Literature & Languages | 104 | 4.7% |
| Liberal Arts & History | 172 | 7.8% |
| Visual & Performing Arts | 42 | 1.9% |
| Communications | 17 | 0.8% |
| Arts & Humanities | 255 | 11.5% |
| Total | 2,210 | 100.0% |
Transportation & Commute in Belle Chasse
Vehicle Availability by Sex in Belle Chasse
The most prevalent vehicle ownership categories in Belle Chasse are males with 2 vehicles (1,393, accounting for 46.6%) and females with 2 vehicles (1,052, making up 53.7%).
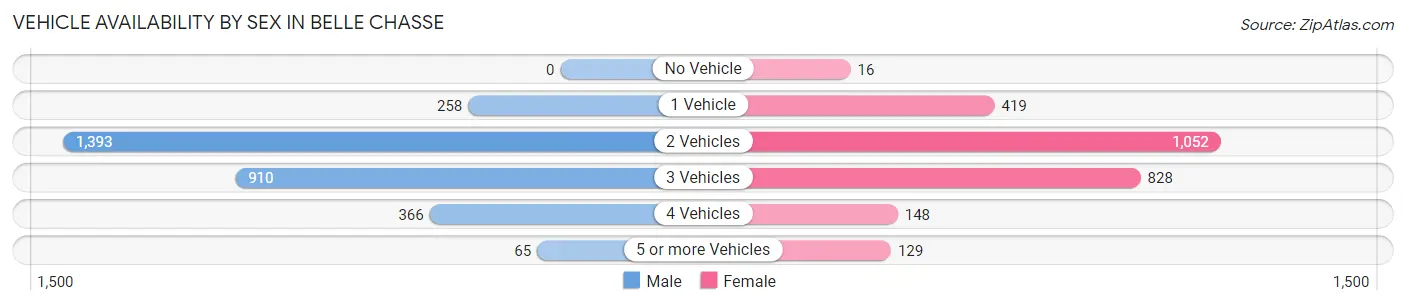
| Vehicles Available | Male | Female |
| No Vehicle | 0 (0.0%) | 16 (0.6%) |
| 1 Vehicle | 258 (8.6%) | 419 (16.2%) |
| 2 Vehicles | 1,393 (46.6%) | 1,052 (40.6%) |
| 3 Vehicles | 910 (30.4%) | 828 (31.9%) |
| 4 Vehicles | 366 (12.2%) | 148 (5.7%) |
| 5 or more Vehicles | 65 (2.2%) | 129 (5.0%) |
| Total | 2,992 (100.0%) | 2,592 (100.0%) |
Commute Time in Belle Chasse
The most frequently occuring commute durations in Belle Chasse are 30 to 34 minutes (1,220 commuters, 22.2%), 10 to 14 minutes (823 commuters, 15.0%), and 15 to 19 minutes (606 commuters, 11.0%).
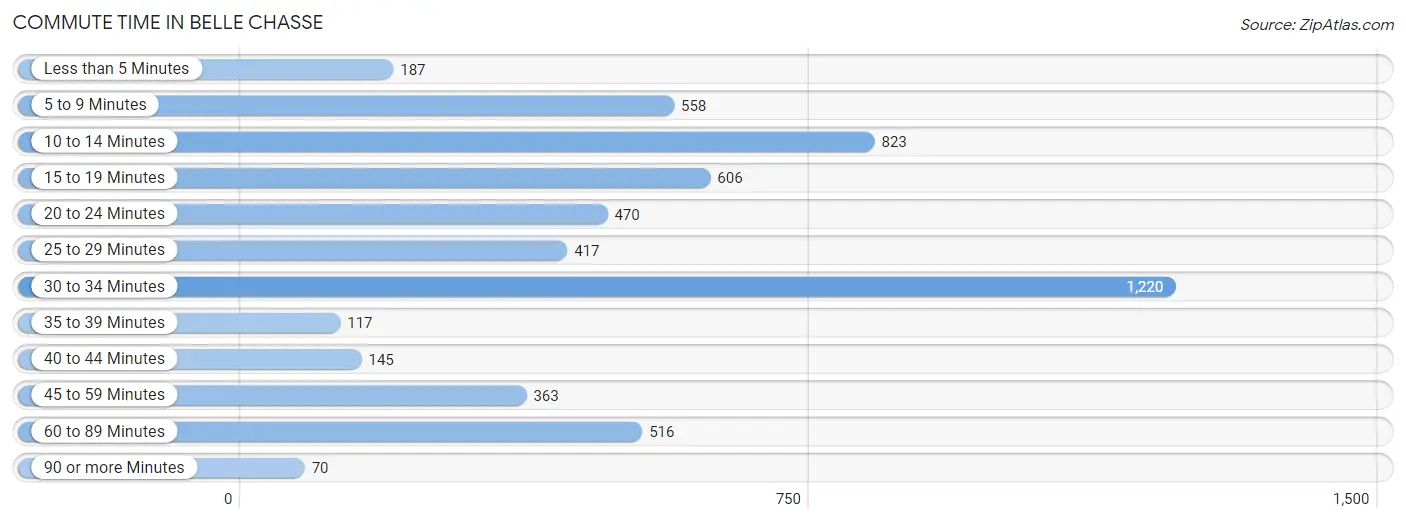
| Commute Time | # Commuters | % Commuters |
| Less than 5 Minutes | 187 | 3.4% |
| 5 to 9 Minutes | 558 | 10.2% |
| 10 to 14 Minutes | 823 | 15.0% |
| 15 to 19 Minutes | 606 | 11.0% |
| 20 to 24 Minutes | 470 | 8.6% |
| 25 to 29 Minutes | 417 | 7.6% |
| 30 to 34 Minutes | 1,220 | 22.2% |
| 35 to 39 Minutes | 117 | 2.1% |
| 40 to 44 Minutes | 145 | 2.6% |
| 45 to 59 Minutes | 363 | 6.6% |
| 60 to 89 Minutes | 516 | 9.4% |
| 90 or more Minutes | 70 | 1.3% |
Commute Time by Sex in Belle Chasse
The most common commute times in Belle Chasse are 30 to 34 minutes (778 commuters, 26.2%) for males and 30 to 34 minutes (442 commuters, 17.5%) for females.
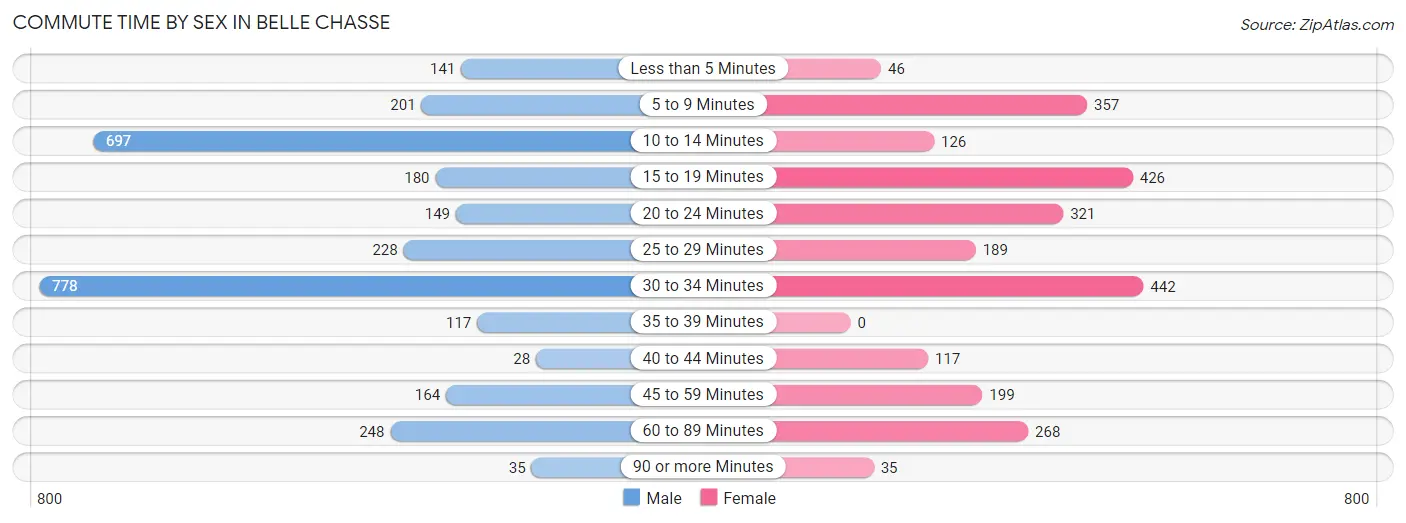
| Commute Time | Male | Female |
| Less than 5 Minutes | 141 (4.8%) | 46 (1.8%) |
| 5 to 9 Minutes | 201 (6.8%) | 357 (14.1%) |
| 10 to 14 Minutes | 697 (23.5%) | 126 (5.0%) |
| 15 to 19 Minutes | 180 (6.1%) | 426 (16.9%) |
| 20 to 24 Minutes | 149 (5.0%) | 321 (12.7%) |
| 25 to 29 Minutes | 228 (7.7%) | 189 (7.5%) |
| 30 to 34 Minutes | 778 (26.2%) | 442 (17.5%) |
| 35 to 39 Minutes | 117 (3.9%) | 0 (0.0%) |
| 40 to 44 Minutes | 28 (0.9%) | 117 (4.6%) |
| 45 to 59 Minutes | 164 (5.5%) | 199 (7.9%) |
| 60 to 89 Minutes | 248 (8.4%) | 268 (10.6%) |
| 90 or more Minutes | 35 (1.2%) | 35 (1.4%) |
Time of Departure to Work by Sex in Belle Chasse
The most frequent times of departure to work in Belle Chasse are 6:30 AM to 6:59 AM (491, 16.6%) for males and 7:30 AM to 7:59 AM (411, 16.3%) for females.
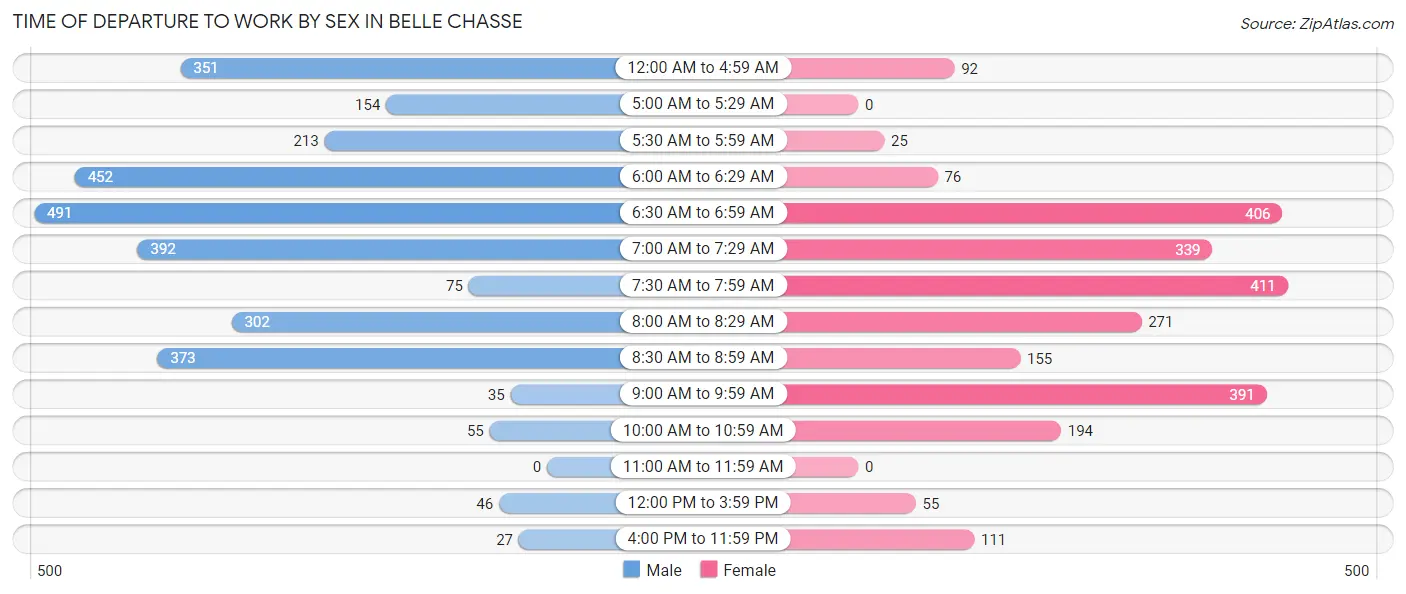
| Time of Departure | Male | Female |
| 12:00 AM to 4:59 AM | 351 (11.8%) | 92 (3.6%) |
| 5:00 AM to 5:29 AM | 154 (5.2%) | 0 (0.0%) |
| 5:30 AM to 5:59 AM | 213 (7.2%) | 25 (1.0%) |
| 6:00 AM to 6:29 AM | 452 (15.2%) | 76 (3.0%) |
| 6:30 AM to 6:59 AM | 491 (16.6%) | 406 (16.1%) |
| 7:00 AM to 7:29 AM | 392 (13.2%) | 339 (13.4%) |
| 7:30 AM to 7:59 AM | 75 (2.5%) | 411 (16.3%) |
| 8:00 AM to 8:29 AM | 302 (10.2%) | 271 (10.7%) |
| 8:30 AM to 8:59 AM | 373 (12.6%) | 155 (6.1%) |
| 9:00 AM to 9:59 AM | 35 (1.2%) | 391 (15.5%) |
| 10:00 AM to 10:59 AM | 55 (1.8%) | 194 (7.7%) |
| 11:00 AM to 11:59 AM | 0 (0.0%) | 0 (0.0%) |
| 12:00 PM to 3:59 PM | 46 (1.5%) | 55 (2.2%) |
| 4:00 PM to 11:59 PM | 27 (0.9%) | 111 (4.4%) |
| Total | 2,966 (100.0%) | 2,526 (100.0%) |
Housing Occupancy in Belle Chasse
Occupancy by Ownership in Belle Chasse
Of the total 3,794 dwellings in Belle Chasse, owner-occupied units account for 2,940 (77.5%), while renter-occupied units make up 854 (22.5%).
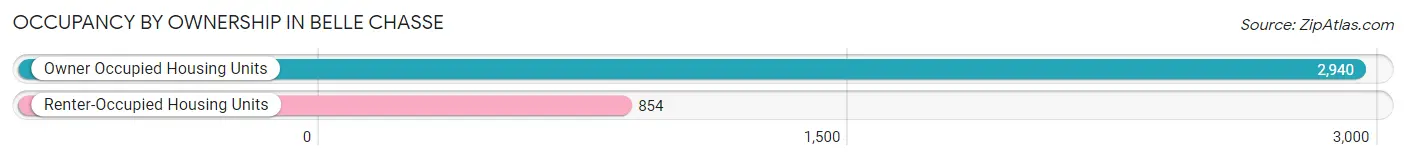
| Occupancy | # Housing Units | % Housing Units |
| Owner Occupied Housing Units | 2,940 | 77.5% |
| Renter-Occupied Housing Units | 854 | 22.5% |
| Total Occupied Housing Units | 3,794 | 100.0% |
Occupancy by Household Size in Belle Chasse
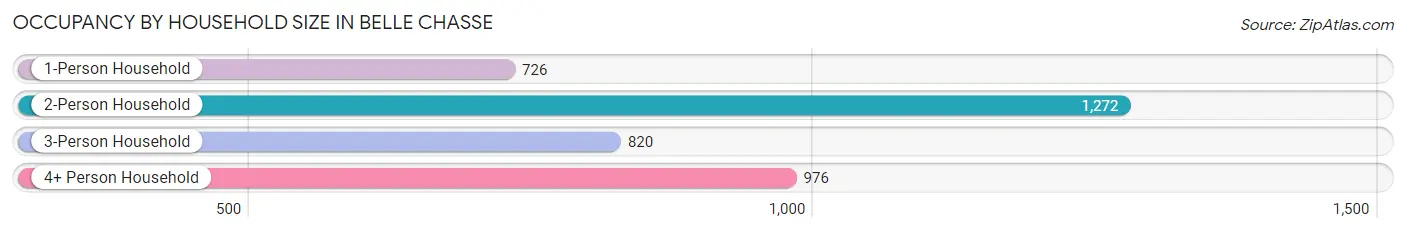
| Household Size | # Housing Units | % Housing Units |
| 1-Person Household | 726 | 19.1% |
| 2-Person Household | 1,272 | 33.5% |
| 3-Person Household | 820 | 21.6% |
| 4+ Person Household | 976 | 25.7% |
| Total Housing Units | 3,794 | 100.0% |
Occupancy by Ownership by Household Size in Belle Chasse
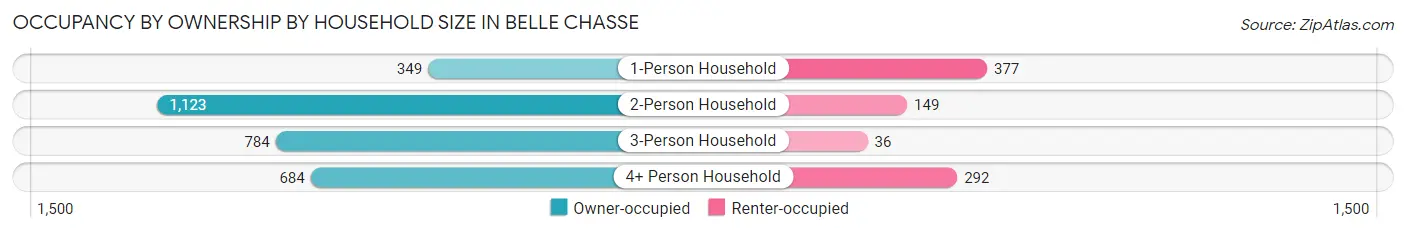
| Household Size | Owner-occupied | Renter-occupied |
| 1-Person Household | 349 (48.1%) | 377 (51.9%) |
| 2-Person Household | 1,123 (88.3%) | 149 (11.7%) |
| 3-Person Household | 784 (95.6%) | 36 (4.4%) |
| 4+ Person Household | 684 (70.1%) | 292 (29.9%) |
| Total Housing Units | 2,940 (77.5%) | 854 (22.5%) |
Occupancy by Educational Attainment in Belle Chasse
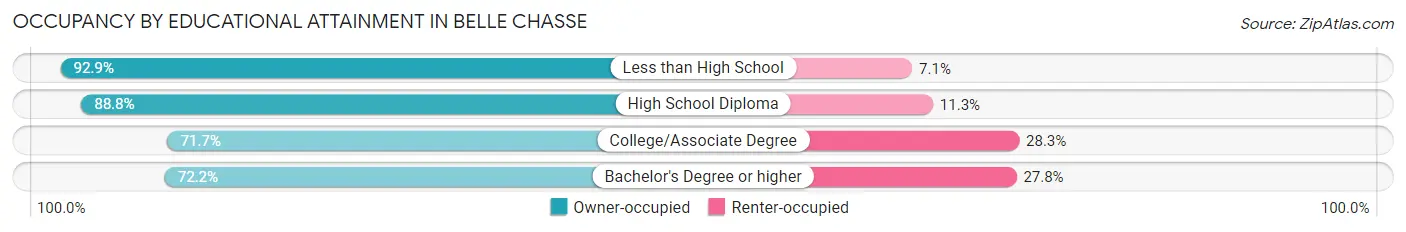
| Household Size | Owner-occupied | Renter-occupied |
| Less than High School | 156 (92.9%) | 12 (7.1%) |
| High School Diploma | 931 (88.7%) | 118 (11.3%) |
| College/Associate Degree | 981 (71.7%) | 388 (28.3%) |
| Bachelor's Degree or higher | 872 (72.2%) | 336 (27.8%) |
Occupancy by Age of Householder in Belle Chasse
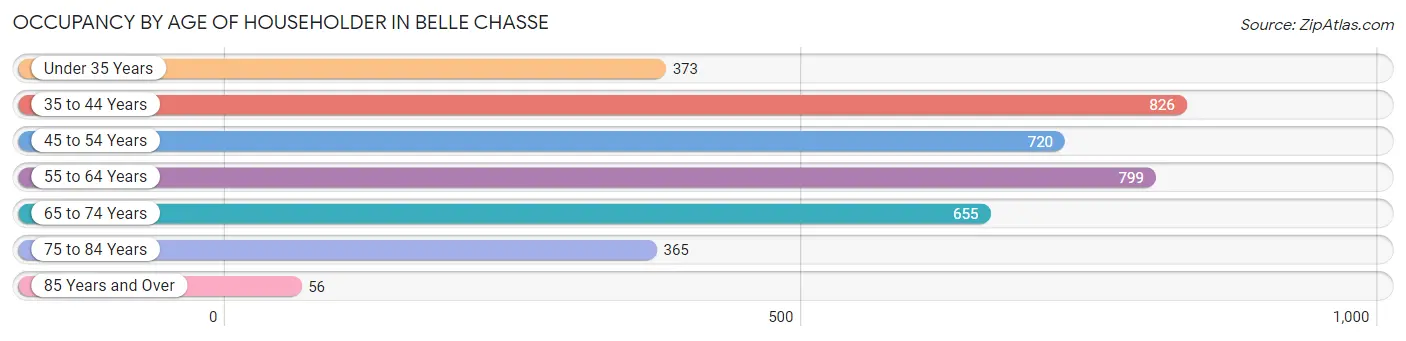
| Age Bracket | # Households | % Households |
| Under 35 Years | 373 | 9.8% |
| 35 to 44 Years | 826 | 21.8% |
| 45 to 54 Years | 720 | 19.0% |
| 55 to 64 Years | 799 | 21.1% |
| 65 to 74 Years | 655 | 17.3% |
| 75 to 84 Years | 365 | 9.6% |
| 85 Years and Over | 56 | 1.5% |
| Total | 3,794 | 100.0% |
Housing Finances in Belle Chasse
Median Income by Occupancy in Belle Chasse
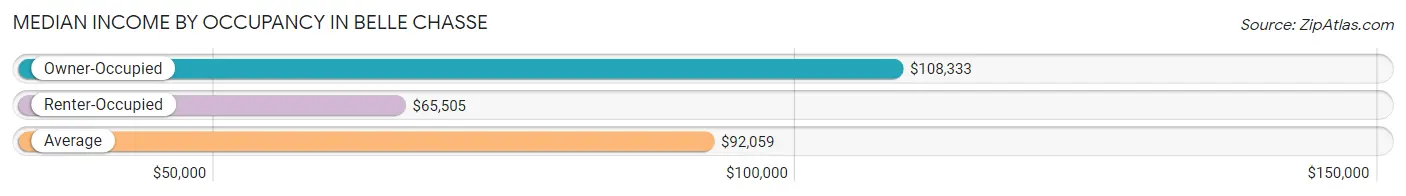
| Occupancy Type | # Households | Median Income |
| Owner-Occupied | 2,940 (77.5%) | $108,333 |
| Renter-Occupied | 854 (22.5%) | $65,505 |
| Average | 3,794 (100.0%) | $92,059 |
Occupancy by Householder Income Bracket in Belle Chasse
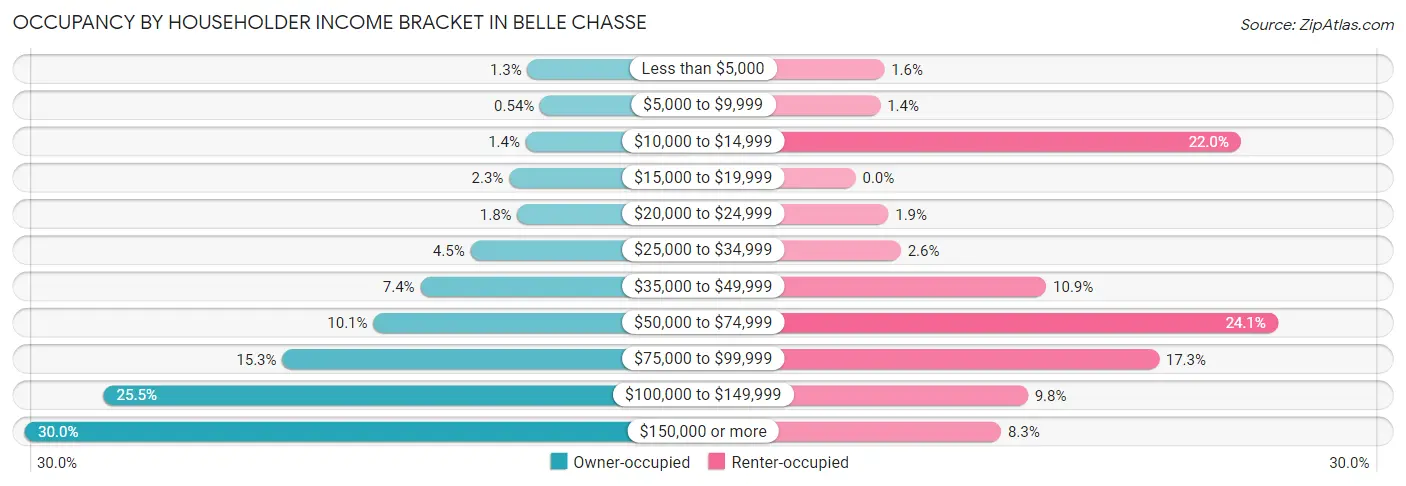
| Income Bracket | Owner-occupied | Renter-occupied |
| Less than $5,000 | 37 (1.3%) | 14 (1.6%) |
| $5,000 to $9,999 | 16 (0.5%) | 12 (1.4%) |
| $10,000 to $14,999 | 40 (1.4%) | 188 (22.0%) |
| $15,000 to $19,999 | 68 (2.3%) | 0 (0.0%) |
| $20,000 to $24,999 | 54 (1.8%) | 16 (1.9%) |
| $25,000 to $34,999 | 133 (4.5%) | 22 (2.6%) |
| $35,000 to $49,999 | 217 (7.4%) | 93 (10.9%) |
| $50,000 to $74,999 | 296 (10.1%) | 206 (24.1%) |
| $75,000 to $99,999 | 449 (15.3%) | 148 (17.3%) |
| $100,000 to $149,999 | 749 (25.5%) | 84 (9.8%) |
| $150,000 or more | 881 (30.0%) | 71 (8.3%) |
| Total | 2,940 (100.0%) | 854 (100.0%) |
Monthly Housing Cost Tiers in Belle Chasse
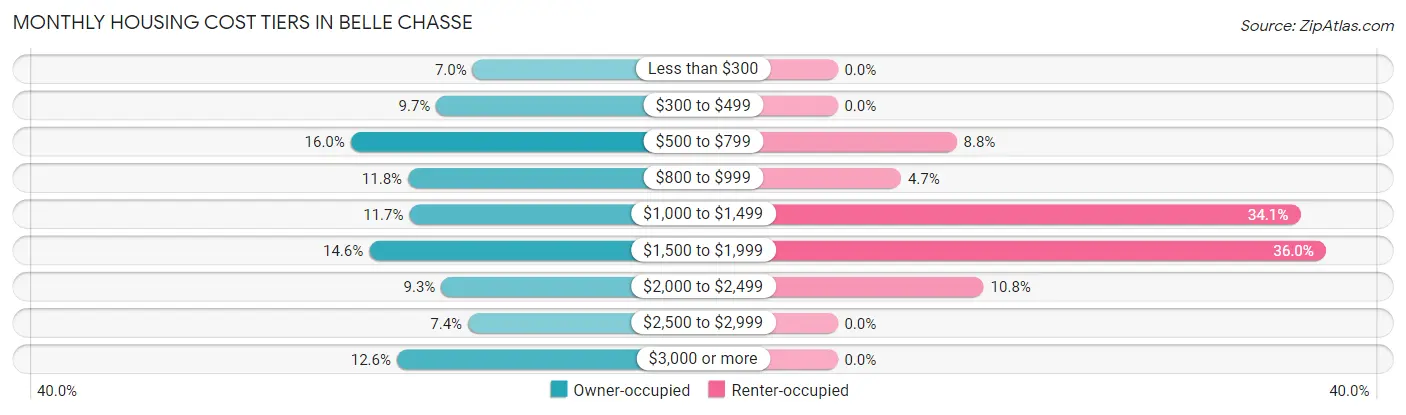
| Monthly Cost | Owner-occupied | Renter-occupied |
| Less than $300 | 206 (7.0%) | 0 (0.0%) |
| $300 to $499 | 285 (9.7%) | 0 (0.0%) |
| $500 to $799 | 470 (16.0%) | 75 (8.8%) |
| $800 to $999 | 346 (11.8%) | 40 (4.7%) |
| $1,000 to $1,499 | 343 (11.7%) | 291 (34.1%) |
| $1,500 to $1,999 | 430 (14.6%) | 307 (35.9%) |
| $2,000 to $2,499 | 274 (9.3%) | 92 (10.8%) |
| $2,500 to $2,999 | 216 (7.3%) | 0 (0.0%) |
| $3,000 or more | 370 (12.6%) | 0 (0.0%) |
| Total | 2,940 (100.0%) | 854 (100.0%) |
Physical Housing Characteristics in Belle Chasse
Housing Structures in Belle Chasse
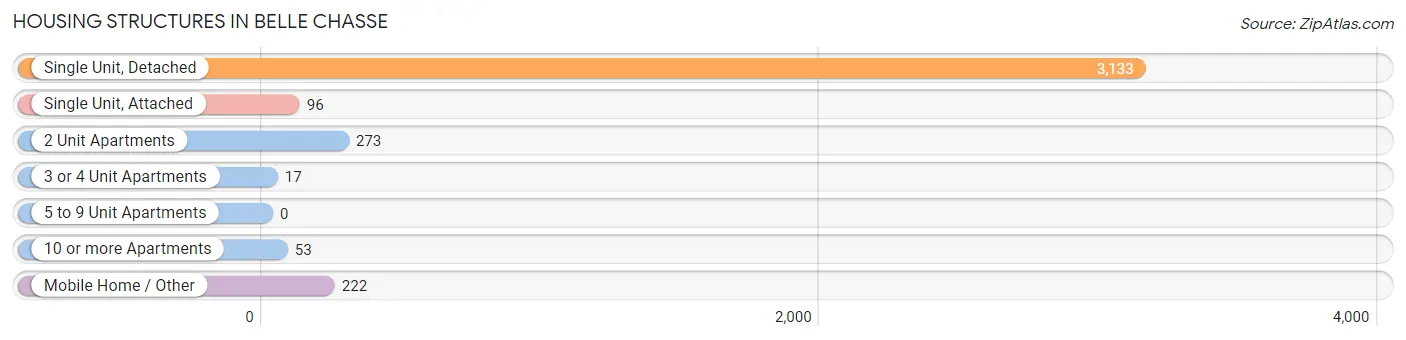
| Structure Type | # Housing Units | % Housing Units |
| Single Unit, Detached | 3,133 | 82.6% |
| Single Unit, Attached | 96 | 2.5% |
| 2 Unit Apartments | 273 | 7.2% |
| 3 or 4 Unit Apartments | 17 | 0.4% |
| 5 to 9 Unit Apartments | 0 | 0.0% |
| 10 or more Apartments | 53 | 1.4% |
| Mobile Home / Other | 222 | 5.9% |
| Total | 3,794 | 100.0% |
Housing Structures by Occupancy in Belle Chasse
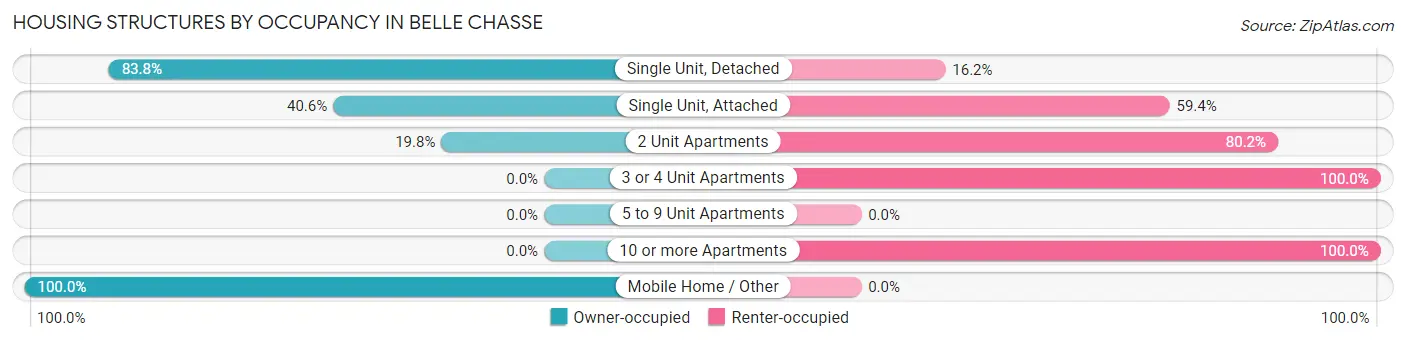
| Structure Type | Owner-occupied | Renter-occupied |
| Single Unit, Detached | 2,625 (83.8%) | 508 (16.2%) |
| Single Unit, Attached | 39 (40.6%) | 57 (59.4%) |
| 2 Unit Apartments | 54 (19.8%) | 219 (80.2%) |
| 3 or 4 Unit Apartments | 0 (0.0%) | 17 (100.0%) |
| 5 to 9 Unit Apartments | 0 (0.0%) | 0 (0.0%) |
| 10 or more Apartments | 0 (0.0%) | 53 (100.0%) |
| Mobile Home / Other | 222 (100.0%) | 0 (0.0%) |
| Total | 2,940 (77.5%) | 854 (22.5%) |
Housing Structures by Number of Rooms in Belle Chasse
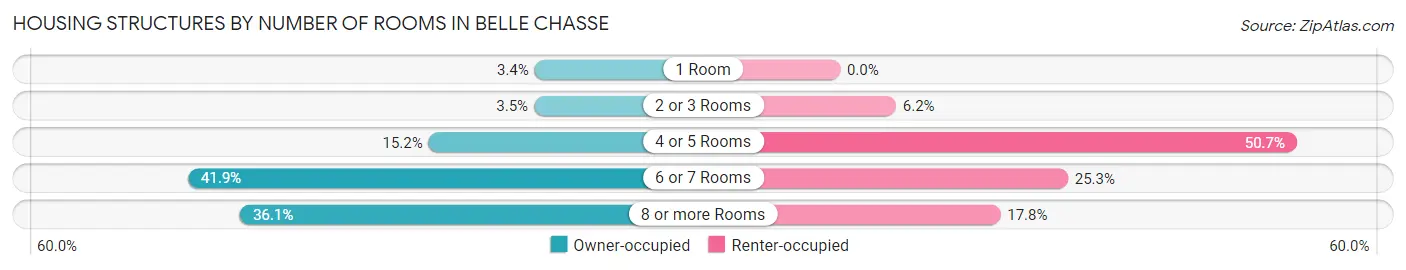
| Number of Rooms | Owner-occupied | Renter-occupied |
| 1 Room | 100 (3.4%) | 0 (0.0%) |
| 2 or 3 Rooms | 102 (3.5%) | 53 (6.2%) |
| 4 or 5 Rooms | 446 (15.2%) | 433 (50.7%) |
| 6 or 7 Rooms | 1,231 (41.9%) | 216 (25.3%) |
| 8 or more Rooms | 1,061 (36.1%) | 152 (17.8%) |
| Total | 2,940 (100.0%) | 854 (100.0%) |
Housing Structure by Heating Type in Belle Chasse
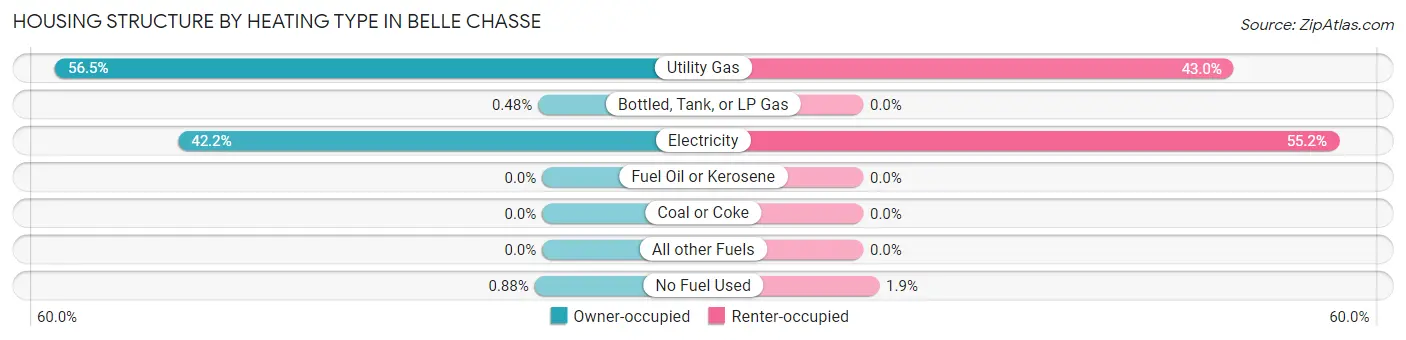
| Heating Type | Owner-occupied | Renter-occupied |
| Utility Gas | 1,660 (56.5%) | 367 (43.0%) |
| Bottled, Tank, or LP Gas | 14 (0.5%) | 0 (0.0%) |
| Electricity | 1,240 (42.2%) | 471 (55.1%) |
| Fuel Oil or Kerosene | 0 (0.0%) | 0 (0.0%) |
| Coal or Coke | 0 (0.0%) | 0 (0.0%) |
| All other Fuels | 0 (0.0%) | 0 (0.0%) |
| No Fuel Used | 26 (0.9%) | 16 (1.9%) |
| Total | 2,940 (100.0%) | 854 (100.0%) |
Household Vehicle Usage in Belle Chasse
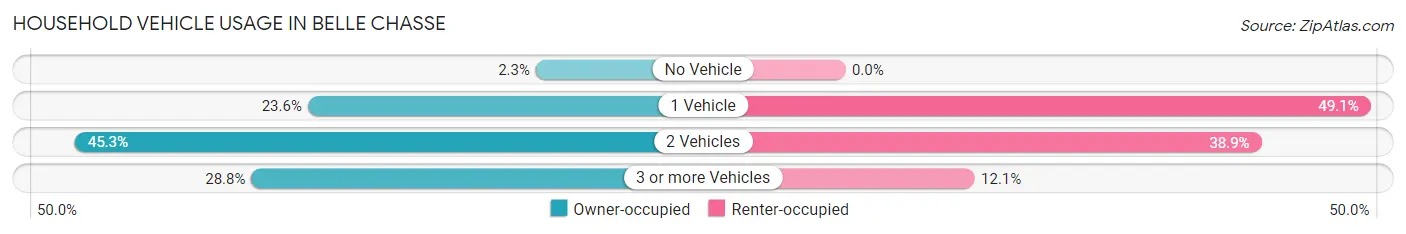
| Vehicles per Household | Owner-occupied | Renter-occupied |
| No Vehicle | 67 (2.3%) | 0 (0.0%) |
| 1 Vehicle | 693 (23.6%) | 419 (49.1%) |
| 2 Vehicles | 1,332 (45.3%) | 332 (38.9%) |
| 3 or more Vehicles | 848 (28.8%) | 103 (12.1%) |
| Total | 2,940 (100.0%) | 854 (100.0%) |
Real Estate & Mortgages in Belle Chasse
Real Estate and Mortgage Overview in Belle Chasse
| Characteristic | Without Mortgage | With Mortgage |
| Housing Units | 1,464 | 1,476 |
| Median Property Value | $305,500 | $386,400 |
| Median Household Income | $81,523 | $552 |
| Monthly Housing Costs | $598 | $370 |
| Real Estate Taxes | $1,352 | $116 |
Property Value by Mortgage Status in Belle Chasse
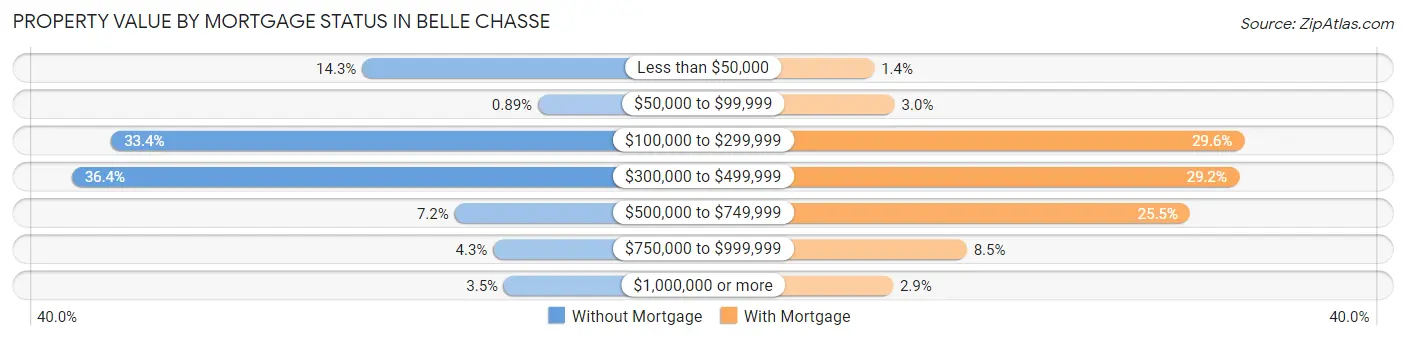
| Property Value | Without Mortgage | With Mortgage |
| Less than $50,000 | 209 (14.3%) | 21 (1.4%) |
| $50,000 to $99,999 | 13 (0.9%) | 44 (3.0%) |
| $100,000 to $299,999 | 489 (33.4%) | 437 (29.6%) |
| $300,000 to $499,999 | 533 (36.4%) | 431 (29.2%) |
| $500,000 to $749,999 | 106 (7.2%) | 376 (25.5%) |
| $750,000 to $999,999 | 63 (4.3%) | 125 (8.5%) |
| $1,000,000 or more | 51 (3.5%) | 42 (2.9%) |
| Total | 1,464 (100.0%) | 1,476 (100.0%) |
Household Income by Mortgage Status in Belle Chasse
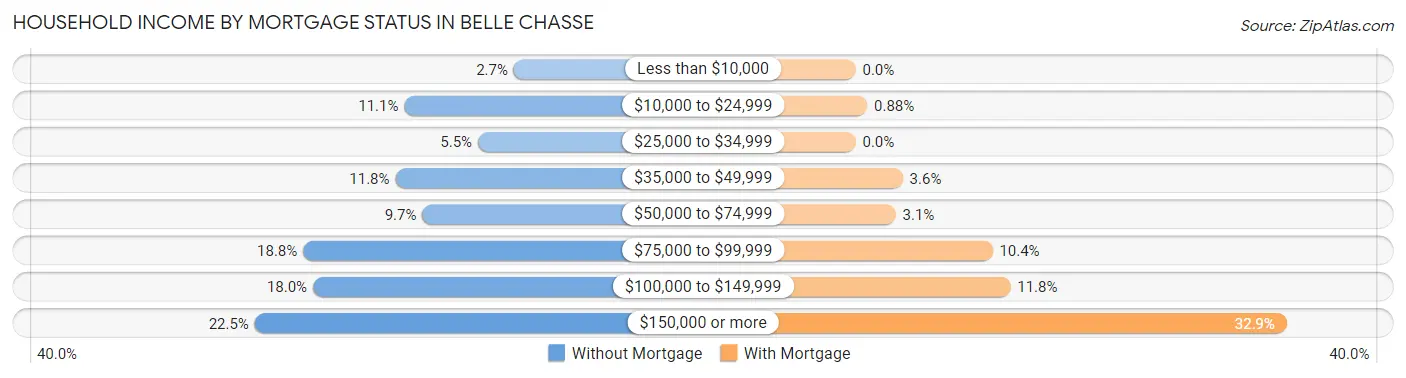
| Household Income | Without Mortgage | With Mortgage |
| Less than $10,000 | 40 (2.7%) | 0 (0.0%) |
| $10,000 to $24,999 | 162 (11.1%) | 13 (0.9%) |
| $25,000 to $34,999 | 80 (5.5%) | 0 (0.0%) |
| $35,000 to $49,999 | 172 (11.7%) | 53 (3.6%) |
| $50,000 to $74,999 | 142 (9.7%) | 45 (3.0%) |
| $75,000 to $99,999 | 275 (18.8%) | 154 (10.4%) |
| $100,000 to $149,999 | 264 (18.0%) | 174 (11.8%) |
| $150,000 or more | 329 (22.5%) | 485 (32.9%) |
| Total | 1,464 (100.0%) | 1,476 (100.0%) |
Property Value to Household Income Ratio in Belle Chasse
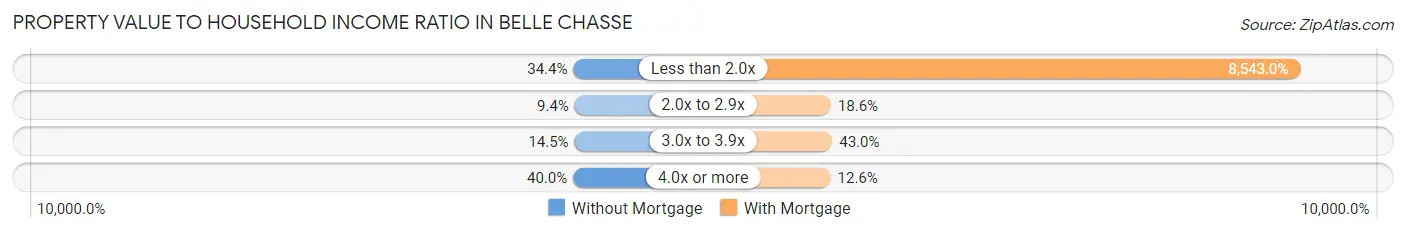
| Value-to-Income Ratio | Without Mortgage | With Mortgage |
| Less than 2.0x | 504 (34.4%) | 126,094 (8,543.0%) |
| 2.0x to 2.9x | 138 (9.4%) | 274 (18.6%) |
| 3.0x to 3.9x | 212 (14.5%) | 634 (42.9%) |
| 4.0x or more | 586 (40.0%) | 186 (12.6%) |
| Total | 1,464 (100.0%) | 1,476 (100.0%) |
Real Estate Taxes by Mortgage Status in Belle Chasse
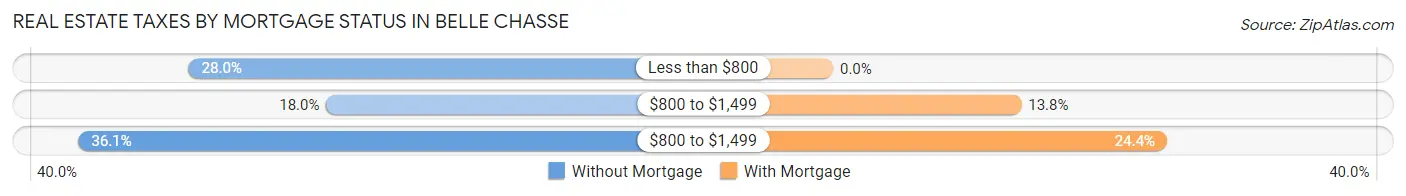
| Property Taxes | Without Mortgage | With Mortgage |
| Less than $800 | 410 (28.0%) | 0 (0.0%) |
| $800 to $1,499 | 264 (18.0%) | 203 (13.8%) |
| $800 to $1,499 | 528 (36.1%) | 360 (24.4%) |
| Total | 1,464 (100.0%) | 1,476 (100.0%) |
Health & Disability in Belle Chasse
Health Insurance Coverage by Age in Belle Chasse
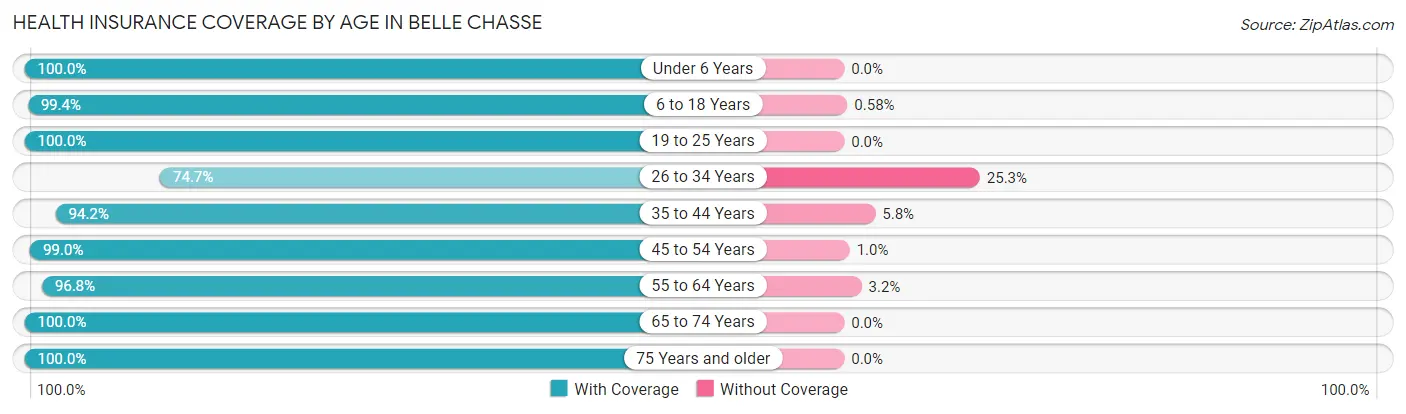
| Age Bracket | With Coverage | Without Coverage |
| Under 6 Years | 590 (100.0%) | 0 (0.0%) |
| 6 to 18 Years | 2,066 (99.4%) | 12 (0.6%) |
| 19 to 25 Years | 722 (100.0%) | 0 (0.0%) |
| 26 to 34 Years | 946 (74.7%) | 320 (25.3%) |
| 35 to 44 Years | 1,334 (94.2%) | 82 (5.8%) |
| 45 to 54 Years | 1,366 (99.0%) | 14 (1.0%) |
| 55 to 64 Years | 1,468 (96.8%) | 49 (3.2%) |
| 65 to 74 Years | 1,092 (100.0%) | 0 (0.0%) |
| 75 Years and older | 622 (100.0%) | 0 (0.0%) |
| Total | 10,206 (95.5%) | 477 (4.5%) |
Health Insurance Coverage by Citizenship Status in Belle Chasse
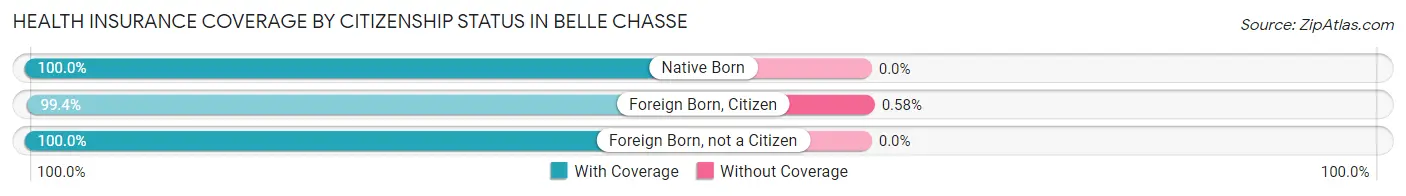
| Citizenship Status | With Coverage | Without Coverage |
| Native Born | 590 (100.0%) | 0 (0.0%) |
| Foreign Born, Citizen | 2,066 (99.4%) | 12 (0.6%) |
| Foreign Born, not a Citizen | 722 (100.0%) | 0 (0.0%) |
Health Insurance Coverage by Household Income in Belle Chasse
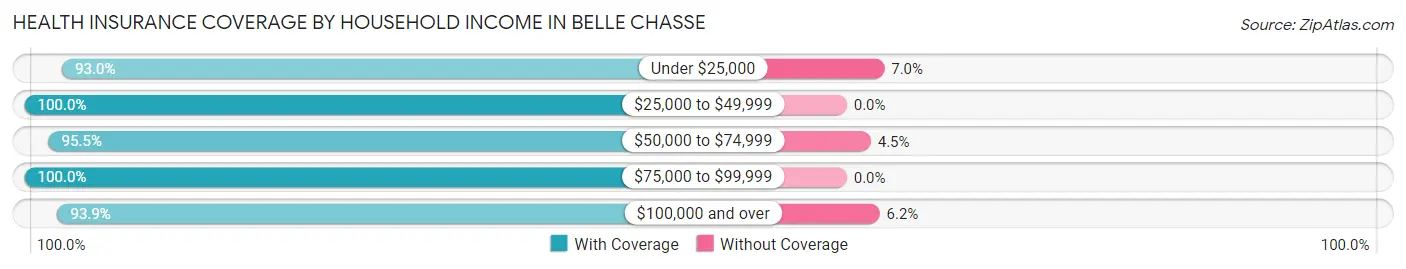
| Household Income | With Coverage | Without Coverage |
| Under $25,000 | 609 (93.0%) | 46 (7.0%) |
| $25,000 to $49,999 | 746 (100.0%) | 0 (0.0%) |
| $50,000 to $74,999 | 1,466 (95.5%) | 69 (4.5%) |
| $75,000 to $99,999 | 1,853 (100.0%) | 0 (0.0%) |
| $100,000 and over | 5,524 (93.9%) | 362 (6.1%) |
Public vs Private Health Insurance Coverage by Age in Belle Chasse
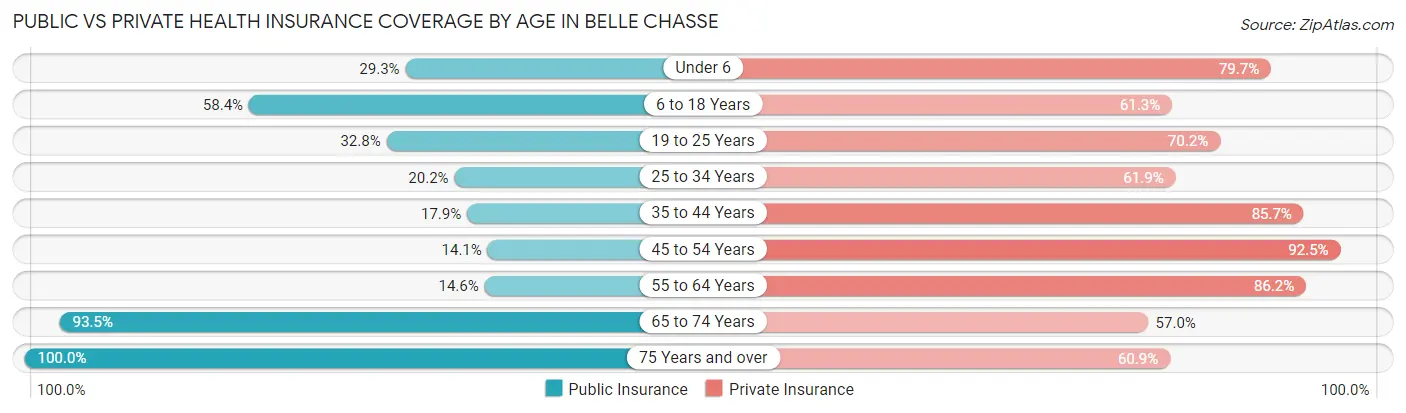
| Age Bracket | Public Insurance | Private Insurance |
| Under 6 | 173 (29.3%) | 470 (79.7%) |
| 6 to 18 Years | 1,213 (58.4%) | 1,274 (61.3%) |
| 19 to 25 Years | 237 (32.8%) | 507 (70.2%) |
| 25 to 34 Years | 256 (20.2%) | 784 (61.9%) |
| 35 to 44 Years | 253 (17.9%) | 1,214 (85.7%) |
| 45 to 54 Years | 194 (14.1%) | 1,277 (92.5%) |
| 55 to 64 Years | 222 (14.6%) | 1,307 (86.2%) |
| 65 to 74 Years | 1,021 (93.5%) | 622 (57.0%) |
| 75 Years and over | 622 (100.0%) | 379 (60.9%) |
| Total | 4,191 (39.2%) | 7,834 (73.3%) |
Disability Status by Sex by Age in Belle Chasse
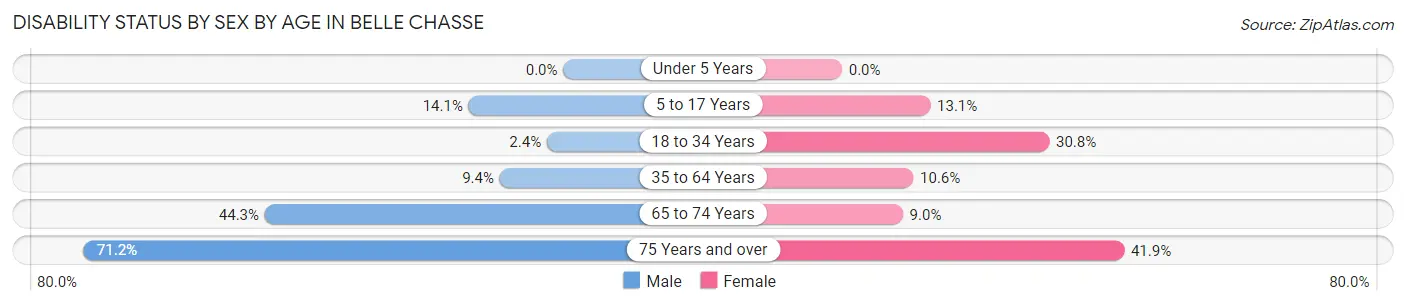
| Age Bracket | Male | Female |
| Under 5 Years | 0 (0.0%) | 0 (0.0%) |
| 5 to 17 Years | 162 (14.1%) | 113 (13.1%) |
| 18 to 34 Years | 27 (2.4%) | 316 (30.8%) |
| 35 to 64 Years | 186 (9.4%) | 248 (10.6%) |
| 65 to 74 Years | 234 (44.3%) | 51 (9.0%) |
| 75 Years and over | 210 (71.2%) | 137 (41.9%) |
Disability Class by Sex by Age in Belle Chasse
Disability Class: Hearing Difficulty
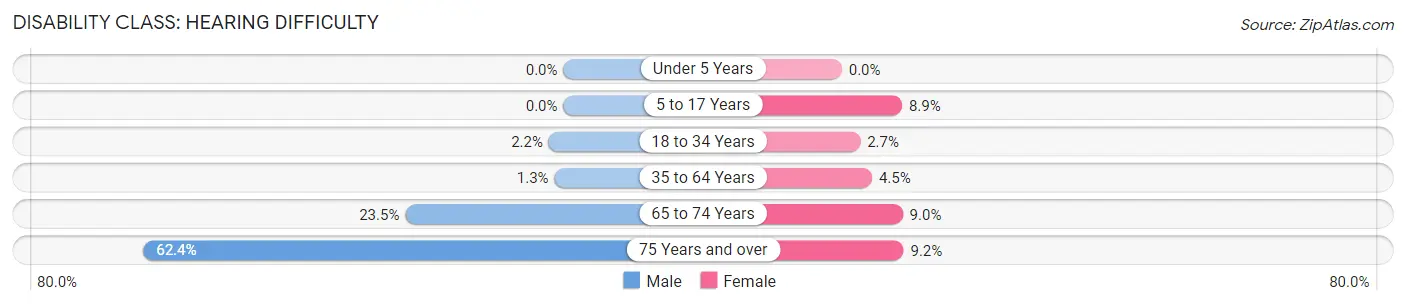
| Age Bracket | Male | Female |
| Under 5 Years | 0 (0.0%) | 0 (0.0%) |
| 5 to 17 Years | 0 (0.0%) | 77 (8.9%) |
| 18 to 34 Years | 24 (2.2%) | 28 (2.7%) |
| 35 to 64 Years | 26 (1.3%) | 105 (4.5%) |
| 65 to 74 Years | 124 (23.5%) | 51 (9.0%) |
| 75 Years and over | 184 (62.4%) | 30 (9.2%) |
Disability Class: Vision Difficulty
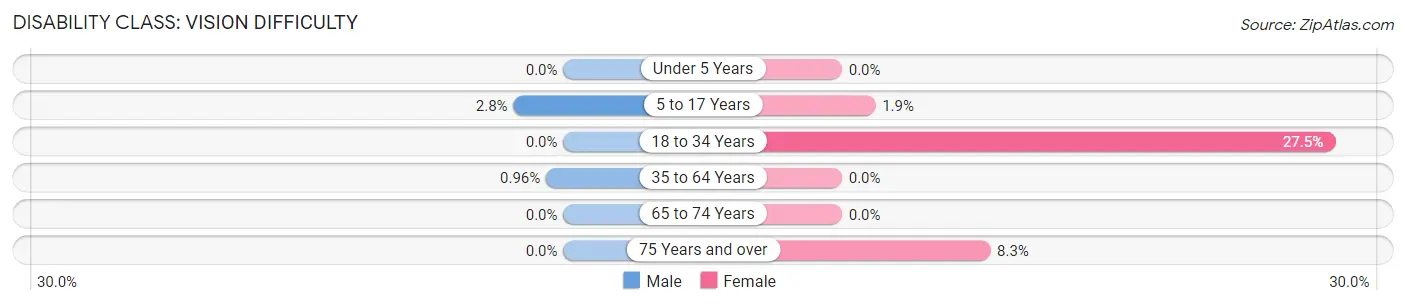
| Age Bracket | Male | Female |
| Under 5 Years | 0 (0.0%) | 0 (0.0%) |
| 5 to 17 Years | 32 (2.8%) | 16 (1.9%) |
| 18 to 34 Years | 0 (0.0%) | 282 (27.5%) |
| 35 to 64 Years | 19 (1.0%) | 0 (0.0%) |
| 65 to 74 Years | 0 (0.0%) | 0 (0.0%) |
| 75 Years and over | 0 (0.0%) | 27 (8.3%) |
Disability Class: Cognitive Difficulty
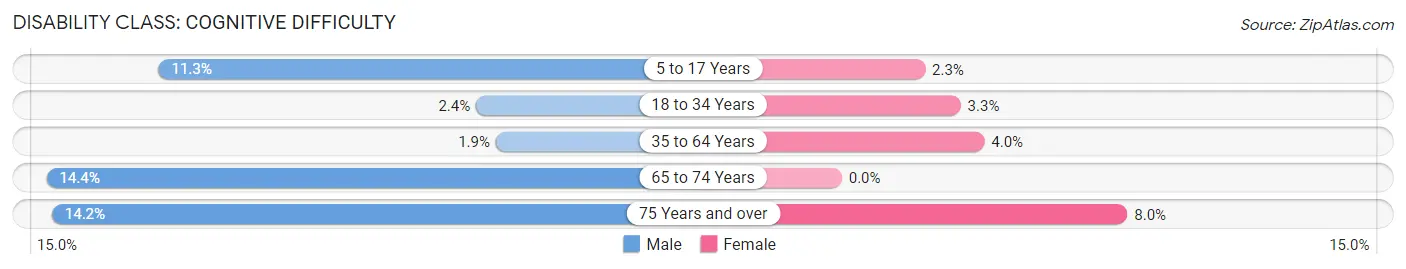
| Age Bracket | Male | Female |
| 5 to 17 Years | 130 (11.3%) | 20 (2.3%) |
| 18 to 34 Years | 27 (2.4%) | 34 (3.3%) |
| 35 to 64 Years | 37 (1.9%) | 93 (4.0%) |
| 65 to 74 Years | 76 (14.4%) | 0 (0.0%) |
| 75 Years and over | 42 (14.2%) | 26 (8.0%) |
Disability Class: Ambulatory Difficulty
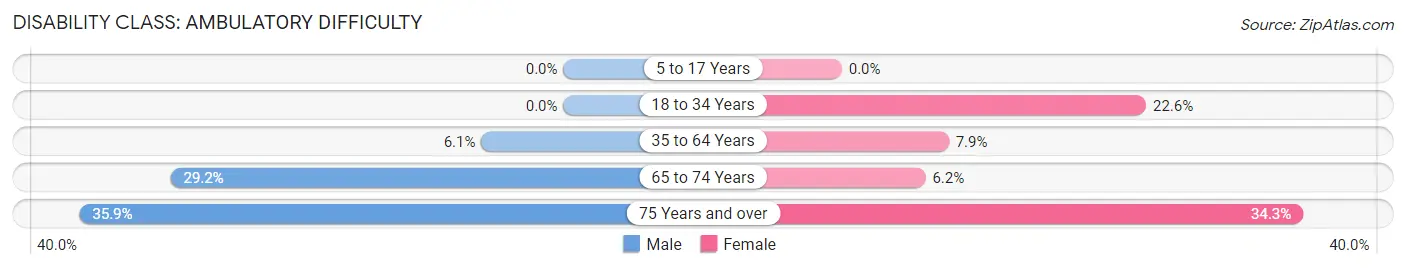
| Age Bracket | Male | Female |
| 5 to 17 Years | 0 (0.0%) | 0 (0.0%) |
| 18 to 34 Years | 0 (0.0%) | 232 (22.6%) |
| 35 to 64 Years | 120 (6.1%) | 186 (7.9%) |
| 65 to 74 Years | 154 (29.2%) | 35 (6.2%) |
| 75 Years and over | 106 (35.9%) | 112 (34.3%) |
Disability Class: Self-Care Difficulty
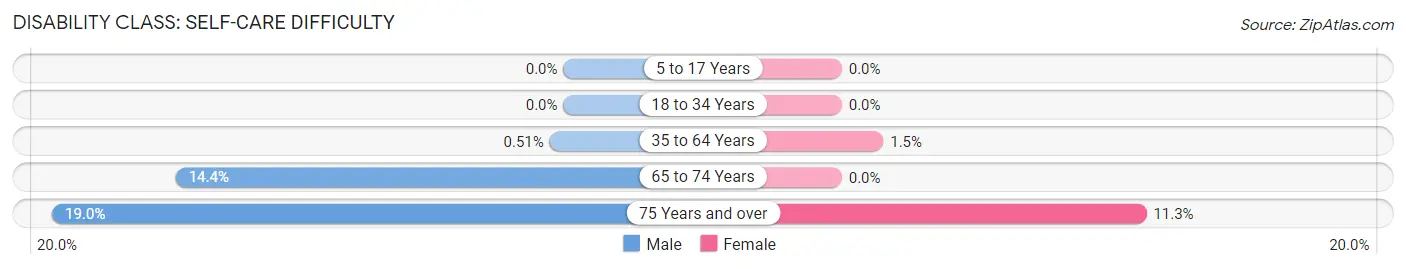
| Age Bracket | Male | Female |
| 5 to 17 Years | 0 (0.0%) | 0 (0.0%) |
| 18 to 34 Years | 0 (0.0%) | 0 (0.0%) |
| 35 to 64 Years | 10 (0.5%) | 36 (1.5%) |
| 65 to 74 Years | 76 (14.4%) | 0 (0.0%) |
| 75 Years and over | 56 (19.0%) | 37 (11.3%) |
Technology Access in Belle Chasse
Computing Device Access in Belle Chasse
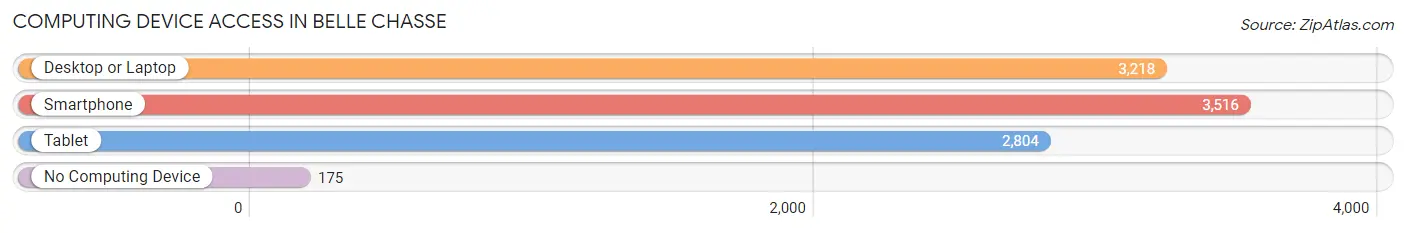
| Device Type | # Households | % Households |
| Desktop or Laptop | 3,218 | 84.8% |
| Smartphone | 3,516 | 92.7% |
| Tablet | 2,804 | 73.9% |
| No Computing Device | 175 | 4.6% |
| Total | 3,794 | 100.0% |
Internet Access in Belle Chasse
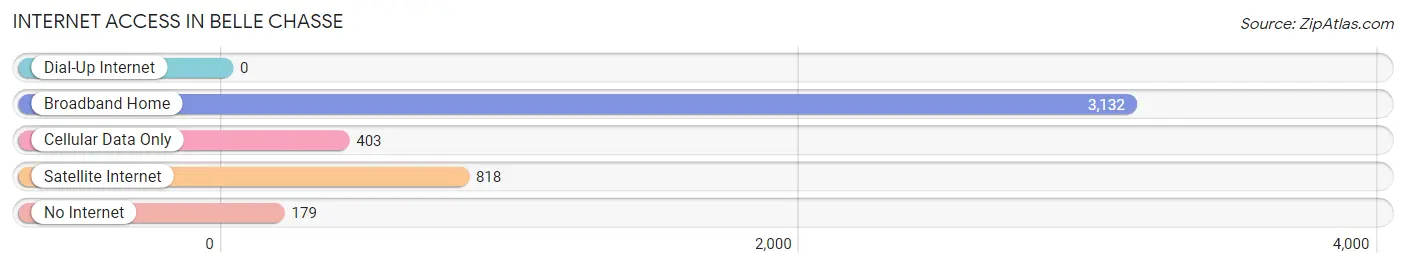
| Internet Type | # Households | % Households |
| Dial-Up Internet | 0 | 0.0% |
| Broadband Home | 3,132 | 82.6% |
| Cellular Data Only | 403 | 10.6% |
| Satellite Internet | 818 | 21.6% |
| No Internet | 179 | 4.7% |
| Total | 3,794 | 100.0% |
Belle Chasse Summary
Belle Chasse is a small town located in Plaquemines Parish, Louisiana. It is situated on the west bank of the Mississippi River, about 25 miles south of New Orleans. The town is part of the Greater New Orleans Metropolitan Area and is home to a population of approximately 8,000 people.
History
Belle Chasse was founded in 1719 by French settlers, who named it after the beautiful hunting grounds they found in the area. The town was originally part of the French colony of Louisiana, and was later ceded to the United States in 1803 as part of the Louisiana Purchase. During the Civil War, Belle Chasse was the site of several battles, including the Battle of Forts Jackson and St. Philip. After the war, the town experienced a period of growth and development, and by the early 20th century, it had become a thriving agricultural and commercial center.
Geography
Belle Chasse is located in Plaquemines Parish, Louisiana, on the west bank of the Mississippi River. The town is situated about 25 miles south of New Orleans and is part of the Greater New Orleans Metropolitan Area. The town is bordered by the Mississippi River to the east, the Gulf of Mexico to the south, and the Intracoastal Waterway to the west. The town is located at an elevation of 8 feet above sea level.
Economy
Belle Chasse is a small town with a diverse economy. The town is home to a variety of businesses, including retail stores, restaurants, and professional services. The town is also home to several industrial facilities, including a chemical plant and a shipbuilding facility. The town is also home to a large military base, Naval Air Station Joint Reserve Base New Orleans, which provides a significant economic boost to the local economy.
Demographics
As of the 2010 census, Belle Chasse had a population of 8,049 people. The racial makeup of the town was 79.3% White, 15.2% African American, 0.5% Native American, 1.2% Asian, 0.1% Pacific Islander, and 3.7% from other races. The median household income in the town was $50,945, and the median family income was $60,945. The per capita income in the town was $25,945.
Conclusion
Belle Chasse is a small town located in Plaquemines Parish, Louisiana. It is situated on the west bank of the Mississippi River, about 25 miles south of New Orleans. The town was founded in 1719 by French settlers and has a rich history. The town is home to a diverse economy, with a variety of businesses, industrial facilities, and a large military base. The population of Belle Chasse is 8,049 people, with a median household income of $50,945.
Common Questions
What is Per Capita Income in Belle Chasse?
Per Capita income in Belle Chasse is $41,226.
What is the Median Family Income in Belle Chasse?
Median Family Income in Belle Chasse is $109,151.
What is the Median Household income in Belle Chasse?
Median Household Income in Belle Chasse is $92,059.
What is Income or Wage Gap in Belle Chasse?
Income or Wage Gap in Belle Chasse is 52.1%.
Women in Belle Chasse earn 47.9 cents for every dollar earned by a man.
What is Inequality or Gini Index in Belle Chasse?
Inequality or Gini Index in Belle Chasse is 0.43.
What is the Total Population of Belle Chasse?
Total Population of Belle Chasse is 10,781.
What is the Total Male Population of Belle Chasse?
Total Male Population of Belle Chasse is 5,236.
What is the Total Female Population of Belle Chasse?
Total Female Population of Belle Chasse is 5,545.
What is the Ratio of Males per 100 Females in Belle Chasse?
There are 94.43 Males per 100 Females in Belle Chasse.
What is the Ratio of Females per 100 Males in Belle Chasse?
There are 105.90 Females per 100 Males in Belle Chasse.
What is the Median Population Age in Belle Chasse?
Median Population Age in Belle Chasse is 39.2 Years.
What is the Average Family Size in Belle Chasse
Average Family Size in Belle Chasse is 3.2 People.
What is the Average Household Size in Belle Chasse
Average Household Size in Belle Chasse is 2.8 People.
How Large is the Labor Force in Belle Chasse?
There are 5,836 People in the Labor Forcein in Belle Chasse.
What is the Percentage of People in the Labor Force in Belle Chasse?
66.3% of People are in the Labor Force in Belle Chasse.
What is the Unemployment Rate in Belle Chasse?
Unemployment Rate in Belle Chasse is 3.0%.