Zip Codes with the Highest Percentage of Population Employed in Architecture & Engineering in Bossier City, LA
RELATED REPORTS & OPTIONS
Architecture & Engineering
Bossier City
Compare Zip Codes
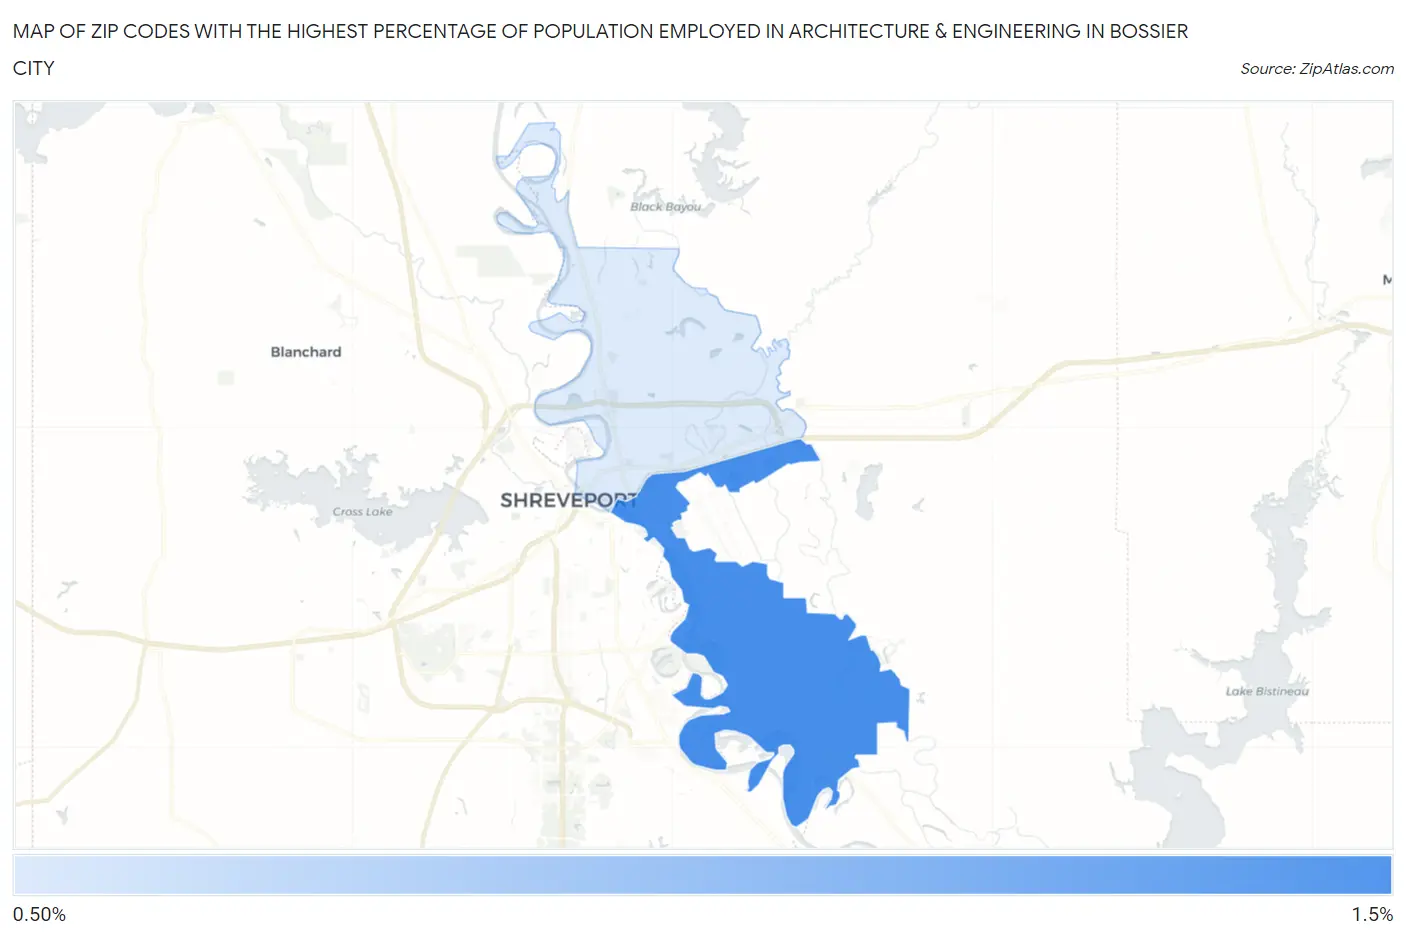
Map of Zip Codes with the Highest Percentage of Population Employed in Architecture & Engineering in Bossier City
0.99%
1.3%
Zip Codes with the Highest Percentage of Population Employed in Architecture & Engineering in Bossier City, LA
| Zip Code | % Employed | vs State | vs National | |
| 1. | 71112 | 1.3% | 1.9%(-0.615)#182 | 2.1%(-0.823)#14,126 |
| 2. | 71111 | 0.99% | 1.9%(-0.949)#219 | 2.1%(-1.16)#16,656 |
1
Common Questions
What are the Top Zip Codes with the Highest Percentage of Population Employed in Architecture & Engineering in Bossier City, LA?
Top Zip Codes with the Highest Percentage of Population Employed in Architecture & Engineering in Bossier City, LA are:
What zip code has the Highest Percentage of Population Employed in Architecture & Engineering in Bossier City, LA?
71112 has the Highest Percentage of Population Employed in Architecture & Engineering in Bossier City, LA with 1.3%.
What is the Percentage of Population Employed in Architecture & Engineering in Bossier City, LA?
Percentage of Population Employed in Architecture & Engineering in Bossier City is 1.2%.
What is the Percentage of Population Employed in Architecture & Engineering in Louisiana?
Percentage of Population Employed in Architecture & Engineering in Louisiana is 1.9%.
What is the Percentage of Population Employed in Architecture & Engineering in the United States?
Percentage of Population Employed in Architecture & Engineering in the United States is 2.1%.