Carencro, LA Map & Demographics
Carencro Map
Carencro Overview
$29,513
PER CAPITA INCOME
$67,626
AVG FAMILY INCOME
$56,352
AVG HOUSEHOLD INCOME
52.2%
WAGE / INCOME GAP [ % ]
47.8¢/ $1
WAGE / INCOME GAP [ $ ]
0.42
INEQUALITY / GINI INDEX
10,194
TOTAL POPULATION
4,943
MALE POPULATION
5,251
FEMALE POPULATION
94.13
MALES / 100 FEMALES
106.23
FEMALES / 100 MALES
33.3
MEDIAN AGE
3.3
AVG FAMILY SIZE
2.4
AVG HOUSEHOLD SIZE
5,086
LABOR FORCE [ PEOPLE ]
66.3%
PERCENT IN LABOR FORCE
2.5%
UNEMPLOYMENT RATE
Carencro Zip Codes
Carencro Area Codes
Income in Carencro
Income Overview in Carencro
Per Capita Income in Carencro is $29,513, while median incomes of families and households are $67,626 and $56,352 respectively.
| Characteristic | Number | Measure |
| Per Capita Income | 10,194 | $29,513 |
| Median Family Income | 2,362 | $67,626 |
| Mean Family Income | 2,362 | $79,636 |
| Median Household Income | 4,173 | $56,352 |
| Mean Household Income | 4,173 | $69,776 |
| Income Deficit | 2,362 | $0 |
| Wage / Income Gap (%) | 10,194 | 52.20% |
| Wage / Income Gap ($) | 10,194 | 47.80¢ per $1 |
| Gini / Inequality Index | 10,194 | 0.42 |
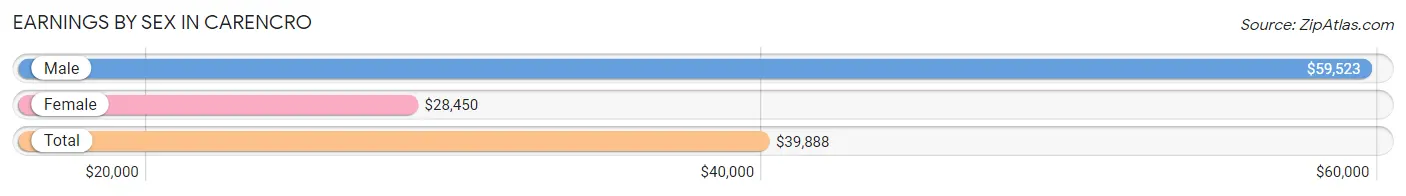
Earnings by Sex in Carencro
Average Earnings in Carencro are $39,888, $59,523 for men and $28,450 for women, a difference of 52.2%.
| Sex | Number | Average Earnings |
| Male | 2,809 (53.9%) | $59,523 |
| Female | 2,403 (46.1%) | $28,450 |
| Total | 5,212 (100.0%) | $39,888 |
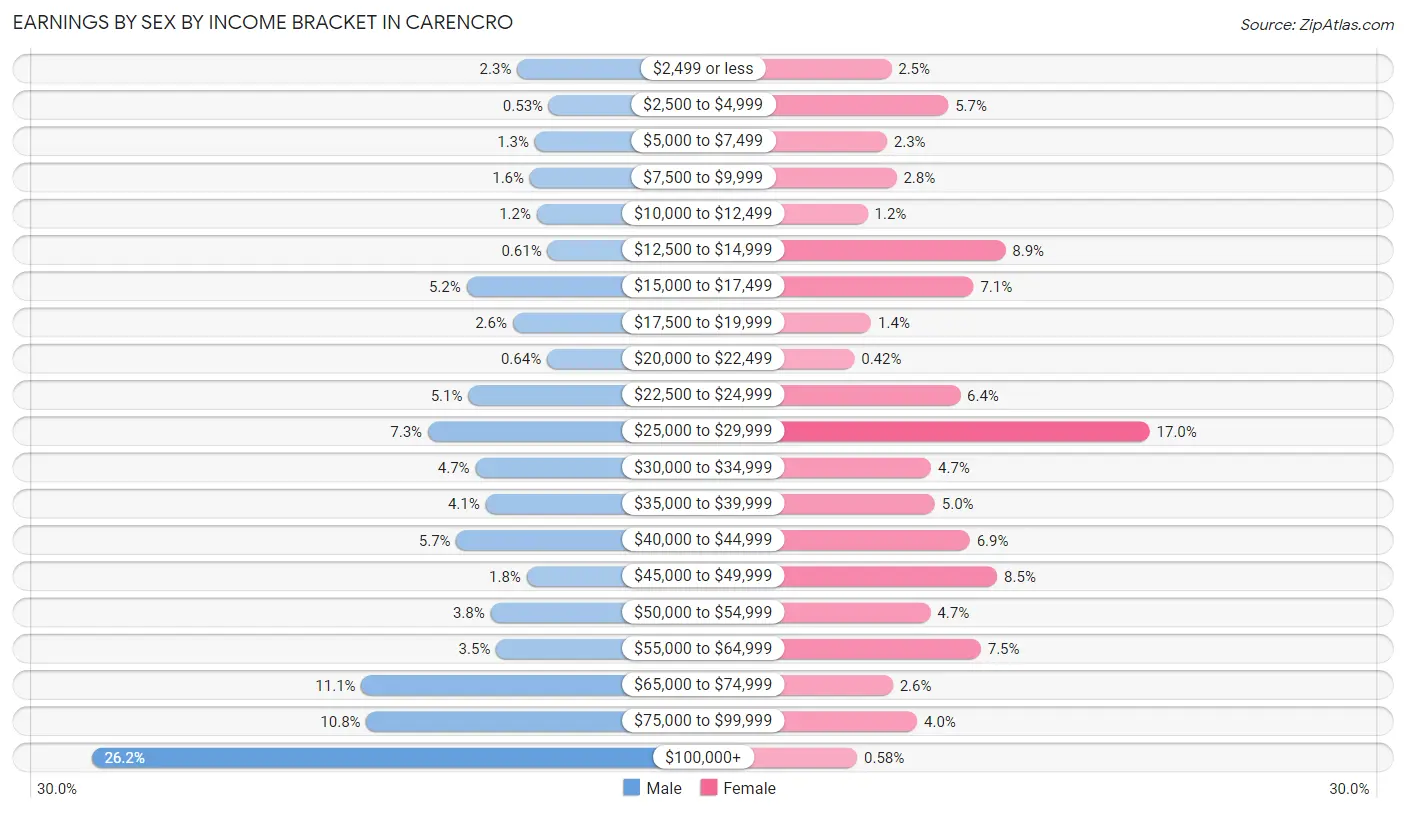
Earnings by Sex by Income Bracket in Carencro
The most common earnings brackets in Carencro are $100,000+ for men (737 | 26.2%) and $25,000 to $29,999 for women (409 | 17.0%).
| Income | Male | Female |
| $2,499 or less | 65 (2.3%) | 60 (2.5%) |
| $2,500 to $4,999 | 15 (0.5%) | 137 (5.7%) |
| $5,000 to $7,499 | 37 (1.3%) | 54 (2.2%) |
| $7,500 to $9,999 | 45 (1.6%) | 67 (2.8%) |
| $10,000 to $12,499 | 34 (1.2%) | 28 (1.2%) |
| $12,500 to $14,999 | 17 (0.6%) | 214 (8.9%) |
| $15,000 to $17,499 | 145 (5.2%) | 171 (7.1%) |
| $17,500 to $19,999 | 72 (2.6%) | 33 (1.4%) |
| $20,000 to $22,499 | 18 (0.6%) | 10 (0.4%) |
| $22,500 to $24,999 | 142 (5.1%) | 153 (6.4%) |
| $25,000 to $29,999 | 206 (7.3%) | 409 (17.0%) |
| $30,000 to $34,999 | 131 (4.7%) | 114 (4.7%) |
| $35,000 to $39,999 | 115 (4.1%) | 119 (5.0%) |
| $40,000 to $44,999 | 161 (5.7%) | 166 (6.9%) |
| $45,000 to $49,999 | 50 (1.8%) | 203 (8.5%) |
| $50,000 to $54,999 | 107 (3.8%) | 113 (4.7%) |
| $55,000 to $64,999 | 98 (3.5%) | 181 (7.5%) |
| $65,000 to $74,999 | 311 (11.1%) | 62 (2.6%) |
| $75,000 to $99,999 | 303 (10.8%) | 95 (4.0%) |
| $100,000+ | 737 (26.2%) | 14 (0.6%) |
| Total | 2,809 (100.0%) | 2,403 (100.0%) |
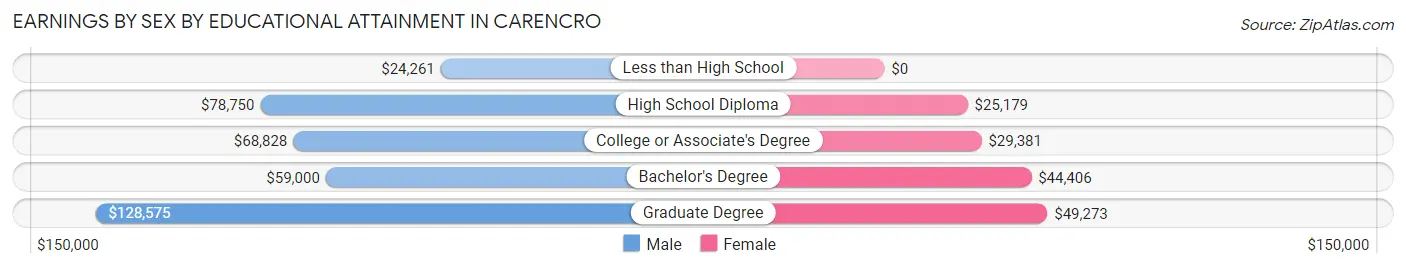
Earnings by Sex by Educational Attainment in Carencro
Average earnings in Carencro are $68,345 for men and $28,835 for women, a difference of 57.8%. Men with an educational attainment of graduate degree enjoy the highest average annual earnings of $128,575, while those with less than high school education earn the least with $24,261. Women with an educational attainment of graduate degree earn the most with the average annual earnings of $49,273, while those with high school diploma education have the smallest earnings of $25,179.
| Educational Attainment | Male Income | Female Income |
| Less than High School | $24,261 | $0 |
| High School Diploma | $78,750 | $25,179 |
| College or Associate's Degree | $68,828 | $29,381 |
| Bachelor's Degree | $59,000 | $44,406 |
| Graduate Degree | $128,575 | $49,273 |
| Total | $68,345 | $28,835 |
Family Income in Carencro
Family Income Brackets in Carencro
According to the Carencro family income data, there are 458 families falling into the $100,000 to $149,999 income range, which is the most common income bracket and makes up 19.4% of all families. Conversely, the $10,000 to $14,999 income bracket is the least frequent group with only 43 families (1.8%) belonging to this category.
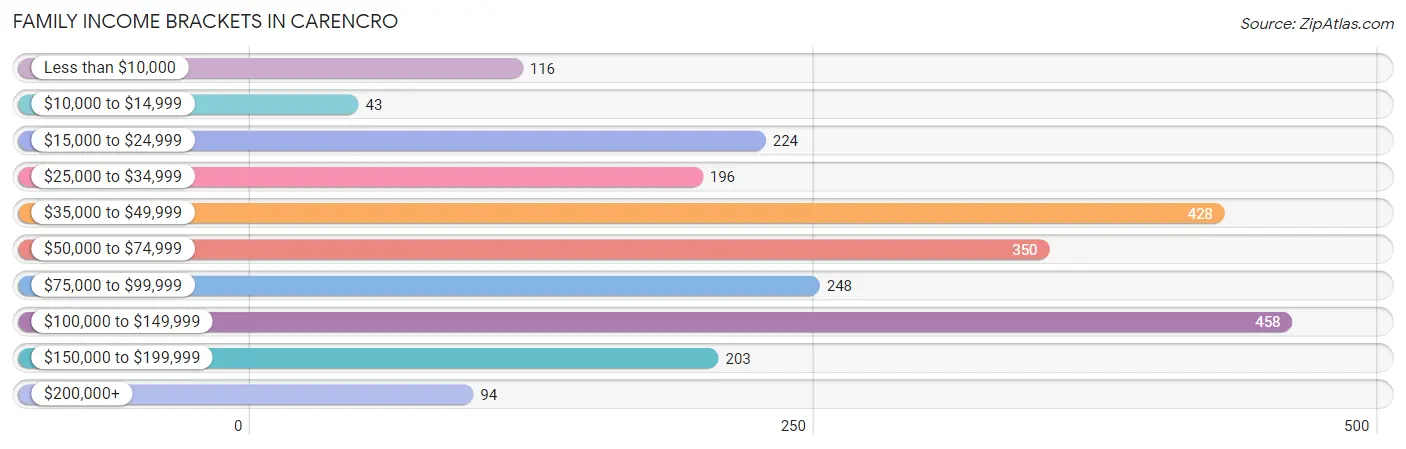
| Income Bracket | # Families | % Families |
| Less than $10,000 | 116 | 4.9% |
| $10,000 to $14,999 | 43 | 1.8% |
| $15,000 to $24,999 | 224 | 9.5% |
| $25,000 to $34,999 | 196 | 8.3% |
| $35,000 to $49,999 | 428 | 18.1% |
| $50,000 to $74,999 | 350 | 14.8% |
| $75,000 to $99,999 | 248 | 10.5% |
| $100,000 to $149,999 | 458 | 19.4% |
| $150,000 to $199,999 | 203 | 8.6% |
| $200,000+ | 94 | 4.0% |
Family Income by Famaliy Size in Carencro
6-person families (58 | 2.5%) account for the highest median family income in Carencro with $120,375 per family, while 3-person families (561 | 23.7%) have the highest median income of $28,027 per family member.
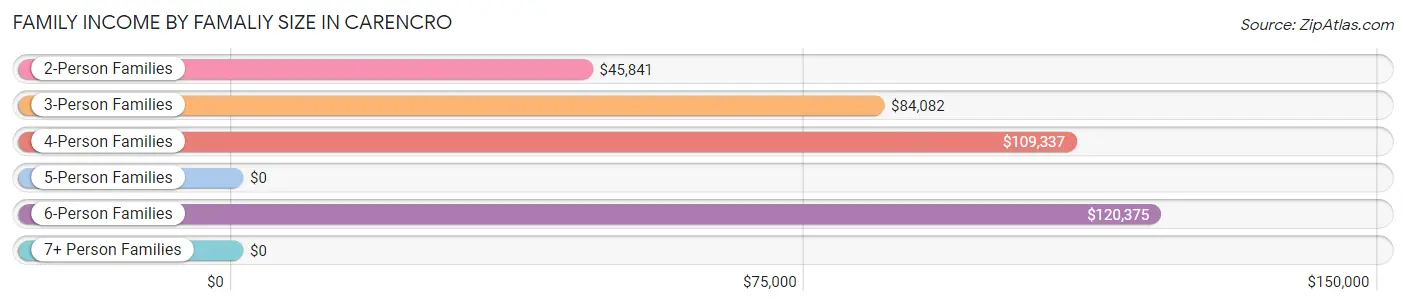
| Income Bracket | # Families | Median Income |
| 2-Person Families | 1,017 (43.1%) | $45,841 |
| 3-Person Families | 561 (23.7%) | $84,082 |
| 4-Person Families | 390 (16.5%) | $109,337 |
| 5-Person Families | 283 (12.0%) | $0 |
| 6-Person Families | 58 (2.5%) | $120,375 |
| 7+ Person Families | 53 (2.2%) | $0 |
| Total | 2,362 (100.0%) | $67,626 |
Family Income by Number of Earners in Carencro
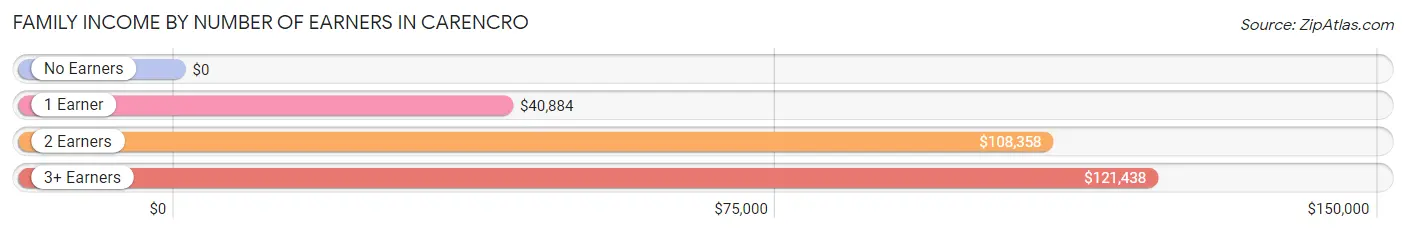
| Number of Earners | # Families | Median Income |
| No Earners | 347 (14.7%) | $0 |
| 1 Earner | 855 (36.2%) | $40,884 |
| 2 Earners | 953 (40.4%) | $108,358 |
| 3+ Earners | 207 (8.8%) | $121,438 |
| Total | 2,362 (100.0%) | $67,626 |
Household Income in Carencro
Household Income Brackets in Carencro
With 876 households falling in the category, the $100,000 to $149,999 income range is the most frequent in Carencro, accounting for 21.0% of all households. In contrast, only 96 households (2.3%) fall into the $200,000+ income bracket, making it the least populous group.
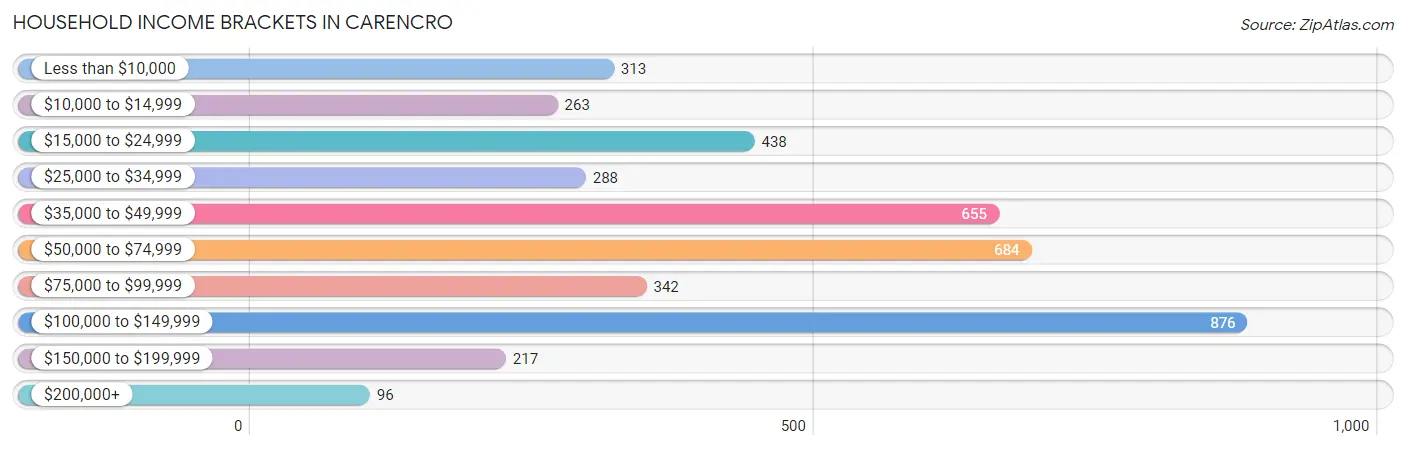
| Income Bracket | # Households | % Households |
| Less than $10,000 | 313 | 7.5% |
| $10,000 to $14,999 | 263 | 6.3% |
| $15,000 to $24,999 | 438 | 10.5% |
| $25,000 to $34,999 | 288 | 6.9% |
| $35,000 to $49,999 | 655 | 15.7% |
| $50,000 to $74,999 | 684 | 16.4% |
| $75,000 to $99,999 | 342 | 8.2% |
| $100,000 to $149,999 | 876 | 21.0% |
| $150,000 to $199,999 | 217 | 5.2% |
| $200,000+ | 96 | 2.3% |
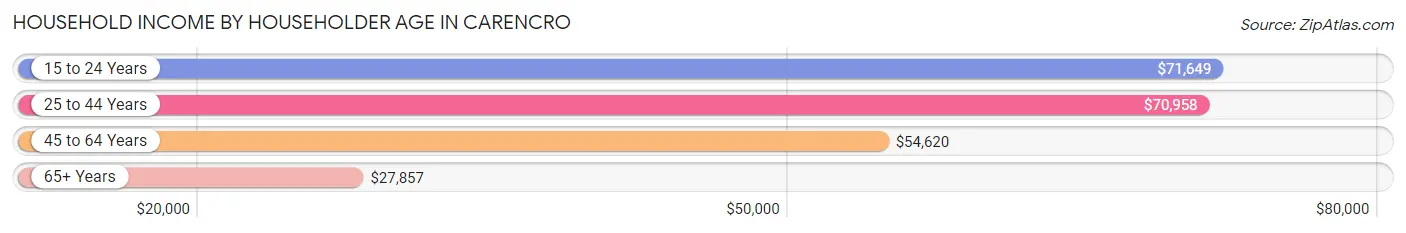
Household Income by Householder Age in Carencro
The median household income in Carencro is $56,352, with the highest median household income of $71,649 found in the 15 to 24 years age bracket for the primary householder. A total of 82 households (2.0%) fall into this category. Meanwhile, the 65+ years age bracket for the primary householder has the lowest median household income of $27,857, with 870 households (20.8%) in this group.
| Income Bracket | # Households | Median Income |
| 15 to 24 Years | 82 (2.0%) | $71,649 |
| 25 to 44 Years | 2,086 (50.0%) | $70,958 |
| 45 to 64 Years | 1,135 (27.2%) | $54,620 |
| 65+ Years | 870 (20.8%) | $27,857 |
| Total | 4,173 (100.0%) | $56,352 |
Poverty in Carencro
Income Below Poverty by Sex and Age in Carencro
With 15.3% poverty level for males and 24.4% for females among the residents of Carencro, 15 year old males and 12 to 14 year old females are the most vulnerable to poverty, with 9 males (100.0%) and 300 females (65.5%) in their respective age groups living below the poverty level.
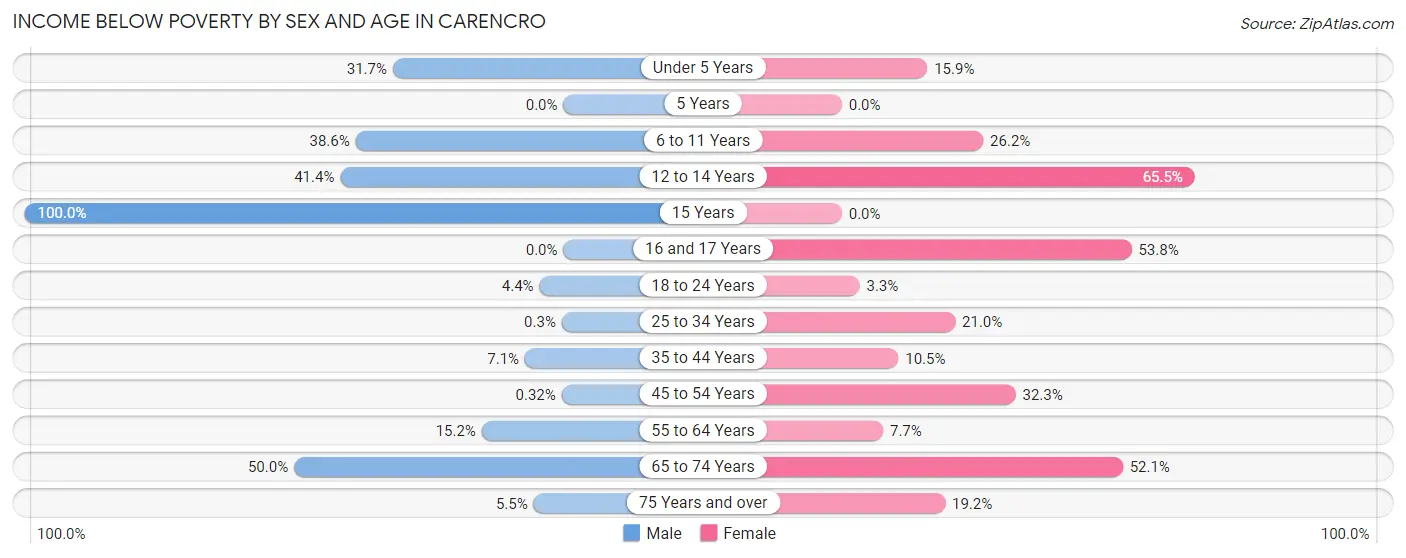
| Age Bracket | Male | Female |
| Under 5 Years | 139 (31.7%) | 69 (15.9%) |
| 5 Years | 0 (0.0%) | 0 (0.0%) |
| 6 to 11 Years | 223 (38.6%) | 53 (26.2%) |
| 12 to 14 Years | 94 (41.4%) | 300 (65.5%) |
| 15 Years | 9 (100.0%) | 0 (0.0%) |
| 16 and 17 Years | 0 (0.0%) | 57 (53.8%) |
| 18 to 24 Years | 15 (4.4%) | 10 (3.3%) |
| 25 to 34 Years | 3 (0.3%) | 228 (21.0%) |
| 35 to 44 Years | 39 (7.1%) | 66 (10.5%) |
| 45 to 54 Years | 2 (0.3%) | 159 (32.3%) |
| 55 to 64 Years | 79 (15.2%) | 37 (7.7%) |
| 65 to 74 Years | 137 (50.0%) | 195 (52.1%) |
| 75 Years and over | 11 (5.5%) | 82 (19.2%) |
| Total | 751 (15.3%) | 1,256 (24.4%) |
Income Above Poverty by Sex and Age in Carencro
According to the poverty statistics in Carencro, males aged 16 and 17 years and females aged 5 years are the age groups that are most secure financially, with 100.0% of males and 100.0% of females in these age groups living above the poverty line.
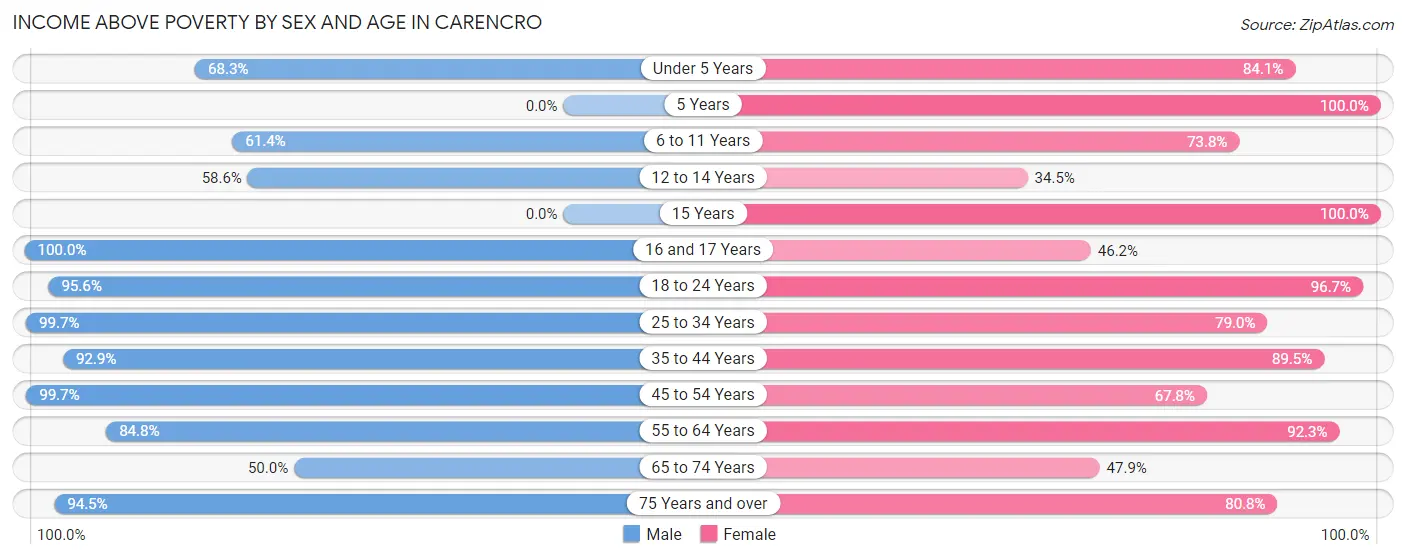
| Age Bracket | Male | Female |
| Under 5 Years | 300 (68.3%) | 366 (84.1%) |
| 5 Years | 0 (0.0%) | 103 (100.0%) |
| 6 to 11 Years | 355 (61.4%) | 149 (73.8%) |
| 12 to 14 Years | 133 (58.6%) | 158 (34.5%) |
| 15 Years | 0 (0.0%) | 50 (100.0%) |
| 16 and 17 Years | 147 (100.0%) | 49 (46.2%) |
| 18 to 24 Years | 323 (95.6%) | 294 (96.7%) |
| 25 to 34 Years | 992 (99.7%) | 856 (79.0%) |
| 35 to 44 Years | 508 (92.9%) | 563 (89.5%) |
| 45 to 54 Years | 617 (99.7%) | 334 (67.7%) |
| 55 to 64 Years | 442 (84.8%) | 446 (92.3%) |
| 65 to 74 Years | 137 (50.0%) | 179 (47.9%) |
| 75 Years and over | 188 (94.5%) | 346 (80.8%) |
| Total | 4,142 (84.7%) | 3,893 (75.6%) |
Income Below Poverty Among Married-Couple Families in Carencro
The poverty statistics for married-couple families in Carencro show that 4.8% or 70 of the total 1,474 families live below the poverty line. Families with no children have the highest poverty rate of 9.7%, comprising of 70 families. On the other hand, families with 1 or 2 children have the lowest poverty rate of 0.0%, which includes 0 families.
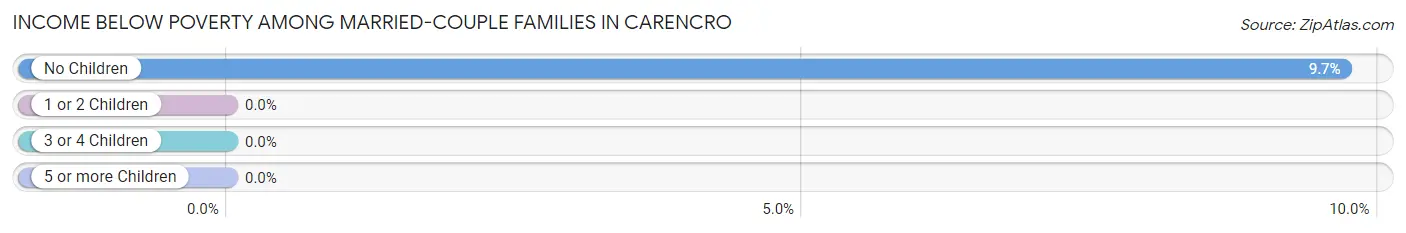
| Children | Above Poverty | Below Poverty |
| No Children | 652 (90.3%) | 70 (9.7%) |
| 1 or 2 Children | 609 (100.0%) | 0 (0.0%) |
| 3 or 4 Children | 143 (100.0%) | 0 (0.0%) |
| 5 or more Children | 0 (0.0%) | 0 (0.0%) |
| Total | 1,404 (95.3%) | 70 (4.8%) |
Income Below Poverty Among Single-Parent Households in Carencro
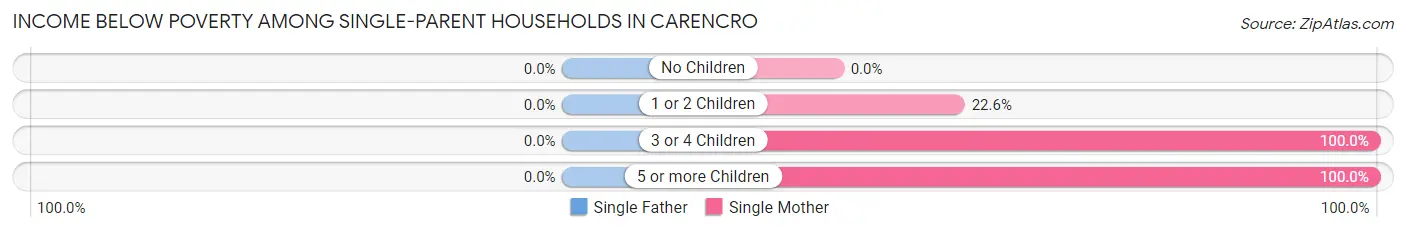
| Children | Single Father | Single Mother |
| No Children | 0 (0.0%) | 0 (0.0%) |
| 1 or 2 Children | 0 (0.0%) | 92 (22.6%) |
| 3 or 4 Children | 0 (0.0%) | 113 (100.0%) |
| 5 or more Children | 0 (0.0%) | 53 (100.0%) |
| Total | 0 (0.0%) | 258 (34.9%) |
Income Below Poverty Among Married-Couple vs Single-Parent Households in Carencro
The poverty data for Carencro shows that 70 of the married-couple family households (4.8%) and 258 of the single-parent households (29.0%) are living below the poverty level. Within the married-couple family households, those with no children have the highest poverty rate, with 70 households (9.7%) falling below the poverty line. Among the single-parent households, those with 3 or 4 children have the highest poverty rate, with 113 household (100.0%) living below poverty.
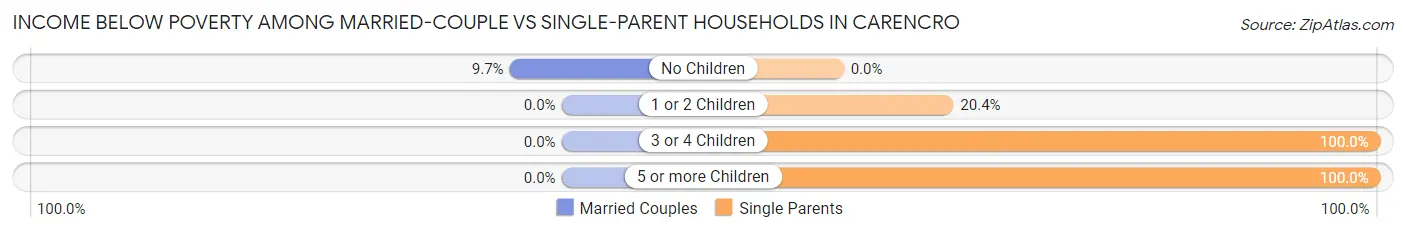
| Children | Married-Couple Families | Single-Parent Households |
| No Children | 70 (9.7%) | 0 (0.0%) |
| 1 or 2 Children | 0 (0.0%) | 92 (20.4%) |
| 3 or 4 Children | 0 (0.0%) | 113 (100.0%) |
| 5 or more Children | 0 (0.0%) | 53 (100.0%) |
| Total | 70 (4.8%) | 258 (29.0%) |
Race in Carencro
The most populous races in Carencro are Black / African American (5,125 | 50.3%), White / Caucasian (4,473 | 43.9%), and Two or more Races (465 | 4.6%).
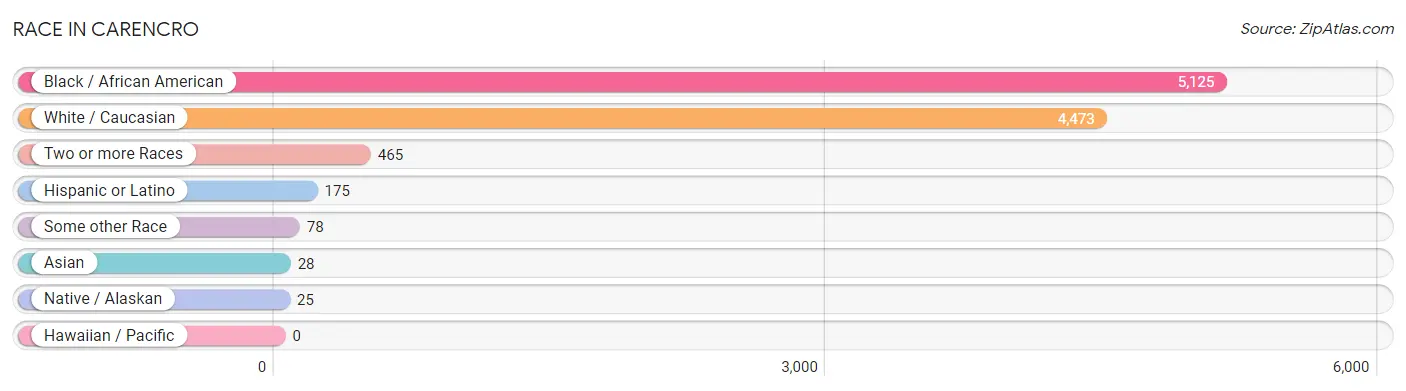
| Race | # Population | % Population |
| Asian | 28 | 0.3% |
| Black / African American | 5,125 | 50.3% |
| Hawaiian / Pacific | 0 | 0.0% |
| Hispanic or Latino | 175 | 1.7% |
| Native / Alaskan | 25 | 0.3% |
| White / Caucasian | 4,473 | 43.9% |
| Two or more Races | 465 | 4.6% |
| Some other Race | 78 | 0.8% |
| Total | 10,194 | 100.0% |
Ancestry in Carencro
The most populous ancestries reported in Carencro are French (1,111 | 10.9%), French Canadian (822 | 8.1%), American (532 | 5.2%), German (321 | 3.2%), and Cajun (263 | 2.6%), together accounting for 29.9% of all Carencro residents.
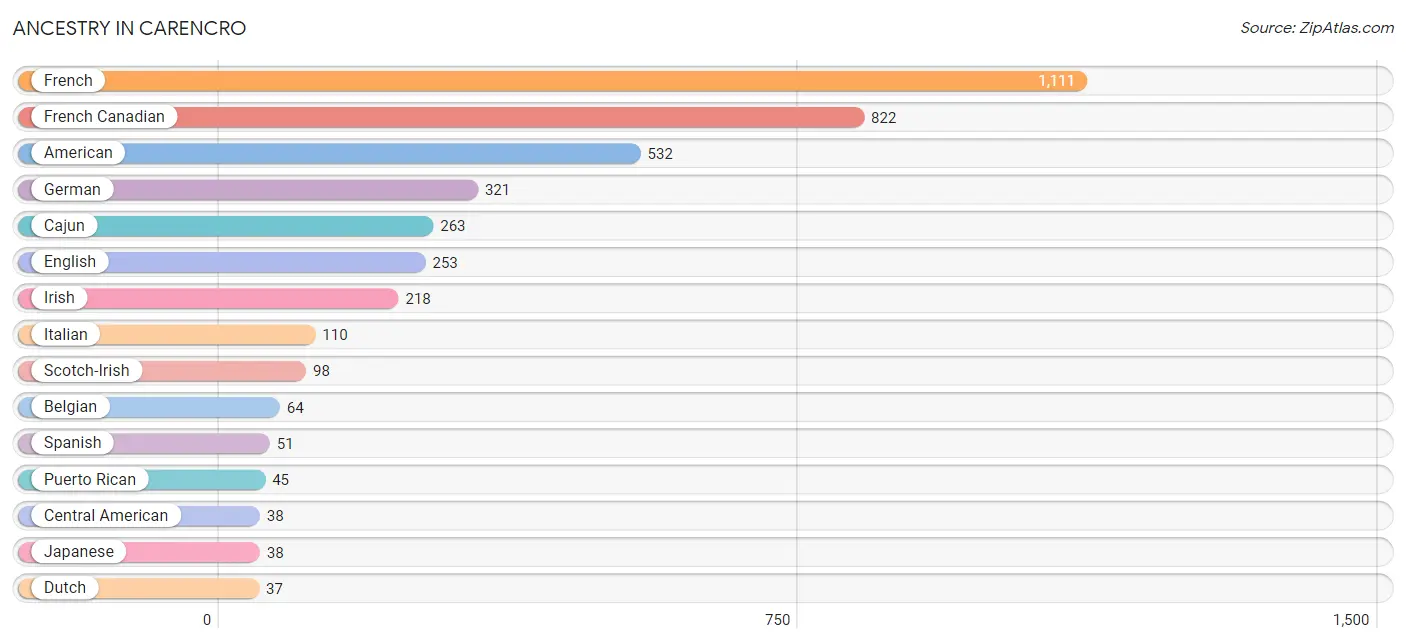
| Ancestry | # Population | % Population |
| African | 1 | 0.0% |
| American | 532 | 5.2% |
| Arab | 22 | 0.2% |
| Basque | 1 | 0.0% |
| Belgian | 64 | 0.6% |
| Cajun | 263 | 2.6% |
| Central American | 38 | 0.4% |
| Cherokee | 1 | 0.0% |
| Dutch | 37 | 0.4% |
| English | 253 | 2.5% |
| French | 1,111 | 10.9% |
| French Canadian | 822 | 8.1% |
| German | 321 | 3.2% |
| Greek | 17 | 0.2% |
| Guatemalan | 30 | 0.3% |
| Hungarian | 6 | 0.1% |
| Irish | 218 | 2.1% |
| Italian | 110 | 1.1% |
| Japanese | 38 | 0.4% |
| Lebanese | 22 | 0.2% |
| Mexican | 19 | 0.2% |
| Panamanian | 8 | 0.1% |
| Polish | 15 | 0.2% |
| Puerto Rican | 45 | 0.4% |
| Russian | 24 | 0.2% |
| Scotch-Irish | 98 | 1.0% |
| Scottish | 22 | 0.2% |
| Sioux | 18 | 0.2% |
| South African | 34 | 0.3% |
| Spaniard | 22 | 0.2% |
| Spanish | 51 | 0.5% |
| Subsaharan African | 35 | 0.3% | View All 32 Rows |
Immigrants in Carencro
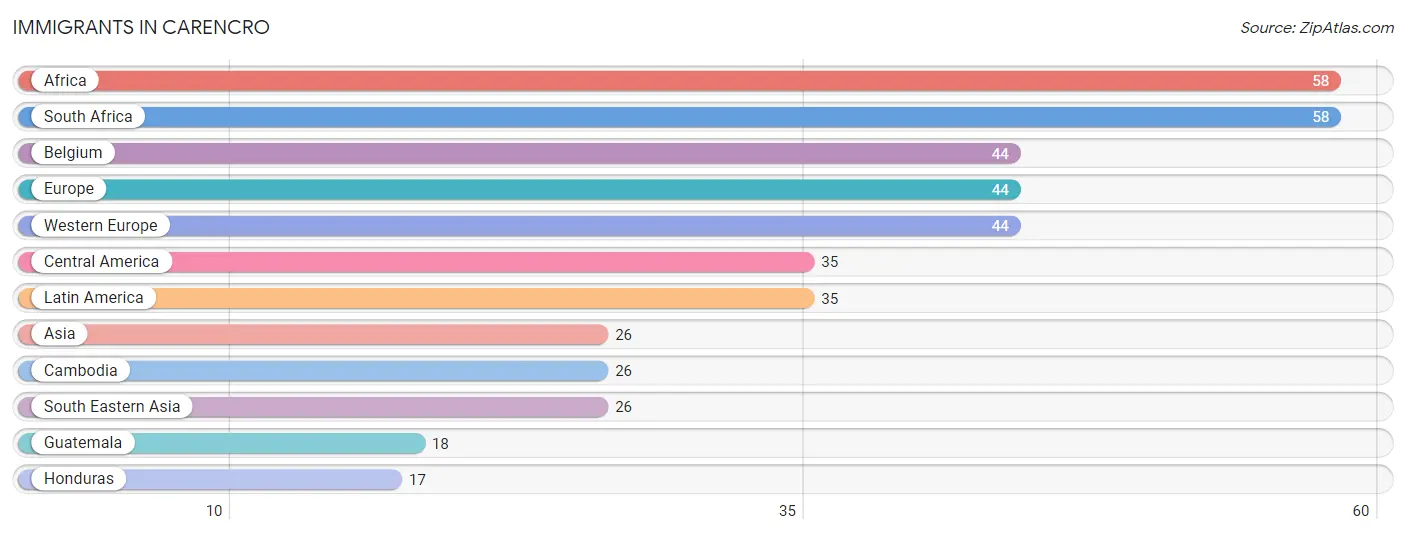
The most numerous immigrant groups reported in Carencro came from Africa (58 | 0.6%), South Africa (58 | 0.6%), Belgium (44 | 0.4%), Europe (44 | 0.4%), and Western Europe (44 | 0.4%), together accounting for 2.4% of all Carencro residents.
| Immigration Origin | # Population | % Population |
| Africa | 58 | 0.6% |
| Asia | 26 | 0.3% |
| Belgium | 44 | 0.4% |
| Cambodia | 26 | 0.3% |
| Central America | 35 | 0.3% |
| Europe | 44 | 0.4% |
| Guatemala | 18 | 0.2% |
| Honduras | 17 | 0.2% |
| Latin America | 35 | 0.3% |
| South Africa | 58 | 0.6% |
| South Eastern Asia | 26 | 0.3% |
| Western Europe | 44 | 0.4% | View All 12 Rows |
Sex and Age in Carencro
Sex and Age in Carencro
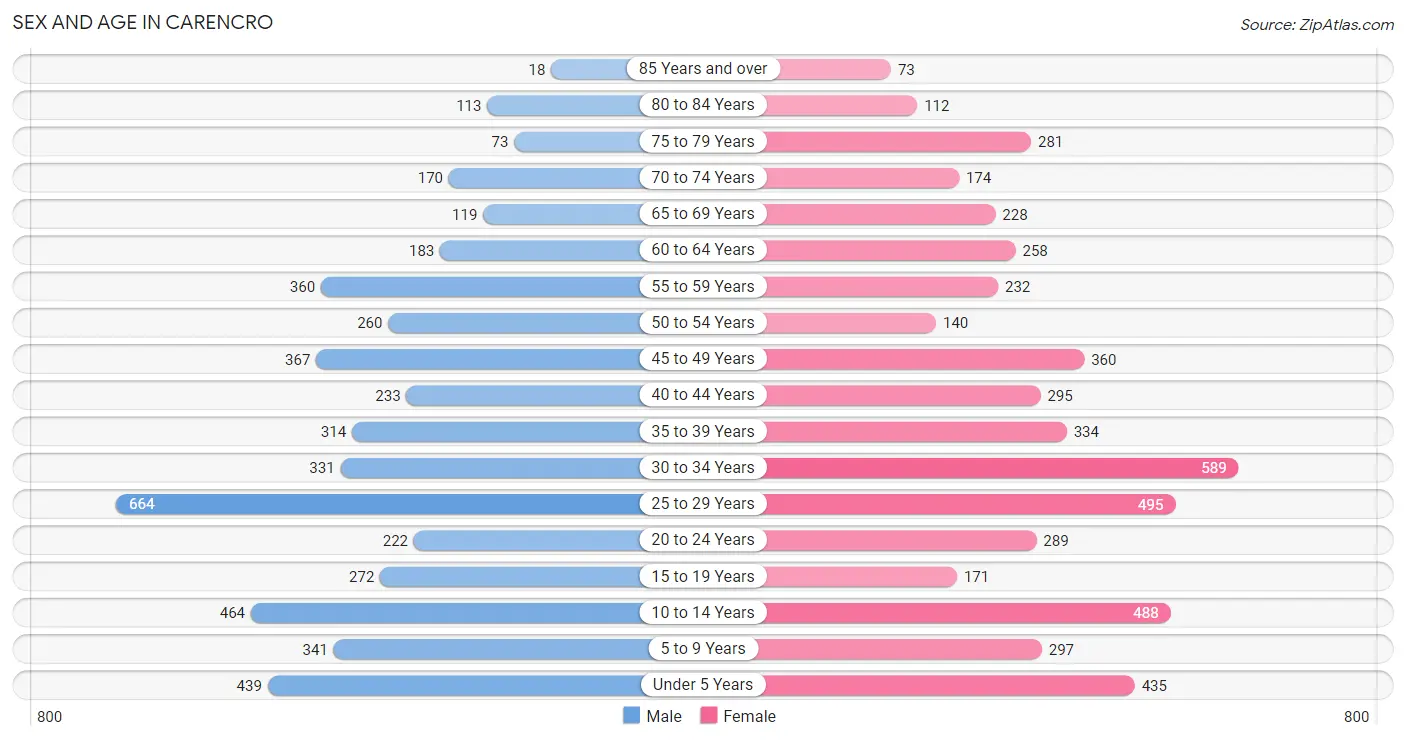
The most populous age groups in Carencro are 25 to 29 Years (664 | 13.4%) for men and 30 to 34 Years (589 | 11.2%) for women.
| Age Bracket | Male | Female |
| Under 5 Years | 439 (8.9%) | 435 (8.3%) |
| 5 to 9 Years | 341 (6.9%) | 297 (5.7%) |
| 10 to 14 Years | 464 (9.4%) | 488 (9.3%) |
| 15 to 19 Years | 272 (5.5%) | 171 (3.3%) |
| 20 to 24 Years | 222 (4.5%) | 289 (5.5%) |
| 25 to 29 Years | 664 (13.4%) | 495 (9.4%) |
| 30 to 34 Years | 331 (6.7%) | 589 (11.2%) |
| 35 to 39 Years | 314 (6.4%) | 334 (6.4%) |
| 40 to 44 Years | 233 (4.7%) | 295 (5.6%) |
| 45 to 49 Years | 367 (7.4%) | 360 (6.9%) |
| 50 to 54 Years | 260 (5.3%) | 140 (2.7%) |
| 55 to 59 Years | 360 (7.3%) | 232 (4.4%) |
| 60 to 64 Years | 183 (3.7%) | 258 (4.9%) |
| 65 to 69 Years | 119 (2.4%) | 228 (4.3%) |
| 70 to 74 Years | 170 (3.4%) | 174 (3.3%) |
| 75 to 79 Years | 73 (1.5%) | 281 (5.3%) |
| 80 to 84 Years | 113 (2.3%) | 112 (2.1%) |
| 85 Years and over | 18 (0.4%) | 73 (1.4%) |
| Total | 4,943 (100.0%) | 5,251 (100.0%) |
Families and Households in Carencro
Median Family Size in Carencro
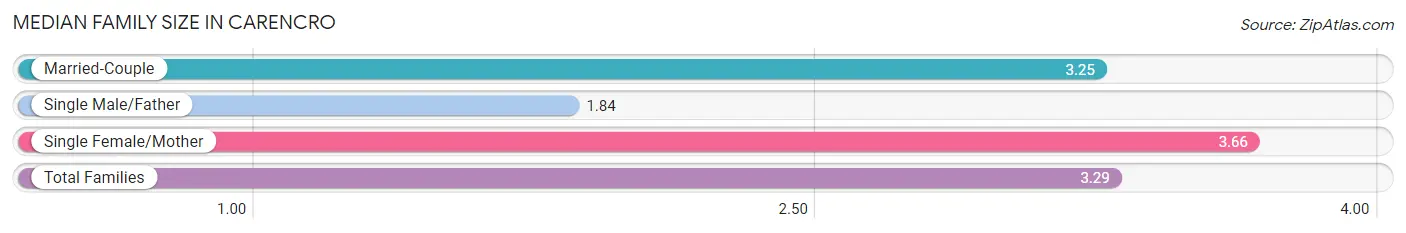
The median family size in Carencro is 3.29 persons per family, with single female/mother families (739 | 31.3%) accounting for the largest median family size of 3.66 persons per family. On the other hand, single male/father families (149 | 6.3%) represent the smallest median family size with 1.84 persons per family.
| Family Type | # Families | Family Size |
| Married-Couple | 1,474 (62.4%) | 3.25 |
| Single Male/Father | 149 (6.3%) | 1.84 |
| Single Female/Mother | 739 (31.3%) | 3.66 |
| Total Families | 2,362 (100.0%) | 3.29 |
Median Household Size in Carencro
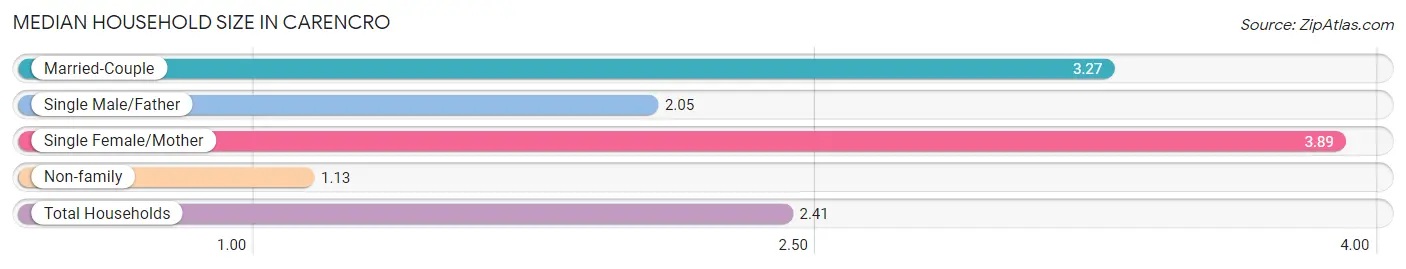
The median household size in Carencro is 2.41 persons per household, with single female/mother households (739 | 17.7%) accounting for the largest median household size of 3.89 persons per household. non-family households (1,811 | 43.4%) represent the smallest median household size with 1.13 persons per household.
| Household Type | # Households | Household Size |
| Married-Couple | 1,474 (35.3%) | 3.27 |
| Single Male/Father | 149 (3.6%) | 2.05 |
| Single Female/Mother | 739 (17.7%) | 3.89 |
| Non-family | 1,811 (43.4%) | 1.13 |
| Total Households | 4,173 (100.0%) | 2.41 |
Household Size by Marriage Status in Carencro
Out of a total of 4,173 households in Carencro, 2,362 (56.6%) are family households, while 1,811 (43.4%) are nonfamily households. The most numerous type of family households are 2-person households, comprising 858, and the most common type of nonfamily households are 1-person households, comprising 1,597.
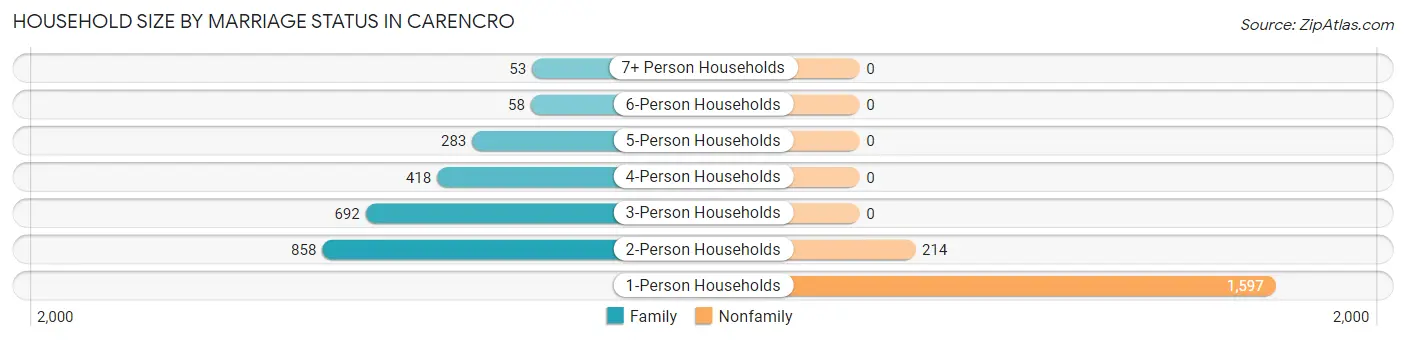
| Household Size | Family Households | Nonfamily Households |
| 1-Person Households | - | 1,597 (38.3%) |
| 2-Person Households | 858 (20.6%) | 214 (5.1%) |
| 3-Person Households | 692 (16.6%) | 0 (0.0%) |
| 4-Person Households | 418 (10.0%) | 0 (0.0%) |
| 5-Person Households | 283 (6.8%) | 0 (0.0%) |
| 6-Person Households | 58 (1.4%) | 0 (0.0%) |
| 7+ Person Households | 53 (1.3%) | 0 (0.0%) |
| Total | 2,362 (56.6%) | 1,811 (43.4%) |
Female Fertility in Carencro
Fertility by Age in Carencro
Average fertility rate in Carencro is 63.0 births per 1,000 women. Women in the age bracket of 20 to 34 years have the highest fertility rate with 98.0 births per 1,000 women. Women in the age bracket of 20 to 34 years acount for 83.8% of all women with births.
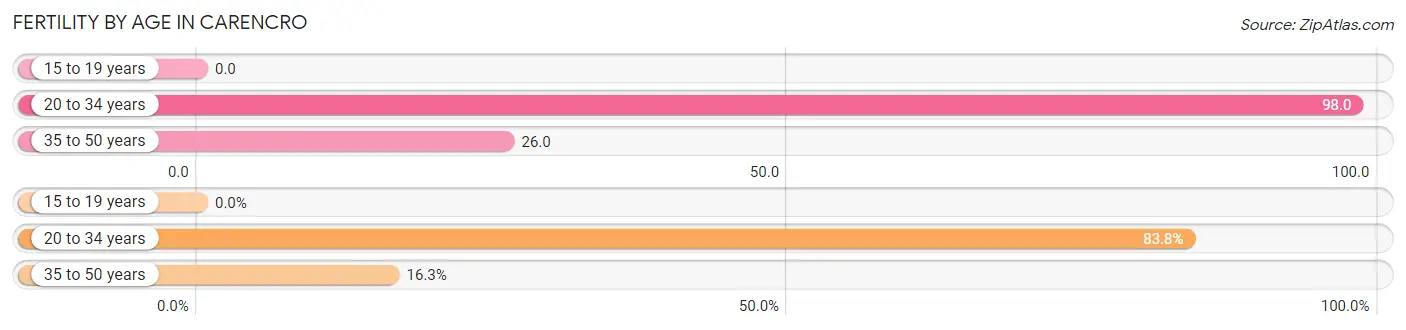
| Age Bracket | Women with Births | Births / 1,000 Women |
| 15 to 19 years | 0 (0.0%) | 0.0 |
| 20 to 34 years | 134 (83.8%) | 98.0 |
| 35 to 50 years | 26 (16.3%) | 26.0 |
| Total | 160 (100.0%) | 63.0 |
Fertility by Age by Marriage Status in Carencro
89.4% of women with births (160) in Carencro are married. The highest percentage of unmarried women with births falls into 35 to 50 years age bracket with 65.4% of them unmarried at the time of birth, while the lowest percentage of unmarried women with births belong to 20 to 34 years age bracket with 0.0% of them unmarried.
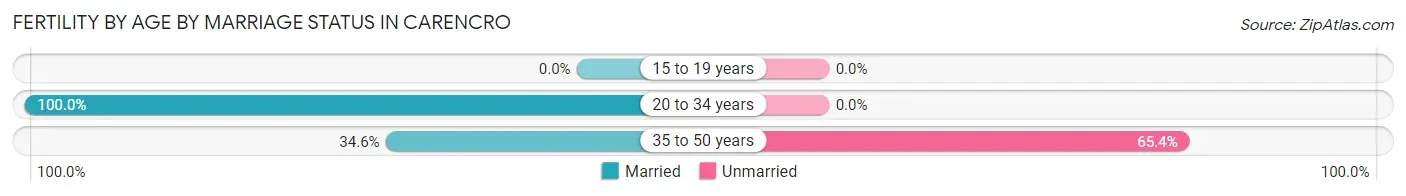
| Age Bracket | Married | Unmarried |
| 15 to 19 years | 0 (0.0%) | 0 (0.0%) |
| 20 to 34 years | 134 (100.0%) | 0 (0.0%) |
| 35 to 50 years | 9 (34.6%) | 17 (65.4%) |
| Total | 143 (89.4%) | 17 (10.6%) |
Fertility by Education in Carencro
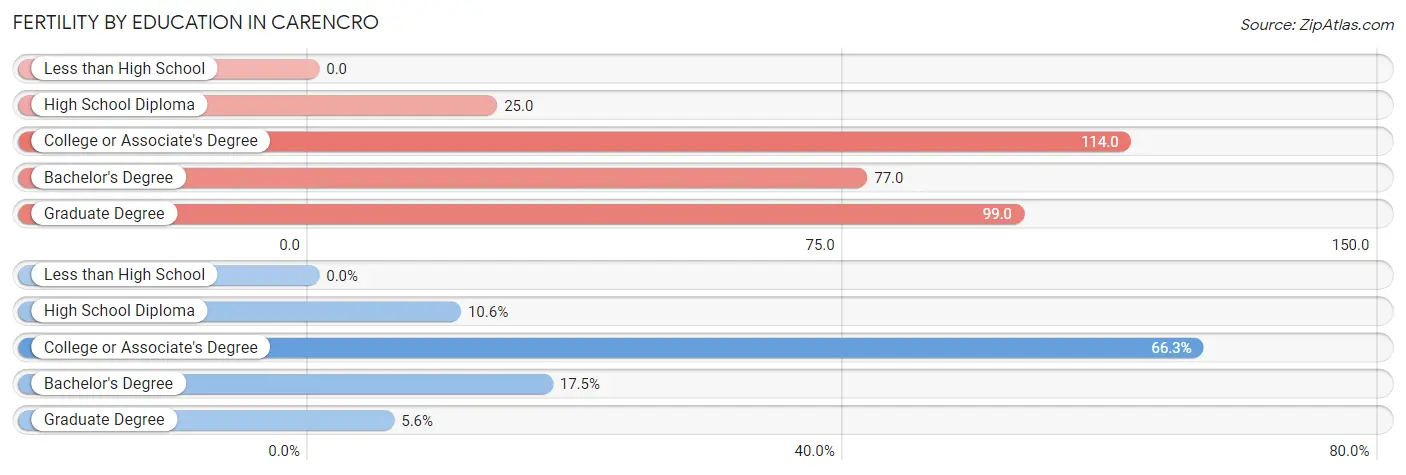
| Educational Attainment | Women with Births | Births / 1,000 Women |
| Less than High School | 0 (0.0%) | 0.0 |
| High School Diploma | 17 (10.6%) | 25.0 |
| College or Associate's Degree | 106 (66.2%) | 114.0 |
| Bachelor's Degree | 28 (17.5%) | 77.0 |
| Graduate Degree | 9 (5.6%) | 99.0 |
| Total | 160 (100.0%) | 63.0 |
Fertility by Education by Marriage Status in Carencro
10.6% of women with births in Carencro are unmarried. Women with the educational attainment of college or associate's degree are most likely to be married with 100.0% of them married at childbirth, while women with the educational attainment of high school diploma are least likely to be married with 100.0% of them unmarried at childbirth.
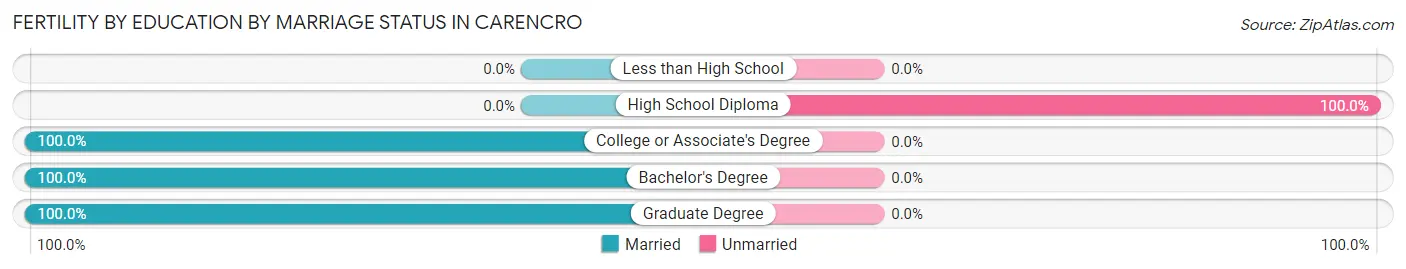
| Educational Attainment | Married | Unmarried |
| Less than High School | 0 (0.0%) | 0 (0.0%) |
| High School Diploma | 0 (0.0%) | 17 (100.0%) |
| College or Associate's Degree | 106 (100.0%) | 0 (0.0%) |
| Bachelor's Degree | 28 (100.0%) | 0 (0.0%) |
| Graduate Degree | 9 (100.0%) | 0 (0.0%) |
| Total | 143 (89.4%) | 17 (10.6%) |
Employment Characteristics in Carencro
Employment by Class of Employer in Carencro
Among the 4,921 employed individuals in Carencro, private company employees (3,453 | 70.2%), self-employed (not incorporated) (621 | 12.6%), and local government employees (396 | 8.1%) make up the most common classes of employment.
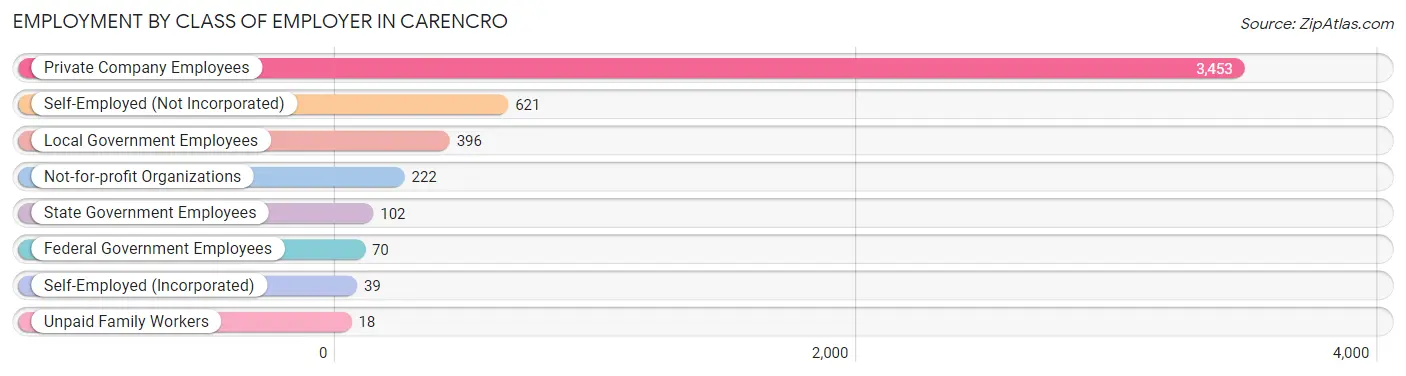
| Employer Class | # Employees | % Employees |
| Private Company Employees | 3,453 | 70.2% |
| Self-Employed (Incorporated) | 39 | 0.8% |
| Self-Employed (Not Incorporated) | 621 | 12.6% |
| Not-for-profit Organizations | 222 | 4.5% |
| Local Government Employees | 396 | 8.1% |
| State Government Employees | 102 | 2.1% |
| Federal Government Employees | 70 | 1.4% |
| Unpaid Family Workers | 18 | 0.4% |
| Total | 4,921 | 100.0% |
Employment Status by Age in Carencro
According to the labor force statistics for Carencro, out of the total population over 16 years of age (7,671), 66.3% or 5,086 individuals are in the labor force, with 2.5% or 127 of them unemployed. The age group with the highest labor force participation rate is 25 to 29 years, with 96.5% or 1,118 individuals in the labor force. Within the labor force, the 16 to 19 years age range has the highest percentage of unemployed individuals, with 8.3% or 15 of them being unemployed.
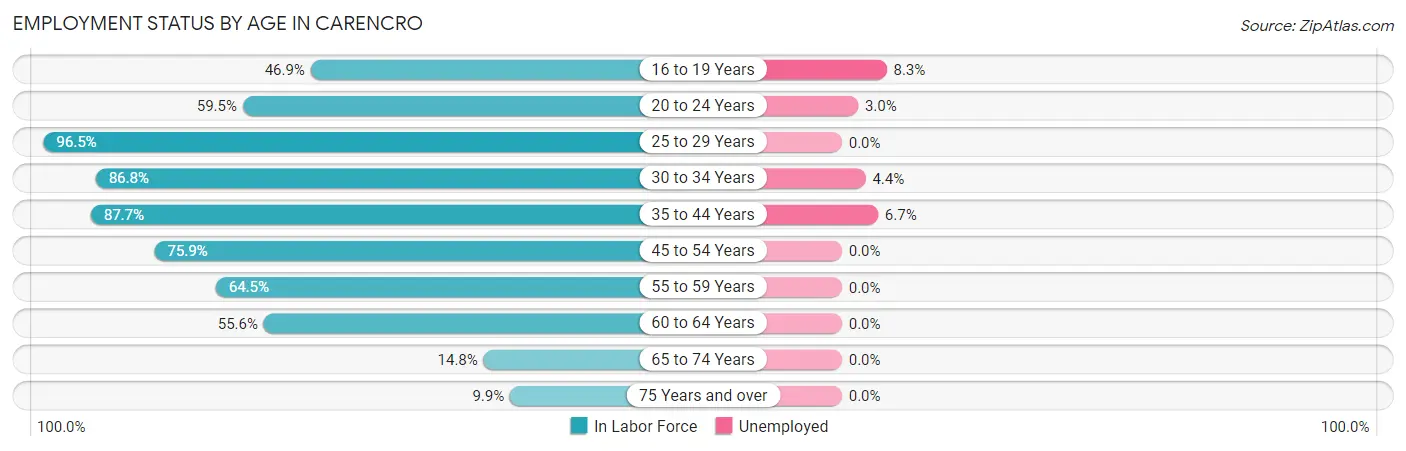
| Age Bracket | In Labor Force | Unemployed |
| 16 to 19 Years | 180 (46.9%) | 15 (8.3%) |
| 20 to 24 Years | 304 (59.5%) | 9 (3.0%) |
| 25 to 29 Years | 1,118 (96.5%) | 0 (0.0%) |
| 30 to 34 Years | 799 (86.8%) | 35 (4.4%) |
| 35 to 44 Years | 1,031 (87.7%) | 69 (6.7%) |
| 45 to 54 Years | 855 (75.9%) | 0 (0.0%) |
| 55 to 59 Years | 382 (64.5%) | 0 (0.0%) |
| 60 to 64 Years | 245 (55.6%) | 0 (0.0%) |
| 65 to 74 Years | 102 (14.8%) | 0 (0.0%) |
| 75 Years and over | 66 (9.9%) | 0 (0.0%) |
| Total | 5,086 (66.3%) | 127 (2.5%) |
Employment Status by Educational Attainment in Carencro
According to labor force statistics for Carencro, 81.8% of individuals (4,429) out of the total population between 25 and 64 years of age (5,415) are in the labor force, with 2.3% or 102 of them being unemployed. The group with the highest labor force participation rate are those with the educational attainment of bachelor's degree or higher, with 93.2% or 973 individuals in the labor force. Within the labor force, individuals with less than high school education have the highest percentage of unemployment, with 13.8% or 65 of them being unemployed.
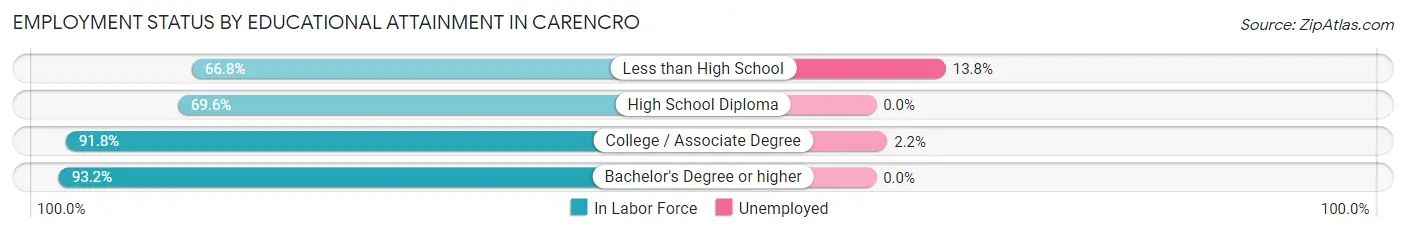
| Educational Attainment | In Labor Force | Unemployed |
| Less than High School | 471 (66.8%) | 97 (13.8%) |
| High School Diploma | 1,189 (69.6%) | 0 (0.0%) |
| College / Associate Degree | 1,797 (91.8%) | 43 (2.2%) |
| Bachelor's Degree or higher | 973 (93.2%) | 0 (0.0%) |
| Total | 4,429 (81.8%) | 125 (2.3%) |
Employment Occupations by Sex in Carencro
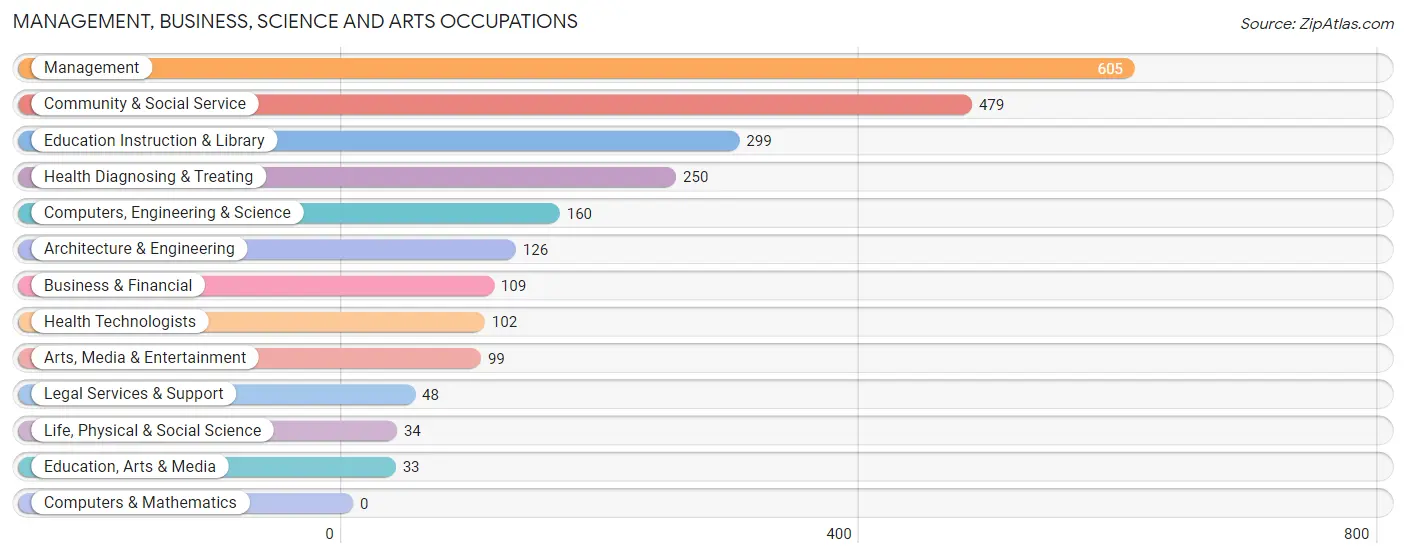
Management, Business, Science and Arts Occupations
The most common Management, Business, Science and Arts occupations in Carencro are Management (605 | 12.2%), Community & Social Service (479 | 9.7%), Education Instruction & Library (299 | 6.0%), Health Diagnosing & Treating (250 | 5.1%), and Computers, Engineering & Science (160 | 3.2%).
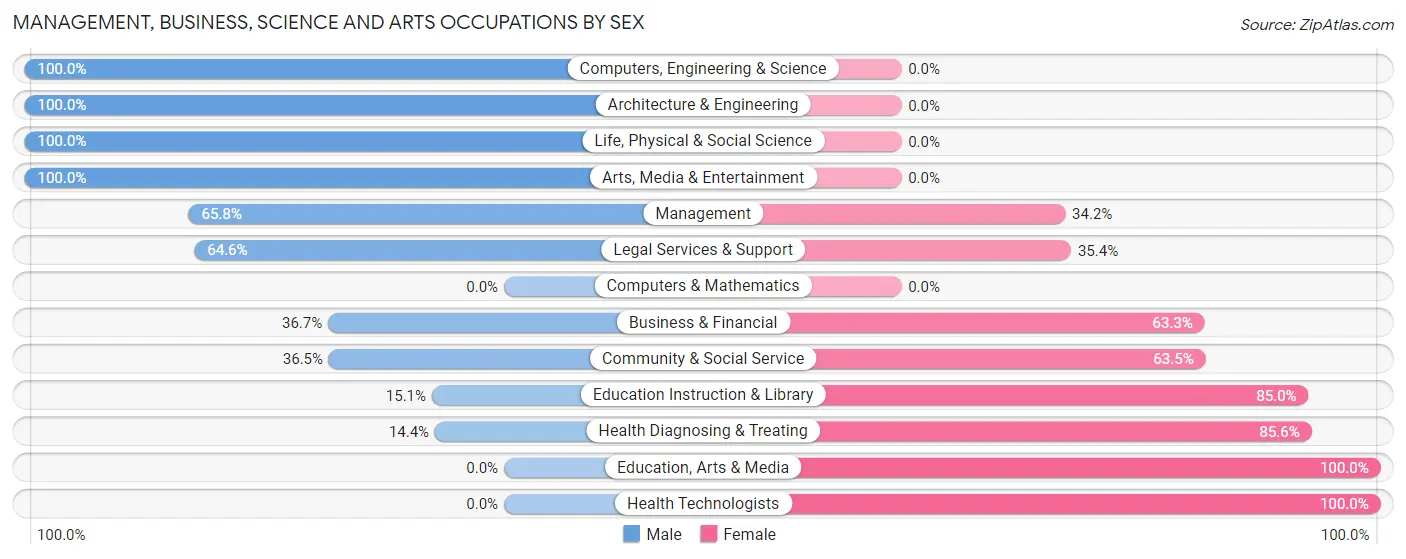
Management, Business, Science and Arts Occupations by Sex
Within the Management, Business, Science and Arts occupations in Carencro, the most male-oriented occupations are Computers, Engineering & Science (100.0%), Architecture & Engineering (100.0%), and Life, Physical & Social Science (100.0%), while the most female-oriented occupations are Education, Arts & Media (100.0%), Health Technologists (100.0%), and Health Diagnosing & Treating (85.6%).
| Occupation | Male | Female |
| Management | 398 (65.8%) | 207 (34.2%) |
| Business & Financial | 40 (36.7%) | 69 (63.3%) |
| Computers, Engineering & Science | 160 (100.0%) | 0 (0.0%) |
| Computers & Mathematics | 0 (0.0%) | 0 (0.0%) |
| Architecture & Engineering | 126 (100.0%) | 0 (0.0%) |
| Life, Physical & Social Science | 34 (100.0%) | 0 (0.0%) |
| Community & Social Service | 175 (36.5%) | 304 (63.5%) |
| Education, Arts & Media | 0 (0.0%) | 33 (100.0%) |
| Legal Services & Support | 31 (64.6%) | 17 (35.4%) |
| Education Instruction & Library | 45 (15.0%) | 254 (85.0%) |
| Arts, Media & Entertainment | 99 (100.0%) | 0 (0.0%) |
| Health Diagnosing & Treating | 36 (14.4%) | 214 (85.6%) |
| Health Technologists | 0 (0.0%) | 102 (100.0%) |
| Total (Category) | 809 (50.5%) | 794 (49.5%) |
| Total (Overall) | 2,749 (55.5%) | 2,206 (44.5%) |
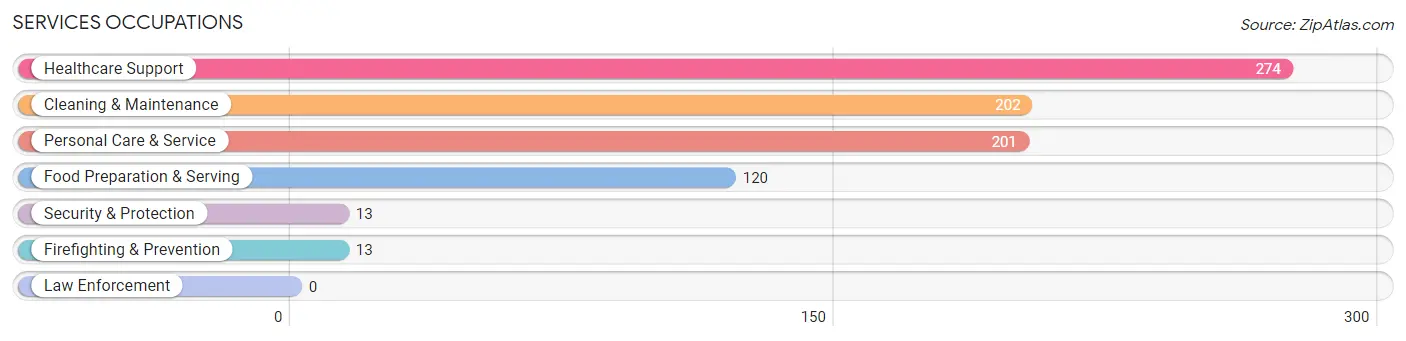
Services Occupations
The most common Services occupations in Carencro are Healthcare Support (274 | 5.5%), Cleaning & Maintenance (202 | 4.1%), Personal Care & Service (201 | 4.1%), Food Preparation & Serving (120 | 2.4%), and Security & Protection (13 | 0.3%).
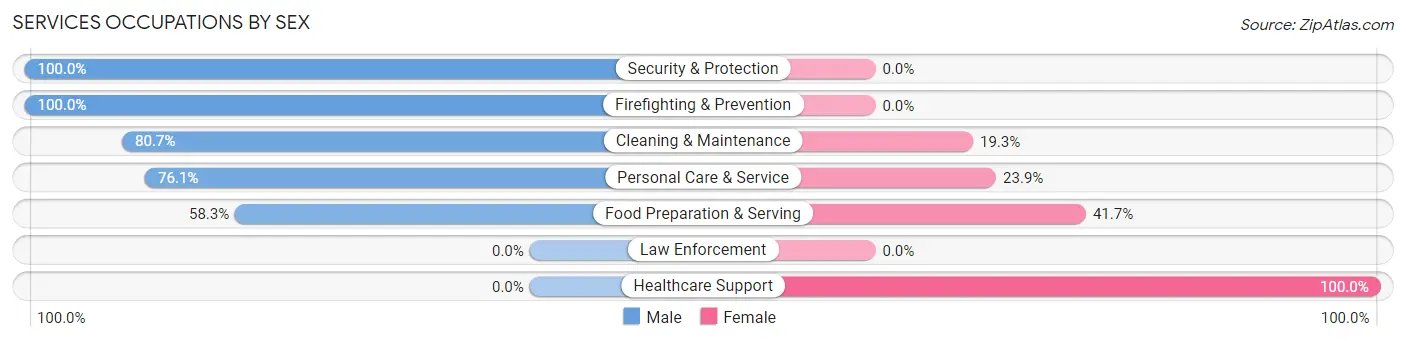
Services Occupations by Sex
Within the Services occupations in Carencro, the most male-oriented occupations are Security & Protection (100.0%), Firefighting & Prevention (100.0%), and Cleaning & Maintenance (80.7%), while the most female-oriented occupations are Healthcare Support (100.0%), Food Preparation & Serving (41.7%), and Personal Care & Service (23.9%).
| Occupation | Male | Female |
| Healthcare Support | 0 (0.0%) | 274 (100.0%) |
| Security & Protection | 13 (100.0%) | 0 (0.0%) |
| Firefighting & Prevention | 13 (100.0%) | 0 (0.0%) |
| Law Enforcement | 0 (0.0%) | 0 (0.0%) |
| Food Preparation & Serving | 70 (58.3%) | 50 (41.7%) |
| Cleaning & Maintenance | 163 (80.7%) | 39 (19.3%) |
| Personal Care & Service | 153 (76.1%) | 48 (23.9%) |
| Total (Category) | 399 (49.3%) | 411 (50.7%) |
| Total (Overall) | 2,749 (55.5%) | 2,206 (44.5%) |
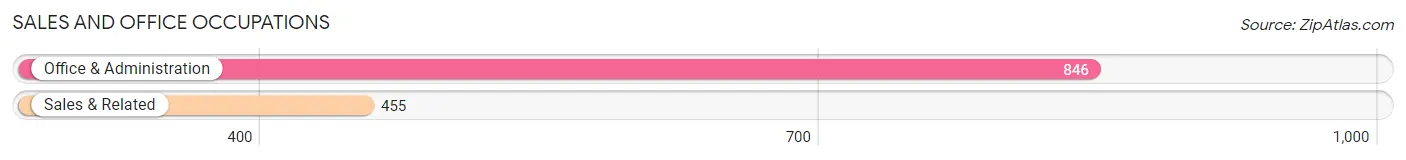
Sales and Office Occupations
The most common Sales and Office occupations in Carencro are Office & Administration (846 | 17.1%), and Sales & Related (455 | 9.2%).
Sales and Office Occupations by Sex
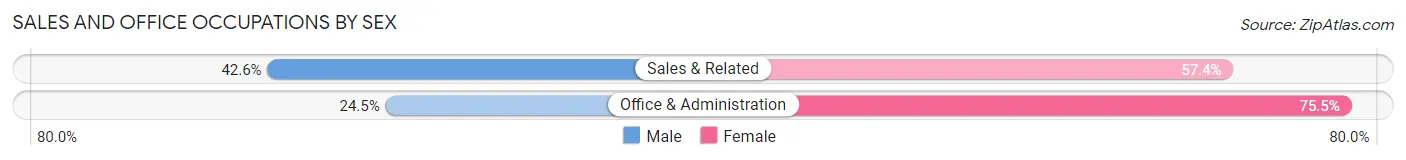
| Occupation | Male | Female |
| Sales & Related | 194 (42.6%) | 261 (57.4%) |
| Office & Administration | 207 (24.5%) | 639 (75.5%) |
| Total (Category) | 401 (30.8%) | 900 (69.2%) |
| Total (Overall) | 2,749 (55.5%) | 2,206 (44.5%) |
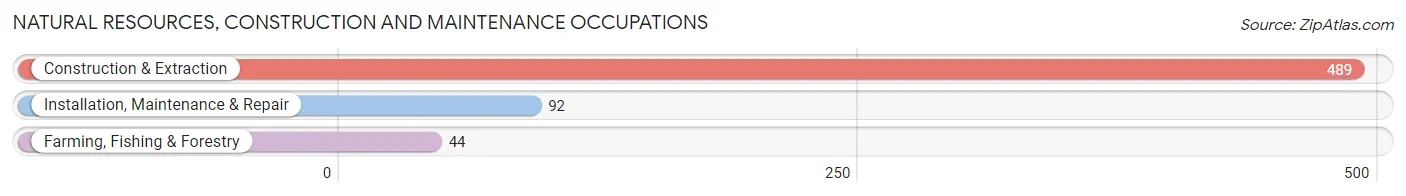
Natural Resources, Construction and Maintenance Occupations
The most common Natural Resources, Construction and Maintenance occupations in Carencro are Construction & Extraction (489 | 9.9%), Installation, Maintenance & Repair (92 | 1.9%), and Farming, Fishing & Forestry (44 | 0.9%).
Natural Resources, Construction and Maintenance Occupations by Sex
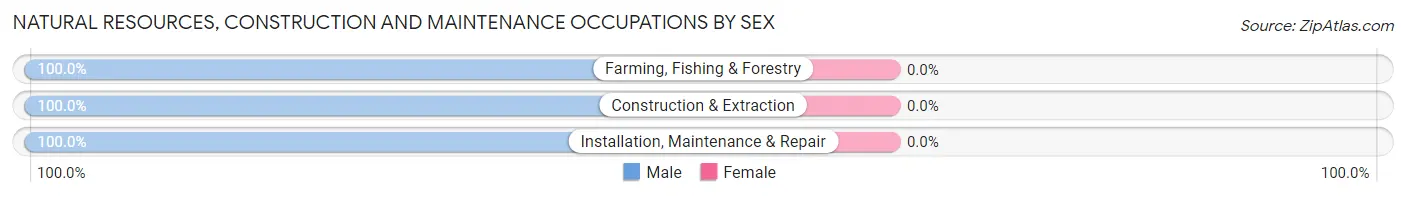
| Occupation | Male | Female |
| Farming, Fishing & Forestry | 44 (100.0%) | 0 (0.0%) |
| Construction & Extraction | 489 (100.0%) | 0 (0.0%) |
| Installation, Maintenance & Repair | 92 (100.0%) | 0 (0.0%) |
| Total (Category) | 625 (100.0%) | 0 (0.0%) |
| Total (Overall) | 2,749 (55.5%) | 2,206 (44.5%) |
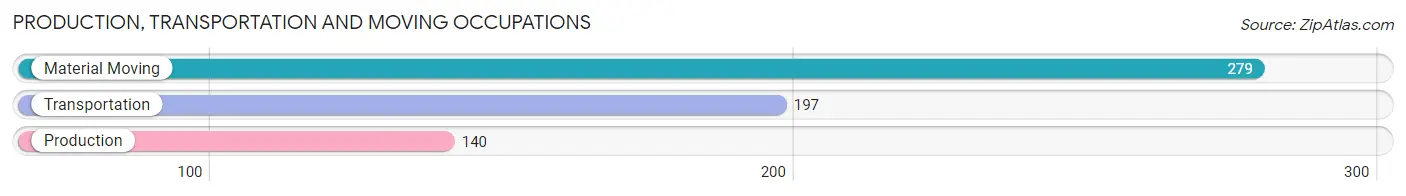
Production, Transportation and Moving Occupations
The most common Production, Transportation and Moving occupations in Carencro are Material Moving (279 | 5.6%), Transportation (197 | 4.0%), and Production (140 | 2.8%).
Production, Transportation and Moving Occupations by Sex
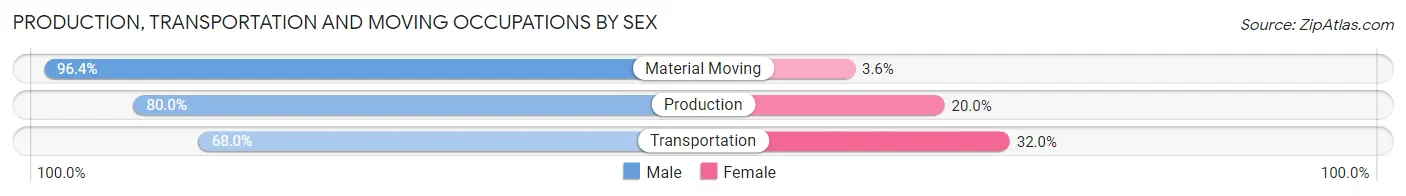
| Occupation | Male | Female |
| Production | 112 (80.0%) | 28 (20.0%) |
| Transportation | 134 (68.0%) | 63 (32.0%) |
| Material Moving | 269 (96.4%) | 10 (3.6%) |
| Total (Category) | 515 (83.6%) | 101 (16.4%) |
| Total (Overall) | 2,749 (55.5%) | 2,206 (44.5%) |
Employment Industries by Sex in Carencro
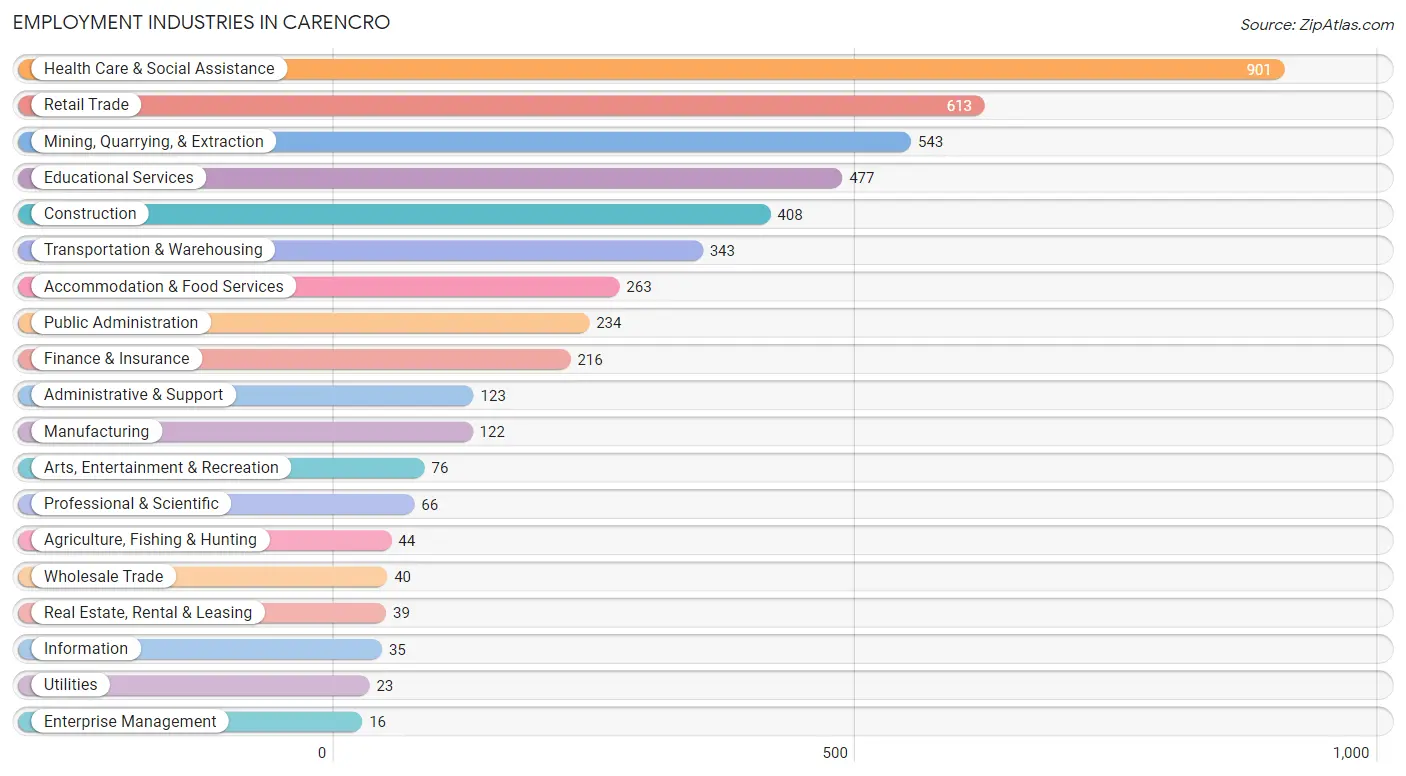
Employment Industries in Carencro
The major employment industries in Carencro include Health Care & Social Assistance (901 | 18.2%), Retail Trade (613 | 12.4%), Mining, Quarrying, & Extraction (543 | 11.0%), Educational Services (477 | 9.6%), and Construction (408 | 8.2%).
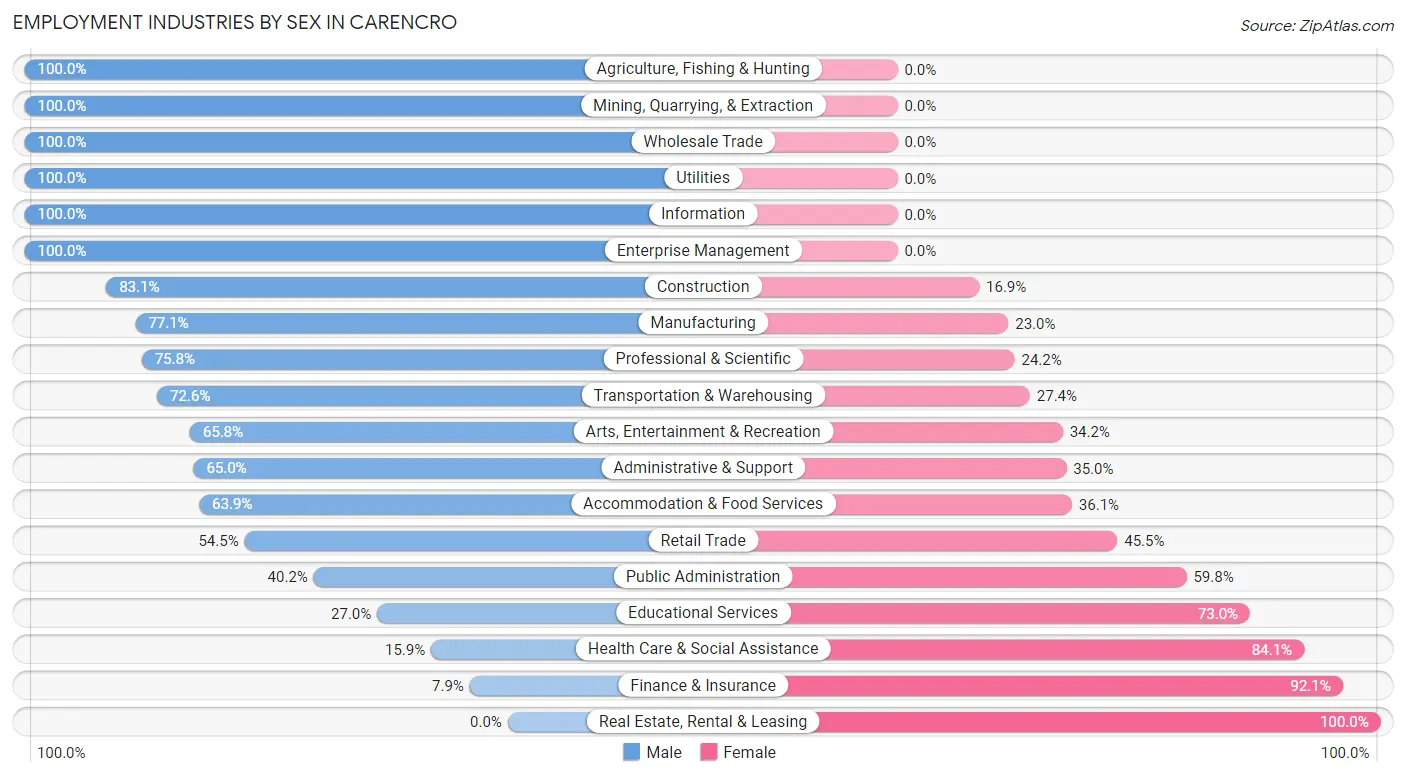
Employment Industries by Sex in Carencro
The Carencro industries that see more men than women are Agriculture, Fishing & Hunting (100.0%), Mining, Quarrying, & Extraction (100.0%), and Wholesale Trade (100.0%), whereas the industries that tend to have a higher number of women are Real Estate, Rental & Leasing (100.0%), Finance & Insurance (92.1%), and Health Care & Social Assistance (84.1%).
| Industry | Male | Female |
| Agriculture, Fishing & Hunting | 44 (100.0%) | 0 (0.0%) |
| Mining, Quarrying, & Extraction | 543 (100.0%) | 0 (0.0%) |
| Construction | 339 (83.1%) | 69 (16.9%) |
| Manufacturing | 94 (77.0%) | 28 (23.0%) |
| Wholesale Trade | 40 (100.0%) | 0 (0.0%) |
| Retail Trade | 334 (54.5%) | 279 (45.5%) |
| Transportation & Warehousing | 249 (72.6%) | 94 (27.4%) |
| Utilities | 23 (100.0%) | 0 (0.0%) |
| Information | 35 (100.0%) | 0 (0.0%) |
| Finance & Insurance | 17 (7.9%) | 199 (92.1%) |
| Real Estate, Rental & Leasing | 0 (0.0%) | 39 (100.0%) |
| Professional & Scientific | 50 (75.8%) | 16 (24.2%) |
| Enterprise Management | 16 (100.0%) | 0 (0.0%) |
| Administrative & Support | 80 (65.0%) | 43 (35.0%) |
| Educational Services | 129 (27.0%) | 348 (73.0%) |
| Health Care & Social Assistance | 143 (15.9%) | 758 (84.1%) |
| Arts, Entertainment & Recreation | 50 (65.8%) | 26 (34.2%) |
| Accommodation & Food Services | 168 (63.9%) | 95 (36.1%) |
| Public Administration | 94 (40.2%) | 140 (59.8%) |
| Total | 2,749 (55.5%) | 2,206 (44.5%) |
Education in Carencro
School Enrollment in Carencro
The most common levels of schooling among the 2,401 students in Carencro are middle school (881 | 36.7%), elementary school (548 | 22.8%), and high school (393 | 16.4%).
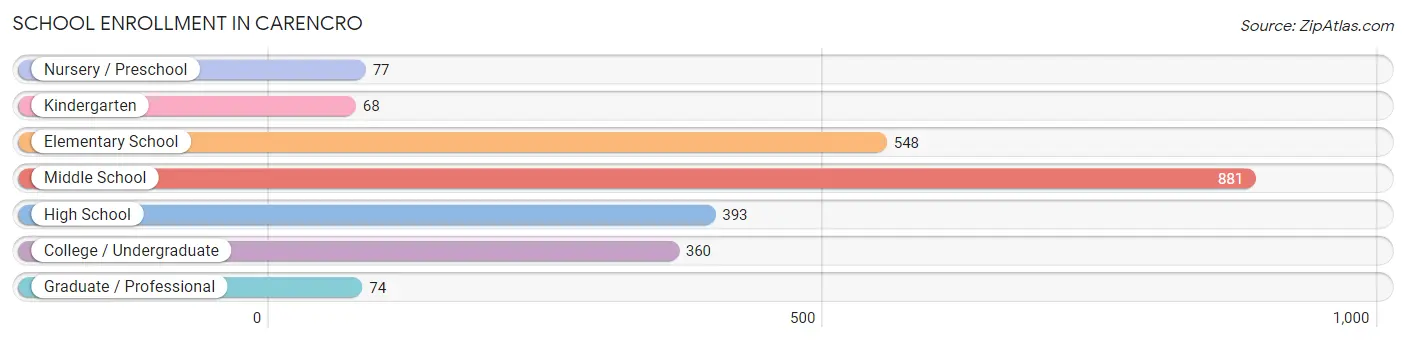
| School Level | # Students | % Students |
| Nursery / Preschool | 77 | 3.2% |
| Kindergarten | 68 | 2.8% |
| Elementary School | 548 | 22.8% |
| Middle School | 881 | 36.7% |
| High School | 393 | 16.4% |
| College / Undergraduate | 360 | 15.0% |
| Graduate / Professional | 74 | 3.1% |
| Total | 2,401 | 100.0% |
School Enrollment by Age by Funding Source in Carencro
Out of a total of 2,401 students who are enrolled in schools in Carencro, 382 (15.9%) attend a private institution, while the remaining 2,019 (84.1%) are enrolled in public schools. The age group of 3 to 4 year olds has the highest likelihood of being enrolled in private schools, with 68 (85.0% in the age bracket) enrolled. Conversely, the age group of 20 to 24 year olds has the lowest likelihood of being enrolled in a private school, with 295 (100.0% in the age bracket) attending a public institution.
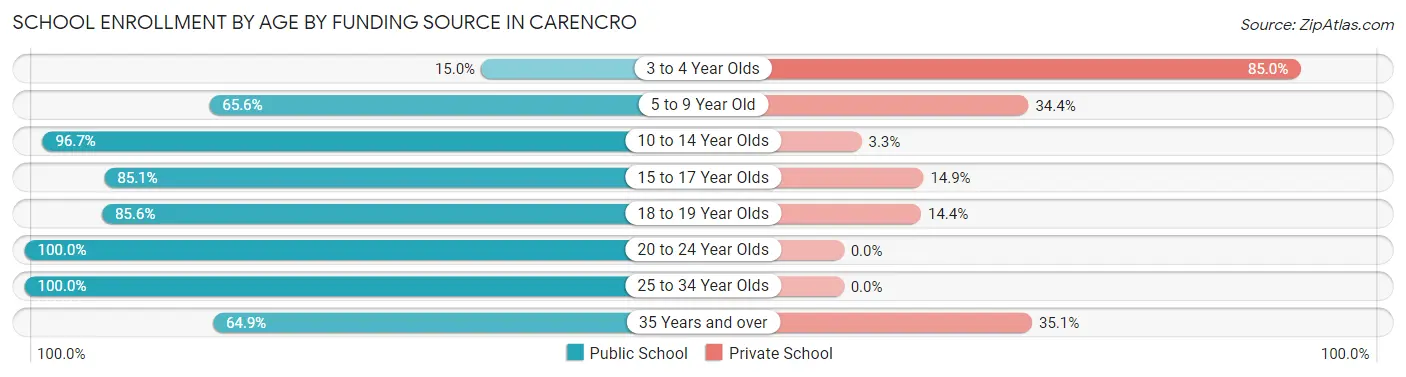
| Age Bracket | Public School | Private School |
| 3 to 4 Year Olds | 12 (15.0%) | 68 (85.0%) |
| 5 to 9 Year Old | 402 (65.6%) | 211 (34.4%) |
| 10 to 14 Year Olds | 870 (96.7%) | 30 (3.3%) |
| 15 to 17 Year Olds | 212 (85.1%) | 37 (14.9%) |
| 18 to 19 Year Olds | 89 (85.6%) | 15 (14.4%) |
| 20 to 24 Year Olds | 295 (100.0%) | 0 (0.0%) |
| 25 to 34 Year Olds | 103 (100.0%) | 0 (0.0%) |
| 35 Years and over | 37 (64.9%) | 20 (35.1%) |
| Total | 2,019 (84.1%) | 382 (15.9%) |
Educational Attainment by Field of Study in Carencro
Business (240 | 22.1%), education (192 | 17.7%), arts & humanities (170 | 15.7%), liberal arts & history (165 | 15.2%), and science & technology (161 | 14.8%) are the most common fields of study among 1,084 individuals in Carencro who have obtained a bachelor's degree or higher.
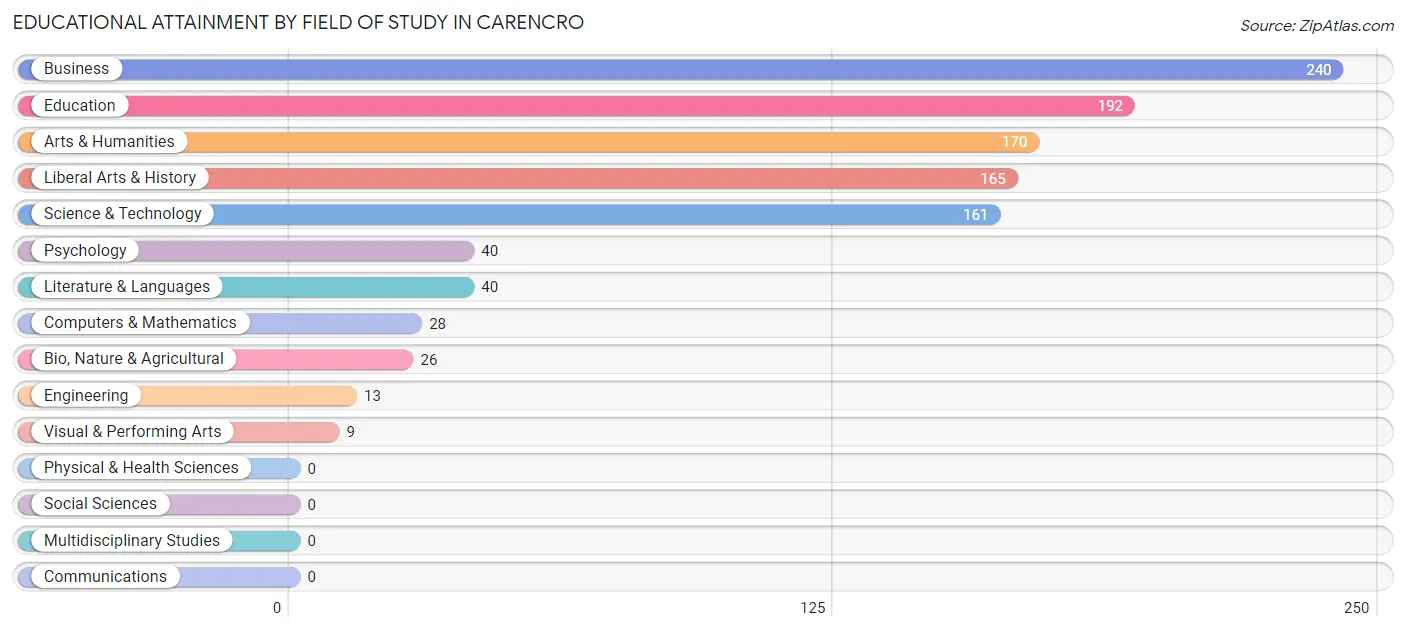
| Field of Study | # Graduates | % Graduates |
| Computers & Mathematics | 28 | 2.6% |
| Bio, Nature & Agricultural | 26 | 2.4% |
| Physical & Health Sciences | 0 | 0.0% |
| Psychology | 40 | 3.7% |
| Social Sciences | 0 | 0.0% |
| Engineering | 13 | 1.2% |
| Multidisciplinary Studies | 0 | 0.0% |
| Science & Technology | 161 | 14.8% |
| Business | 240 | 22.1% |
| Education | 192 | 17.7% |
| Literature & Languages | 40 | 3.7% |
| Liberal Arts & History | 165 | 15.2% |
| Visual & Performing Arts | 9 | 0.8% |
| Communications | 0 | 0.0% |
| Arts & Humanities | 170 | 15.7% |
| Total | 1,084 | 100.0% |
Transportation & Commute in Carencro
Vehicle Availability by Sex in Carencro
The most prevalent vehicle ownership categories in Carencro are males with 2 vehicles (1,370, accounting for 49.8%) and females with 2 vehicles (962, making up 63.1%).
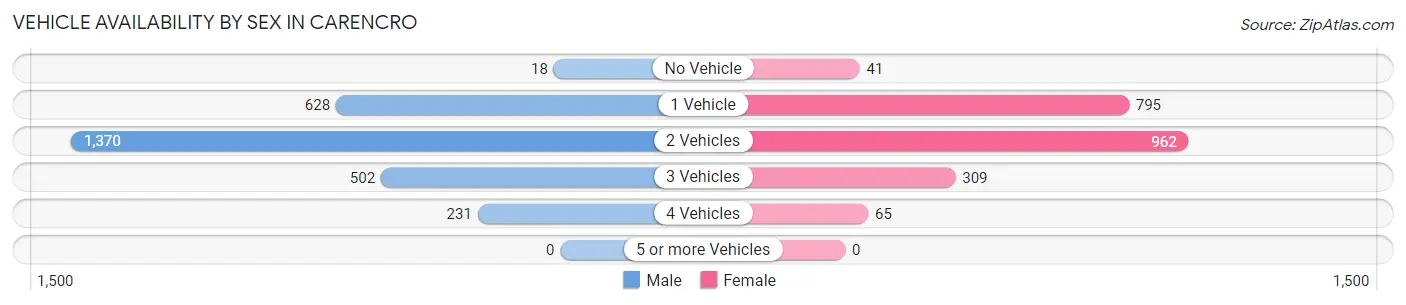
| Vehicles Available | Male | Female |
| No Vehicle | 18 (0.6%) | 41 (1.9%) |
| 1 Vehicle | 628 (22.8%) | 795 (36.6%) |
| 2 Vehicles | 1,370 (49.8%) | 962 (44.3%) |
| 3 Vehicles | 502 (18.3%) | 309 (14.2%) |
| 4 Vehicles | 231 (8.4%) | 65 (3.0%) |
| 5 or more Vehicles | 0 (0.0%) | 0 (0.0%) |
| Total | 2,749 (100.0%) | 2,172 (100.0%) |
Commute Time in Carencro
The most frequently occuring commute durations in Carencro are 20 to 24 minutes (1,158 commuters, 26.0%), 10 to 14 minutes (655 commuters, 14.7%), and 30 to 34 minutes (523 commuters, 11.7%).
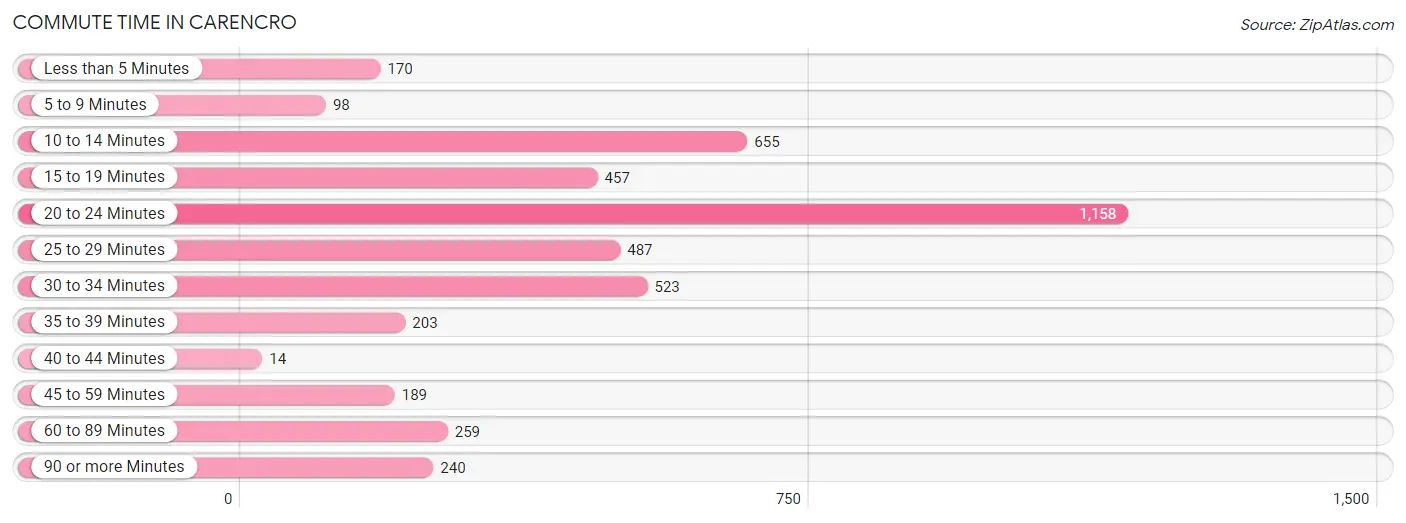
| Commute Time | # Commuters | % Commuters |
| Less than 5 Minutes | 170 | 3.8% |
| 5 to 9 Minutes | 98 | 2.2% |
| 10 to 14 Minutes | 655 | 14.7% |
| 15 to 19 Minutes | 457 | 10.3% |
| 20 to 24 Minutes | 1,158 | 26.0% |
| 25 to 29 Minutes | 487 | 10.9% |
| 30 to 34 Minutes | 523 | 11.7% |
| 35 to 39 Minutes | 203 | 4.6% |
| 40 to 44 Minutes | 14 | 0.3% |
| 45 to 59 Minutes | 189 | 4.2% |
| 60 to 89 Minutes | 259 | 5.8% |
| 90 or more Minutes | 240 | 5.4% |
Commute Time by Sex in Carencro
The most common commute times in Carencro are 20 to 24 minutes (681 commuters, 26.7%) for males and 20 to 24 minutes (477 commuters, 25.0%) for females.
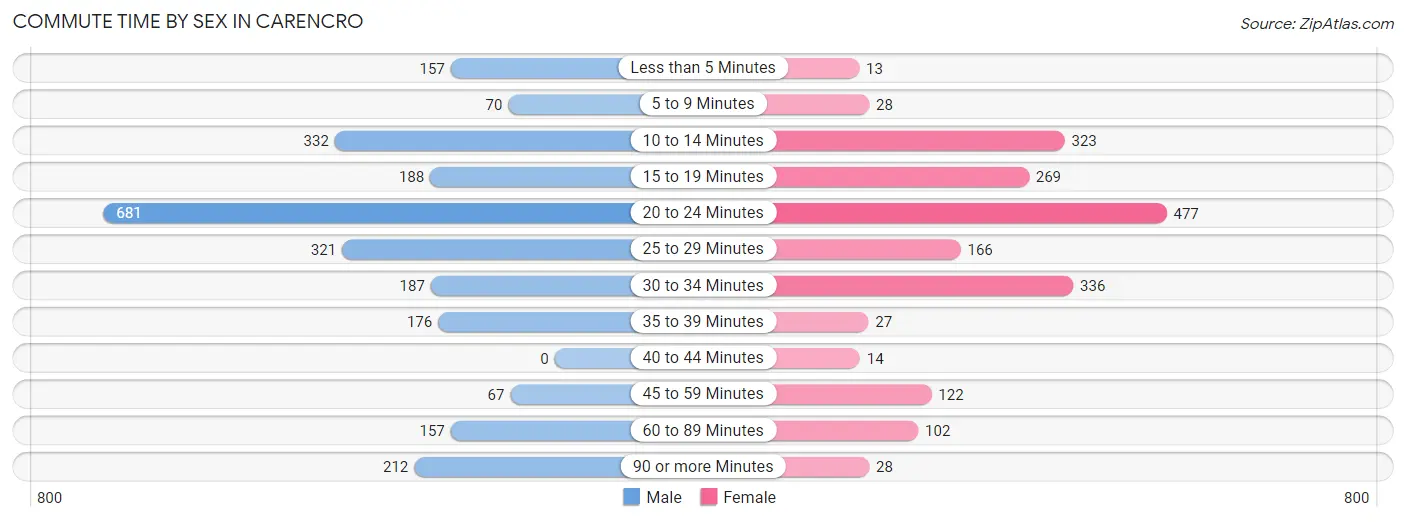
| Commute Time | Male | Female |
| Less than 5 Minutes | 157 (6.2%) | 13 (0.7%) |
| 5 to 9 Minutes | 70 (2.8%) | 28 (1.5%) |
| 10 to 14 Minutes | 332 (13.0%) | 323 (17.0%) |
| 15 to 19 Minutes | 188 (7.4%) | 269 (14.1%) |
| 20 to 24 Minutes | 681 (26.7%) | 477 (25.0%) |
| 25 to 29 Minutes | 321 (12.6%) | 166 (8.7%) |
| 30 to 34 Minutes | 187 (7.3%) | 336 (17.6%) |
| 35 to 39 Minutes | 176 (6.9%) | 27 (1.4%) |
| 40 to 44 Minutes | 0 (0.0%) | 14 (0.7%) |
| 45 to 59 Minutes | 67 (2.6%) | 122 (6.4%) |
| 60 to 89 Minutes | 157 (6.2%) | 102 (5.3%) |
| 90 or more Minutes | 212 (8.3%) | 28 (1.5%) |
Time of Departure to Work by Sex in Carencro
The most frequent times of departure to work in Carencro are 7:00 AM to 7:29 AM (568, 22.3%) for males and 7:00 AM to 7:29 AM (332, 17.4%) for females.
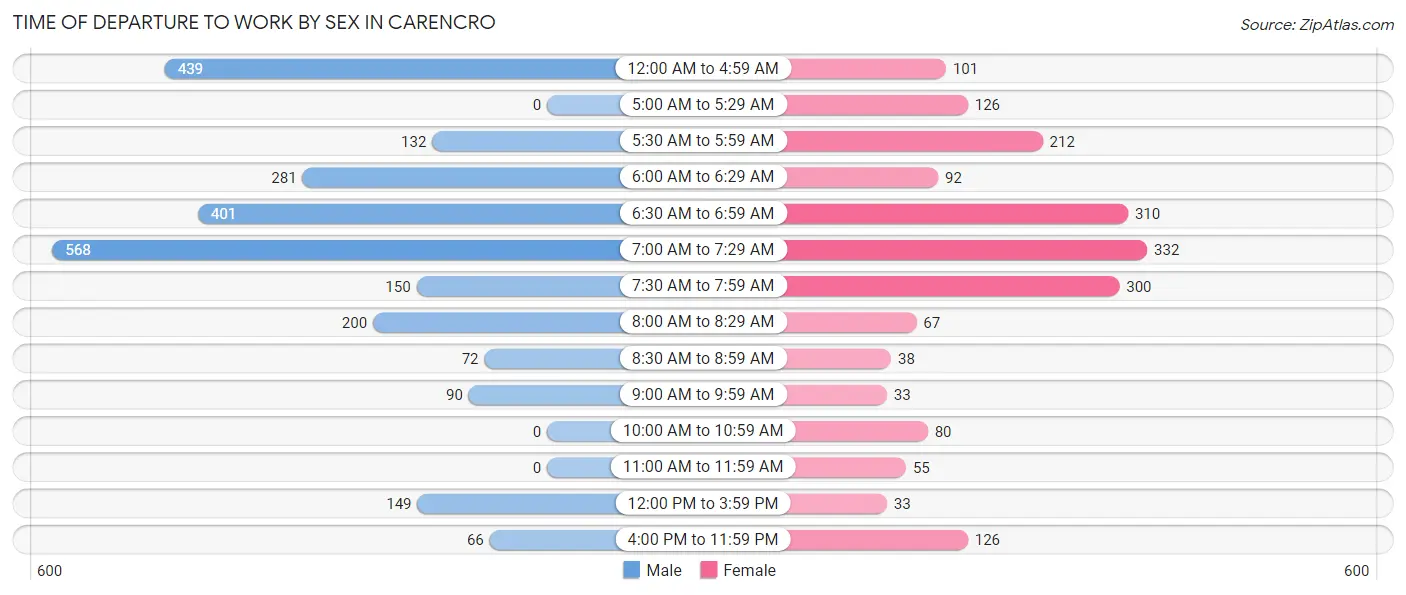
| Time of Departure | Male | Female |
| 12:00 AM to 4:59 AM | 439 (17.2%) | 101 (5.3%) |
| 5:00 AM to 5:29 AM | 0 (0.0%) | 126 (6.6%) |
| 5:30 AM to 5:59 AM | 132 (5.2%) | 212 (11.1%) |
| 6:00 AM to 6:29 AM | 281 (11.0%) | 92 (4.8%) |
| 6:30 AM to 6:59 AM | 401 (15.7%) | 310 (16.3%) |
| 7:00 AM to 7:29 AM | 568 (22.3%) | 332 (17.4%) |
| 7:30 AM to 7:59 AM | 150 (5.9%) | 300 (15.8%) |
| 8:00 AM to 8:29 AM | 200 (7.9%) | 67 (3.5%) |
| 8:30 AM to 8:59 AM | 72 (2.8%) | 38 (2.0%) |
| 9:00 AM to 9:59 AM | 90 (3.5%) | 33 (1.7%) |
| 10:00 AM to 10:59 AM | 0 (0.0%) | 80 (4.2%) |
| 11:00 AM to 11:59 AM | 0 (0.0%) | 55 (2.9%) |
| 12:00 PM to 3:59 PM | 149 (5.9%) | 33 (1.7%) |
| 4:00 PM to 11:59 PM | 66 (2.6%) | 126 (6.6%) |
| Total | 2,548 (100.0%) | 1,905 (100.0%) |
Housing Occupancy in Carencro
Occupancy by Ownership in Carencro
Of the total 4,173 dwellings in Carencro, owner-occupied units account for 2,704 (64.8%), while renter-occupied units make up 1,469 (35.2%).
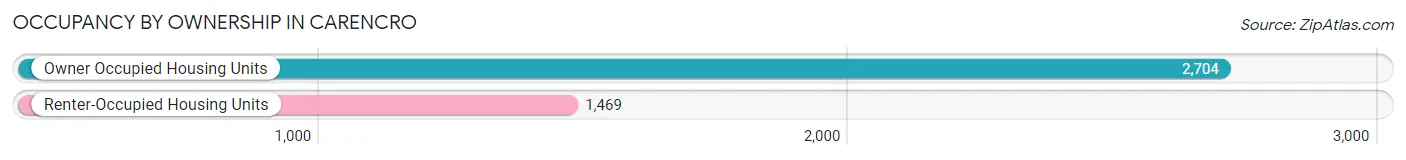
| Occupancy | # Housing Units | % Housing Units |
| Owner Occupied Housing Units | 2,704 | 64.8% |
| Renter-Occupied Housing Units | 1,469 | 35.2% |
| Total Occupied Housing Units | 4,173 | 100.0% |
Occupancy by Household Size in Carencro
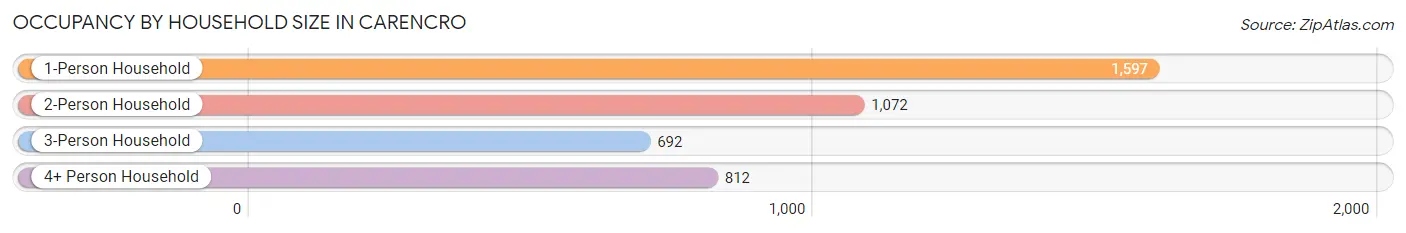
| Household Size | # Housing Units | % Housing Units |
| 1-Person Household | 1,597 | 38.3% |
| 2-Person Household | 1,072 | 25.7% |
| 3-Person Household | 692 | 16.6% |
| 4+ Person Household | 812 | 19.5% |
| Total Housing Units | 4,173 | 100.0% |
Occupancy by Ownership by Household Size in Carencro
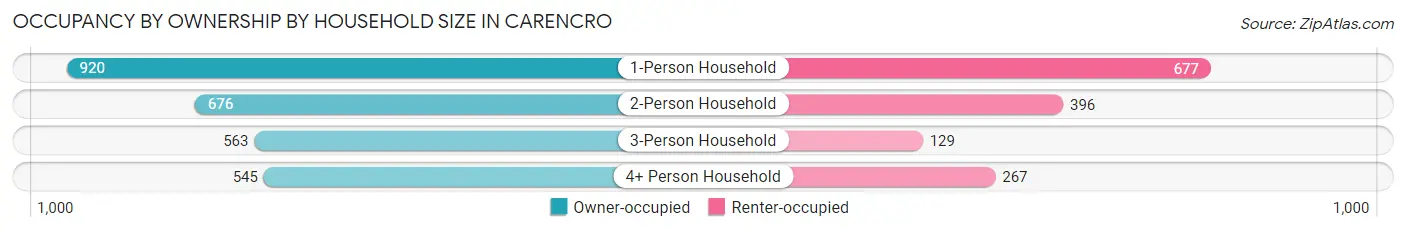
| Household Size | Owner-occupied | Renter-occupied |
| 1-Person Household | 920 (57.6%) | 677 (42.4%) |
| 2-Person Household | 676 (63.1%) | 396 (36.9%) |
| 3-Person Household | 563 (81.4%) | 129 (18.6%) |
| 4+ Person Household | 545 (67.1%) | 267 (32.9%) |
| Total Housing Units | 2,704 (64.8%) | 1,469 (35.2%) |
Occupancy by Educational Attainment in Carencro
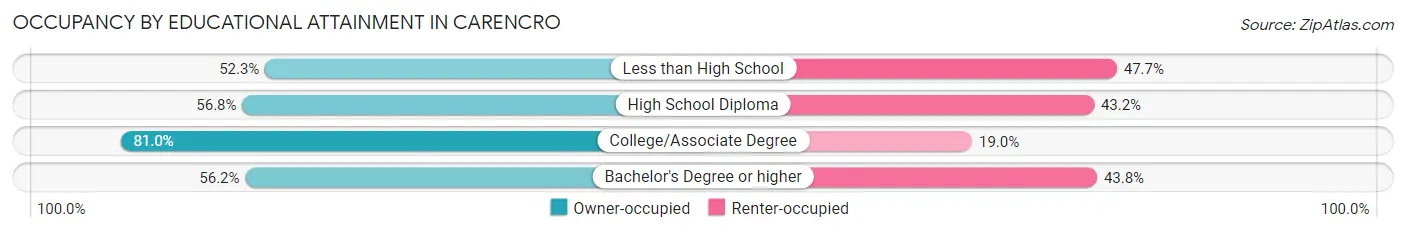
| Household Size | Owner-occupied | Renter-occupied |
| Less than High School | 353 (52.3%) | 322 (47.7%) |
| High School Diploma | 750 (56.8%) | 570 (43.2%) |
| College/Associate Degree | 1,231 (81.0%) | 289 (19.0%) |
| Bachelor's Degree or higher | 370 (56.2%) | 288 (43.8%) |
Occupancy by Age of Householder in Carencro
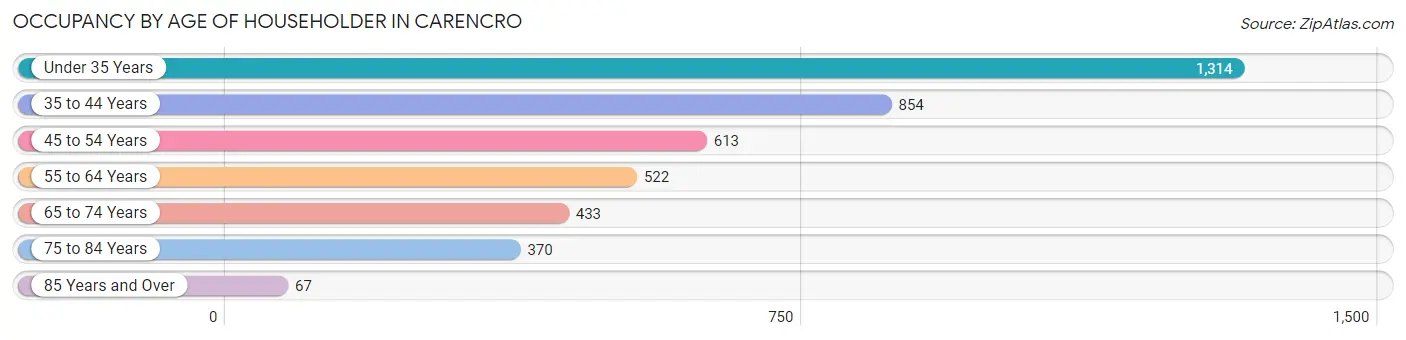
| Age Bracket | # Households | % Households |
| Under 35 Years | 1,314 | 31.5% |
| 35 to 44 Years | 854 | 20.5% |
| 45 to 54 Years | 613 | 14.7% |
| 55 to 64 Years | 522 | 12.5% |
| 65 to 74 Years | 433 | 10.4% |
| 75 to 84 Years | 370 | 8.9% |
| 85 Years and Over | 67 | 1.6% |
| Total | 4,173 | 100.0% |
Housing Finances in Carencro
Median Income by Occupancy in Carencro
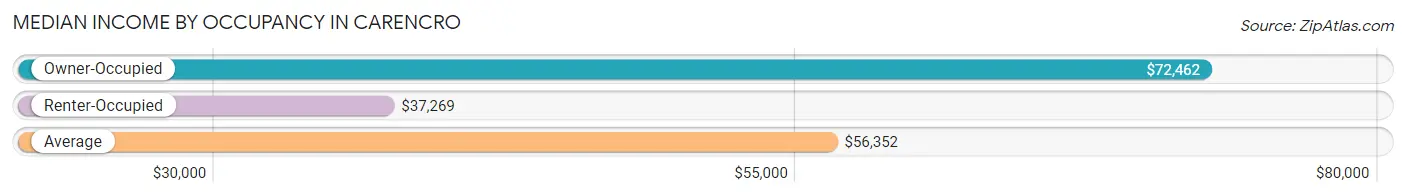
| Occupancy Type | # Households | Median Income |
| Owner-Occupied | 2,704 (64.8%) | $72,462 |
| Renter-Occupied | 1,469 (35.2%) | $37,269 |
| Average | 4,173 (100.0%) | $56,352 |
Occupancy by Householder Income Bracket in Carencro
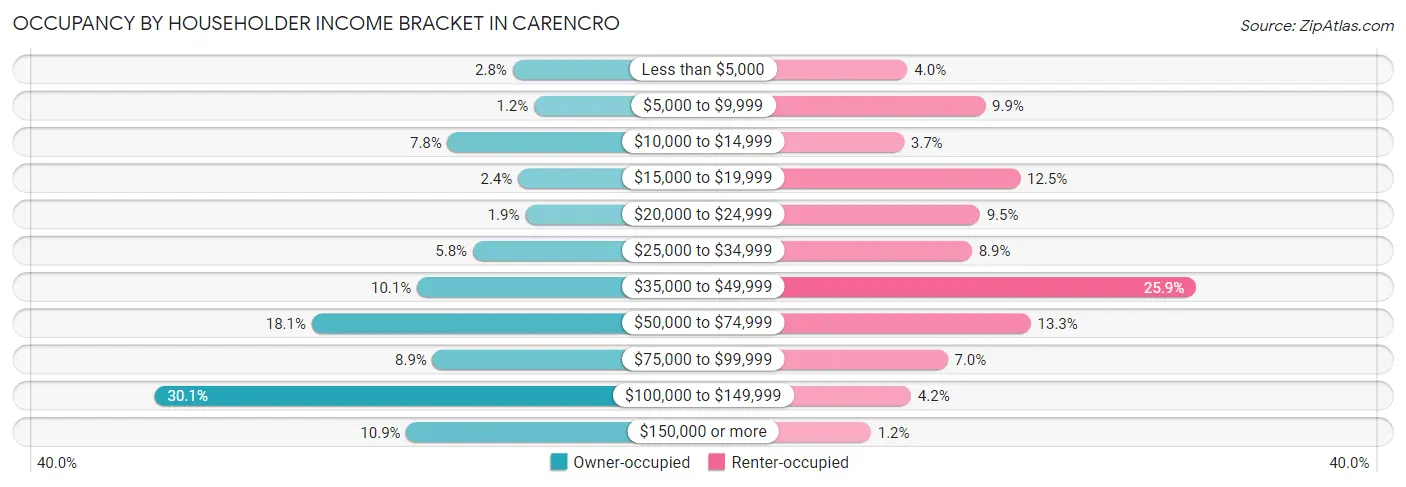
| Income Bracket | Owner-occupied | Renter-occupied |
| Less than $5,000 | 76 (2.8%) | 58 (4.0%) |
| $5,000 to $9,999 | 32 (1.2%) | 145 (9.9%) |
| $10,000 to $14,999 | 210 (7.8%) | 54 (3.7%) |
| $15,000 to $19,999 | 65 (2.4%) | 184 (12.5%) |
| $20,000 to $24,999 | 50 (1.8%) | 139 (9.5%) |
| $25,000 to $34,999 | 158 (5.8%) | 130 (8.8%) |
| $35,000 to $49,999 | 273 (10.1%) | 381 (25.9%) |
| $50,000 to $74,999 | 490 (18.1%) | 196 (13.3%) |
| $75,000 to $99,999 | 241 (8.9%) | 103 (7.0%) |
| $100,000 to $149,999 | 814 (30.1%) | 62 (4.2%) |
| $150,000 or more | 295 (10.9%) | 17 (1.2%) |
| Total | 2,704 (100.0%) | 1,469 (100.0%) |
Monthly Housing Cost Tiers in Carencro
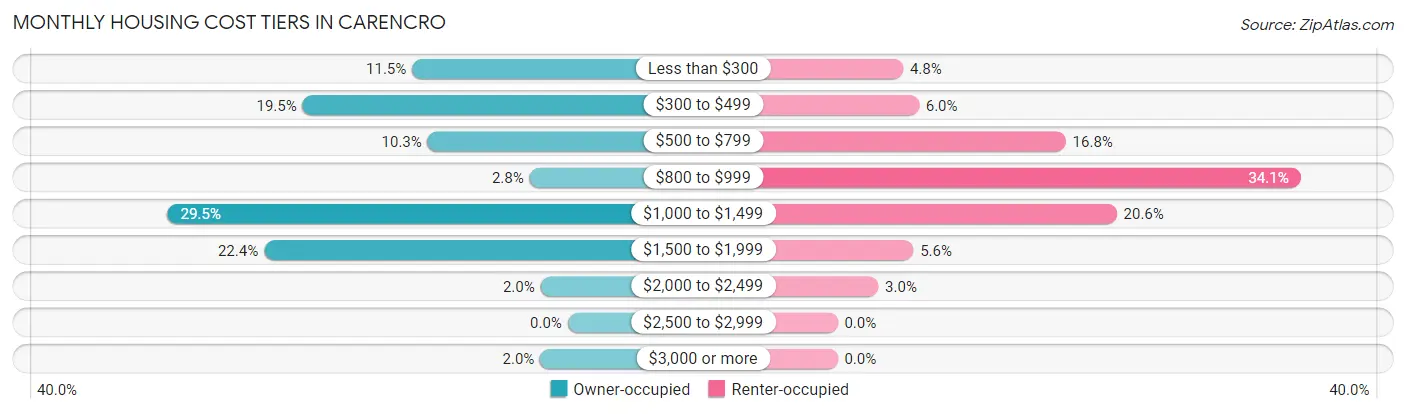
| Monthly Cost | Owner-occupied | Renter-occupied |
| Less than $300 | 310 (11.5%) | 71 (4.8%) |
| $300 to $499 | 528 (19.5%) | 88 (6.0%) |
| $500 to $799 | 279 (10.3%) | 247 (16.8%) |
| $800 to $999 | 76 (2.8%) | 501 (34.1%) |
| $1,000 to $1,499 | 797 (29.5%) | 302 (20.6%) |
| $1,500 to $1,999 | 605 (22.4%) | 82 (5.6%) |
| $2,000 to $2,499 | 54 (2.0%) | 44 (3.0%) |
| $2,500 to $2,999 | 0 (0.0%) | 0 (0.0%) |
| $3,000 or more | 55 (2.0%) | 0 (0.0%) |
| Total | 2,704 (100.0%) | 1,469 (100.0%) |
Physical Housing Characteristics in Carencro
Housing Structures in Carencro
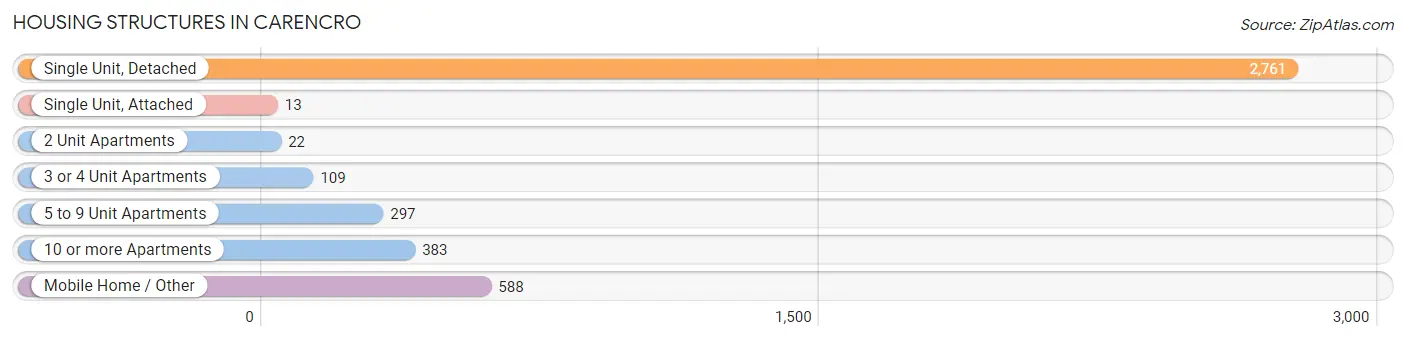
| Structure Type | # Housing Units | % Housing Units |
| Single Unit, Detached | 2,761 | 66.2% |
| Single Unit, Attached | 13 | 0.3% |
| 2 Unit Apartments | 22 | 0.5% |
| 3 or 4 Unit Apartments | 109 | 2.6% |
| 5 to 9 Unit Apartments | 297 | 7.1% |
| 10 or more Apartments | 383 | 9.2% |
| Mobile Home / Other | 588 | 14.1% |
| Total | 4,173 | 100.0% |
Housing Structures by Occupancy in Carencro
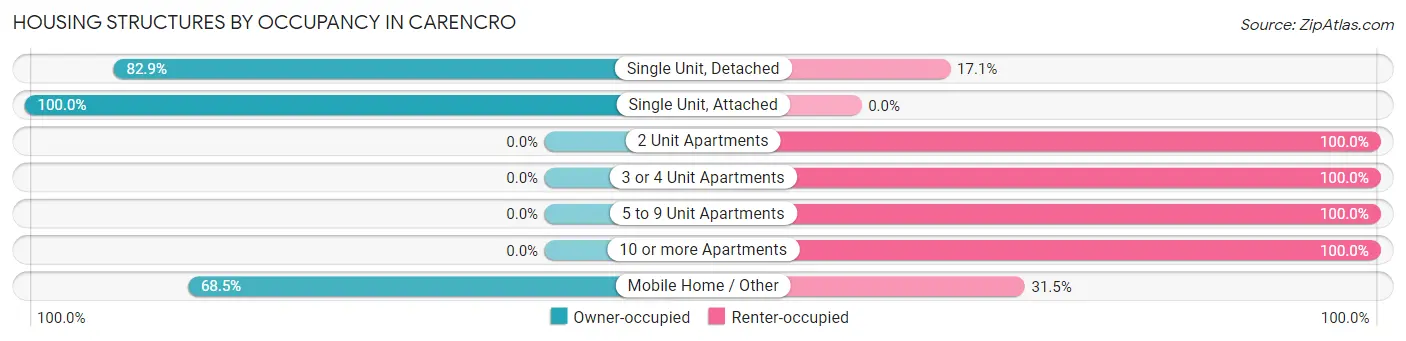
| Structure Type | Owner-occupied | Renter-occupied |
| Single Unit, Detached | 2,288 (82.9%) | 473 (17.1%) |
| Single Unit, Attached | 13 (100.0%) | 0 (0.0%) |
| 2 Unit Apartments | 0 (0.0%) | 22 (100.0%) |
| 3 or 4 Unit Apartments | 0 (0.0%) | 109 (100.0%) |
| 5 to 9 Unit Apartments | 0 (0.0%) | 297 (100.0%) |
| 10 or more Apartments | 0 (0.0%) | 383 (100.0%) |
| Mobile Home / Other | 403 (68.5%) | 185 (31.5%) |
| Total | 2,704 (64.8%) | 1,469 (35.2%) |
Housing Structures by Number of Rooms in Carencro
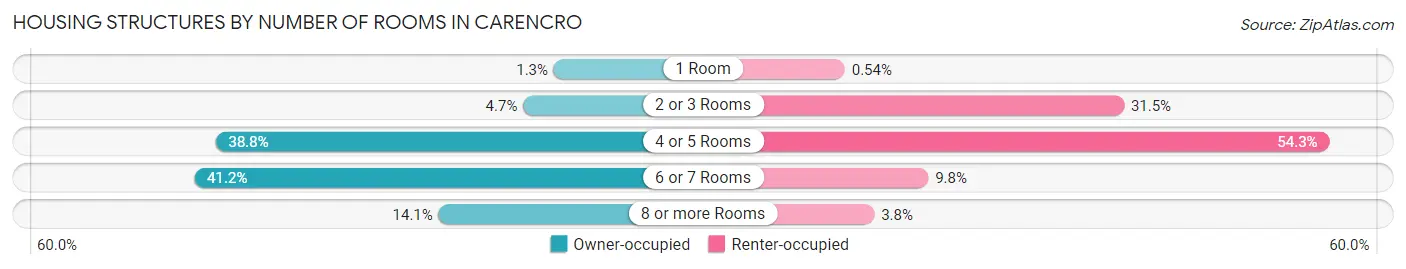
| Number of Rooms | Owner-occupied | Renter-occupied |
| 1 Room | 34 (1.3%) | 8 (0.5%) |
| 2 or 3 Rooms | 126 (4.7%) | 463 (31.5%) |
| 4 or 5 Rooms | 1,050 (38.8%) | 798 (54.3%) |
| 6 or 7 Rooms | 1,114 (41.2%) | 144 (9.8%) |
| 8 or more Rooms | 380 (14.1%) | 56 (3.8%) |
| Total | 2,704 (100.0%) | 1,469 (100.0%) |
Housing Structure by Heating Type in Carencro
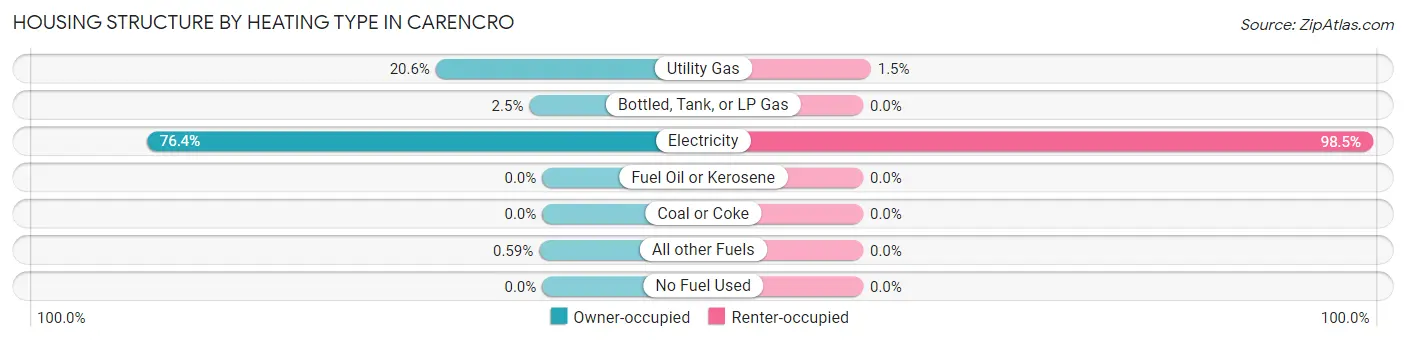
| Heating Type | Owner-occupied | Renter-occupied |
| Utility Gas | 556 (20.6%) | 22 (1.5%) |
| Bottled, Tank, or LP Gas | 67 (2.5%) | 0 (0.0%) |
| Electricity | 2,065 (76.4%) | 1,447 (98.5%) |
| Fuel Oil or Kerosene | 0 (0.0%) | 0 (0.0%) |
| Coal or Coke | 0 (0.0%) | 0 (0.0%) |
| All other Fuels | 16 (0.6%) | 0 (0.0%) |
| No Fuel Used | 0 (0.0%) | 0 (0.0%) |
| Total | 2,704 (100.0%) | 1,469 (100.0%) |
Household Vehicle Usage in Carencro
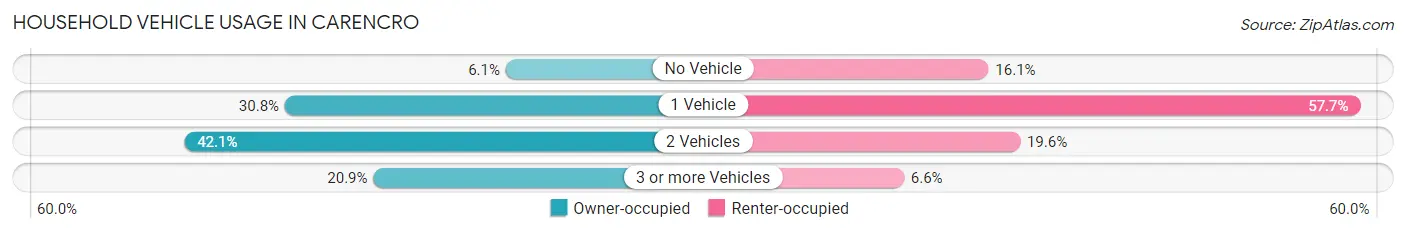
| Vehicles per Household | Owner-occupied | Renter-occupied |
| No Vehicle | 165 (6.1%) | 236 (16.1%) |
| 1 Vehicle | 834 (30.8%) | 848 (57.7%) |
| 2 Vehicles | 1,139 (42.1%) | 288 (19.6%) |
| 3 or more Vehicles | 566 (20.9%) | 97 (6.6%) |
| Total | 2,704 (100.0%) | 1,469 (100.0%) |
Real Estate & Mortgages in Carencro
Real Estate and Mortgage Overview in Carencro
| Characteristic | Without Mortgage | With Mortgage |
| Housing Units | 1,054 | 1,650 |
| Median Property Value | $152,400 | $218,200 |
| Median Household Income | $41,667 | $194 |
| Monthly Housing Costs | $379 | $55 |
| Real Estate Taxes | $413 | $104 |
Property Value by Mortgage Status in Carencro
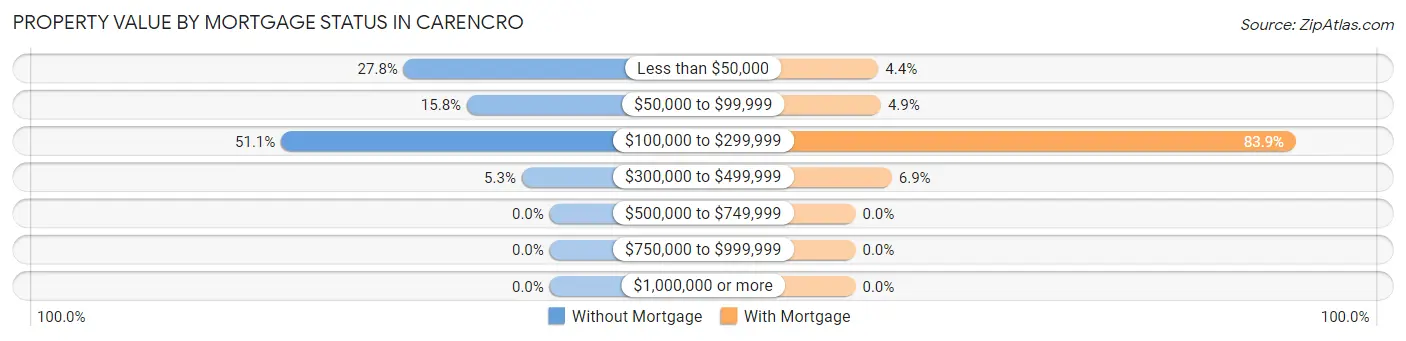
| Property Value | Without Mortgage | With Mortgage |
| Less than $50,000 | 293 (27.8%) | 72 (4.4%) |
| $50,000 to $99,999 | 166 (15.8%) | 80 (4.9%) |
| $100,000 to $299,999 | 539 (51.1%) | 1,384 (83.9%) |
| $300,000 to $499,999 | 56 (5.3%) | 114 (6.9%) |
| $500,000 to $749,999 | 0 (0.0%) | 0 (0.0%) |
| $750,000 to $999,999 | 0 (0.0%) | 0 (0.0%) |
| $1,000,000 or more | 0 (0.0%) | 0 (0.0%) |
| Total | 1,054 (100.0%) | 1,650 (100.0%) |
Household Income by Mortgage Status in Carencro
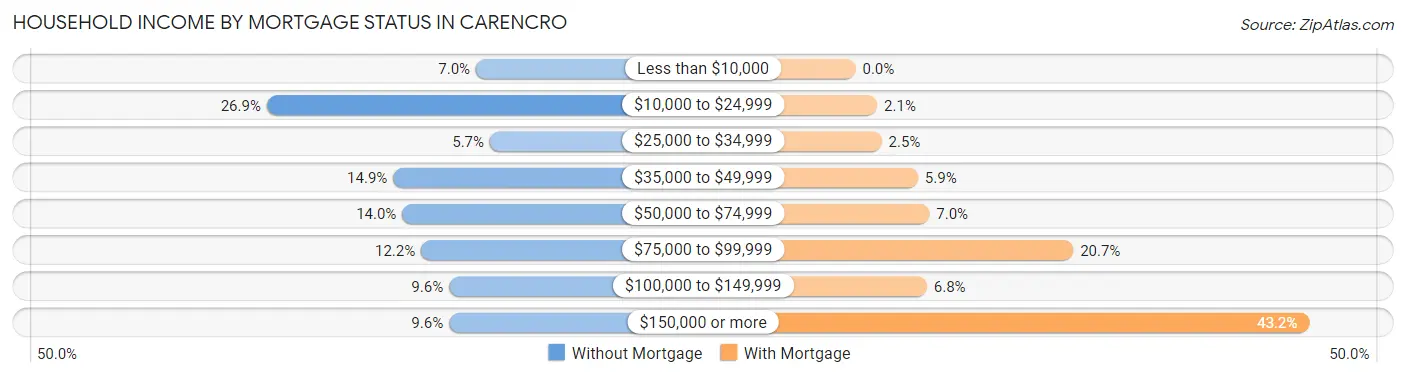
| Household Income | Without Mortgage | With Mortgage |
| Less than $10,000 | 74 (7.0%) | 0 (0.0%) |
| $10,000 to $24,999 | 284 (26.9%) | 34 (2.1%) |
| $25,000 to $34,999 | 60 (5.7%) | 41 (2.5%) |
| $35,000 to $49,999 | 157 (14.9%) | 98 (5.9%) |
| $50,000 to $74,999 | 148 (14.0%) | 116 (7.0%) |
| $75,000 to $99,999 | 129 (12.2%) | 342 (20.7%) |
| $100,000 to $149,999 | 101 (9.6%) | 112 (6.8%) |
| $150,000 or more | 101 (9.6%) | 713 (43.2%) |
| Total | 1,054 (100.0%) | 1,650 (100.0%) |
Property Value to Household Income Ratio in Carencro
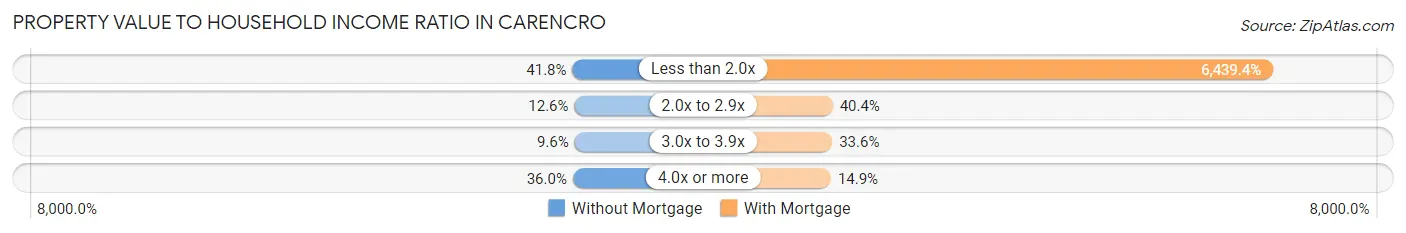
| Value-to-Income Ratio | Without Mortgage | With Mortgage |
| Less than 2.0x | 441 (41.8%) | 106,250 (6,439.4%) |
| 2.0x to 2.9x | 133 (12.6%) | 667 (40.4%) |
| 3.0x to 3.9x | 101 (9.6%) | 555 (33.6%) |
| 4.0x or more | 379 (36.0%) | 246 (14.9%) |
| Total | 1,054 (100.0%) | 1,650 (100.0%) |
Real Estate Taxes by Mortgage Status in Carencro
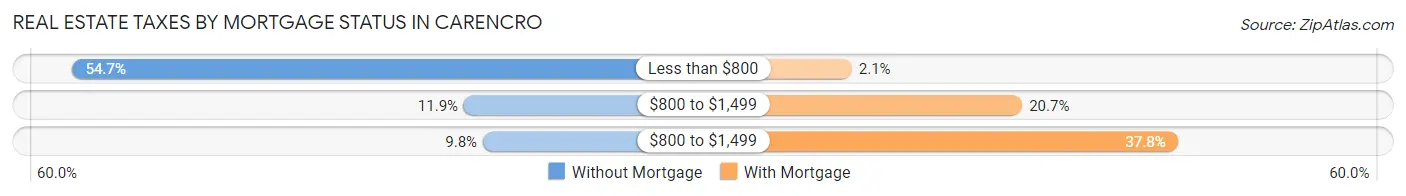
| Property Taxes | Without Mortgage | With Mortgage |
| Less than $800 | 577 (54.7%) | 34 (2.1%) |
| $800 to $1,499 | 125 (11.9%) | 342 (20.7%) |
| $800 to $1,499 | 103 (9.8%) | 623 (37.8%) |
| Total | 1,054 (100.0%) | 1,650 (100.0%) |
Health & Disability in Carencro
Health Insurance Coverage by Age in Carencro
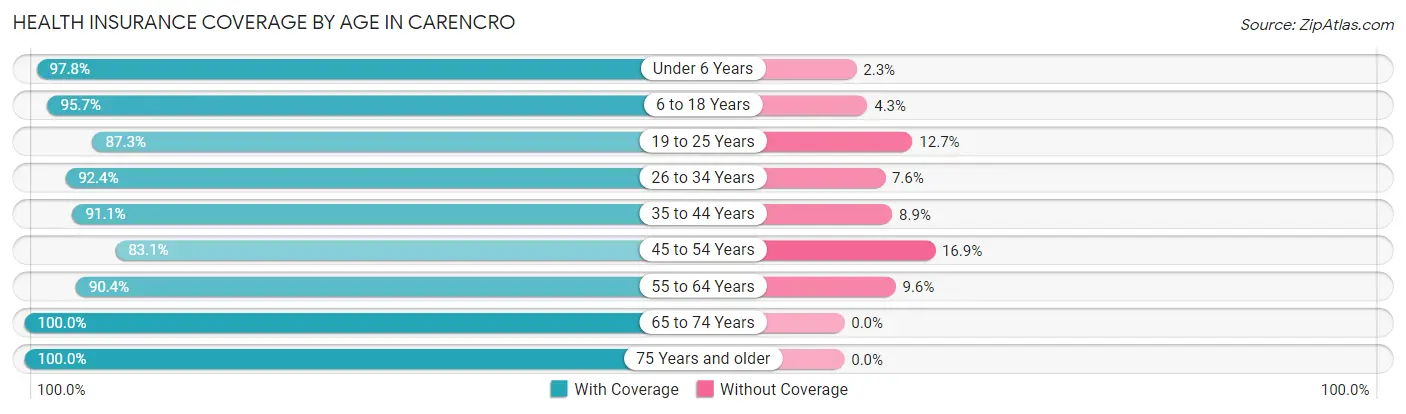
| Age Bracket | With Coverage | Without Coverage |
| Under 6 Years | 955 (97.8%) | 22 (2.2%) |
| 6 to 18 Years | 1,807 (95.7%) | 81 (4.3%) |
| 19 to 25 Years | 605 (87.3%) | 88 (12.7%) |
| 26 to 34 Years | 1,792 (92.4%) | 147 (7.6%) |
| 35 to 44 Years | 1,071 (91.1%) | 105 (8.9%) |
| 45 to 54 Years | 924 (83.1%) | 188 (16.9%) |
| 55 to 64 Years | 908 (90.4%) | 96 (9.6%) |
| 65 to 74 Years | 648 (100.0%) | 0 (0.0%) |
| 75 Years and older | 627 (100.0%) | 0 (0.0%) |
| Total | 9,337 (92.8%) | 727 (7.2%) |
Health Insurance Coverage by Citizenship Status in Carencro
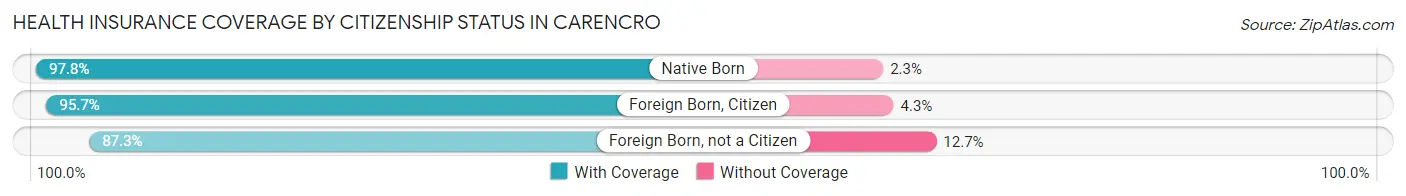
| Citizenship Status | With Coverage | Without Coverage |
| Native Born | 955 (97.8%) | 22 (2.2%) |
| Foreign Born, Citizen | 1,807 (95.7%) | 81 (4.3%) |
| Foreign Born, not a Citizen | 605 (87.3%) | 88 (12.7%) |
Health Insurance Coverage by Household Income in Carencro
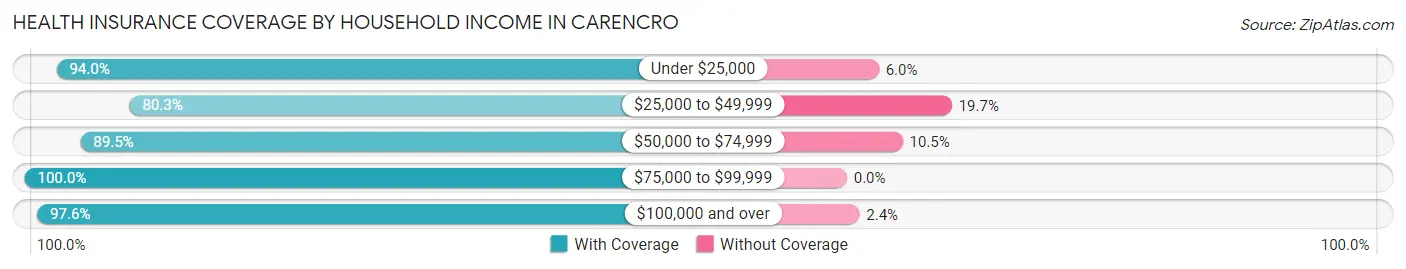
| Household Income | With Coverage | Without Coverage |
| Under $25,000 | 2,122 (94.0%) | 135 (6.0%) |
| $25,000 to $49,999 | 1,369 (80.3%) | 335 (19.7%) |
| $50,000 to $74,999 | 1,506 (89.5%) | 176 (10.5%) |
| $75,000 to $99,999 | 970 (100.0%) | 0 (0.0%) |
| $100,000 and over | 3,348 (97.6%) | 81 (2.4%) |
Public vs Private Health Insurance Coverage by Age in Carencro
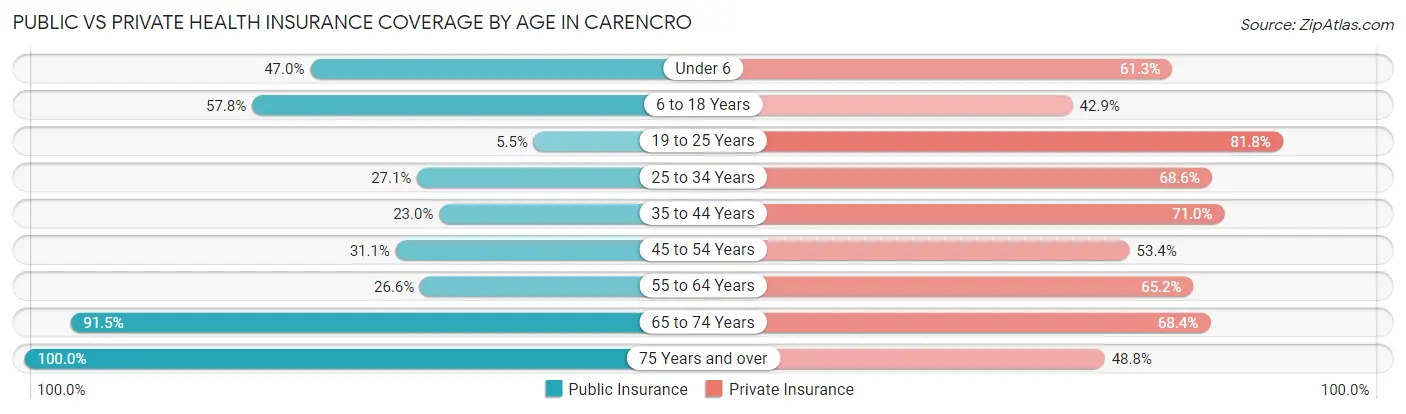
| Age Bracket | Public Insurance | Private Insurance |
| Under 6 | 459 (47.0%) | 599 (61.3%) |
| 6 to 18 Years | 1,091 (57.8%) | 809 (42.8%) |
| 19 to 25 Years | 38 (5.5%) | 567 (81.8%) |
| 25 to 34 Years | 526 (27.1%) | 1,331 (68.6%) |
| 35 to 44 Years | 271 (23.0%) | 835 (71.0%) |
| 45 to 54 Years | 346 (31.1%) | 594 (53.4%) |
| 55 to 64 Years | 267 (26.6%) | 655 (65.2%) |
| 65 to 74 Years | 593 (91.5%) | 443 (68.4%) |
| 75 Years and over | 627 (100.0%) | 306 (48.8%) |
| Total | 4,218 (41.9%) | 6,139 (61.0%) |
Disability Status by Sex by Age in Carencro
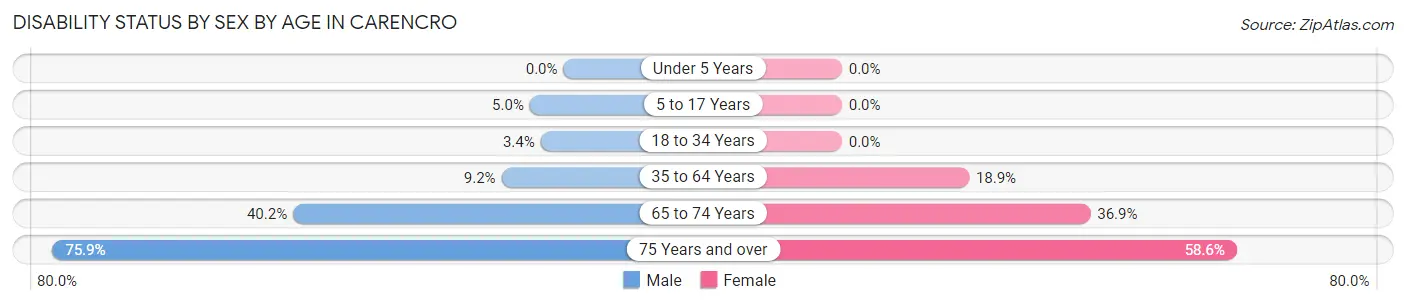
| Age Bracket | Male | Female |
| Under 5 Years | 0 (0.0%) | 0 (0.0%) |
| 5 to 17 Years | 48 (5.0%) | 0 (0.0%) |
| 18 to 34 Years | 45 (3.4%) | 0 (0.0%) |
| 35 to 64 Years | 155 (9.2%) | 303 (18.9%) |
| 65 to 74 Years | 110 (40.2%) | 138 (36.9%) |
| 75 Years and over | 151 (75.9%) | 251 (58.6%) |
Disability Class by Sex by Age in Carencro
Disability Class: Hearing Difficulty
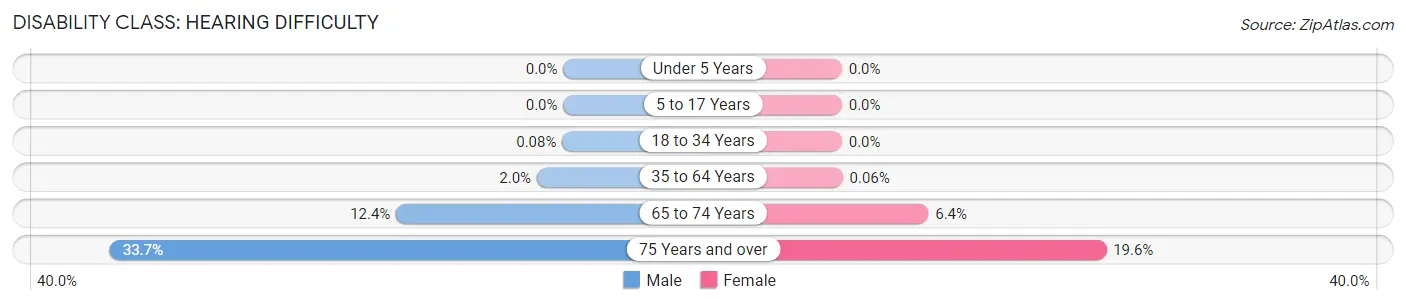
| Age Bracket | Male | Female |
| Under 5 Years | 0 (0.0%) | 0 (0.0%) |
| 5 to 17 Years | 0 (0.0%) | 0 (0.0%) |
| 18 to 34 Years | 1 (0.1%) | 0 (0.0%) |
| 35 to 64 Years | 33 (2.0%) | 1 (0.1%) |
| 65 to 74 Years | 34 (12.4%) | 24 (6.4%) |
| 75 Years and over | 67 (33.7%) | 84 (19.6%) |
Disability Class: Vision Difficulty
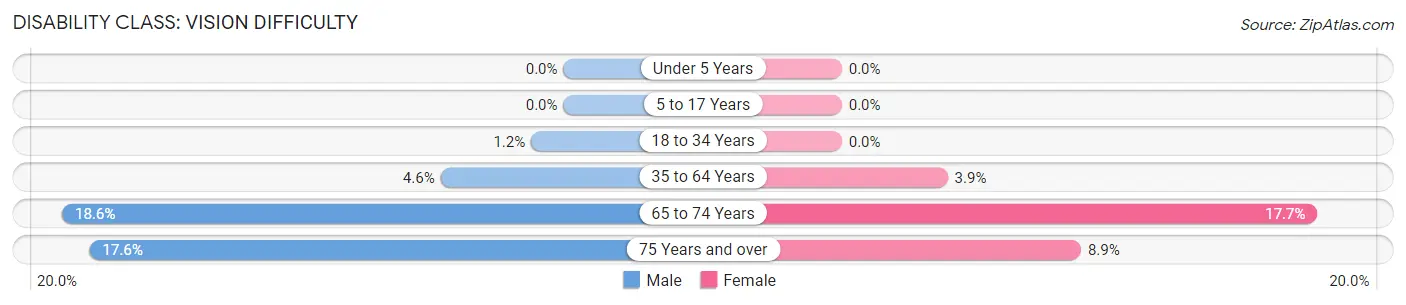
| Age Bracket | Male | Female |
| Under 5 Years | 0 (0.0%) | 0 (0.0%) |
| 5 to 17 Years | 0 (0.0%) | 0 (0.0%) |
| 18 to 34 Years | 16 (1.2%) | 0 (0.0%) |
| 35 to 64 Years | 77 (4.6%) | 63 (3.9%) |
| 65 to 74 Years | 51 (18.6%) | 66 (17.6%) |
| 75 Years and over | 35 (17.6%) | 38 (8.9%) |
Disability Class: Cognitive Difficulty
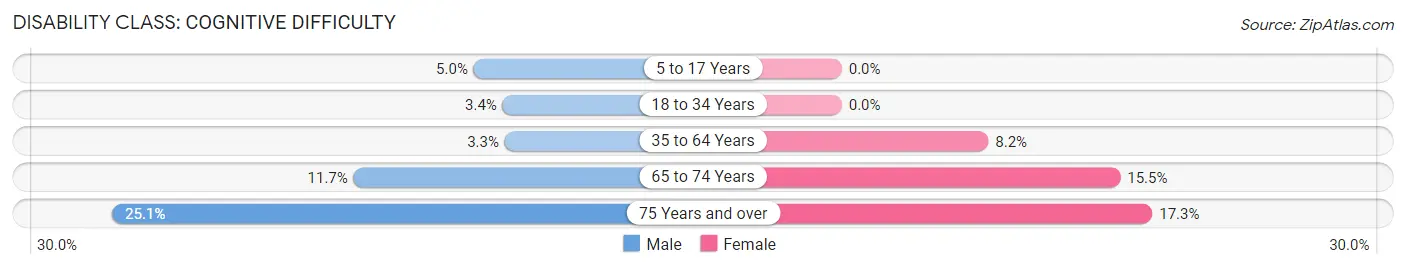
| Age Bracket | Male | Female |
| 5 to 17 Years | 48 (5.0%) | 0 (0.0%) |
| 18 to 34 Years | 45 (3.4%) | 0 (0.0%) |
| 35 to 64 Years | 55 (3.3%) | 131 (8.2%) |
| 65 to 74 Years | 32 (11.7%) | 58 (15.5%) |
| 75 Years and over | 50 (25.1%) | 74 (17.3%) |
Disability Class: Ambulatory Difficulty
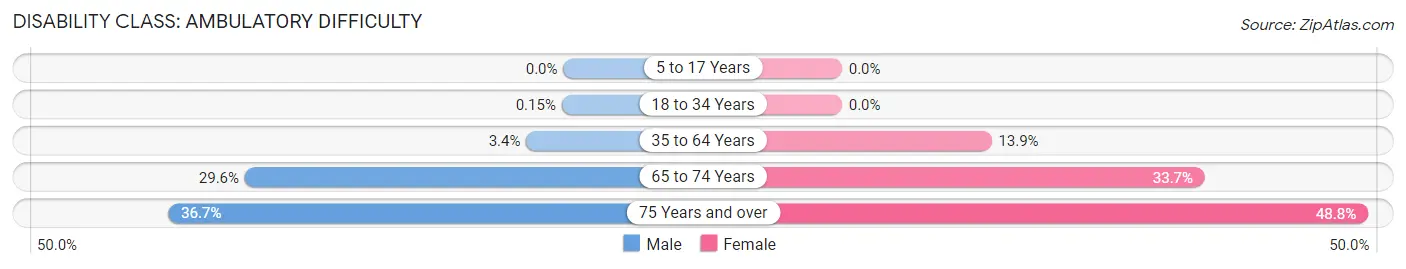
| Age Bracket | Male | Female |
| 5 to 17 Years | 0 (0.0%) | 0 (0.0%) |
| 18 to 34 Years | 2 (0.2%) | 0 (0.0%) |
| 35 to 64 Years | 58 (3.4%) | 223 (13.9%) |
| 65 to 74 Years | 81 (29.6%) | 126 (33.7%) |
| 75 Years and over | 73 (36.7%) | 209 (48.8%) |
Disability Class: Self-Care Difficulty
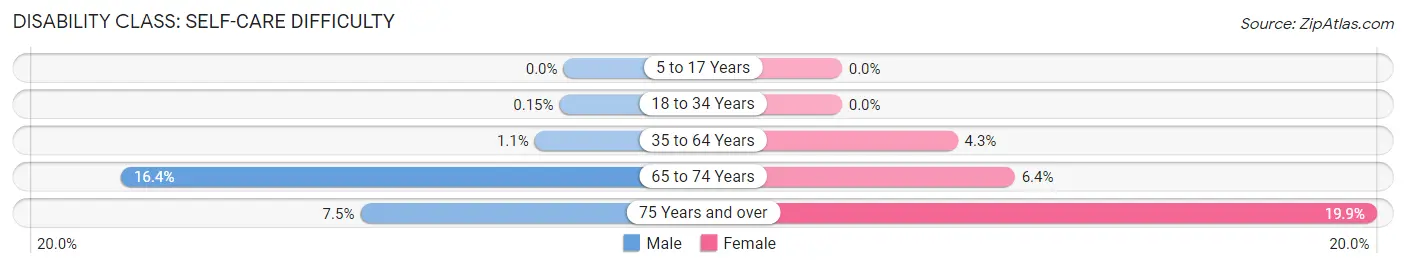
| Age Bracket | Male | Female |
| 5 to 17 Years | 0 (0.0%) | 0 (0.0%) |
| 18 to 34 Years | 2 (0.2%) | 0 (0.0%) |
| 35 to 64 Years | 18 (1.1%) | 69 (4.3%) |
| 65 to 74 Years | 45 (16.4%) | 24 (6.4%) |
| 75 Years and over | 15 (7.5%) | 85 (19.9%) |
Technology Access in Carencro
Computing Device Access in Carencro
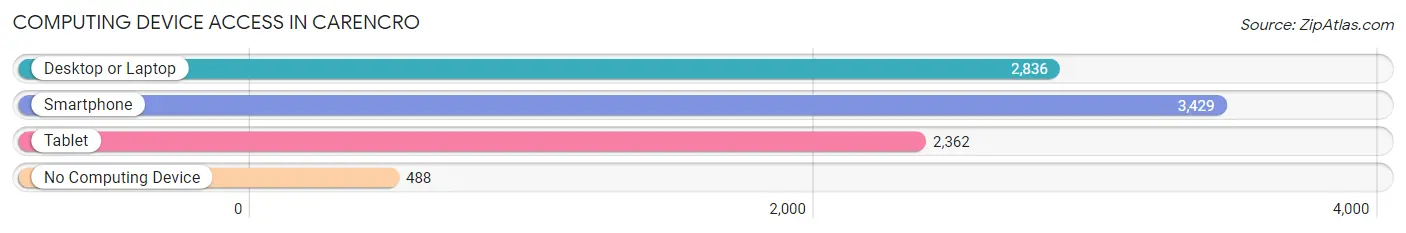
| Device Type | # Households | % Households |
| Desktop or Laptop | 2,836 | 68.0% |
| Smartphone | 3,429 | 82.2% |
| Tablet | 2,362 | 56.6% |
| No Computing Device | 488 | 11.7% |
| Total | 4,173 | 100.0% |
Internet Access in Carencro
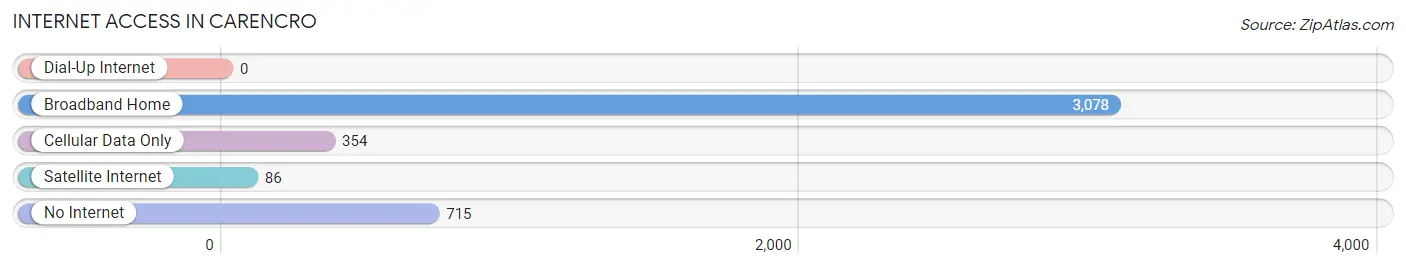
| Internet Type | # Households | % Households |
| Dial-Up Internet | 0 | 0.0% |
| Broadband Home | 3,078 | 73.8% |
| Cellular Data Only | 354 | 8.5% |
| Satellite Internet | 86 | 2.1% |
| No Internet | 715 | 17.1% |
| Total | 4,173 | 100.0% |
Carencro Summary
Carencro, Louisiana is a small city located in Lafayette Parish, in the heart of the Acadiana region of the state. It is situated on the banks of the Bayou Vermilion, and is home to a population of approximately 7,800 people. The city is known for its vibrant culture, rich history, and unique geography.
History
Carencro was founded in 1829 by Jean Mouton, a French-Acadian settler. The city was named after his wife, Marie Carencro, and was originally known as “Mouton’s Settlement”. The city was incorporated in 1848, and has since grown to become a thriving community.
Carencro has a long and rich history, and has been home to many different cultures over the years. The city was originally settled by French-Acadians, and later by German and Irish immigrants. The city was also home to a large population of African-Americans, who were brought to the area to work on the sugar plantations.
Geography
Carencro is located in the heart of the Acadiana region of Louisiana, and is situated on the banks of the Bayou Vermilion. The city is surrounded by rolling hills and lush forests, and is home to a variety of wildlife. The city is also located near the Gulf of Mexico, and is only a short drive away from the beaches of Grand Isle and Port Fourchon.
The city is located in the humid subtropical climate zone, and experiences hot and humid summers, and mild winters. The average temperature in the summer is around 90 degrees Fahrenheit, and the average temperature in the winter is around 50 degrees Fahrenheit.
Economy
Carencro’s economy is largely based on agriculture and tourism. The city is home to a variety of farms, including sugar cane, cotton, and soybean farms. The city is also home to a number of tourist attractions, including the Bayou Vermilion District, the Cajun Village, and the Acadian Village.
The city is also home to a number of businesses, including restaurants, retail stores, and manufacturing plants. The city is also home to a number of oil and gas companies, and is a major hub for the oil and gas industry in the region.
Demographics
As of the 2010 census, Carencro had a population of 7,800 people. The city is predominantly white, with a population that is approximately 70% white, 20% African-American, and 10% Hispanic. The median household income in the city is $37,000, and the median home value is $130,000.
Carencro is a vibrant and diverse city, and is home to a variety of cultures and backgrounds. The city is known for its friendly and welcoming atmosphere, and is a great place to live, work, and play.
Common Questions
What is Per Capita Income in Carencro?
Per Capita income in Carencro is $29,513.
What is the Median Family Income in Carencro?
Median Family Income in Carencro is $67,626.
What is the Median Household income in Carencro?
Median Household Income in Carencro is $56,352.
What is Income or Wage Gap in Carencro?
Income or Wage Gap in Carencro is 52.2%.
Women in Carencro earn 47.8 cents for every dollar earned by a man.
What is Inequality or Gini Index in Carencro?
Inequality or Gini Index in Carencro is 0.42.
What is the Total Population of Carencro?
Total Population of Carencro is 10,194.
What is the Total Male Population of Carencro?
Total Male Population of Carencro is 4,943.
What is the Total Female Population of Carencro?
Total Female Population of Carencro is 5,251.
What is the Ratio of Males per 100 Females in Carencro?
There are 94.13 Males per 100 Females in Carencro.
What is the Ratio of Females per 100 Males in Carencro?
There are 106.23 Females per 100 Males in Carencro.
What is the Median Population Age in Carencro?
Median Population Age in Carencro is 33.3 Years.
What is the Average Family Size in Carencro
Average Family Size in Carencro is 3.3 People.
What is the Average Household Size in Carencro
Average Household Size in Carencro is 2.4 People.
How Large is the Labor Force in Carencro?
There are 5,086 People in the Labor Forcein in Carencro.
What is the Percentage of People in the Labor Force in Carencro?
66.3% of People are in the Labor Force in Carencro.
What is the Unemployment Rate in Carencro?
Unemployment Rate in Carencro is 2.5%.