Sorrento, LA Map & Demographics
Sorrento Map
Sorrento Overview
$36,715
PER CAPITA INCOME
$118,315
AVG FAMILY INCOME
$94,766
AVG HOUSEHOLD INCOME
42.5%
WAGE / INCOME GAP [ % ]
57.5¢/ $1
WAGE / INCOME GAP [ $ ]
0.35
INEQUALITY / GINI INDEX
1,919
TOTAL POPULATION
964
MALE POPULATION
955
FEMALE POPULATION
100.94
MALES / 100 FEMALES
99.07
FEMALES / 100 MALES
38.9
MEDIAN AGE
3.3
AVG FAMILY SIZE
2.8
AVG HOUSEHOLD SIZE
1,058
LABOR FORCE [ PEOPLE ]
64.6%
PERCENT IN LABOR FORCE
4.1%
UNEMPLOYMENT RATE
Sorrento Zip Codes
Sorrento Area Codes
Income in Sorrento
Income Overview in Sorrento
Per Capita Income in Sorrento is $36,715, while median incomes of families and households are $118,315 and $94,766 respectively.
| Characteristic | Number | Measure |
| Per Capita Income | 1,919 | $36,715 |
| Median Family Income | 499 | $118,315 |
| Mean Family Income | 499 | $106,317 |
| Median Household Income | 691 | $94,766 |
| Mean Household Income | 691 | $92,788 |
| Income Deficit | 499 | $0 |
| Wage / Income Gap (%) | 1,919 | 42.55% |
| Wage / Income Gap ($) | 1,919 | 57.45¢ per $1 |
| Gini / Inequality Index | 1,919 | 0.35 |
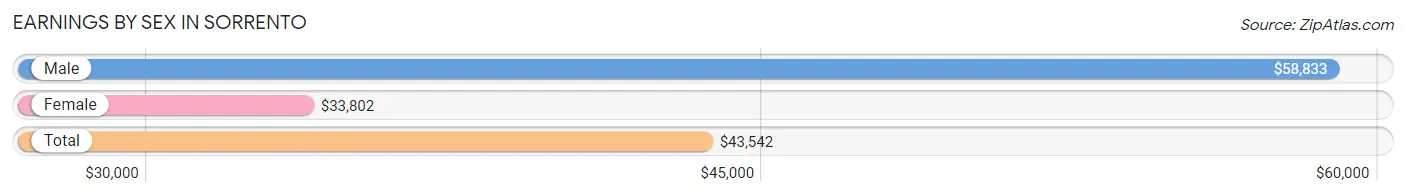
Earnings by Sex in Sorrento
Average Earnings in Sorrento are $43,542, $58,833 for men and $33,802 for women, a difference of 42.5%.
| Sex | Number | Average Earnings |
| Male | 600 (56.8%) | $58,833 |
| Female | 456 (43.2%) | $33,802 |
| Total | 1,056 (100.0%) | $43,542 |
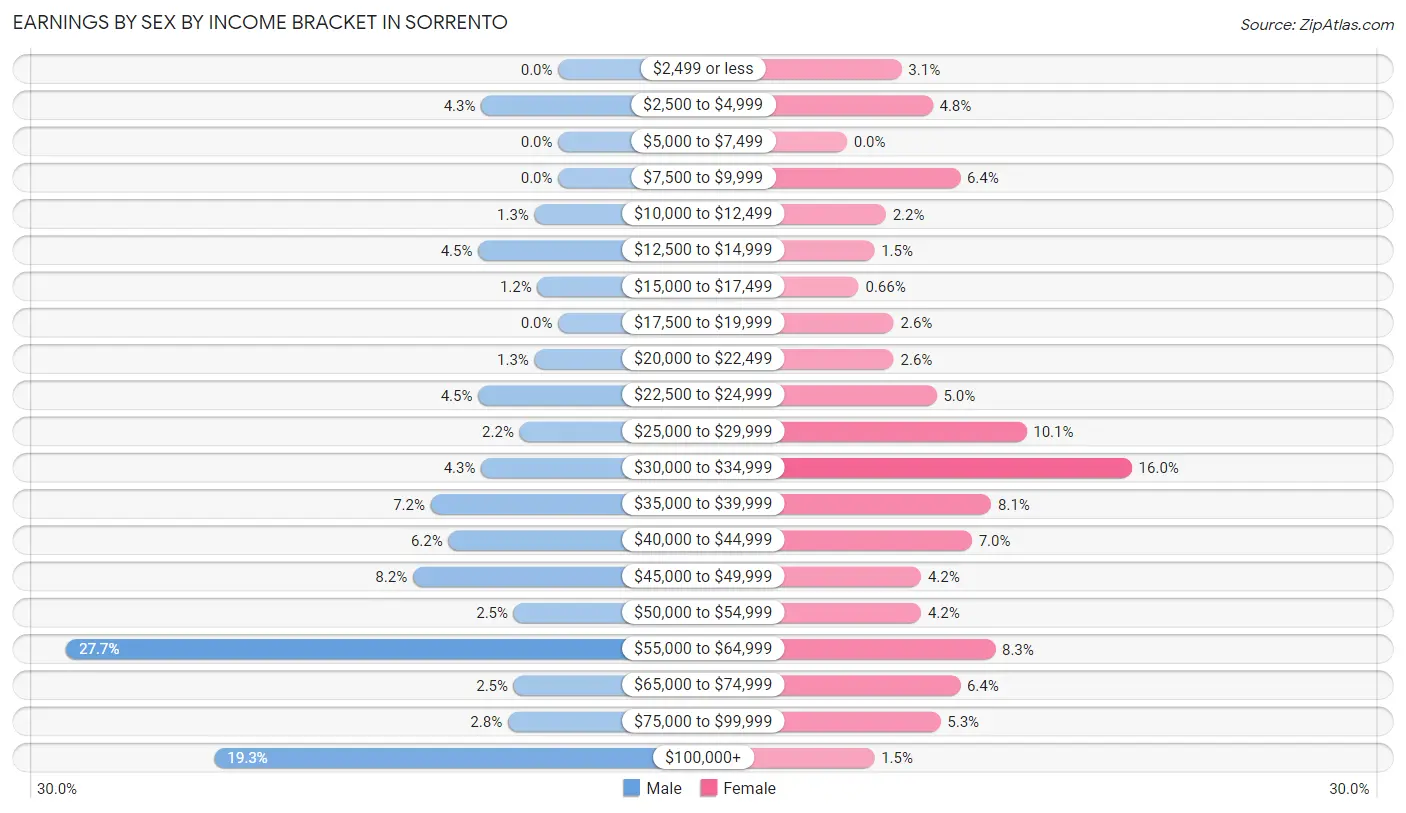
Earnings by Sex by Income Bracket in Sorrento
The most common earnings brackets in Sorrento are $55,000 to $64,999 for men (166 | 27.7%) and $30,000 to $34,999 for women (73 | 16.0%).
| Income | Male | Female |
| $2,499 or less | 0 (0.0%) | 14 (3.1%) |
| $2,500 to $4,999 | 26 (4.3%) | 22 (4.8%) |
| $5,000 to $7,499 | 0 (0.0%) | 0 (0.0%) |
| $7,500 to $9,999 | 0 (0.0%) | 29 (6.4%) |
| $10,000 to $12,499 | 8 (1.3%) | 10 (2.2%) |
| $12,500 to $14,999 | 27 (4.5%) | 7 (1.5%) |
| $15,000 to $17,499 | 7 (1.2%) | 3 (0.7%) |
| $17,500 to $19,999 | 0 (0.0%) | 12 (2.6%) |
| $20,000 to $22,499 | 8 (1.3%) | 12 (2.6%) |
| $22,500 to $24,999 | 27 (4.5%) | 23 (5.0%) |
| $25,000 to $29,999 | 13 (2.2%) | 46 (10.1%) |
| $30,000 to $34,999 | 26 (4.3%) | 73 (16.0%) |
| $35,000 to $39,999 | 43 (7.2%) | 37 (8.1%) |
| $40,000 to $44,999 | 37 (6.2%) | 32 (7.0%) |
| $45,000 to $49,999 | 49 (8.2%) | 19 (4.2%) |
| $50,000 to $54,999 | 15 (2.5%) | 19 (4.2%) |
| $55,000 to $64,999 | 166 (27.7%) | 38 (8.3%) |
| $65,000 to $74,999 | 15 (2.5%) | 29 (6.4%) |
| $75,000 to $99,999 | 17 (2.8%) | 24 (5.3%) |
| $100,000+ | 116 (19.3%) | 7 (1.5%) |
| Total | 600 (100.0%) | 456 (100.0%) |
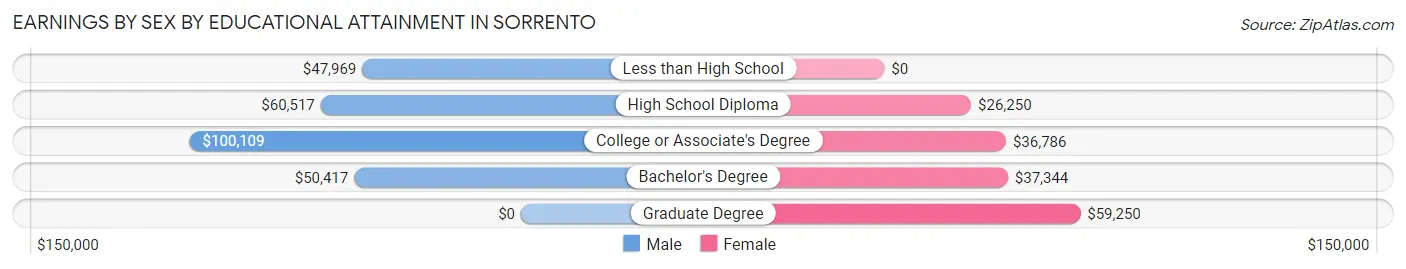
Earnings by Sex by Educational Attainment in Sorrento
Average earnings in Sorrento are $60,293 for men and $36,149 for women, a difference of 40.0%. Men with an educational attainment of college or associate's degree enjoy the highest average annual earnings of $100,109, while those with less than high school education earn the least with $47,969. Women with an educational attainment of graduate degree earn the most with the average annual earnings of $59,250, while those with high school diploma education have the smallest earnings of $26,250.
| Educational Attainment | Male Income | Female Income |
| Less than High School | $47,969 | $0 |
| High School Diploma | $60,517 | $26,250 |
| College or Associate's Degree | $100,109 | $36,786 |
| Bachelor's Degree | $50,417 | $37,344 |
| Graduate Degree | - | - |
| Total | $60,293 | $36,149 |
Family Income in Sorrento
Family Income Brackets in Sorrento
According to the Sorrento family income data, there are 213 families falling into the $100,000 to $149,999 income range, which is the most common income bracket and makes up 42.7% of all families.
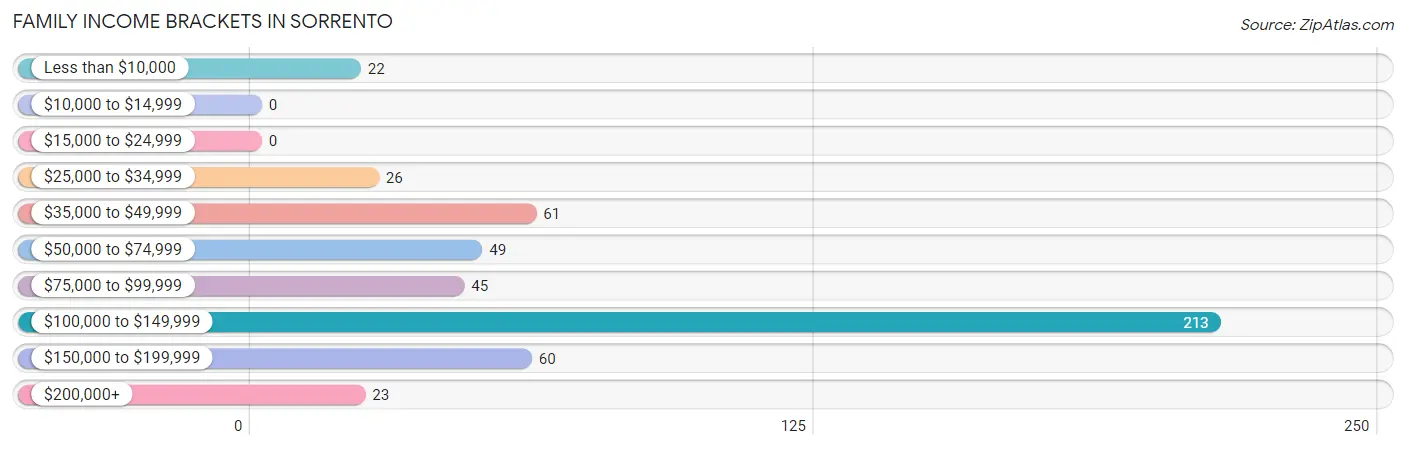
| Income Bracket | # Families | % Families |
| Less than $10,000 | 22 | 4.4% |
| $10,000 to $14,999 | 0 | 0.0% |
| $15,000 to $24,999 | 0 | 0.0% |
| $25,000 to $34,999 | 26 | 5.2% |
| $35,000 to $49,999 | 61 | 12.2% |
| $50,000 to $74,999 | 49 | 9.8% |
| $75,000 to $99,999 | 45 | 9.0% |
| $100,000 to $149,999 | 213 | 42.7% |
| $150,000 to $199,999 | 60 | 12.0% |
| $200,000+ | 23 | 4.6% |
Family Income by Famaliy Size in Sorrento
4-person families (77 | 15.4%) account for the highest median family income in Sorrento with $136,620 per family, while 2-person families (163 | 32.7%) have the highest median income of $46,125 per family member.
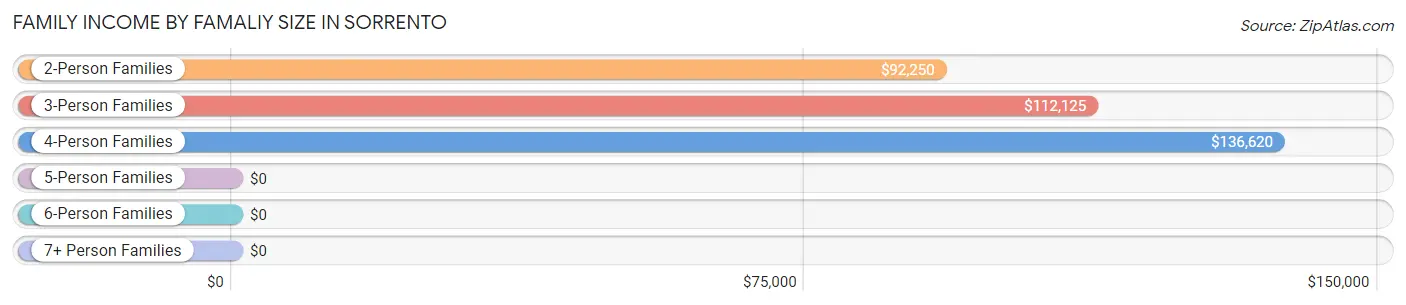
| Income Bracket | # Families | Median Income |
| 2-Person Families | 163 (32.7%) | $92,250 |
| 3-Person Families | 209 (41.9%) | $112,125 |
| 4-Person Families | 77 (15.4%) | $136,620 |
| 5-Person Families | 50 (10.0%) | $0 |
| 6-Person Families | 0 (0.0%) | $0 |
| 7+ Person Families | 0 (0.0%) | $0 |
| Total | 499 (100.0%) | $118,315 |
Family Income by Number of Earners in Sorrento
The median family income in Sorrento is $118,315, with families comprising 1 earner (158) having the highest median family income of $128,770, while families with no earners (67) have the lowest median family income of $42,961, accounting for 31.7% and 13.4% of families, respectively.
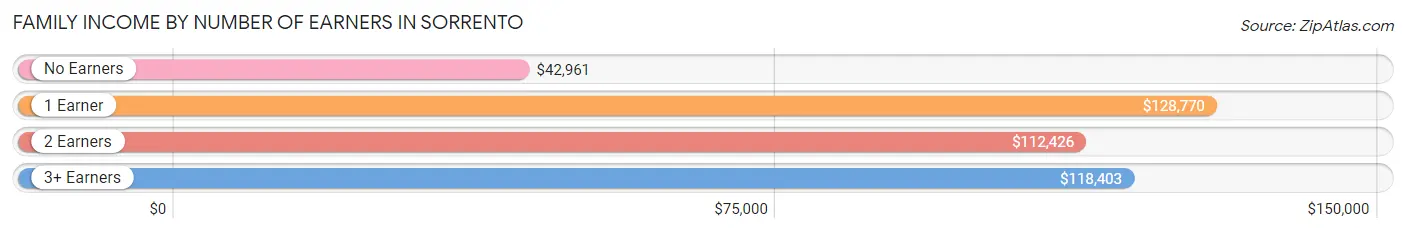
| Number of Earners | # Families | Median Income |
| No Earners | 67 (13.4%) | $42,961 |
| 1 Earner | 158 (31.7%) | $128,770 |
| 2 Earners | 219 (43.9%) | $112,426 |
| 3+ Earners | 55 (11.0%) | $118,403 |
| Total | 499 (100.0%) | $118,315 |
Household Income in Sorrento
Household Income Brackets in Sorrento
With 225 households falling in the category, the $100,000 to $149,999 income range is the most frequent in Sorrento, accounting for 32.6% of all households. In contrast, only 1 households (0.1%) fall into the $15,000 to $24,999 income bracket, making it the least populous group.
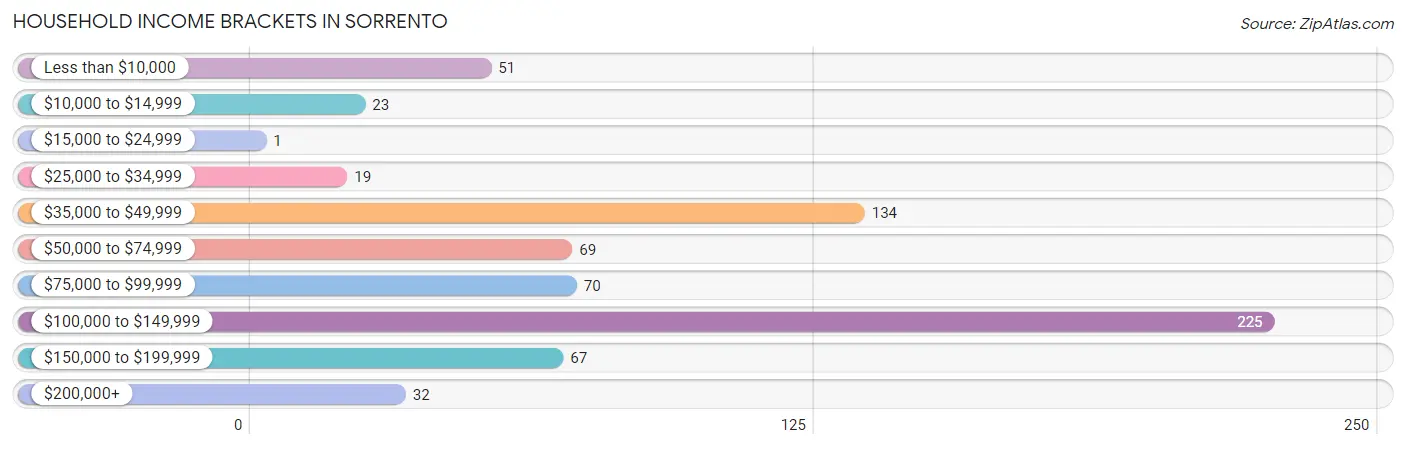
| Income Bracket | # Households | % Households |
| Less than $10,000 | 51 | 7.4% |
| $10,000 to $14,999 | 23 | 3.3% |
| $15,000 to $24,999 | 1 | 0.1% |
| $25,000 to $34,999 | 19 | 2.7% |
| $35,000 to $49,999 | 134 | 19.4% |
| $50,000 to $74,999 | 69 | 10.0% |
| $75,000 to $99,999 | 70 | 10.1% |
| $100,000 to $149,999 | 225 | 32.6% |
| $150,000 to $199,999 | 67 | 9.7% |
| $200,000+ | 32 | 4.6% |
Household Income by Householder Age in Sorrento
The median household income in Sorrento is $94,766, with the highest median household income of $119,375 found in the 25 to 44 years age bracket for the primary householder. A total of 251 households (36.3%) fall into this category. Meanwhile, the 65+ years age bracket for the primary householder has the lowest median household income of $0, with 164 households (23.7%) in this group.
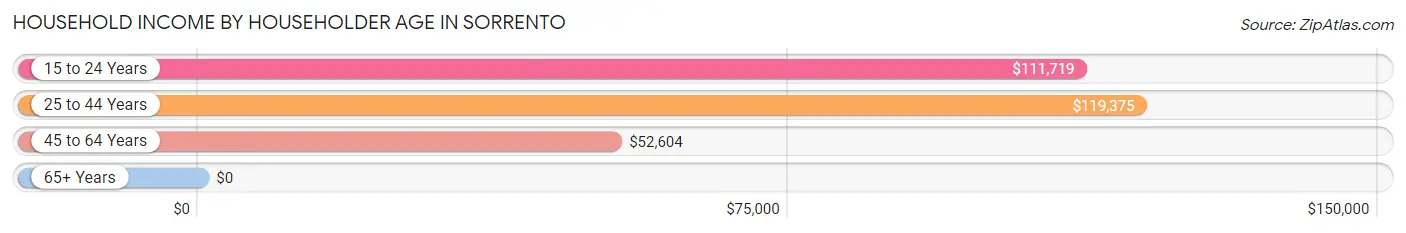
| Income Bracket | # Households | Median Income |
| 15 to 24 Years | 33 (4.8%) | $111,719 |
| 25 to 44 Years | 251 (36.3%) | $119,375 |
| 45 to 64 Years | 243 (35.2%) | $52,604 |
| 65+ Years | 164 (23.7%) | $0 |
| Total | 691 (100.0%) | $94,766 |
Poverty in Sorrento
Income Below Poverty by Sex and Age in Sorrento
With 10.5% poverty level for males and 8.4% for females among the residents of Sorrento, 16 and 17 year old males and 45 to 54 year old females are the most vulnerable to poverty, with 31 males (51.7%) and 33 females (28.7%) in their respective age groups living below the poverty level.
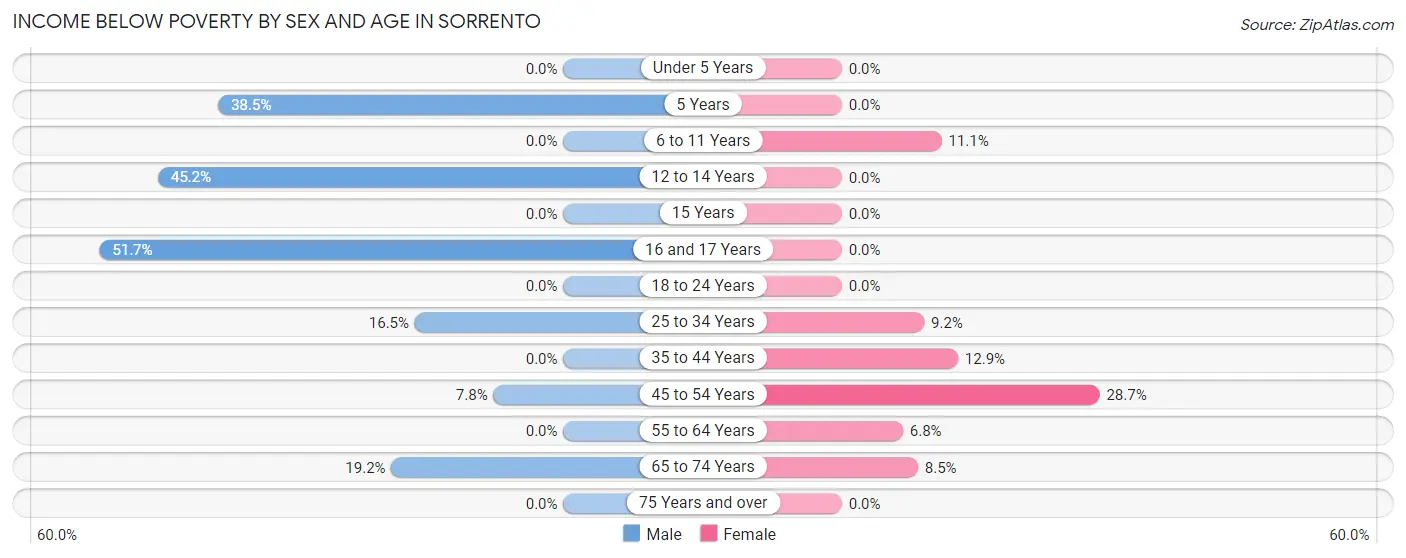
| Age Bracket | Male | Female |
| Under 5 Years | 0 (0.0%) | 0 (0.0%) |
| 5 Years | 5 (38.5%) | 0 (0.0%) |
| 6 to 11 Years | 0 (0.0%) | 4 (11.1%) |
| 12 to 14 Years | 28 (45.2%) | 0 (0.0%) |
| 15 Years | 0 (0.0%) | 0 (0.0%) |
| 16 and 17 Years | 31 (51.7%) | 0 (0.0%) |
| 18 to 24 Years | 0 (0.0%) | 0 (0.0%) |
| 25 to 34 Years | 21 (16.5%) | 11 (9.2%) |
| 35 to 44 Years | 0 (0.0%) | 15 (12.9%) |
| 45 to 54 Years | 7 (7.8%) | 33 (28.7%) |
| 55 to 64 Years | 0 (0.0%) | 7 (6.8%) |
| 65 to 74 Years | 9 (19.2%) | 10 (8.5%) |
| 75 Years and over | 0 (0.0%) | 0 (0.0%) |
| Total | 101 (10.5%) | 80 (8.4%) |
Income Above Poverty by Sex and Age in Sorrento
According to the poverty statistics in Sorrento, males aged under 5 years and females aged under 5 years are the age groups that are most secure financially, with 100.0% of males and 100.0% of females in these age groups living above the poverty line.
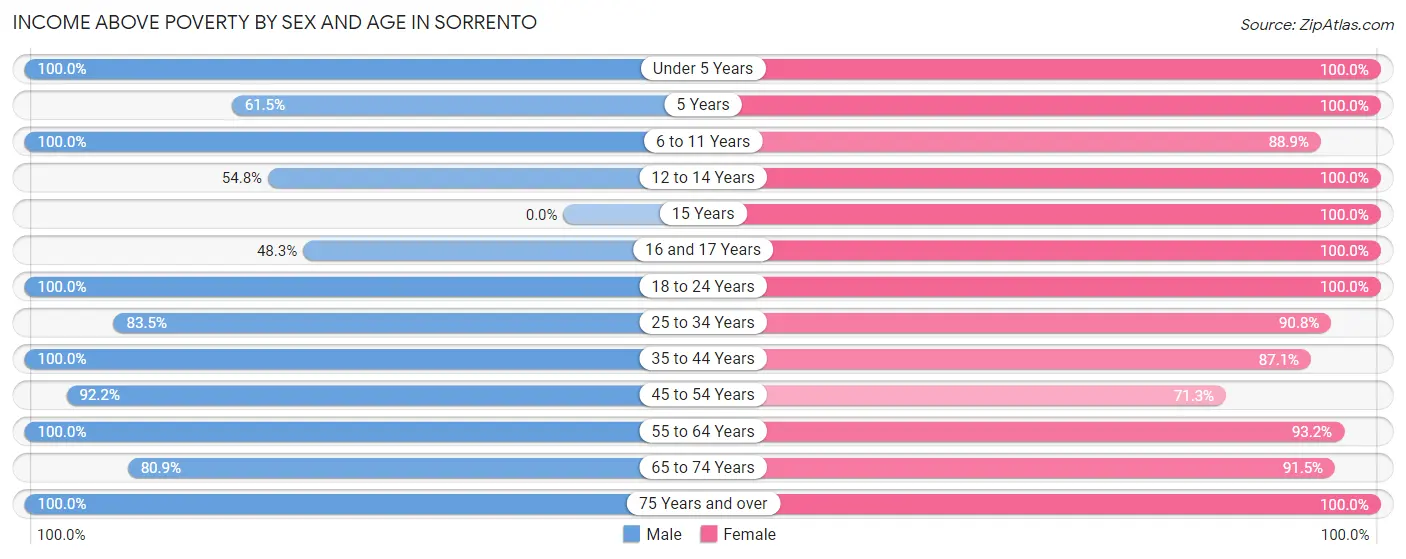
| Age Bracket | Male | Female |
| Under 5 Years | 45 (100.0%) | 25 (100.0%) |
| 5 Years | 8 (61.5%) | 10 (100.0%) |
| 6 to 11 Years | 70 (100.0%) | 32 (88.9%) |
| 12 to 14 Years | 34 (54.8%) | 16 (100.0%) |
| 15 Years | 0 (0.0%) | 5 (100.0%) |
| 16 and 17 Years | 29 (48.3%) | 8 (100.0%) |
| 18 to 24 Years | 70 (100.0%) | 160 (100.0%) |
| 25 to 34 Years | 106 (83.5%) | 109 (90.8%) |
| 35 to 44 Years | 102 (100.0%) | 101 (87.1%) |
| 45 to 54 Years | 83 (92.2%) | 82 (71.3%) |
| 55 to 64 Years | 264 (100.0%) | 96 (93.2%) |
| 65 to 74 Years | 38 (80.8%) | 108 (91.5%) |
| 75 Years and over | 14 (100.0%) | 123 (100.0%) |
| Total | 863 (89.5%) | 875 (91.6%) |
Income Below Poverty Among Married-Couple Families in Sorrento
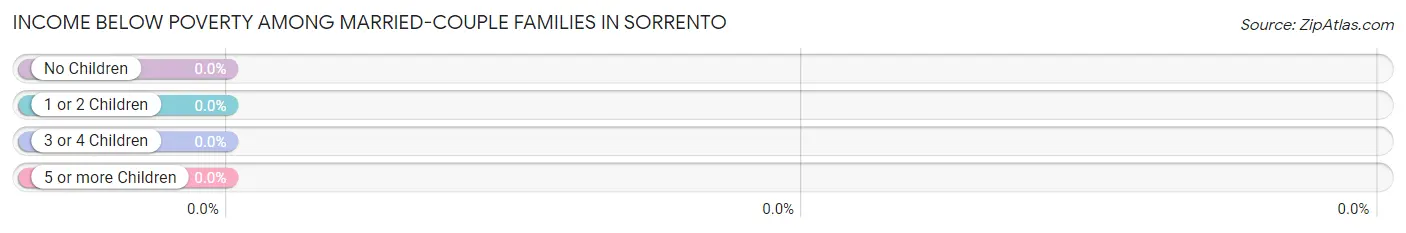
| Children | Above Poverty | Below Poverty |
| No Children | 243 (100.0%) | 0 (0.0%) |
| 1 or 2 Children | 112 (100.0%) | 0 (0.0%) |
| 3 or 4 Children | 32 (100.0%) | 0 (0.0%) |
| 5 or more Children | 0 (0.0%) | 0 (0.0%) |
| Total | 387 (100.0%) | 0 (0.0%) |
Income Below Poverty Among Single-Parent Households in Sorrento
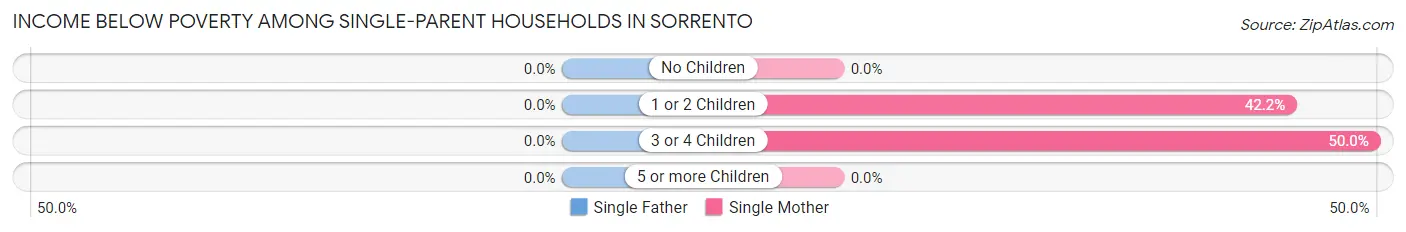
| Children | Single Father | Single Mother |
| No Children | 0 (0.0%) | 0 (0.0%) |
| 1 or 2 Children | 0 (0.0%) | 19 (42.2%) |
| 3 or 4 Children | 0 (0.0%) | 3 (50.0%) |
| 5 or more Children | 0 (0.0%) | 0 (0.0%) |
| Total | 0 (0.0%) | 22 (23.7%) |
Income Below Poverty Among Married-Couple vs Single-Parent Households in Sorrento
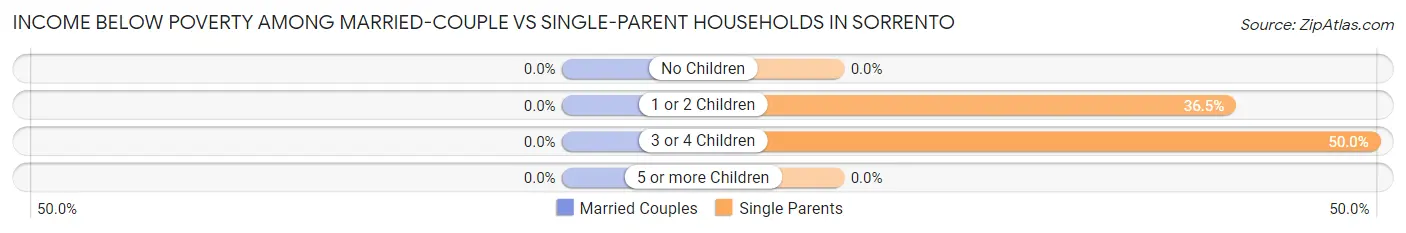
| Children | Married-Couple Families | Single-Parent Households |
| No Children | 0 (0.0%) | 0 (0.0%) |
| 1 or 2 Children | 0 (0.0%) | 19 (36.5%) |
| 3 or 4 Children | 0 (0.0%) | 3 (50.0%) |
| 5 or more Children | 0 (0.0%) | 0 (0.0%) |
| Total | 0 (0.0%) | 22 (19.6%) |
Race in Sorrento
The most populous races in Sorrento are White / Caucasian (1,487 | 77.5%), Black / African American (277 | 14.4%), and Two or more Races (140 | 7.3%).
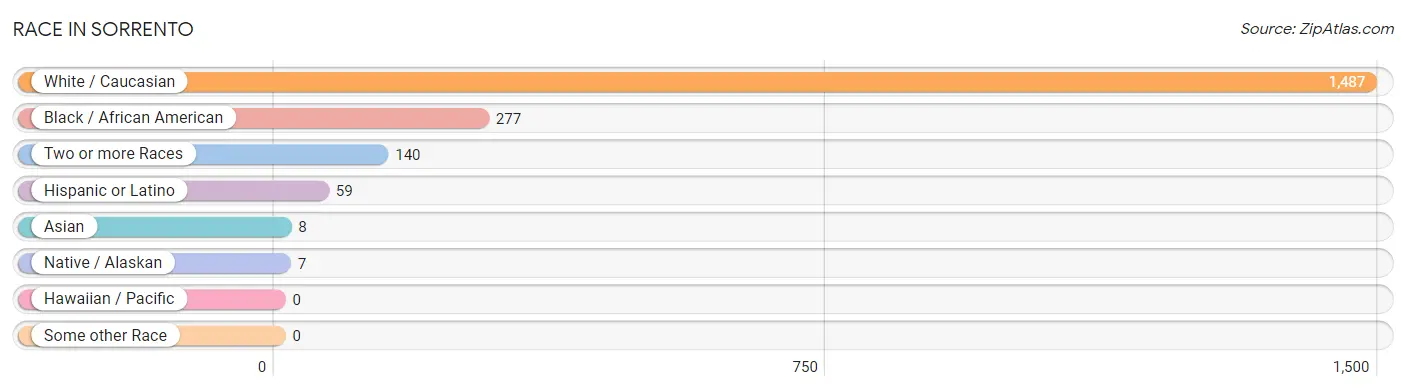
| Race | # Population | % Population |
| Asian | 8 | 0.4% |
| Black / African American | 277 | 14.4% |
| Hawaiian / Pacific | 0 | 0.0% |
| Hispanic or Latino | 59 | 3.1% |
| Native / Alaskan | 7 | 0.4% |
| White / Caucasian | 1,487 | 77.5% |
| Two or more Races | 140 | 7.3% |
| Some other Race | 0 | 0.0% |
| Total | 1,919 | 100.0% |
Ancestry in Sorrento
The most populous ancestries reported in Sorrento are French (396 | 20.6%), American (234 | 12.2%), French Canadian (184 | 9.6%), Scotch-Irish (158 | 8.2%), and Italian (91 | 4.7%), together accounting for 55.4% of all Sorrento residents.
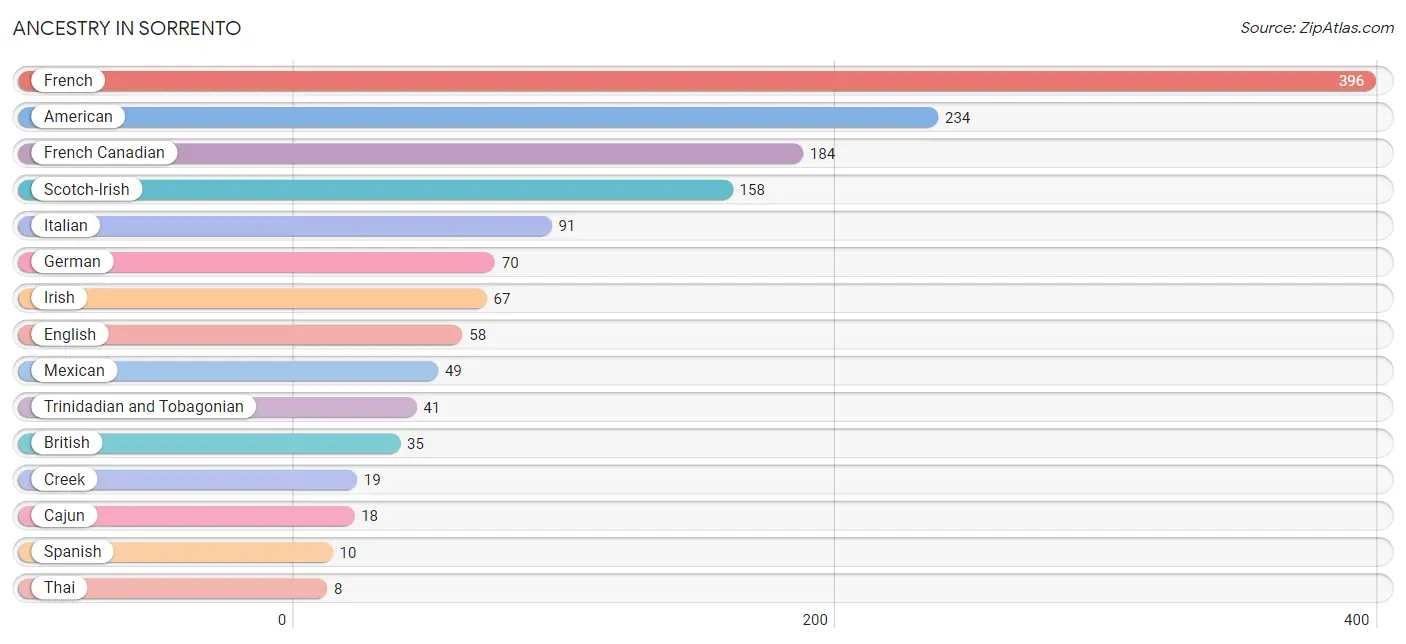
| Ancestry | # Population | % Population |
| American | 234 | 12.2% |
| British | 35 | 1.8% |
| Cajun | 18 | 0.9% |
| Creek | 19 | 1.0% |
| Dutch | 3 | 0.2% |
| English | 58 | 3.0% |
| European | 5 | 0.3% |
| French | 396 | 20.6% |
| French Canadian | 184 | 9.6% |
| German | 70 | 3.6% |
| Hungarian | 4 | 0.2% |
| Irish | 67 | 3.5% |
| Italian | 91 | 4.7% |
| Mexican | 49 | 2.5% |
| Navajo | 2 | 0.1% |
| Scotch-Irish | 158 | 8.2% |
| Spanish | 10 | 0.5% |
| Thai | 8 | 0.4% |
| Trinidadian and Tobagonian | 41 | 2.1% | View All 19 Rows |
Immigrants in Sorrento
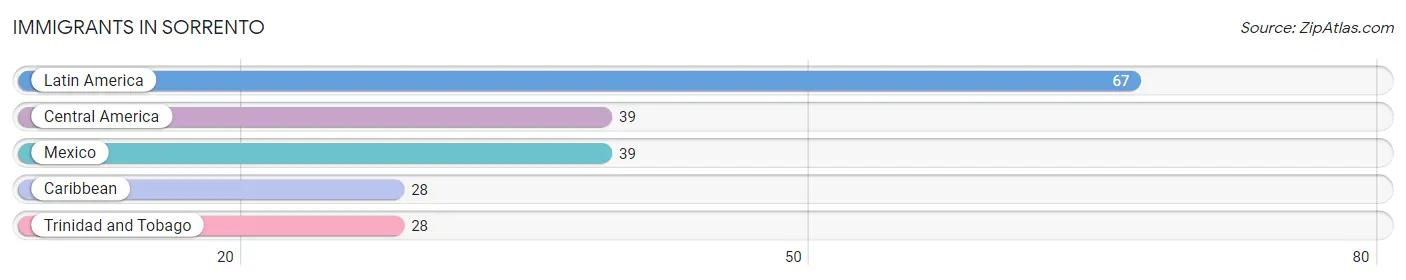
The most numerous immigrant groups reported in Sorrento came from Latin America (67 | 3.5%), Central America (39 | 2.0%), Mexico (39 | 2.0%), Caribbean (28 | 1.5%), and Trinidad and Tobago (28 | 1.5%), together accounting for 10.5% of all Sorrento residents.
| Immigration Origin | # Population | % Population |
| Caribbean | 28 | 1.5% |
| Central America | 39 | 2.0% |
| Latin America | 67 | 3.5% |
| Mexico | 39 | 2.0% |
| Trinidad and Tobago | 28 | 1.5% | View All 5 Rows |
Sex and Age in Sorrento
Sex and Age in Sorrento
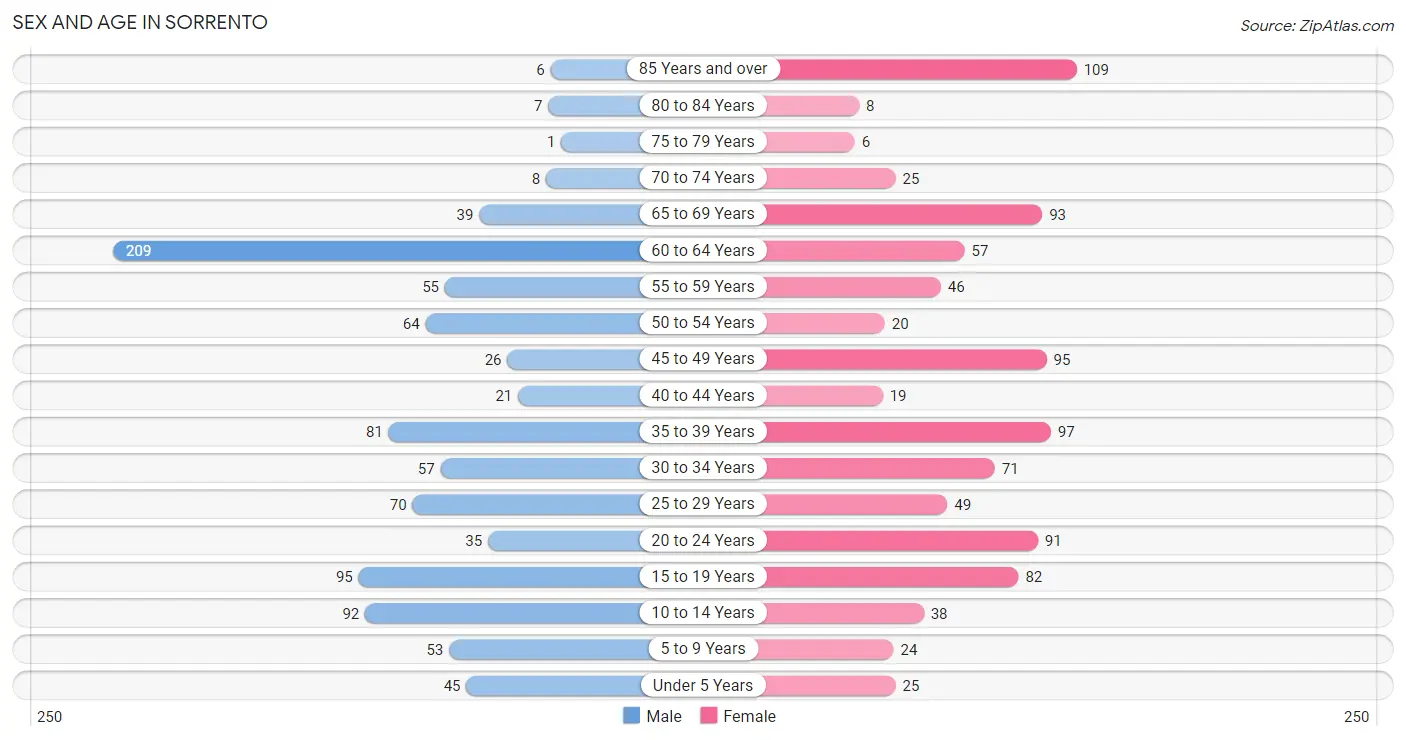
The most populous age groups in Sorrento are 60 to 64 Years (209 | 21.7%) for men and 85 Years and over (109 | 11.4%) for women.
| Age Bracket | Male | Female |
| Under 5 Years | 45 (4.7%) | 25 (2.6%) |
| 5 to 9 Years | 53 (5.5%) | 24 (2.5%) |
| 10 to 14 Years | 92 (9.5%) | 38 (4.0%) |
| 15 to 19 Years | 95 (9.9%) | 82 (8.6%) |
| 20 to 24 Years | 35 (3.6%) | 91 (9.5%) |
| 25 to 29 Years | 70 (7.3%) | 49 (5.1%) |
| 30 to 34 Years | 57 (5.9%) | 71 (7.4%) |
| 35 to 39 Years | 81 (8.4%) | 97 (10.2%) |
| 40 to 44 Years | 21 (2.2%) | 19 (2.0%) |
| 45 to 49 Years | 26 (2.7%) | 95 (10.0%) |
| 50 to 54 Years | 64 (6.6%) | 20 (2.1%) |
| 55 to 59 Years | 55 (5.7%) | 46 (4.8%) |
| 60 to 64 Years | 209 (21.7%) | 57 (6.0%) |
| 65 to 69 Years | 39 (4.1%) | 93 (9.7%) |
| 70 to 74 Years | 8 (0.8%) | 25 (2.6%) |
| 75 to 79 Years | 1 (0.1%) | 6 (0.6%) |
| 80 to 84 Years | 7 (0.7%) | 8 (0.8%) |
| 85 Years and over | 6 (0.6%) | 109 (11.4%) |
| Total | 964 (100.0%) | 955 (100.0%) |
Families and Households in Sorrento
Median Family Size in Sorrento
The median family size in Sorrento is 3.30 persons per family, with married-couple families (387 | 77.6%) accounting for the largest median family size of 3.34 persons per family. On the other hand, single male/father families (19 | 3.8%) represent the smallest median family size with 2.68 persons per family.
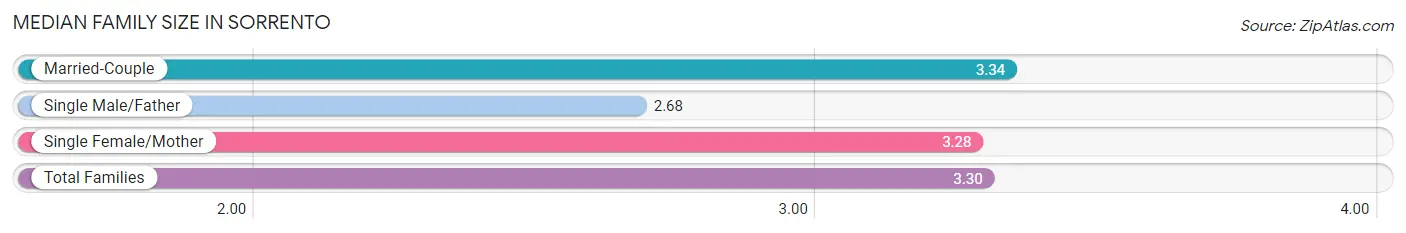
| Family Type | # Families | Family Size |
| Married-Couple | 387 (77.6%) | 3.34 |
| Single Male/Father | 19 (3.8%) | 2.68 |
| Single Female/Mother | 93 (18.6%) | 3.28 |
| Total Families | 499 (100.0%) | 3.30 |
Median Household Size in Sorrento
The median household size in Sorrento is 2.78 persons per household, with single female/mother households (93 | 13.5%) accounting for the largest median household size of 3.51 persons per household. non-family households (192 | 27.8%) represent the smallest median household size with 1.25 persons per household.
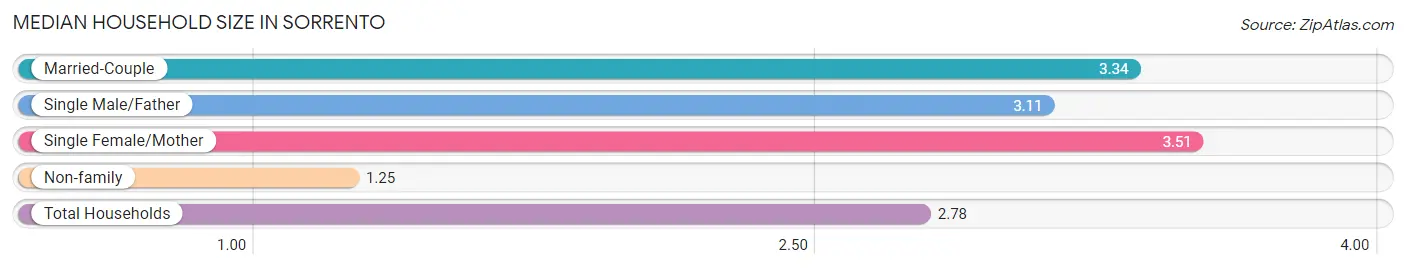
| Household Type | # Households | Household Size |
| Married-Couple | 387 (56.0%) | 3.34 |
| Single Male/Father | 19 (2.8%) | 3.11 |
| Single Female/Mother | 93 (13.5%) | 3.51 |
| Non-family | 192 (27.8%) | 1.25 |
| Total Households | 691 (100.0%) | 2.78 |
Household Size by Marriage Status in Sorrento
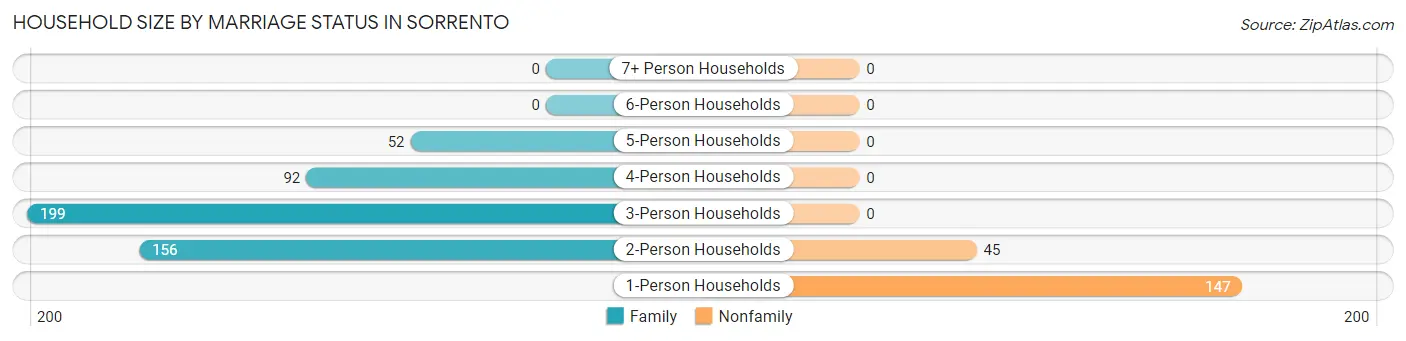
Out of a total of 691 households in Sorrento, 499 (72.2%) are family households, while 192 (27.8%) are nonfamily households. The most numerous type of family households are 3-person households, comprising 199, and the most common type of nonfamily households are 1-person households, comprising 147.
| Household Size | Family Households | Nonfamily Households |
| 1-Person Households | - | 147 (21.3%) |
| 2-Person Households | 156 (22.6%) | 45 (6.5%) |
| 3-Person Households | 199 (28.8%) | 0 (0.0%) |
| 4-Person Households | 92 (13.3%) | 0 (0.0%) |
| 5-Person Households | 52 (7.5%) | 0 (0.0%) |
| 6-Person Households | 0 (0.0%) | 0 (0.0%) |
| 7+ Person Households | 0 (0.0%) | 0 (0.0%) |
| Total | 499 (72.2%) | 192 (27.8%) |
Female Fertility in Sorrento
Fertility by Age in Sorrento
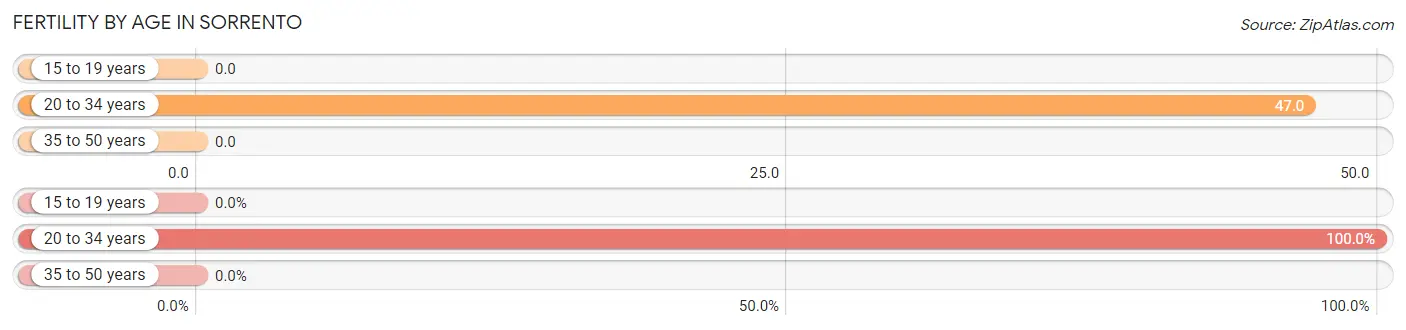
Average fertility rate in Sorrento is 20.0 births per 1,000 women. Women in the age bracket of 20 to 34 years have the highest fertility rate with 47.0 births per 1,000 women. Women in the age bracket of 20 to 34 years acount for 100.0% of all women with births.
| Age Bracket | Women with Births | Births / 1,000 Women |
| 15 to 19 years | 0 (0.0%) | 0.0 |
| 20 to 34 years | 10 (100.0%) | 47.0 |
| 35 to 50 years | 0 (0.0%) | 0.0 |
| Total | 10 (100.0%) | 20.0 |
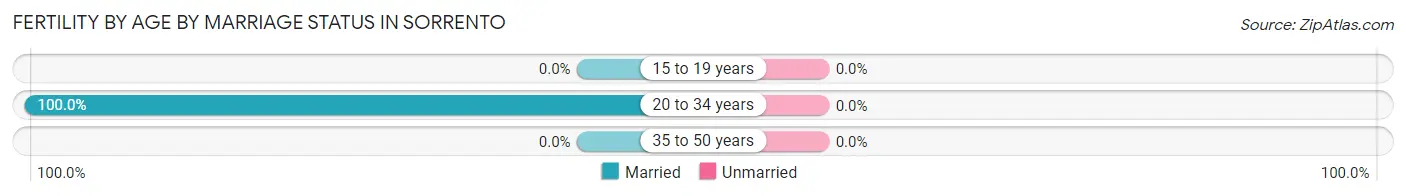
Fertility by Age by Marriage Status in Sorrento
| Age Bracket | Married | Unmarried |
| 15 to 19 years | 0 (0.0%) | 0 (0.0%) |
| 20 to 34 years | 10 (100.0%) | 0 (0.0%) |
| 35 to 50 years | 0 (0.0%) | 0 (0.0%) |
| Total | 10 (100.0%) | 0 (0.0%) |
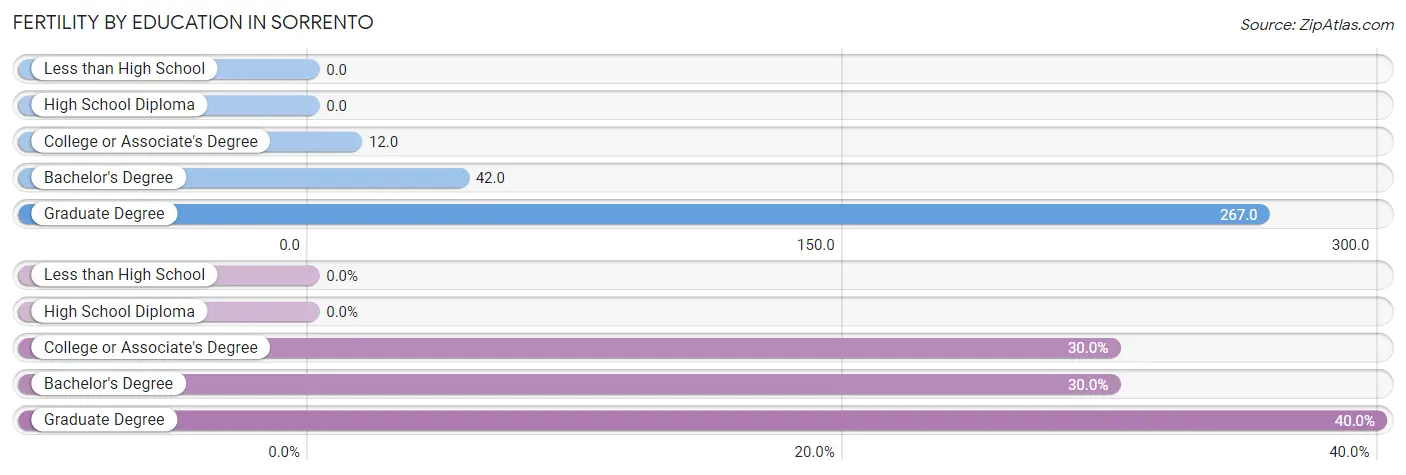
Fertility by Education in Sorrento
| Educational Attainment | Women with Births | Births / 1,000 Women |
| Less than High School | 0 (0.0%) | 0.0 |
| High School Diploma | 0 (0.0%) | 0.0 |
| College or Associate's Degree | 3 (30.0%) | 12.0 |
| Bachelor's Degree | 3 (30.0%) | 42.0 |
| Graduate Degree | 4 (40.0%) | 267.0 |
| Total | 10 (100.0%) | 20.0 |
Fertility by Education by Marriage Status in Sorrento
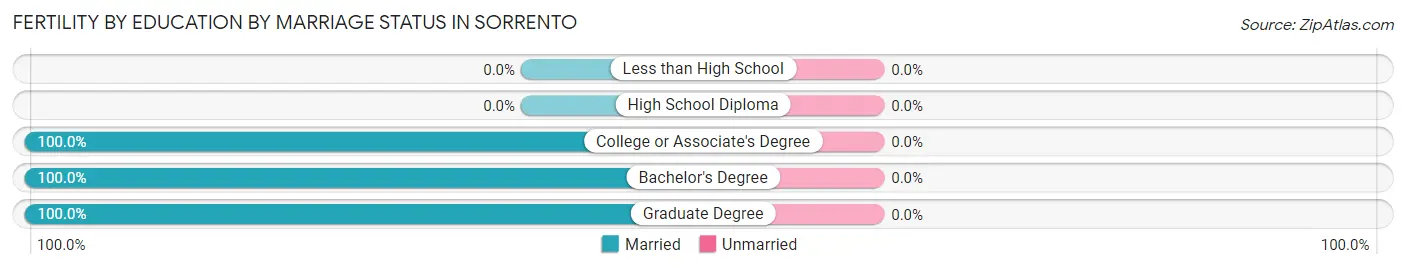
| Educational Attainment | Married | Unmarried |
| Less than High School | 0 (0.0%) | 0 (0.0%) |
| High School Diploma | 0 (0.0%) | 0 (0.0%) |
| College or Associate's Degree | 3 (100.0%) | 0 (0.0%) |
| Bachelor's Degree | 3 (100.0%) | 0 (0.0%) |
| Graduate Degree | 4 (100.0%) | 0 (0.0%) |
| Total | 10 (100.0%) | 0 (0.0%) |
Employment Characteristics in Sorrento
Employment by Class of Employer in Sorrento
Among the 1,015 employed individuals in Sorrento, private company employees (613 | 60.4%), self-employed (not incorporated) (188 | 18.5%), and not-for-profit organizations (78 | 7.7%) make up the most common classes of employment.
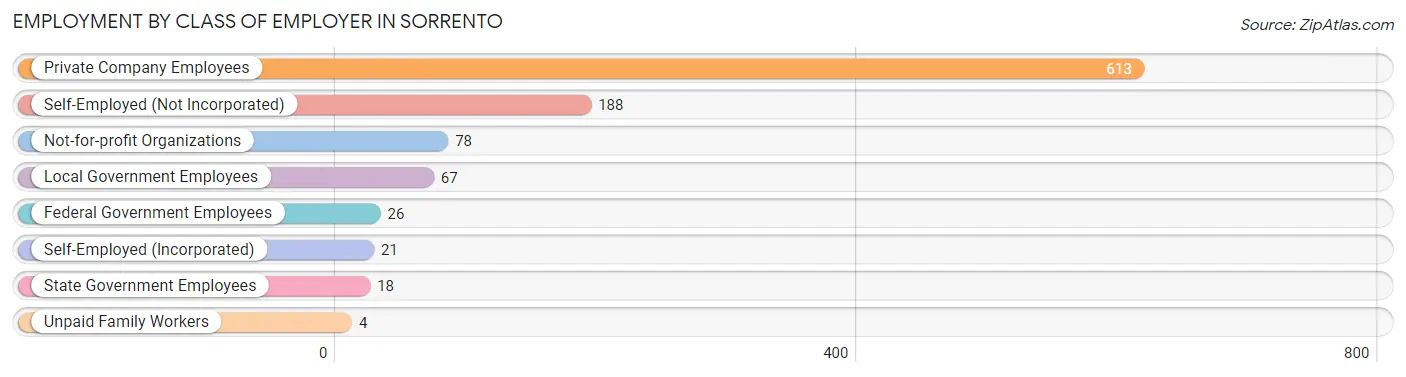
| Employer Class | # Employees | % Employees |
| Private Company Employees | 613 | 60.4% |
| Self-Employed (Incorporated) | 21 | 2.1% |
| Self-Employed (Not Incorporated) | 188 | 18.5% |
| Not-for-profit Organizations | 78 | 7.7% |
| Local Government Employees | 67 | 6.6% |
| State Government Employees | 18 | 1.8% |
| Federal Government Employees | 26 | 2.6% |
| Unpaid Family Workers | 4 | 0.4% |
| Total | 1,015 | 100.0% |
Employment Status by Age in Sorrento
According to the labor force statistics for Sorrento, out of the total population over 16 years of age (1,637), 64.6% or 1,058 individuals are in the labor force, with 4.1% or 43 of them unemployed. The age group with the highest labor force participation rate is 20 to 24 years, with 98.4% or 124 individuals in the labor force. Within the labor force, the 65 to 74 years age range has the highest percentage of unemployed individuals, with 14.3% or 2 of them being unemployed.
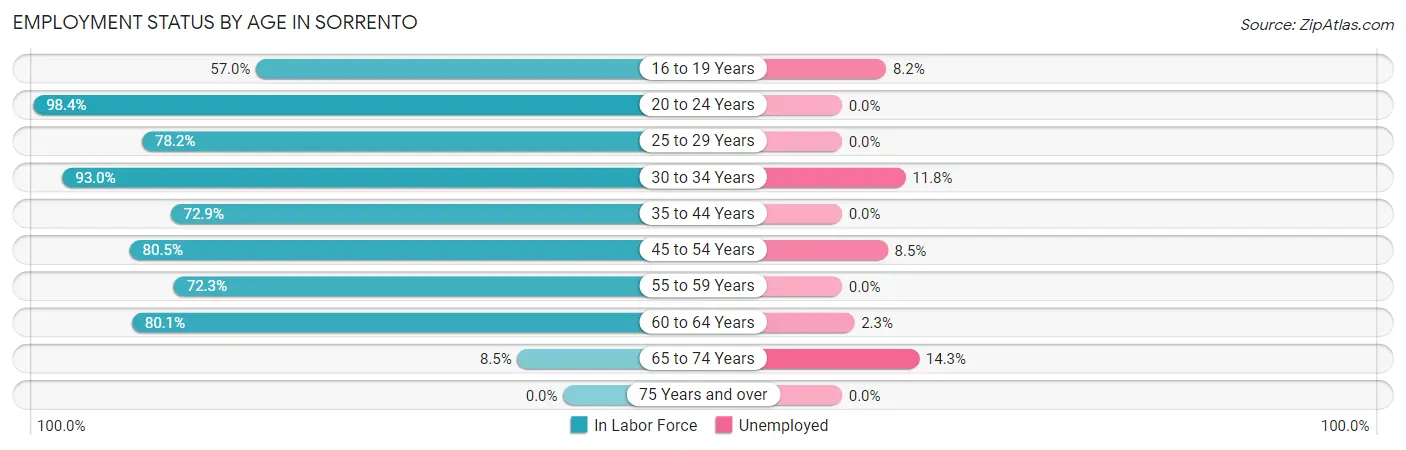
| Age Bracket | In Labor Force | Unemployed |
| 16 to 19 Years | 98 (57.0%) | 8 (8.2%) |
| 20 to 24 Years | 124 (98.4%) | 0 (0.0%) |
| 25 to 29 Years | 93 (78.2%) | 0 (0.0%) |
| 30 to 34 Years | 119 (93.0%) | 14 (11.8%) |
| 35 to 44 Years | 159 (72.9%) | 0 (0.0%) |
| 45 to 54 Years | 165 (80.5%) | 14 (8.5%) |
| 55 to 59 Years | 73 (72.3%) | 0 (0.0%) |
| 60 to 64 Years | 213 (80.1%) | 5 (2.3%) |
| 65 to 74 Years | 14 (8.5%) | 2 (14.3%) |
| 75 Years and over | 0 (0.0%) | 0 (0.0%) |
| Total | 1,058 (64.6%) | 43 (4.1%) |
Employment Status by Educational Attainment in Sorrento
According to labor force statistics for Sorrento, 79.3% of individuals (822) out of the total population between 25 and 64 years of age (1,037) are in the labor force, with 4.0% or 33 of them being unemployed. The group with the highest labor force participation rate are those with the educational attainment of bachelor's degree or higher, with 84.7% or 144 individuals in the labor force. Within the labor force, individuals with college / associate degree education have the highest percentage of unemployment, with 7.5% or 23 of them being unemployed.
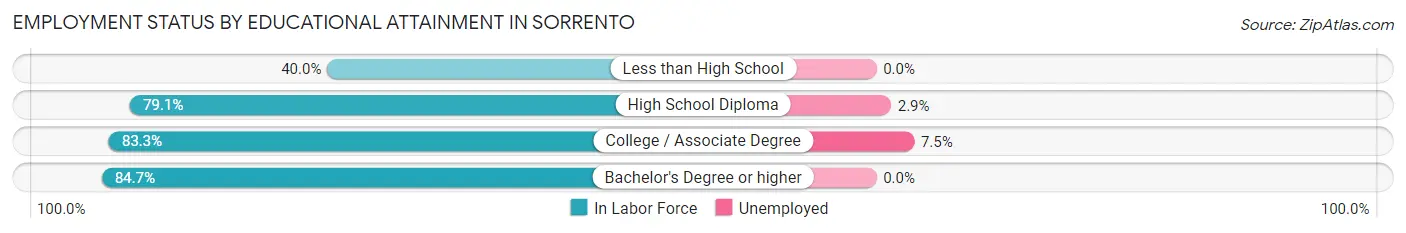
| Educational Attainment | In Labor Force | Unemployed |
| Less than High School | 24 (40.0%) | 0 (0.0%) |
| High School Diploma | 349 (79.1%) | 13 (2.9%) |
| College / Associate Degree | 305 (83.3%) | 27 (7.5%) |
| Bachelor's Degree or higher | 144 (84.7%) | 0 (0.0%) |
| Total | 822 (79.3%) | 41 (4.0%) |
Employment Occupations by Sex in Sorrento
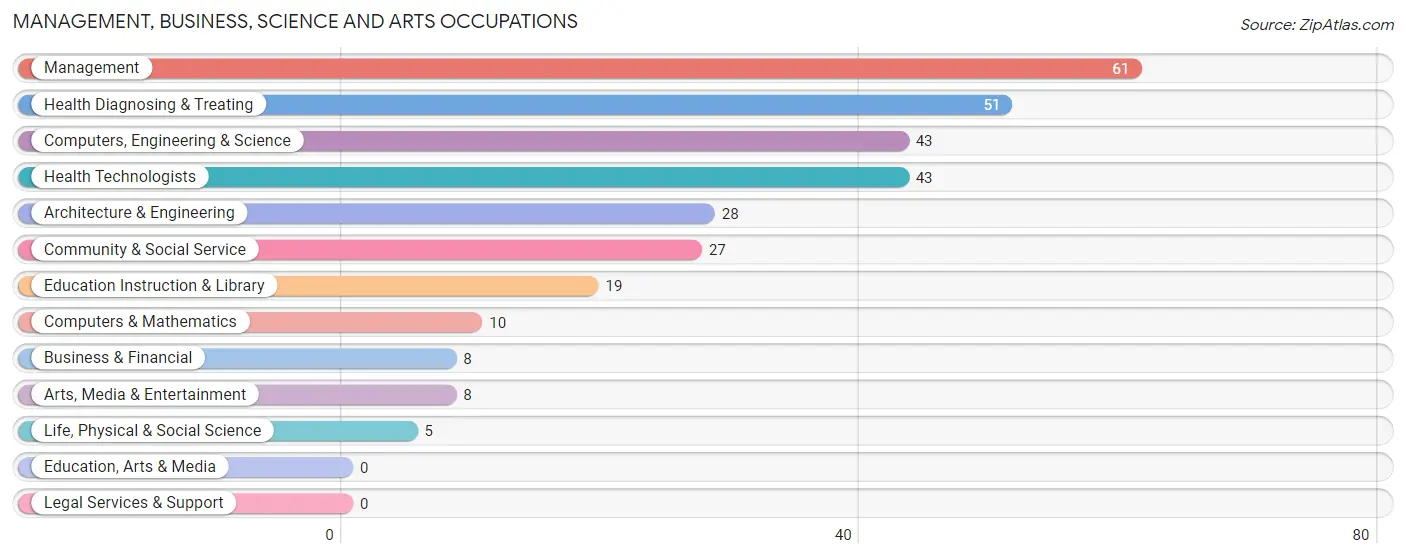
Management, Business, Science and Arts Occupations
The most common Management, Business, Science and Arts occupations in Sorrento are Management (61 | 6.0%), Health Diagnosing & Treating (51 | 5.0%), Computers, Engineering & Science (43 | 4.2%), Health Technologists (43 | 4.2%), and Architecture & Engineering (28 | 2.8%).
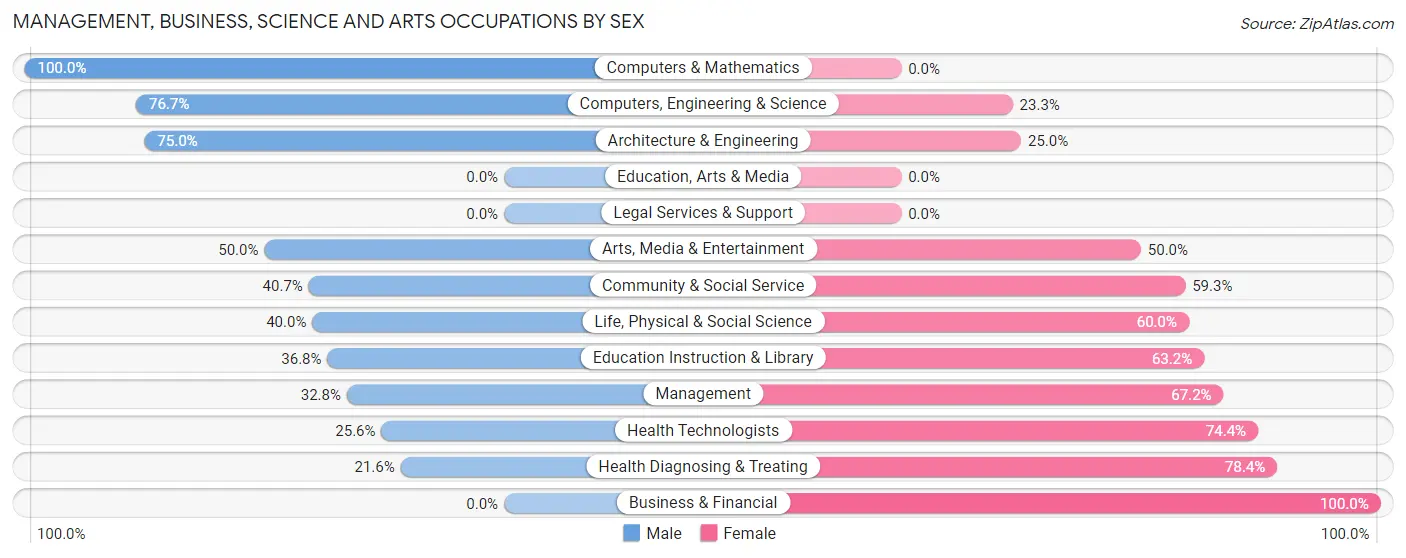
Management, Business, Science and Arts Occupations by Sex
Within the Management, Business, Science and Arts occupations in Sorrento, the most male-oriented occupations are Computers & Mathematics (100.0%), Computers, Engineering & Science (76.7%), and Architecture & Engineering (75.0%), while the most female-oriented occupations are Business & Financial (100.0%), Health Diagnosing & Treating (78.4%), and Health Technologists (74.4%).
| Occupation | Male | Female |
| Management | 20 (32.8%) | 41 (67.2%) |
| Business & Financial | 0 (0.0%) | 8 (100.0%) |
| Computers, Engineering & Science | 33 (76.7%) | 10 (23.3%) |
| Computers & Mathematics | 10 (100.0%) | 0 (0.0%) |
| Architecture & Engineering | 21 (75.0%) | 7 (25.0%) |
| Life, Physical & Social Science | 2 (40.0%) | 3 (60.0%) |
| Community & Social Service | 11 (40.7%) | 16 (59.3%) |
| Education, Arts & Media | 0 (0.0%) | 0 (0.0%) |
| Legal Services & Support | 0 (0.0%) | 0 (0.0%) |
| Education Instruction & Library | 7 (36.8%) | 12 (63.2%) |
| Arts, Media & Entertainment | 4 (50.0%) | 4 (50.0%) |
| Health Diagnosing & Treating | 11 (21.6%) | 40 (78.4%) |
| Health Technologists | 11 (25.6%) | 32 (74.4%) |
| Total (Category) | 75 (39.5%) | 115 (60.5%) |
| Total (Overall) | 582 (57.3%) | 433 (42.7%) |
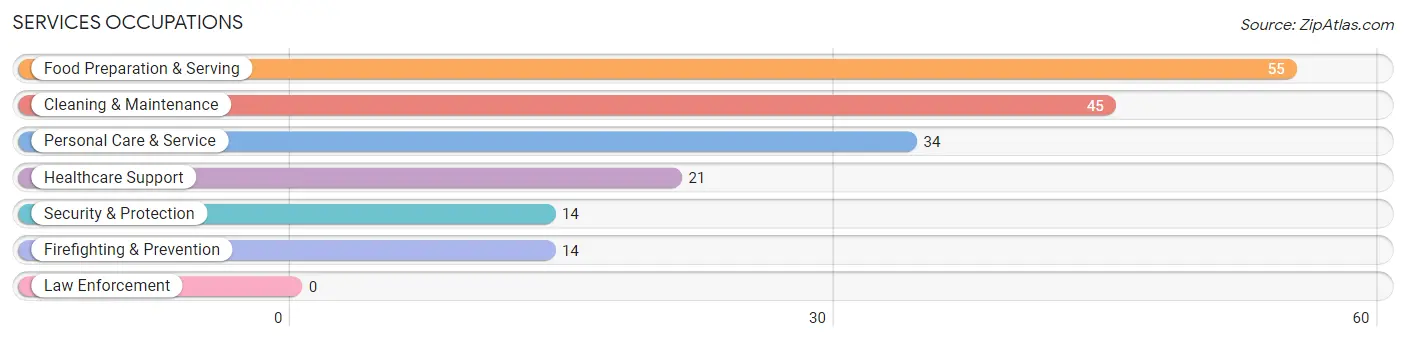
Services Occupations
The most common Services occupations in Sorrento are Food Preparation & Serving (55 | 5.4%), Cleaning & Maintenance (45 | 4.4%), Personal Care & Service (34 | 3.4%), Healthcare Support (21 | 2.1%), and Security & Protection (14 | 1.4%).
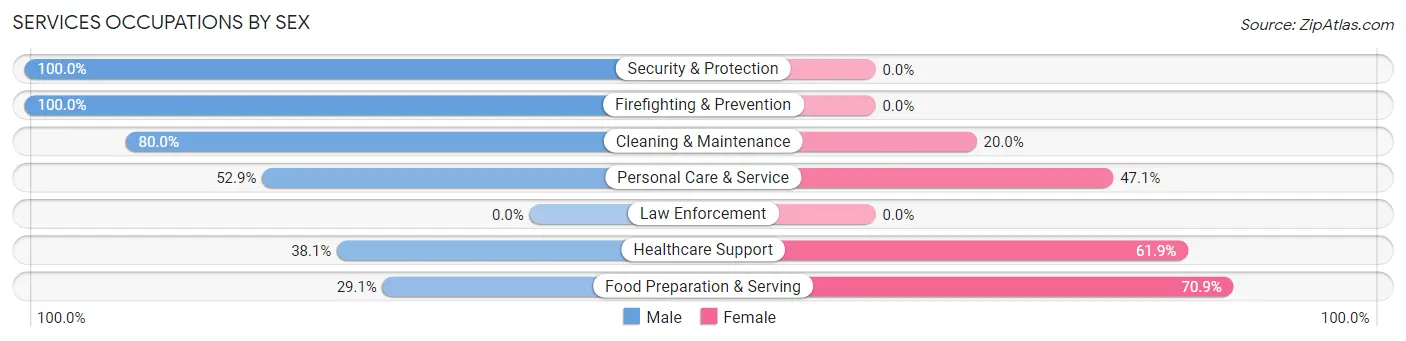
Services Occupations by Sex
Within the Services occupations in Sorrento, the most male-oriented occupations are Security & Protection (100.0%), Firefighting & Prevention (100.0%), and Cleaning & Maintenance (80.0%), while the most female-oriented occupations are Food Preparation & Serving (70.9%), Healthcare Support (61.9%), and Personal Care & Service (47.1%).
| Occupation | Male | Female |
| Healthcare Support | 8 (38.1%) | 13 (61.9%) |
| Security & Protection | 14 (100.0%) | 0 (0.0%) |
| Firefighting & Prevention | 14 (100.0%) | 0 (0.0%) |
| Law Enforcement | 0 (0.0%) | 0 (0.0%) |
| Food Preparation & Serving | 16 (29.1%) | 39 (70.9%) |
| Cleaning & Maintenance | 36 (80.0%) | 9 (20.0%) |
| Personal Care & Service | 18 (52.9%) | 16 (47.1%) |
| Total (Category) | 92 (54.4%) | 77 (45.6%) |
| Total (Overall) | 582 (57.3%) | 433 (42.7%) |
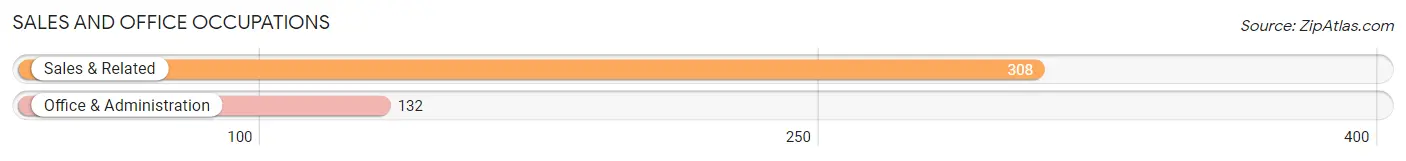
Sales and Office Occupations
The most common Sales and Office occupations in Sorrento are Sales & Related (308 | 30.3%), and Office & Administration (132 | 13.0%).
Sales and Office Occupations by Sex
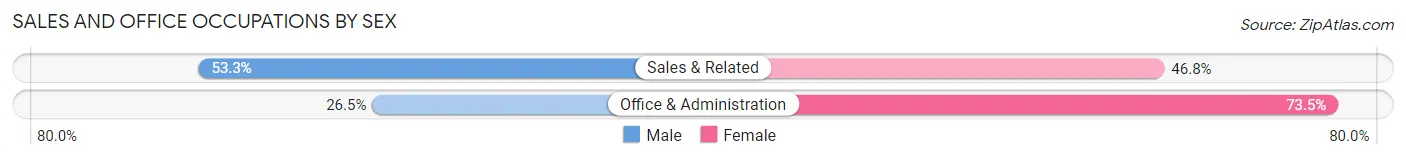
| Occupation | Male | Female |
| Sales & Related | 164 (53.2%) | 144 (46.8%) |
| Office & Administration | 35 (26.5%) | 97 (73.5%) |
| Total (Category) | 199 (45.2%) | 241 (54.8%) |
| Total (Overall) | 582 (57.3%) | 433 (42.7%) |
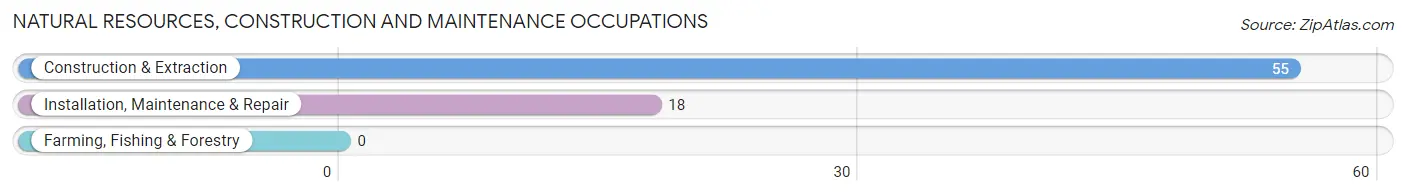
Natural Resources, Construction and Maintenance Occupations
The most common Natural Resources, Construction and Maintenance occupations in Sorrento are Construction & Extraction (55 | 5.4%), and Installation, Maintenance & Repair (18 | 1.8%).
Natural Resources, Construction and Maintenance Occupations by Sex
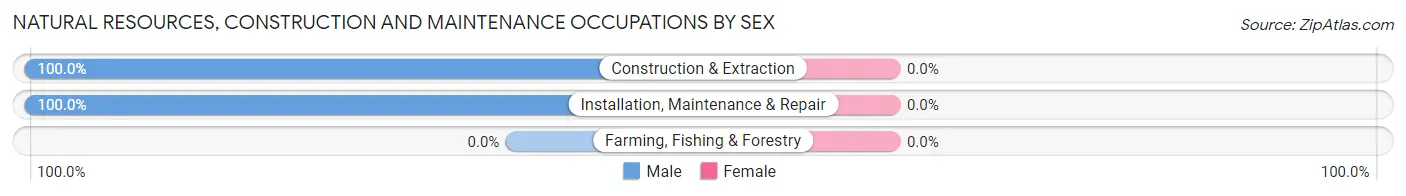
| Occupation | Male | Female |
| Farming, Fishing & Forestry | 0 (0.0%) | 0 (0.0%) |
| Construction & Extraction | 55 (100.0%) | 0 (0.0%) |
| Installation, Maintenance & Repair | 18 (100.0%) | 0 (0.0%) |
| Total (Category) | 73 (100.0%) | 0 (0.0%) |
| Total (Overall) | 582 (57.3%) | 433 (42.7%) |
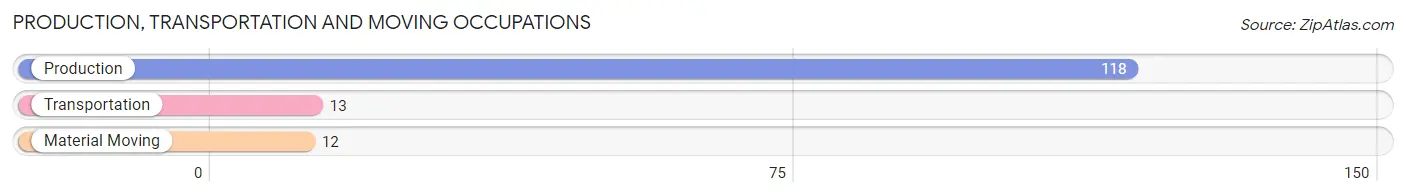
Production, Transportation and Moving Occupations
The most common Production, Transportation and Moving occupations in Sorrento are Production (118 | 11.6%), Transportation (13 | 1.3%), and Material Moving (12 | 1.2%).
Production, Transportation and Moving Occupations by Sex
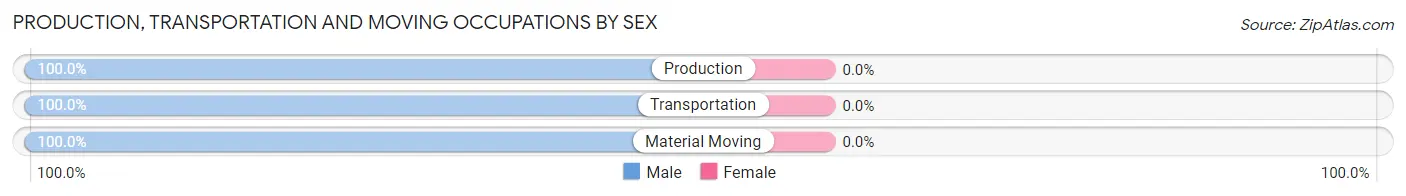
| Occupation | Male | Female |
| Production | 118 (100.0%) | 0 (0.0%) |
| Transportation | 13 (100.0%) | 0 (0.0%) |
| Material Moving | 12 (100.0%) | 0 (0.0%) |
| Total (Category) | 143 (100.0%) | 0 (0.0%) |
| Total (Overall) | 582 (57.3%) | 433 (42.7%) |
Employment Industries by Sex in Sorrento
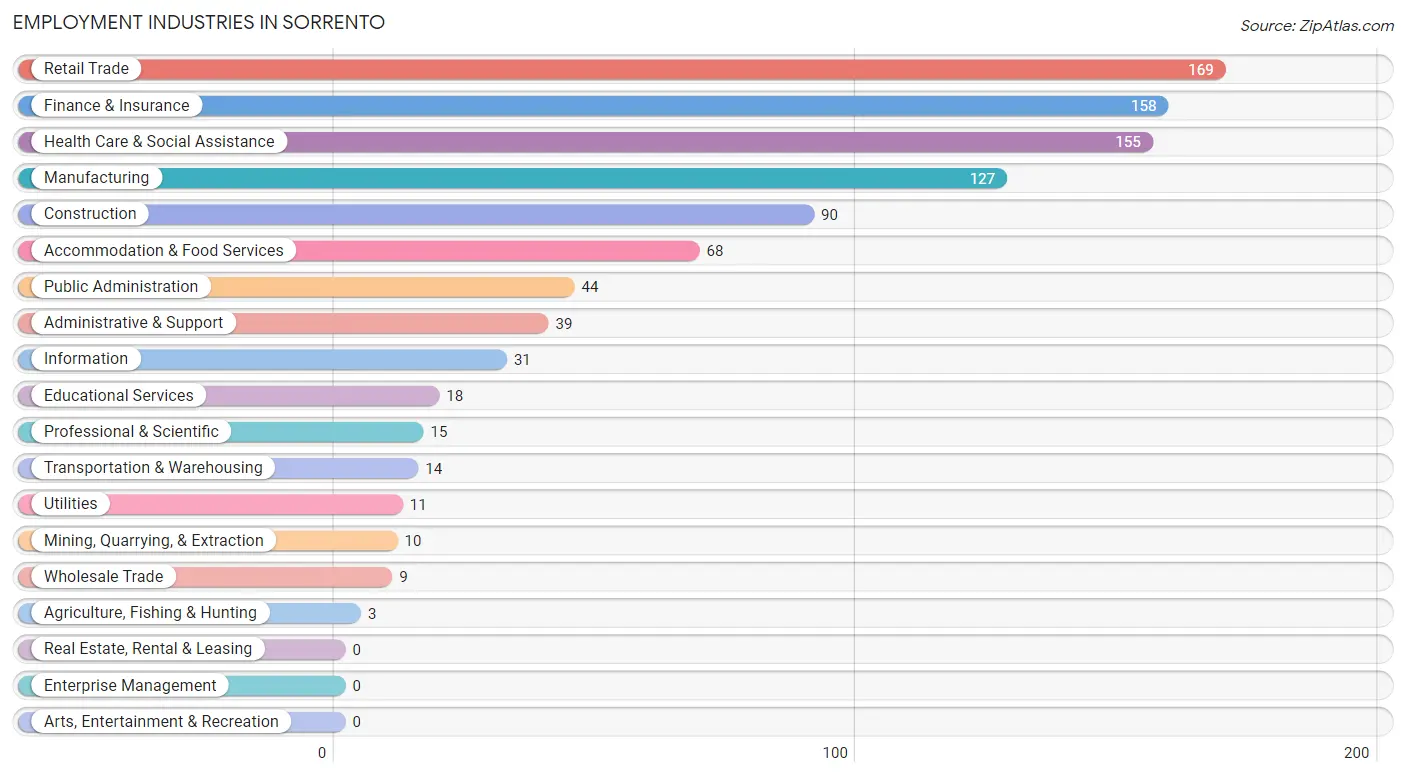
Employment Industries in Sorrento
The major employment industries in Sorrento include Retail Trade (169 | 16.7%), Finance & Insurance (158 | 15.6%), Health Care & Social Assistance (155 | 15.3%), Manufacturing (127 | 12.5%), and Construction (90 | 8.9%).
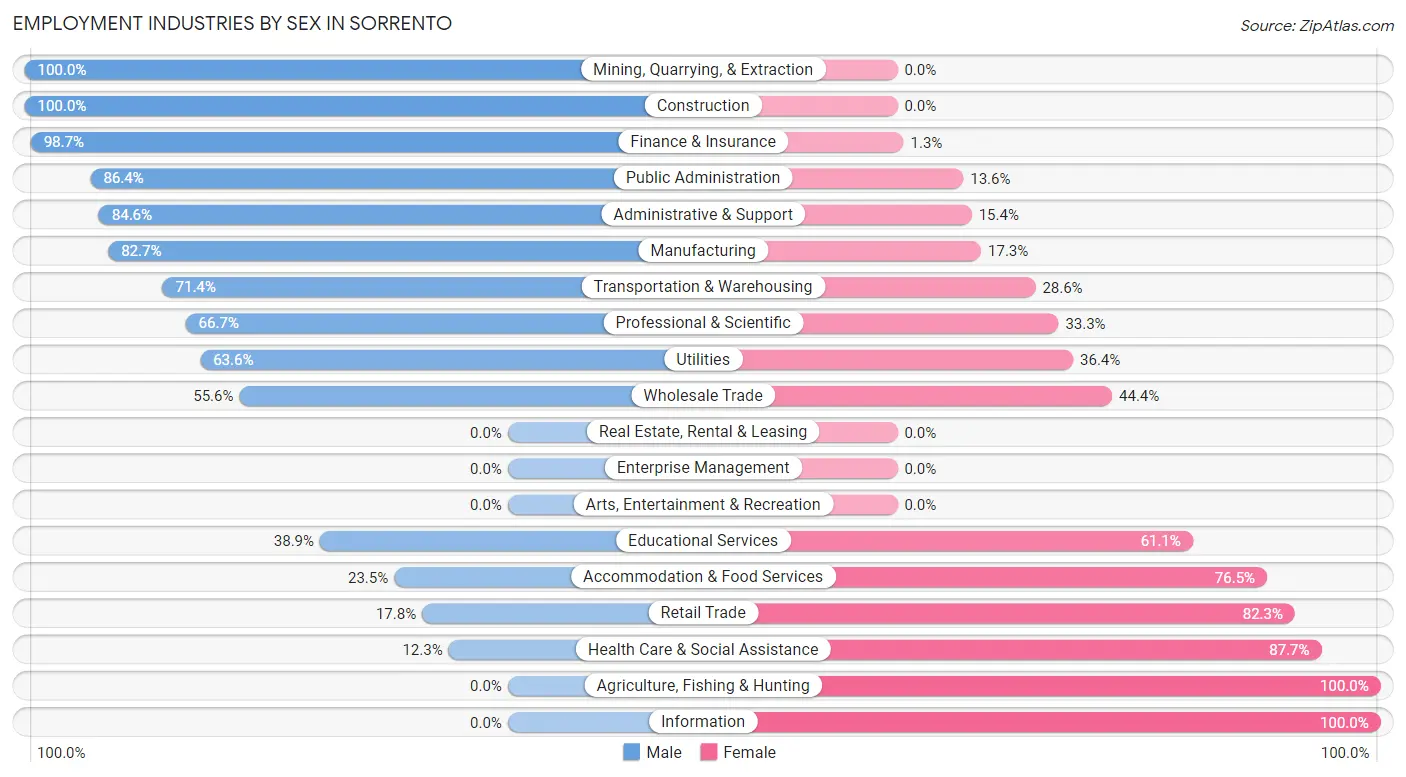
Employment Industries by Sex in Sorrento
The Sorrento industries that see more men than women are Mining, Quarrying, & Extraction (100.0%), Construction (100.0%), and Finance & Insurance (98.7%), whereas the industries that tend to have a higher number of women are Agriculture, Fishing & Hunting (100.0%), Information (100.0%), and Health Care & Social Assistance (87.7%).
| Industry | Male | Female |
| Agriculture, Fishing & Hunting | 0 (0.0%) | 3 (100.0%) |
| Mining, Quarrying, & Extraction | 10 (100.0%) | 0 (0.0%) |
| Construction | 90 (100.0%) | 0 (0.0%) |
| Manufacturing | 105 (82.7%) | 22 (17.3%) |
| Wholesale Trade | 5 (55.6%) | 4 (44.4%) |
| Retail Trade | 30 (17.7%) | 139 (82.3%) |
| Transportation & Warehousing | 10 (71.4%) | 4 (28.6%) |
| Utilities | 7 (63.6%) | 4 (36.4%) |
| Information | 0 (0.0%) | 31 (100.0%) |
| Finance & Insurance | 156 (98.7%) | 2 (1.3%) |
| Real Estate, Rental & Leasing | 0 (0.0%) | 0 (0.0%) |
| Professional & Scientific | 10 (66.7%) | 5 (33.3%) |
| Enterprise Management | 0 (0.0%) | 0 (0.0%) |
| Administrative & Support | 33 (84.6%) | 6 (15.4%) |
| Educational Services | 7 (38.9%) | 11 (61.1%) |
| Health Care & Social Assistance | 19 (12.3%) | 136 (87.7%) |
| Arts, Entertainment & Recreation | 0 (0.0%) | 0 (0.0%) |
| Accommodation & Food Services | 16 (23.5%) | 52 (76.5%) |
| Public Administration | 38 (86.4%) | 6 (13.6%) |
| Total | 582 (57.3%) | 433 (42.7%) |
Education in Sorrento
School Enrollment in Sorrento
The most common levels of schooling among the 419 students in Sorrento are middle school (113 | 27.0%), high school (101 | 24.1%), and elementary school (78 | 18.6%).
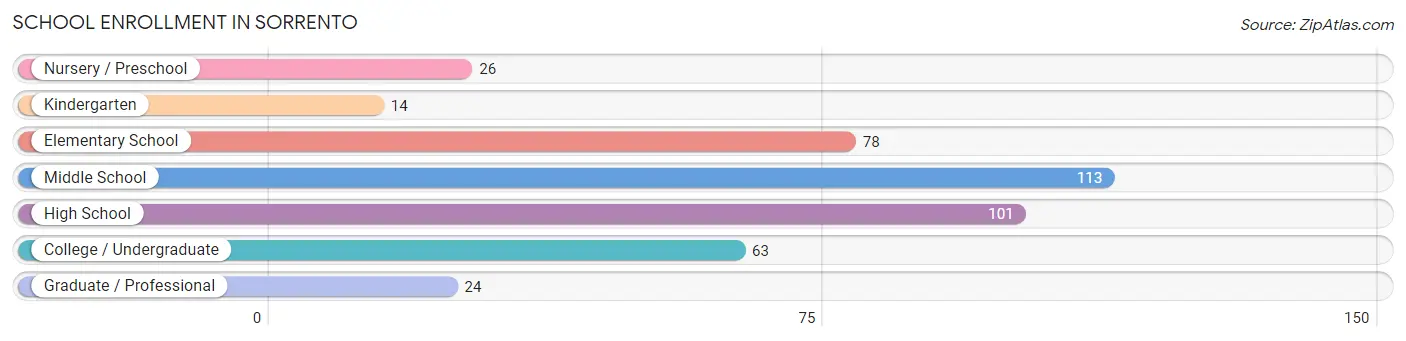
| School Level | # Students | % Students |
| Nursery / Preschool | 26 | 6.2% |
| Kindergarten | 14 | 3.3% |
| Elementary School | 78 | 18.6% |
| Middle School | 113 | 27.0% |
| High School | 101 | 24.1% |
| College / Undergraduate | 63 | 15.0% |
| Graduate / Professional | 24 | 5.7% |
| Total | 419 | 100.0% |
School Enrollment by Age by Funding Source in Sorrento
Out of a total of 419 students who are enrolled in schools in Sorrento, 38 (9.1%) attend a private institution, while the remaining 381 (90.9%) are enrolled in public schools. The age group of 25 to 34 year olds has the highest likelihood of being enrolled in private schools, with 4 (44.4% in the age bracket) enrolled. Conversely, the age group of 15 to 17 year olds has the lowest likelihood of being enrolled in a private school, with 73 (100.0% in the age bracket) attending a public institution.
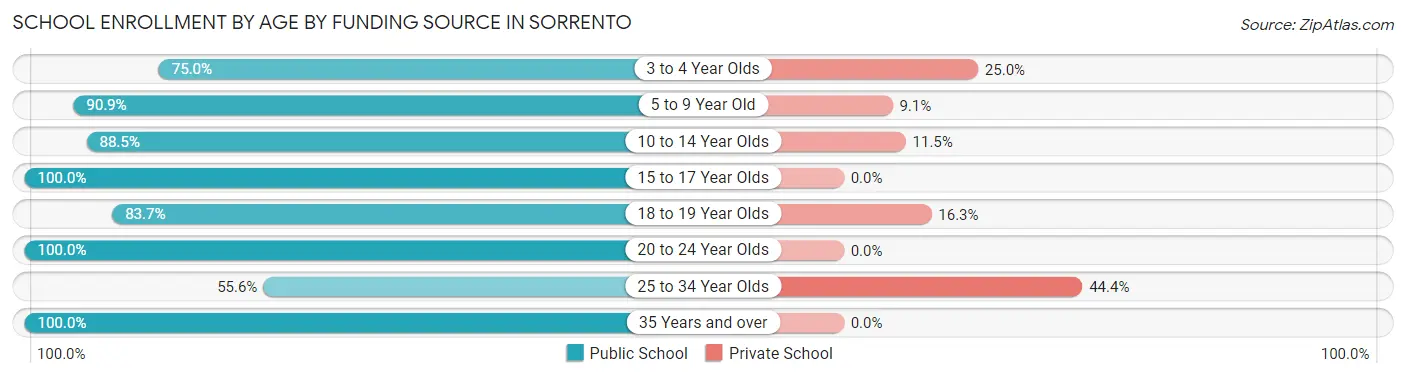
| Age Bracket | Public School | Private School |
| 3 to 4 Year Olds | 12 (75.0%) | 4 (25.0%) |
| 5 to 9 Year Old | 70 (90.9%) | 7 (9.1%) |
| 10 to 14 Year Olds | 115 (88.5%) | 15 (11.5%) |
| 15 to 17 Year Olds | 73 (100.0%) | 0 (0.0%) |
| 18 to 19 Year Olds | 41 (83.7%) | 8 (16.3%) |
| 20 to 24 Year Olds | 60 (100.0%) | 0 (0.0%) |
| 25 to 34 Year Olds | 5 (55.6%) | 4 (44.4%) |
| 35 Years and over | 5 (100.0%) | 0 (0.0%) |
| Total | 381 (90.9%) | 38 (9.1%) |
Educational Attainment by Field of Study in Sorrento
Social sciences (30 | 15.4%), arts & humanities (29 | 14.9%), liberal arts & history (26 | 13.3%), business (25 | 12.8%), and science & technology (20 | 10.3%) are the most common fields of study among 195 individuals in Sorrento who have obtained a bachelor's degree or higher.
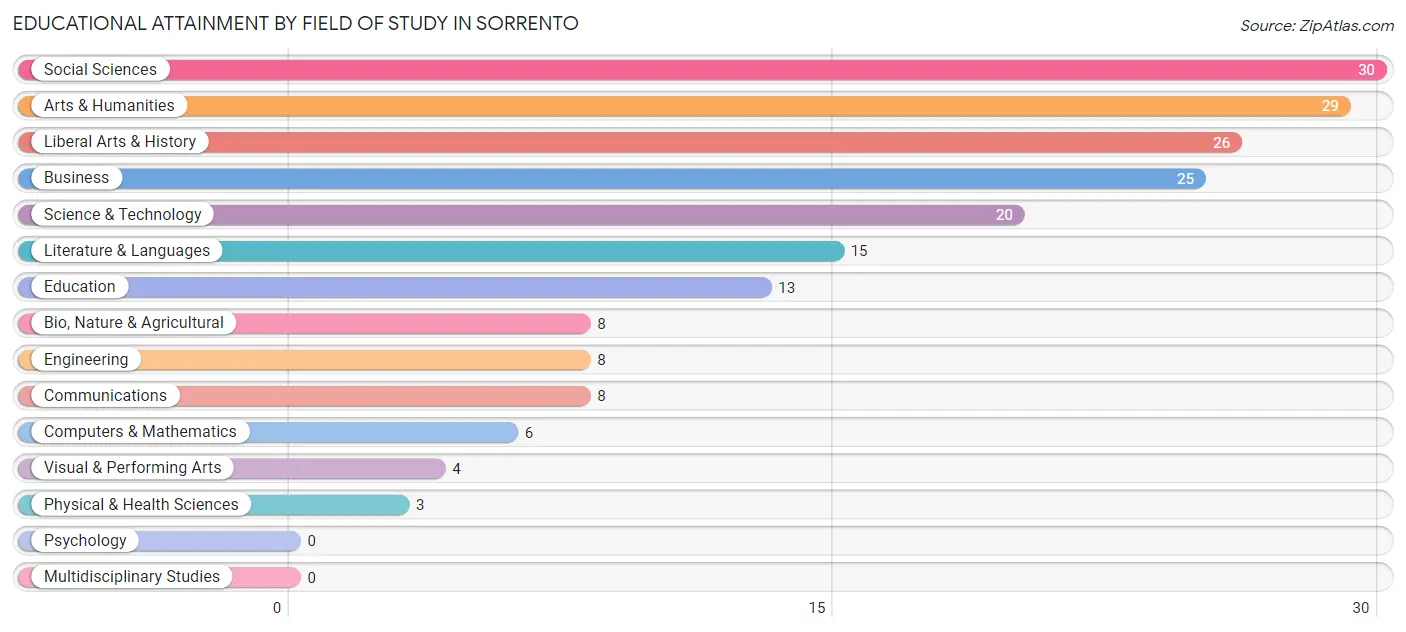
| Field of Study | # Graduates | % Graduates |
| Computers & Mathematics | 6 | 3.1% |
| Bio, Nature & Agricultural | 8 | 4.1% |
| Physical & Health Sciences | 3 | 1.5% |
| Psychology | 0 | 0.0% |
| Social Sciences | 30 | 15.4% |
| Engineering | 8 | 4.1% |
| Multidisciplinary Studies | 0 | 0.0% |
| Science & Technology | 20 | 10.3% |
| Business | 25 | 12.8% |
| Education | 13 | 6.7% |
| Literature & Languages | 15 | 7.7% |
| Liberal Arts & History | 26 | 13.3% |
| Visual & Performing Arts | 4 | 2.1% |
| Communications | 8 | 4.1% |
| Arts & Humanities | 29 | 14.9% |
| Total | 195 | 100.0% |
Transportation & Commute in Sorrento
Vehicle Availability by Sex in Sorrento
The most prevalent vehicle ownership categories in Sorrento are males with 4 vehicles (178, accounting for 30.6%) and females with 4 vehicles (14, making up 41.1%).
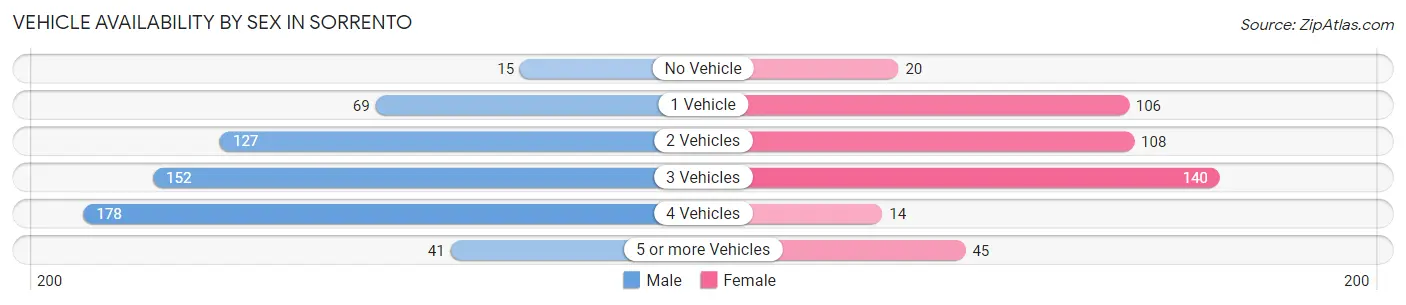
| Vehicles Available | Male | Female |
| No Vehicle | 15 (2.6%) | 20 (4.6%) |
| 1 Vehicle | 69 (11.9%) | 106 (24.5%) |
| 2 Vehicles | 127 (21.8%) | 108 (24.9%) |
| 3 Vehicles | 152 (26.1%) | 140 (32.3%) |
| 4 Vehicles | 178 (30.6%) | 14 (3.2%) |
| 5 or more Vehicles | 41 (7.0%) | 45 (10.4%) |
| Total | 582 (100.0%) | 433 (100.0%) |
Commute Time in Sorrento
The most frequently occuring commute durations in Sorrento are 5 to 9 minutes (180 commuters, 18.5%), 45 to 59 minutes (170 commuters, 17.4%), and 30 to 34 minutes (149 commuters, 15.3%).
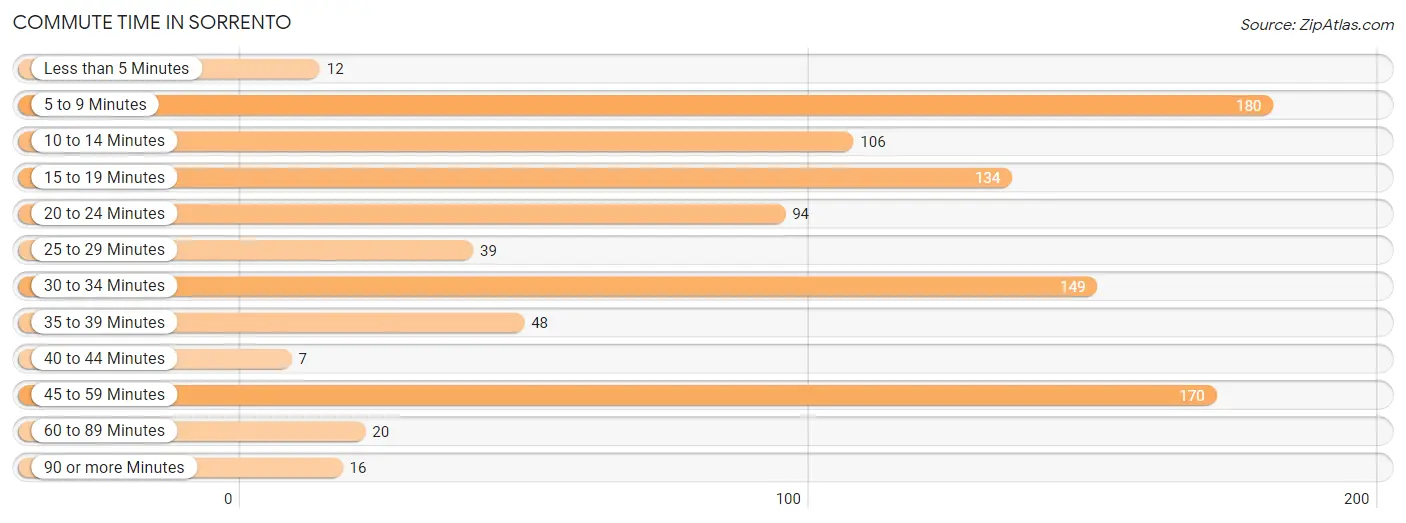
| Commute Time | # Commuters | % Commuters |
| Less than 5 Minutes | 12 | 1.2% |
| 5 to 9 Minutes | 180 | 18.5% |
| 10 to 14 Minutes | 106 | 10.9% |
| 15 to 19 Minutes | 134 | 13.7% |
| 20 to 24 Minutes | 94 | 9.6% |
| 25 to 29 Minutes | 39 | 4.0% |
| 30 to 34 Minutes | 149 | 15.3% |
| 35 to 39 Minutes | 48 | 4.9% |
| 40 to 44 Minutes | 7 | 0.7% |
| 45 to 59 Minutes | 170 | 17.4% |
| 60 to 89 Minutes | 20 | 2.1% |
| 90 or more Minutes | 16 | 1.6% |
Commute Time by Sex in Sorrento
The most common commute times in Sorrento are 5 to 9 minutes (146 commuters, 26.4%) for males and 10 to 14 minutes (88 commuters, 20.8%) for females.
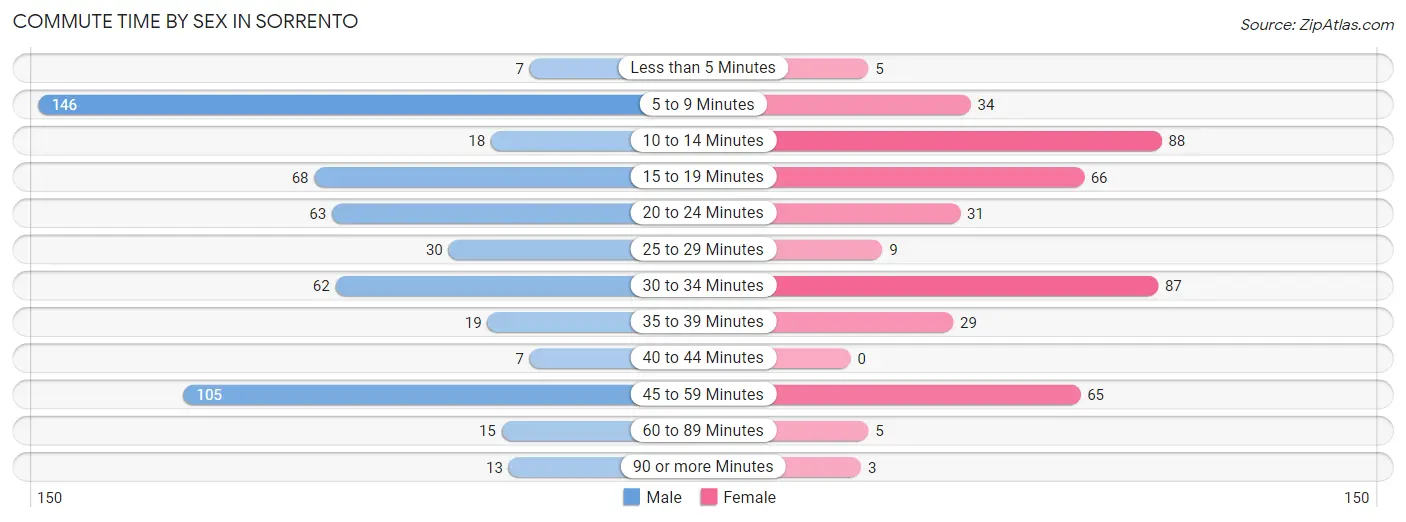
| Commute Time | Male | Female |
| Less than 5 Minutes | 7 (1.3%) | 5 (1.2%) |
| 5 to 9 Minutes | 146 (26.4%) | 34 (8.1%) |
| 10 to 14 Minutes | 18 (3.3%) | 88 (20.8%) |
| 15 to 19 Minutes | 68 (12.3%) | 66 (15.6%) |
| 20 to 24 Minutes | 63 (11.4%) | 31 (7.3%) |
| 25 to 29 Minutes | 30 (5.4%) | 9 (2.1%) |
| 30 to 34 Minutes | 62 (11.2%) | 87 (20.6%) |
| 35 to 39 Minutes | 19 (3.4%) | 29 (6.9%) |
| 40 to 44 Minutes | 7 (1.3%) | 0 (0.0%) |
| 45 to 59 Minutes | 105 (19.0%) | 65 (15.4%) |
| 60 to 89 Minutes | 15 (2.7%) | 5 (1.2%) |
| 90 or more Minutes | 13 (2.4%) | 3 (0.7%) |
Time of Departure to Work by Sex in Sorrento
The most frequent times of departure to work in Sorrento are 7:30 AM to 7:59 AM (146, 26.4%) for males and 6:30 AM to 6:59 AM (103, 24.4%) for females.
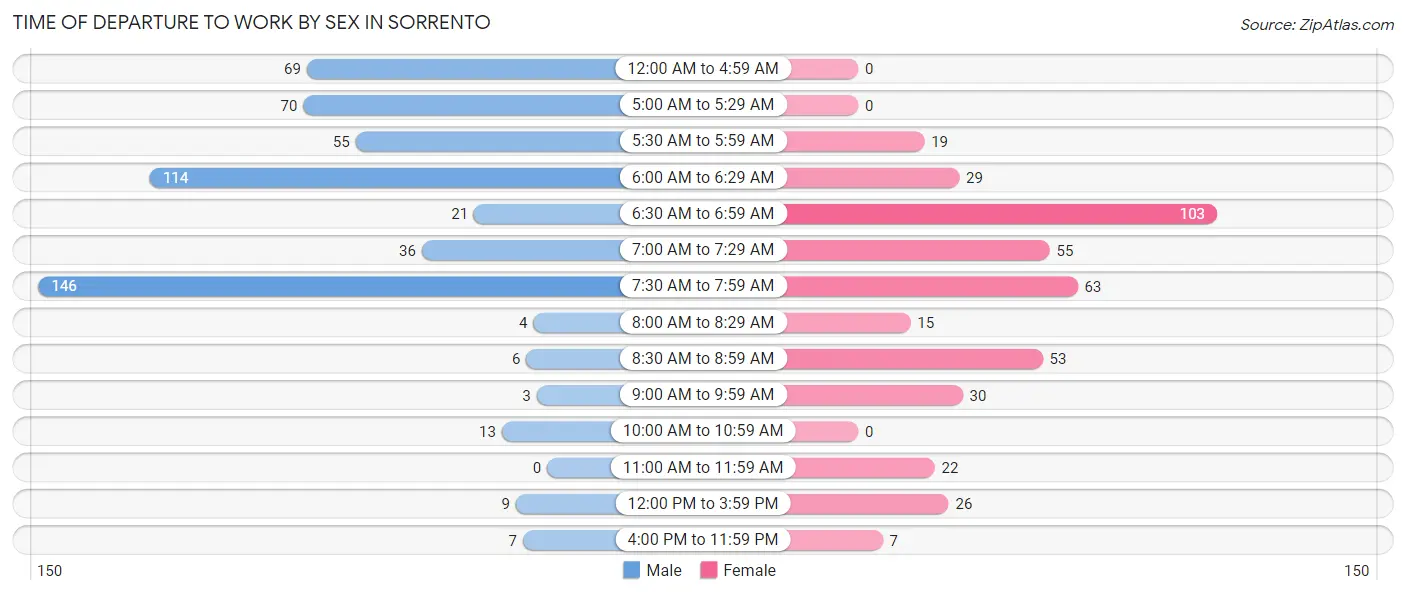
| Time of Departure | Male | Female |
| 12:00 AM to 4:59 AM | 69 (12.5%) | 0 (0.0%) |
| 5:00 AM to 5:29 AM | 70 (12.7%) | 0 (0.0%) |
| 5:30 AM to 5:59 AM | 55 (10.0%) | 19 (4.5%) |
| 6:00 AM to 6:29 AM | 114 (20.6%) | 29 (6.9%) |
| 6:30 AM to 6:59 AM | 21 (3.8%) | 103 (24.4%) |
| 7:00 AM to 7:29 AM | 36 (6.5%) | 55 (13.0%) |
| 7:30 AM to 7:59 AM | 146 (26.4%) | 63 (14.9%) |
| 8:00 AM to 8:29 AM | 4 (0.7%) | 15 (3.5%) |
| 8:30 AM to 8:59 AM | 6 (1.1%) | 53 (12.6%) |
| 9:00 AM to 9:59 AM | 3 (0.5%) | 30 (7.1%) |
| 10:00 AM to 10:59 AM | 13 (2.4%) | 0 (0.0%) |
| 11:00 AM to 11:59 AM | 0 (0.0%) | 22 (5.2%) |
| 12:00 PM to 3:59 PM | 9 (1.6%) | 26 (6.2%) |
| 4:00 PM to 11:59 PM | 7 (1.3%) | 7 (1.7%) |
| Total | 553 (100.0%) | 422 (100.0%) |
Housing Occupancy in Sorrento
Occupancy by Ownership in Sorrento
Of the total 691 dwellings in Sorrento, owner-occupied units account for 575 (83.2%), while renter-occupied units make up 116 (16.8%).
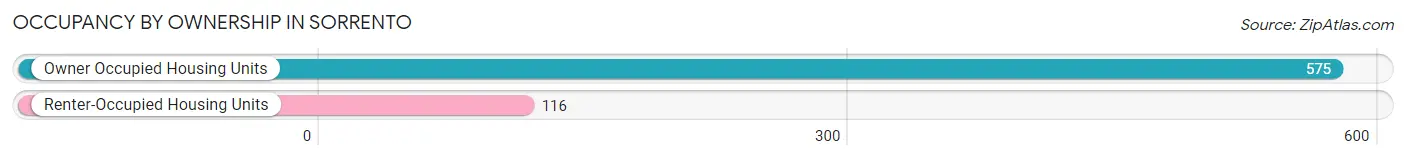
| Occupancy | # Housing Units | % Housing Units |
| Owner Occupied Housing Units | 575 | 83.2% |
| Renter-Occupied Housing Units | 116 | 16.8% |
| Total Occupied Housing Units | 691 | 100.0% |
Occupancy by Household Size in Sorrento
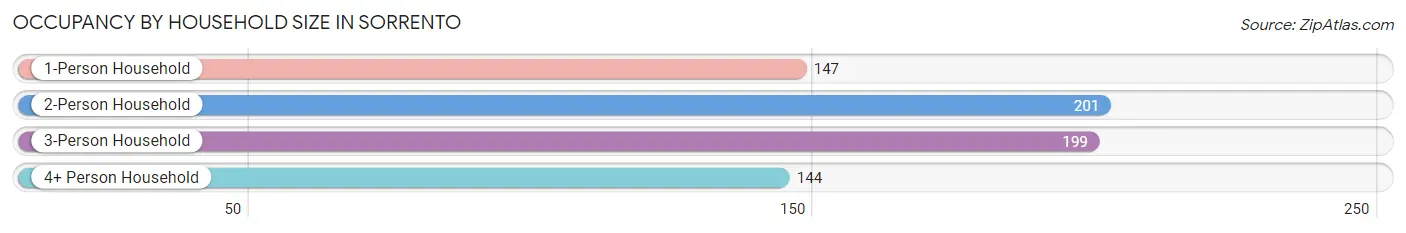
| Household Size | # Housing Units | % Housing Units |
| 1-Person Household | 147 | 21.3% |
| 2-Person Household | 201 | 29.1% |
| 3-Person Household | 199 | 28.8% |
| 4+ Person Household | 144 | 20.8% |
| Total Housing Units | 691 | 100.0% |
Occupancy by Ownership by Household Size in Sorrento
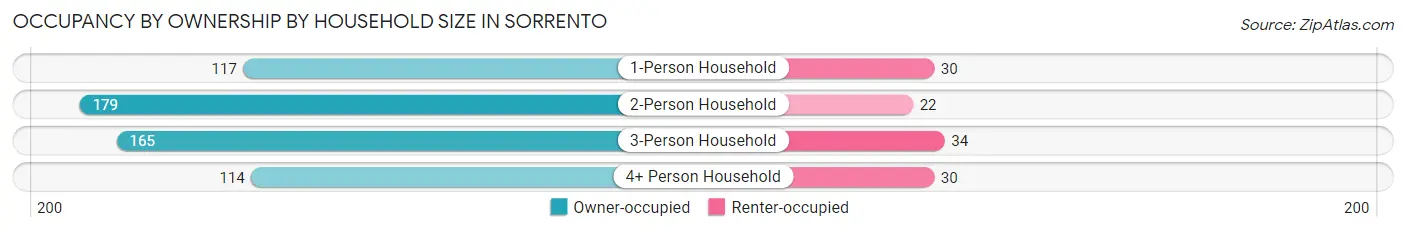
| Household Size | Owner-occupied | Renter-occupied |
| 1-Person Household | 117 (79.6%) | 30 (20.4%) |
| 2-Person Household | 179 (89.0%) | 22 (11.0%) |
| 3-Person Household | 165 (82.9%) | 34 (17.1%) |
| 4+ Person Household | 114 (79.2%) | 30 (20.8%) |
| Total Housing Units | 575 (83.2%) | 116 (16.8%) |
Occupancy by Educational Attainment in Sorrento
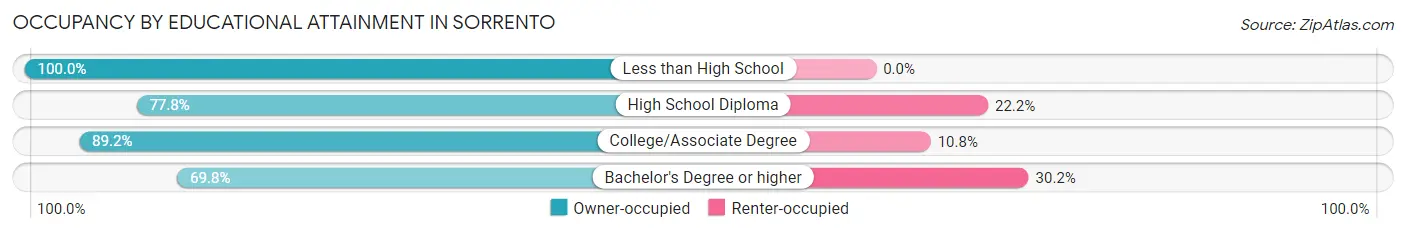
| Household Size | Owner-occupied | Renter-occupied |
| Less than High School | 24 (100.0%) | 0 (0.0%) |
| High School Diploma | 186 (77.8%) | 53 (22.2%) |
| College/Associate Degree | 305 (89.2%) | 37 (10.8%) |
| Bachelor's Degree or higher | 60 (69.8%) | 26 (30.2%) |
Occupancy by Age of Householder in Sorrento
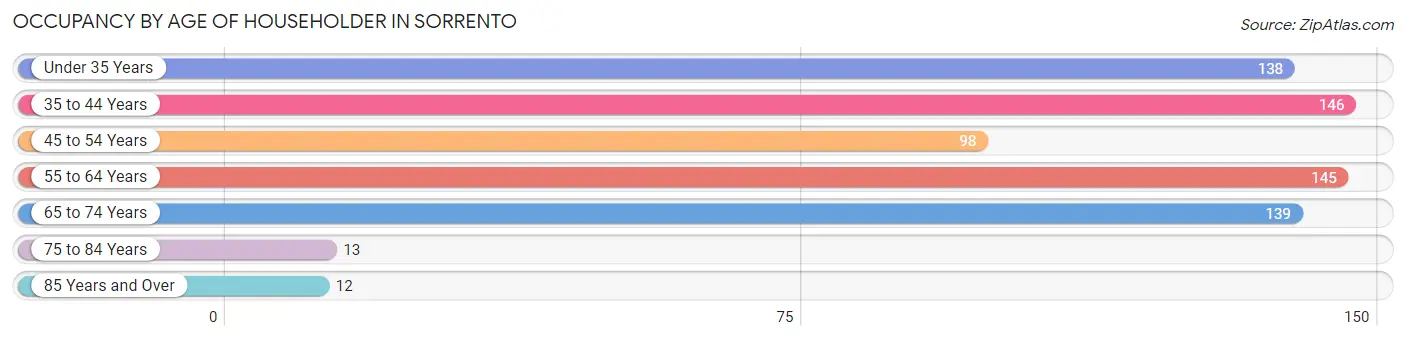
| Age Bracket | # Households | % Households |
| Under 35 Years | 138 | 20.0% |
| 35 to 44 Years | 146 | 21.1% |
| 45 to 54 Years | 98 | 14.2% |
| 55 to 64 Years | 145 | 21.0% |
| 65 to 74 Years | 139 | 20.1% |
| 75 to 84 Years | 13 | 1.9% |
| 85 Years and Over | 12 | 1.7% |
| Total | 691 | 100.0% |
Housing Finances in Sorrento
Median Income by Occupancy in Sorrento
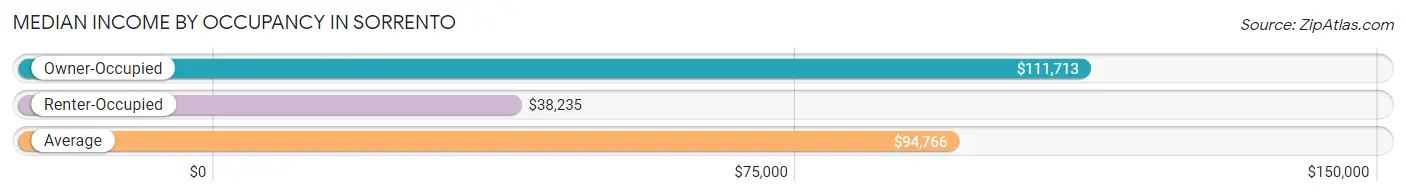
| Occupancy Type | # Households | Median Income |
| Owner-Occupied | 575 (83.2%) | $111,713 |
| Renter-Occupied | 116 (16.8%) | $38,235 |
| Average | 691 (100.0%) | $94,766 |
Occupancy by Householder Income Bracket in Sorrento
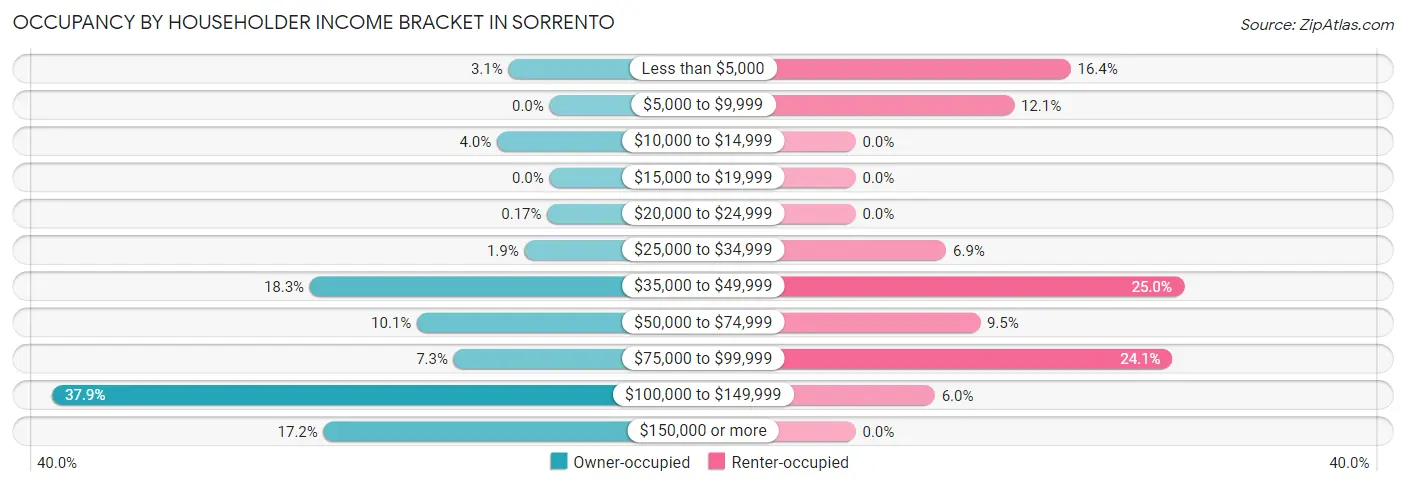
| Income Bracket | Owner-occupied | Renter-occupied |
| Less than $5,000 | 18 (3.1%) | 19 (16.4%) |
| $5,000 to $9,999 | 0 (0.0%) | 14 (12.1%) |
| $10,000 to $14,999 | 23 (4.0%) | 0 (0.0%) |
| $15,000 to $19,999 | 0 (0.0%) | 0 (0.0%) |
| $20,000 to $24,999 | 1 (0.2%) | 0 (0.0%) |
| $25,000 to $34,999 | 11 (1.9%) | 8 (6.9%) |
| $35,000 to $49,999 | 105 (18.3%) | 29 (25.0%) |
| $50,000 to $74,999 | 58 (10.1%) | 11 (9.5%) |
| $75,000 to $99,999 | 42 (7.3%) | 28 (24.1%) |
| $100,000 to $149,999 | 218 (37.9%) | 7 (6.0%) |
| $150,000 or more | 99 (17.2%) | 0 (0.0%) |
| Total | 575 (100.0%) | 116 (100.0%) |
Monthly Housing Cost Tiers in Sorrento
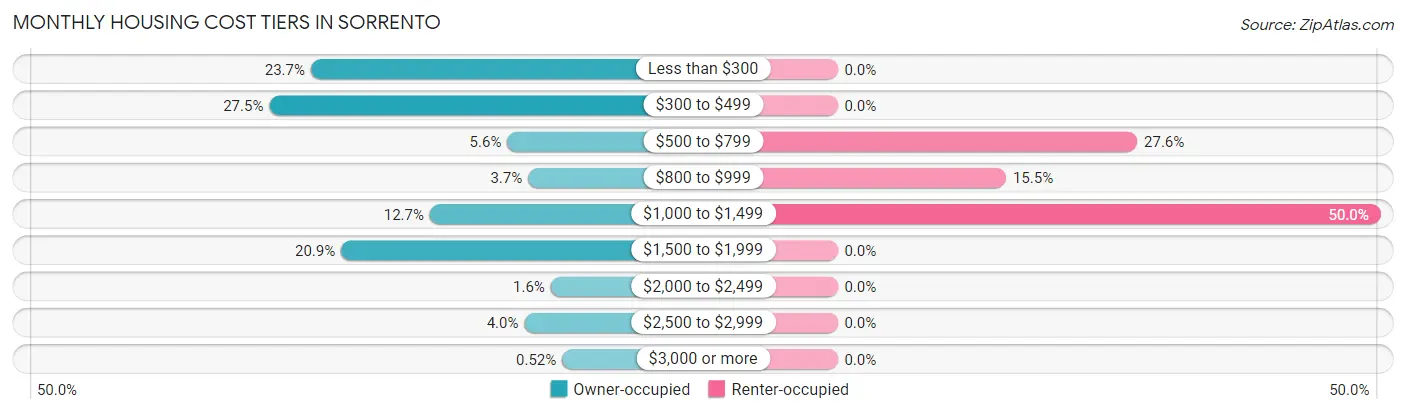
| Monthly Cost | Owner-occupied | Renter-occupied |
| Less than $300 | 136 (23.6%) | 0 (0.0%) |
| $300 to $499 | 158 (27.5%) | 0 (0.0%) |
| $500 to $799 | 32 (5.6%) | 32 (27.6%) |
| $800 to $999 | 21 (3.6%) | 18 (15.5%) |
| $1,000 to $1,499 | 73 (12.7%) | 58 (50.0%) |
| $1,500 to $1,999 | 120 (20.9%) | 0 (0.0%) |
| $2,000 to $2,499 | 9 (1.6%) | 0 (0.0%) |
| $2,500 to $2,999 | 23 (4.0%) | 0 (0.0%) |
| $3,000 or more | 3 (0.5%) | 0 (0.0%) |
| Total | 575 (100.0%) | 116 (100.0%) |
Physical Housing Characteristics in Sorrento
Housing Structures in Sorrento
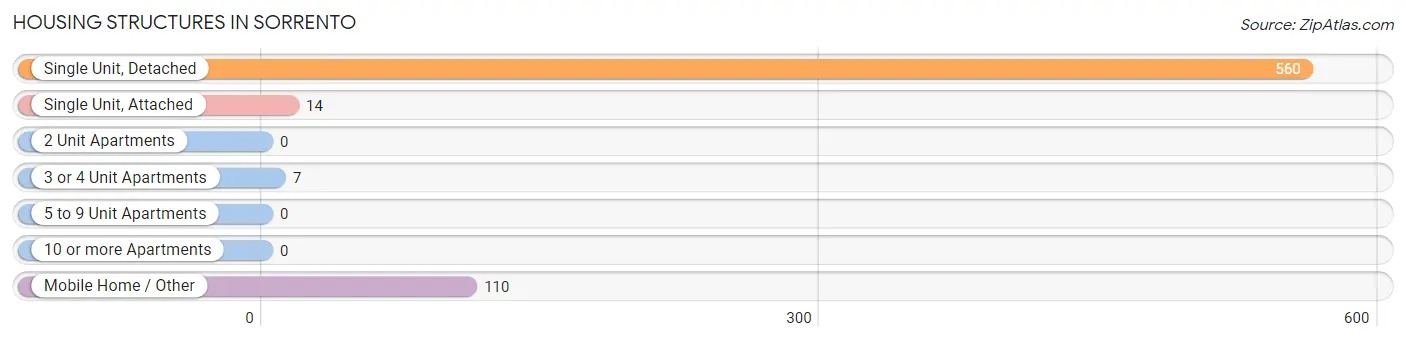
| Structure Type | # Housing Units | % Housing Units |
| Single Unit, Detached | 560 | 81.0% |
| Single Unit, Attached | 14 | 2.0% |
| 2 Unit Apartments | 0 | 0.0% |
| 3 or 4 Unit Apartments | 7 | 1.0% |
| 5 to 9 Unit Apartments | 0 | 0.0% |
| 10 or more Apartments | 0 | 0.0% |
| Mobile Home / Other | 110 | 15.9% |
| Total | 691 | 100.0% |
Housing Structures by Occupancy in Sorrento
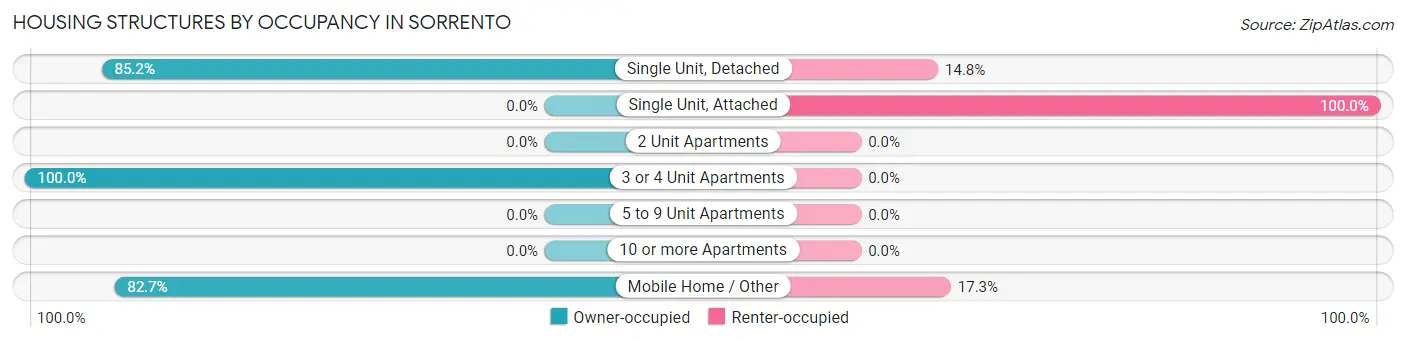
| Structure Type | Owner-occupied | Renter-occupied |
| Single Unit, Detached | 477 (85.2%) | 83 (14.8%) |
| Single Unit, Attached | 0 (0.0%) | 14 (100.0%) |
| 2 Unit Apartments | 0 (0.0%) | 0 (0.0%) |
| 3 or 4 Unit Apartments | 7 (100.0%) | 0 (0.0%) |
| 5 to 9 Unit Apartments | 0 (0.0%) | 0 (0.0%) |
| 10 or more Apartments | 0 (0.0%) | 0 (0.0%) |
| Mobile Home / Other | 91 (82.7%) | 19 (17.3%) |
| Total | 575 (83.2%) | 116 (16.8%) |
Housing Structures by Number of Rooms in Sorrento
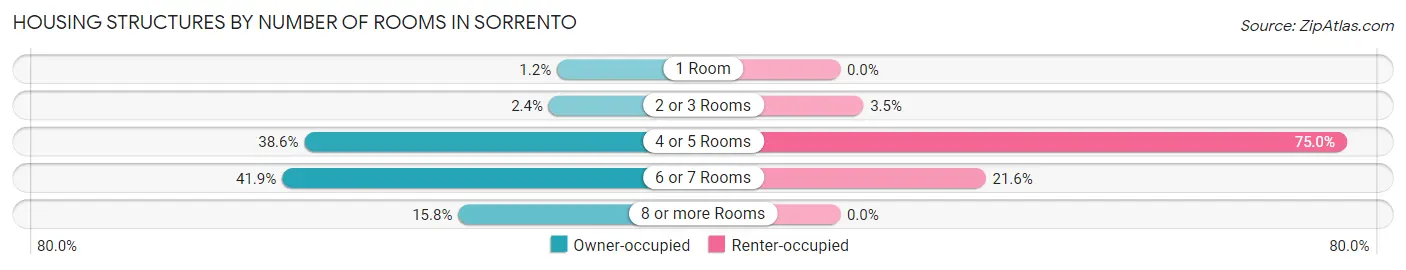
| Number of Rooms | Owner-occupied | Renter-occupied |
| 1 Room | 7 (1.2%) | 0 (0.0%) |
| 2 or 3 Rooms | 14 (2.4%) | 4 (3.5%) |
| 4 or 5 Rooms | 222 (38.6%) | 87 (75.0%) |
| 6 or 7 Rooms | 241 (41.9%) | 25 (21.5%) |
| 8 or more Rooms | 91 (15.8%) | 0 (0.0%) |
| Total | 575 (100.0%) | 116 (100.0%) |
Housing Structure by Heating Type in Sorrento
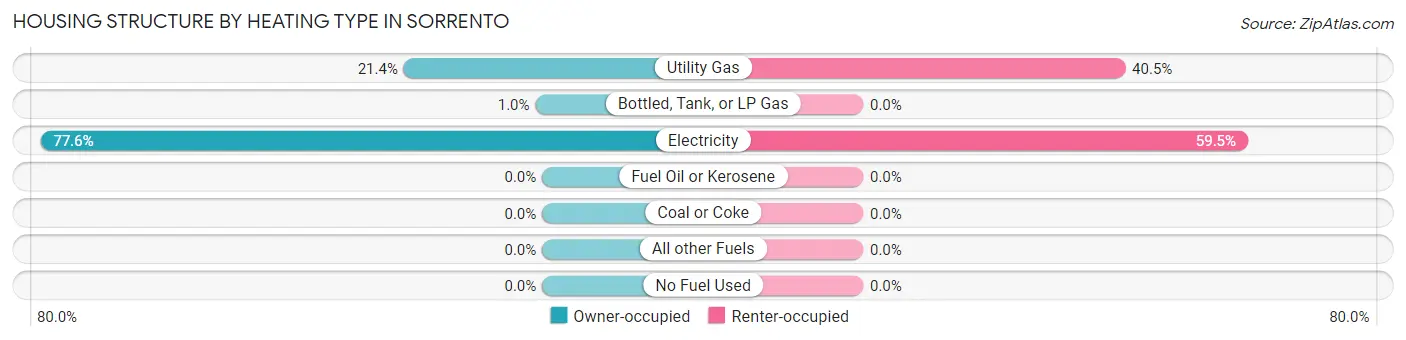
| Heating Type | Owner-occupied | Renter-occupied |
| Utility Gas | 123 (21.4%) | 47 (40.5%) |
| Bottled, Tank, or LP Gas | 6 (1.0%) | 0 (0.0%) |
| Electricity | 446 (77.6%) | 69 (59.5%) |
| Fuel Oil or Kerosene | 0 (0.0%) | 0 (0.0%) |
| Coal or Coke | 0 (0.0%) | 0 (0.0%) |
| All other Fuels | 0 (0.0%) | 0 (0.0%) |
| No Fuel Used | 0 (0.0%) | 0 (0.0%) |
| Total | 575 (100.0%) | 116 (100.0%) |
Household Vehicle Usage in Sorrento
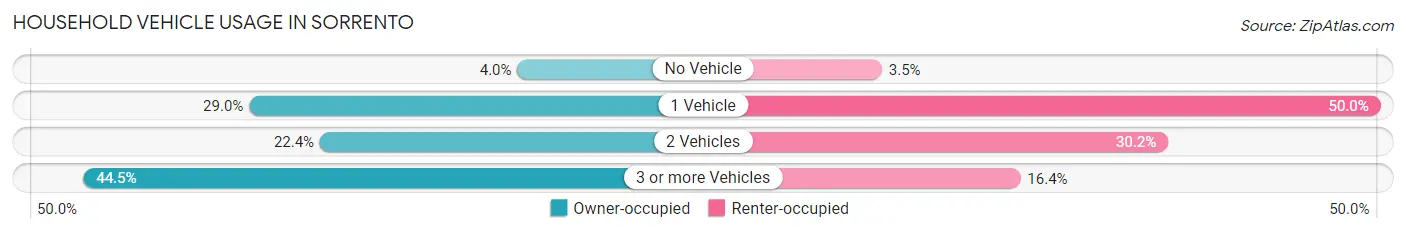
| Vehicles per Household | Owner-occupied | Renter-occupied |
| No Vehicle | 23 (4.0%) | 4 (3.5%) |
| 1 Vehicle | 167 (29.0%) | 58 (50.0%) |
| 2 Vehicles | 129 (22.4%) | 35 (30.2%) |
| 3 or more Vehicles | 256 (44.5%) | 19 (16.4%) |
| Total | 575 (100.0%) | 116 (100.0%) |
Real Estate & Mortgages in Sorrento
Real Estate and Mortgage Overview in Sorrento
| Characteristic | Without Mortgage | With Mortgage |
| Housing Units | 309 | 266 |
| Median Property Value | $166,000 | $220,500 |
| Median Household Income | $58,854 | $76 |
| Monthly Housing Costs | $361 | $3 |
| Real Estate Taxes | $199 | $39 |
Property Value by Mortgage Status in Sorrento
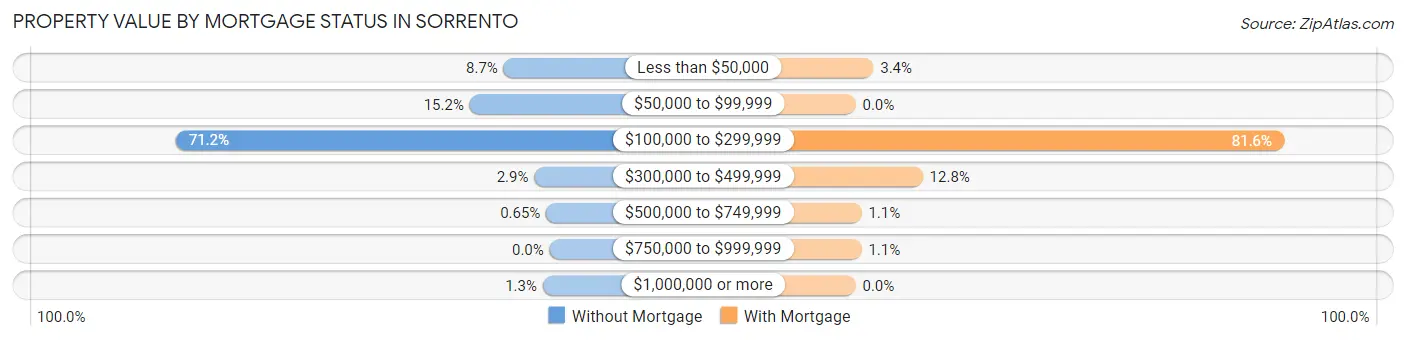
| Property Value | Without Mortgage | With Mortgage |
| Less than $50,000 | 27 (8.7%) | 9 (3.4%) |
| $50,000 to $99,999 | 47 (15.2%) | 0 (0.0%) |
| $100,000 to $299,999 | 220 (71.2%) | 217 (81.6%) |
| $300,000 to $499,999 | 9 (2.9%) | 34 (12.8%) |
| $500,000 to $749,999 | 2 (0.6%) | 3 (1.1%) |
| $750,000 to $999,999 | 0 (0.0%) | 3 (1.1%) |
| $1,000,000 or more | 4 (1.3%) | 0 (0.0%) |
| Total | 309 (100.0%) | 266 (100.0%) |
Household Income by Mortgage Status in Sorrento
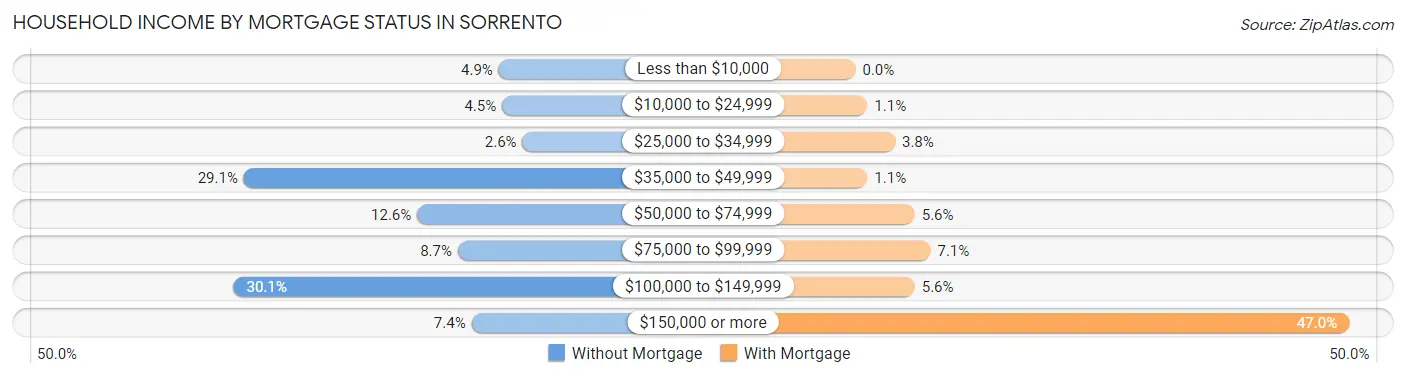
| Household Income | Without Mortgage | With Mortgage |
| Less than $10,000 | 15 (4.9%) | 0 (0.0%) |
| $10,000 to $24,999 | 14 (4.5%) | 3 (1.1%) |
| $25,000 to $34,999 | 8 (2.6%) | 10 (3.8%) |
| $35,000 to $49,999 | 90 (29.1%) | 3 (1.1%) |
| $50,000 to $74,999 | 39 (12.6%) | 15 (5.6%) |
| $75,000 to $99,999 | 27 (8.7%) | 19 (7.1%) |
| $100,000 to $149,999 | 93 (30.1%) | 15 (5.6%) |
| $150,000 or more | 23 (7.4%) | 125 (47.0%) |
| Total | 309 (100.0%) | 266 (100.0%) |
Property Value to Household Income Ratio in Sorrento
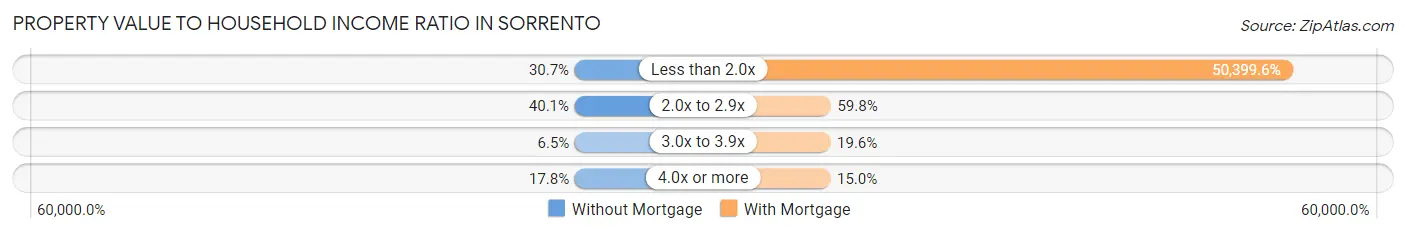
| Value-to-Income Ratio | Without Mortgage | With Mortgage |
| Less than 2.0x | 95 (30.7%) | 134,063 (50,399.6%) |
| 2.0x to 2.9x | 124 (40.1%) | 159 (59.8%) |
| 3.0x to 3.9x | 20 (6.5%) | 52 (19.6%) |
| 4.0x or more | 55 (17.8%) | 40 (15.0%) |
| Total | 309 (100.0%) | 266 (100.0%) |
Real Estate Taxes by Mortgage Status in Sorrento
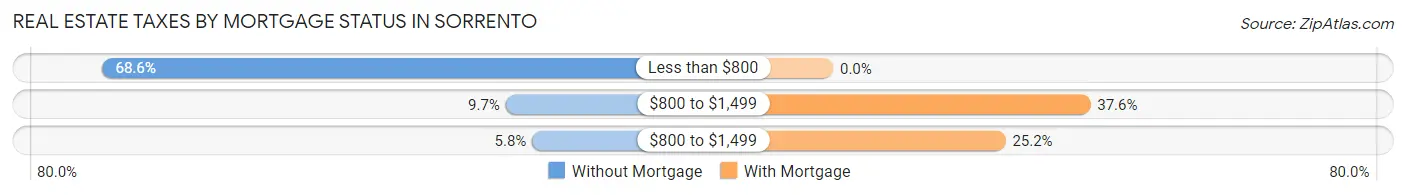
| Property Taxes | Without Mortgage | With Mortgage |
| Less than $800 | 212 (68.6%) | 0 (0.0%) |
| $800 to $1,499 | 30 (9.7%) | 100 (37.6%) |
| $800 to $1,499 | 18 (5.8%) | 67 (25.2%) |
| Total | 309 (100.0%) | 266 (100.0%) |
Health & Disability in Sorrento
Health Insurance Coverage by Age in Sorrento
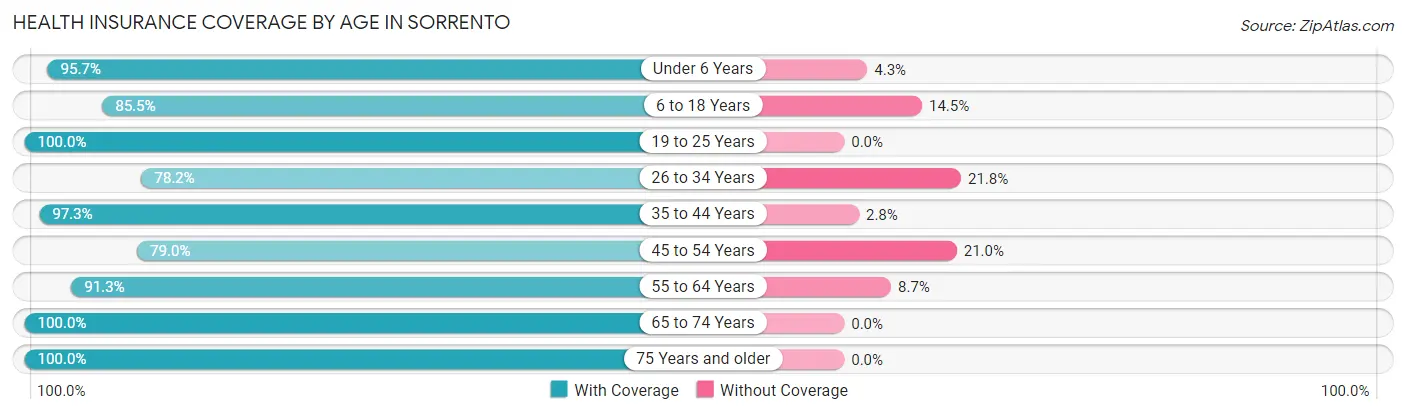
| Age Bracket | With Coverage | Without Coverage |
| Under 6 Years | 89 (95.7%) | 4 (4.3%) |
| 6 to 18 Years | 283 (85.5%) | 48 (14.5%) |
| 19 to 25 Years | 201 (100.0%) | 0 (0.0%) |
| 26 to 34 Years | 158 (78.2%) | 44 (21.8%) |
| 35 to 44 Years | 212 (97.3%) | 6 (2.8%) |
| 45 to 54 Years | 162 (79.0%) | 43 (21.0%) |
| 55 to 64 Years | 335 (91.3%) | 32 (8.7%) |
| 65 to 74 Years | 165 (100.0%) | 0 (0.0%) |
| 75 Years and older | 137 (100.0%) | 0 (0.0%) |
| Total | 1,742 (90.8%) | 177 (9.2%) |
Health Insurance Coverage by Citizenship Status in Sorrento
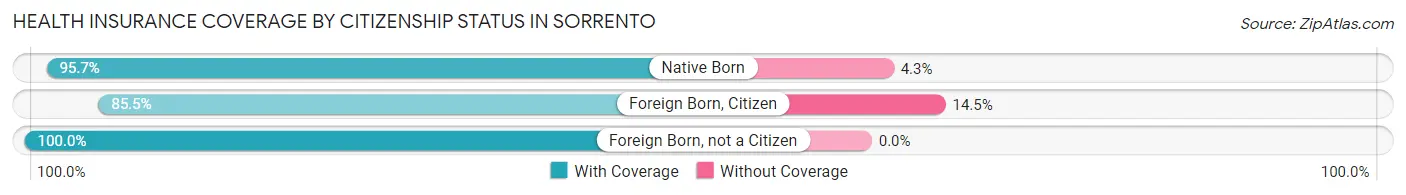
| Citizenship Status | With Coverage | Without Coverage |
| Native Born | 89 (95.7%) | 4 (4.3%) |
| Foreign Born, Citizen | 283 (85.5%) | 48 (14.5%) |
| Foreign Born, not a Citizen | 201 (100.0%) | 0 (0.0%) |
Health Insurance Coverage by Household Income in Sorrento
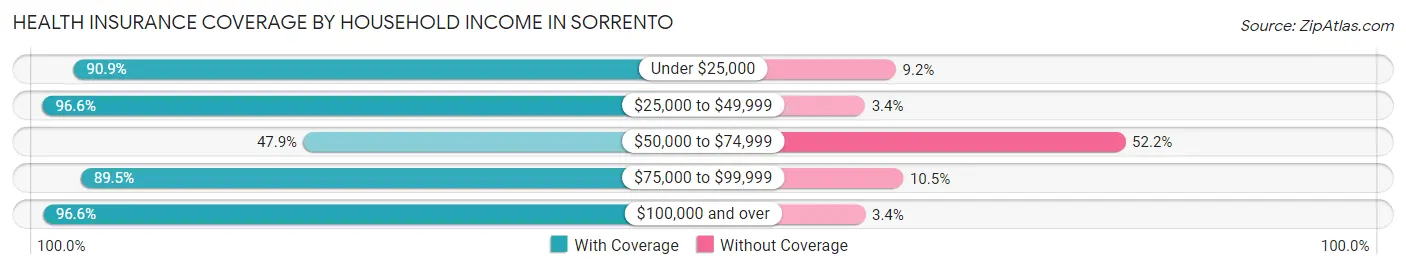
| Household Income | With Coverage | Without Coverage |
| Under $25,000 | 139 (90.8%) | 14 (9.1%) |
| $25,000 to $49,999 | 316 (96.6%) | 11 (3.4%) |
| $50,000 to $74,999 | 89 (47.8%) | 97 (52.1%) |
| $75,000 to $99,999 | 153 (89.5%) | 18 (10.5%) |
| $100,000 and over | 1,045 (96.6%) | 37 (3.4%) |
Public vs Private Health Insurance Coverage by Age in Sorrento
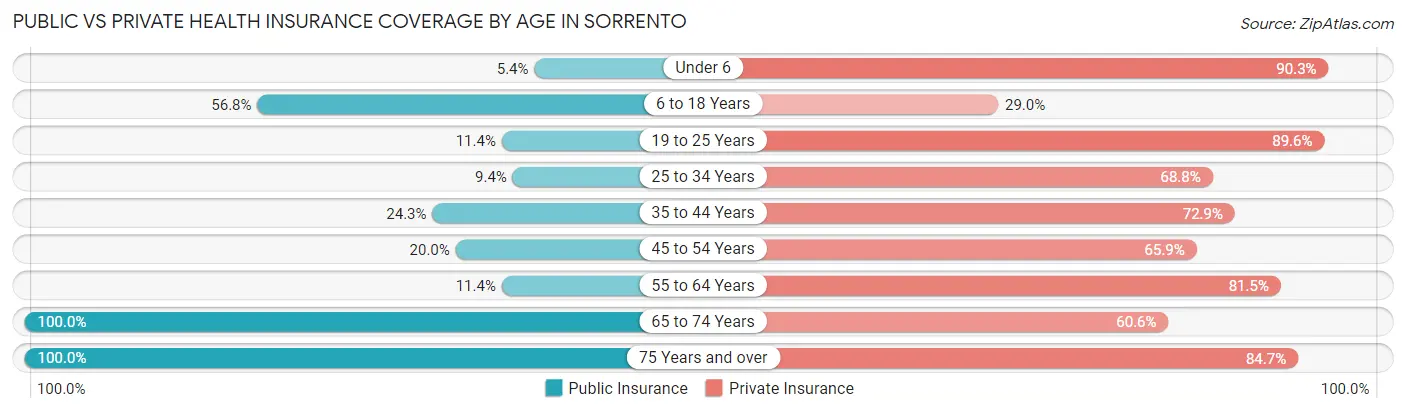
| Age Bracket | Public Insurance | Private Insurance |
| Under 6 | 5 (5.4%) | 84 (90.3%) |
| 6 to 18 Years | 188 (56.8%) | 96 (29.0%) |
| 19 to 25 Years | 23 (11.4%) | 180 (89.5%) |
| 25 to 34 Years | 19 (9.4%) | 139 (68.8%) |
| 35 to 44 Years | 53 (24.3%) | 159 (72.9%) |
| 45 to 54 Years | 41 (20.0%) | 135 (65.8%) |
| 55 to 64 Years | 42 (11.4%) | 299 (81.5%) |
| 65 to 74 Years | 165 (100.0%) | 100 (60.6%) |
| 75 Years and over | 137 (100.0%) | 116 (84.7%) |
| Total | 673 (35.1%) | 1,308 (68.2%) |
Disability Status by Sex by Age in Sorrento
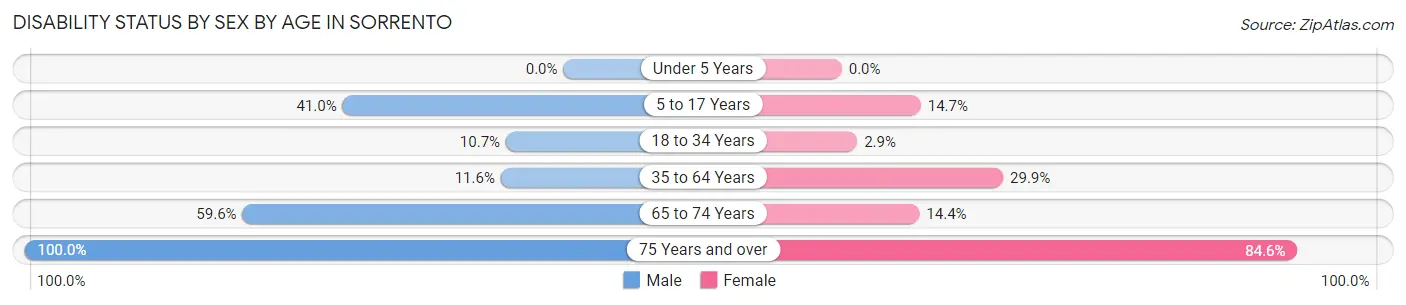
| Age Bracket | Male | Female |
| Under 5 Years | 0 (0.0%) | 0 (0.0%) |
| 5 to 17 Years | 84 (41.0%) | 11 (14.7%) |
| 18 to 34 Years | 21 (10.7%) | 8 (2.9%) |
| 35 to 64 Years | 53 (11.6%) | 100 (29.9%) |
| 65 to 74 Years | 28 (59.6%) | 17 (14.4%) |
| 75 Years and over | 14 (100.0%) | 104 (84.6%) |
Disability Class by Sex by Age in Sorrento
Disability Class: Hearing Difficulty
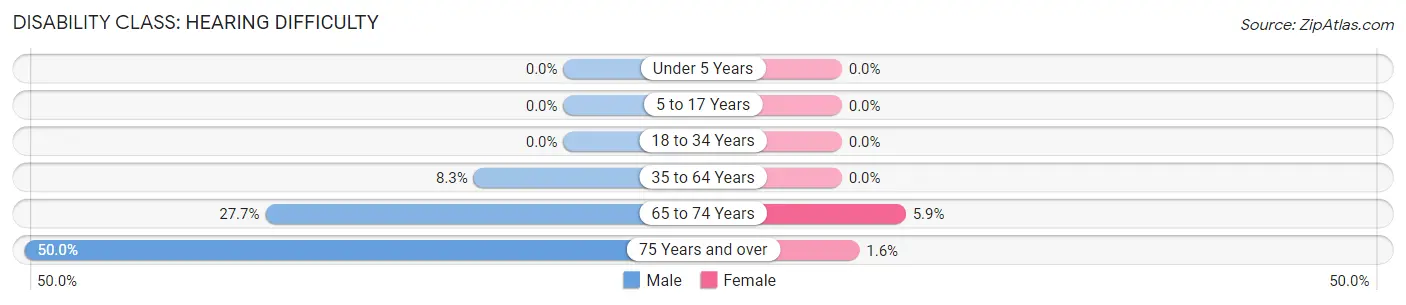
| Age Bracket | Male | Female |
| Under 5 Years | 0 (0.0%) | 0 (0.0%) |
| 5 to 17 Years | 0 (0.0%) | 0 (0.0%) |
| 18 to 34 Years | 0 (0.0%) | 0 (0.0%) |
| 35 to 64 Years | 38 (8.3%) | 0 (0.0%) |
| 65 to 74 Years | 13 (27.7%) | 7 (5.9%) |
| 75 Years and over | 7 (50.0%) | 2 (1.6%) |
Disability Class: Vision Difficulty
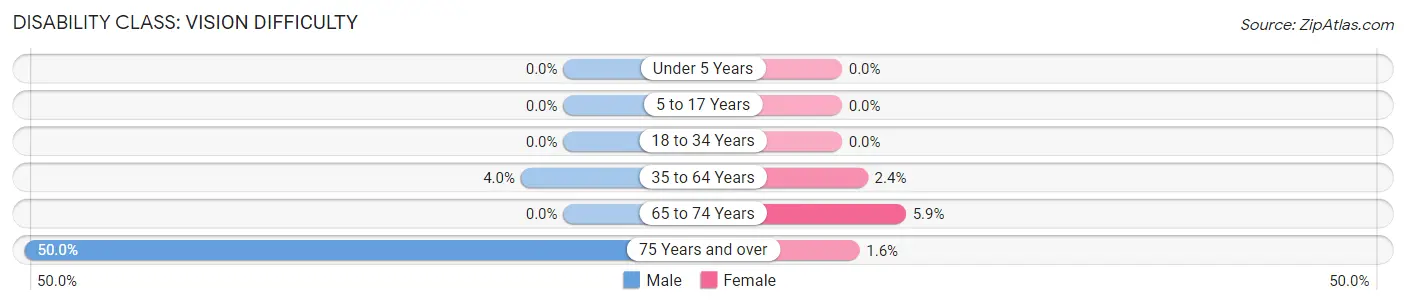
| Age Bracket | Male | Female |
| Under 5 Years | 0 (0.0%) | 0 (0.0%) |
| 5 to 17 Years | 0 (0.0%) | 0 (0.0%) |
| 18 to 34 Years | 0 (0.0%) | 0 (0.0%) |
| 35 to 64 Years | 18 (4.0%) | 8 (2.4%) |
| 65 to 74 Years | 0 (0.0%) | 7 (5.9%) |
| 75 Years and over | 7 (50.0%) | 2 (1.6%) |
Disability Class: Cognitive Difficulty
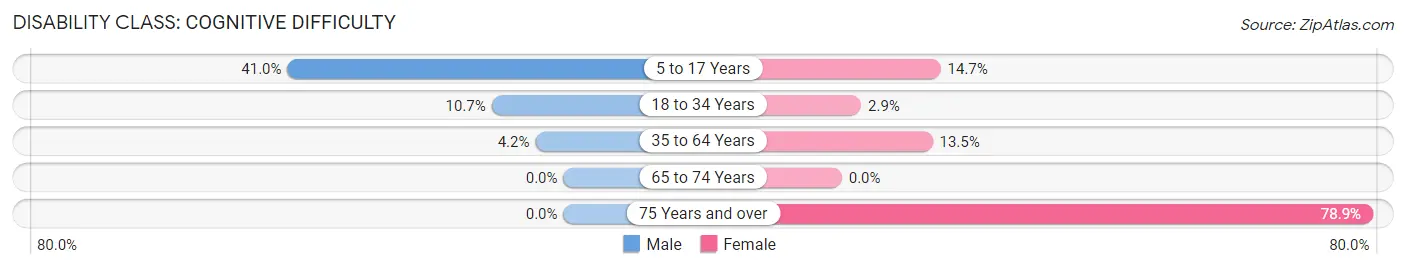
| Age Bracket | Male | Female |
| 5 to 17 Years | 84 (41.0%) | 11 (14.7%) |
| 18 to 34 Years | 21 (10.7%) | 8 (2.9%) |
| 35 to 64 Years | 19 (4.2%) | 45 (13.5%) |
| 65 to 74 Years | 0 (0.0%) | 0 (0.0%) |
| 75 Years and over | 0 (0.0%) | 97 (78.9%) |
Disability Class: Ambulatory Difficulty
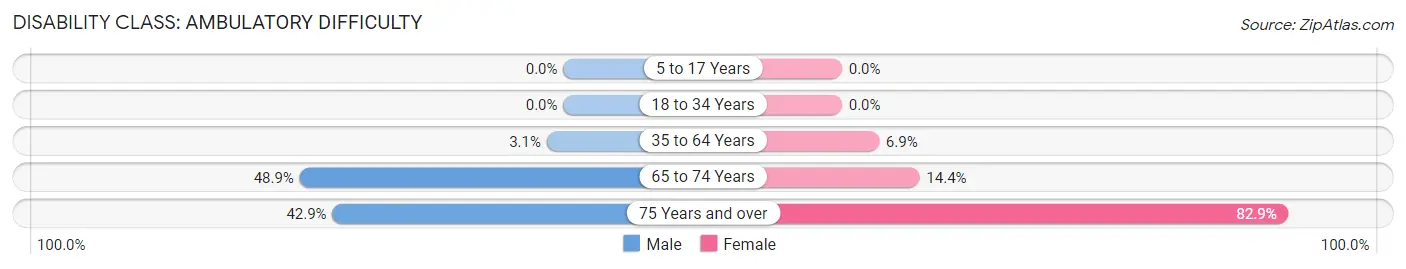
| Age Bracket | Male | Female |
| 5 to 17 Years | 0 (0.0%) | 0 (0.0%) |
| 18 to 34 Years | 0 (0.0%) | 0 (0.0%) |
| 35 to 64 Years | 14 (3.1%) | 23 (6.9%) |
| 65 to 74 Years | 23 (48.9%) | 17 (14.4%) |
| 75 Years and over | 6 (42.9%) | 102 (82.9%) |
Disability Class: Self-Care Difficulty
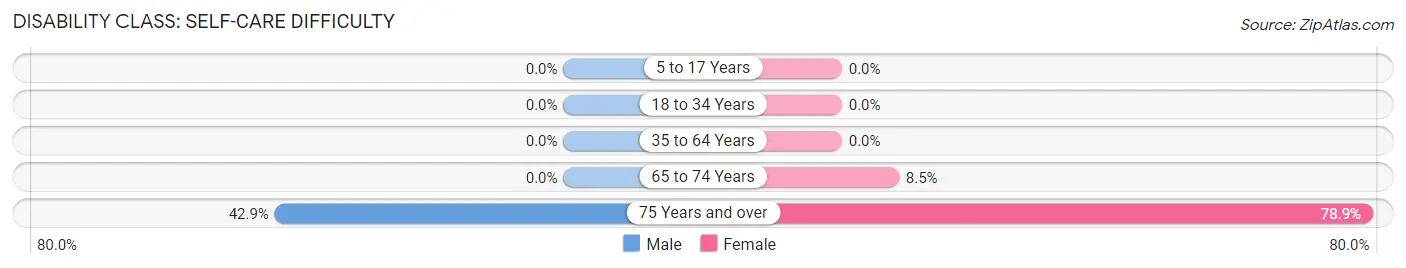
| Age Bracket | Male | Female |
| 5 to 17 Years | 0 (0.0%) | 0 (0.0%) |
| 18 to 34 Years | 0 (0.0%) | 0 (0.0%) |
| 35 to 64 Years | 0 (0.0%) | 0 (0.0%) |
| 65 to 74 Years | 0 (0.0%) | 10 (8.5%) |
| 75 Years and over | 6 (42.9%) | 97 (78.9%) |
Technology Access in Sorrento
Computing Device Access in Sorrento
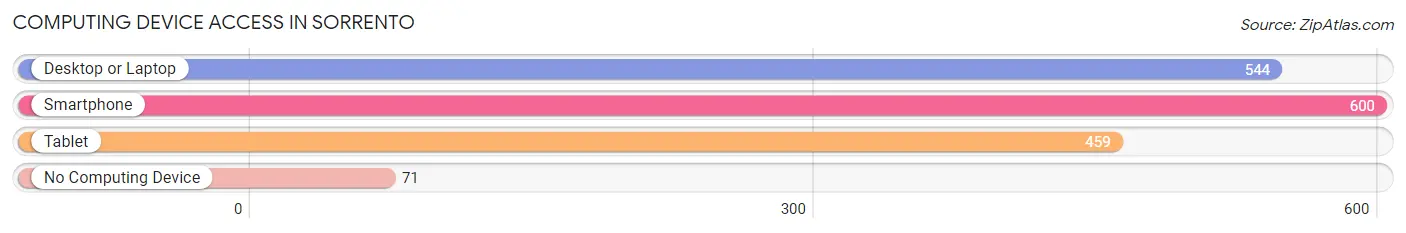
| Device Type | # Households | % Households |
| Desktop or Laptop | 544 | 78.7% |
| Smartphone | 600 | 86.8% |
| Tablet | 459 | 66.4% |
| No Computing Device | 71 | 10.3% |
| Total | 691 | 100.0% |
Internet Access in Sorrento
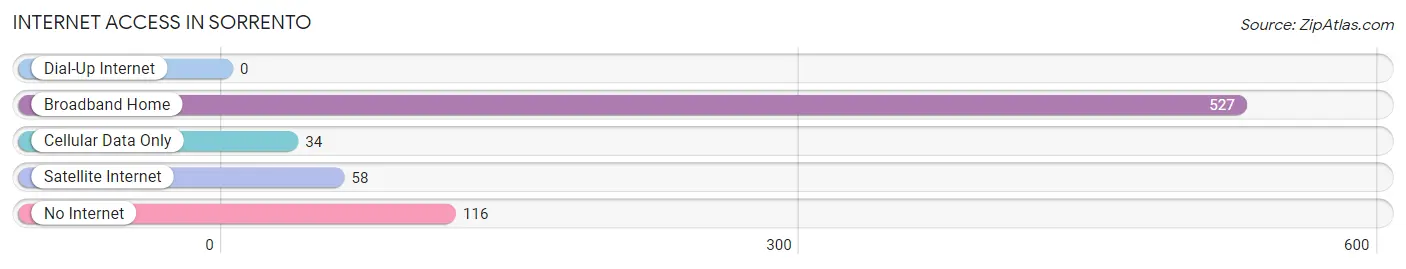
| Internet Type | # Households | % Households |
| Dial-Up Internet | 0 | 0.0% |
| Broadband Home | 527 | 76.3% |
| Cellular Data Only | 34 | 4.9% |
| Satellite Internet | 58 | 8.4% |
| No Internet | 116 | 16.8% |
| Total | 691 | 100.0% |
Sorrento Summary
Sorrento is a small town located in Ascension Parish, Louisiana. It is situated on the banks of the Amite River, about 25 miles east of Baton Rouge. The town has a population of approximately 2,500 people and is part of the Baton Rouge Metropolitan Statistical Area.
History
Sorrento was founded in 1817 by a group of French settlers who were looking for a place to settle and start a new life. The town was named after the Italian city of Sorrento, which was the birthplace of one of the settlers. The town was originally a farming community, but it soon developed into a small trading center. In 1820, the first post office was established in Sorrento.
In the late 19th century, Sorrento began to experience a period of growth and development. The town was incorporated in 1891 and the first mayor was elected in 1892. During this time, the town saw the construction of several churches, a school, and a railroad line.
In the early 20th century, Sorrento experienced a period of decline. The railroad line was abandoned and the town’s population began to decline. However, in the late 20th century, the town began to experience a period of revitalization. The town was designated as a Main Street Community in 2000 and has since seen an increase in population and economic activity.
Geography
Sorrento is located in Ascension Parish, Louisiana. It is situated on the banks of the Amite River, about 25 miles east of Baton Rouge. The town has a total area of 1.3 square miles, all of which is land. The town is located in a humid subtropical climate zone and experiences hot, humid summers and mild winters.
Economy
Sorrento’s economy is largely based on agriculture and manufacturing. The town is home to several small businesses, including a lumber mill, a feed mill, and a furniture factory. The town also has a number of retail stores, restaurants, and other services.
Demographics
As of the 2010 census, Sorrento had a population of 2,500 people. The racial makeup of the town was 79.2% White, 17.2% African American, 0.8% Native American, 0.4% Asian, 0.2% Pacific Islander, and 2.4% from other races. The median household income was $37,500 and the median family income was $45,000.
Conclusion
Sorrento is a small town located in Ascension Parish, Louisiana. It is situated on the banks of the Amite River, about 25 miles east of Baton Rouge. The town has a population of approximately 2,500 people and is part of the Baton Rouge Metropolitan Statistical Area. Sorrento’s economy is largely based on agriculture and manufacturing and the town has a number of retail stores, restaurants, and other services. As of the 2010 census, Sorrento had a population of 2,500 people, with a median household income of $37,500 and a median family income of $45,000.
Common Questions
What is Per Capita Income in Sorrento?
Per Capita income in Sorrento is $36,715.
What is the Median Family Income in Sorrento?
Median Family Income in Sorrento is $118,315.
What is the Median Household income in Sorrento?
Median Household Income in Sorrento is $94,766.
What is Income or Wage Gap in Sorrento?
Income or Wage Gap in Sorrento is 42.5%.
Women in Sorrento earn 57.5 cents for every dollar earned by a man.
What is Inequality or Gini Index in Sorrento?
Inequality or Gini Index in Sorrento is 0.35.
What is the Total Population of Sorrento?
Total Population of Sorrento is 1,919.
What is the Total Male Population of Sorrento?
Total Male Population of Sorrento is 964.
What is the Total Female Population of Sorrento?
Total Female Population of Sorrento is 955.
What is the Ratio of Males per 100 Females in Sorrento?
There are 100.94 Males per 100 Females in Sorrento.
What is the Ratio of Females per 100 Males in Sorrento?
There are 99.07 Females per 100 Males in Sorrento.
What is the Median Population Age in Sorrento?
Median Population Age in Sorrento is 38.9 Years.
What is the Average Family Size in Sorrento
Average Family Size in Sorrento is 3.3 People.
What is the Average Household Size in Sorrento
Average Household Size in Sorrento is 2.8 People.
How Large is the Labor Force in Sorrento?
There are 1,058 People in the Labor Forcein in Sorrento.
What is the Percentage of People in the Labor Force in Sorrento?
64.6% of People are in the Labor Force in Sorrento.
What is the Unemployment Rate in Sorrento?
Unemployment Rate in Sorrento is 4.1%.