St Joseph, LA Map & Demographics
St Joseph Map
St Joseph Overview
$24,883
PER CAPITA INCOME
$39,375
AVG FAMILY INCOME
$34,643
AVG HOUSEHOLD INCOME
$13,091
FAMILY INCOME DEFICIT
0.60
INEQUALITY / GINI INDEX
776
TOTAL POPULATION
353
MALE POPULATION
423
FEMALE POPULATION
83.45
MALES / 100 FEMALES
119.83
FEMALES / 100 MALES
49.5
MEDIAN AGE
4.2
AVG FAMILY SIZE
2.5
AVG HOUSEHOLD SIZE
257
LABOR FORCE [ PEOPLE ]
42.9%
PERCENT IN LABOR FORCE
8.2%
UNEMPLOYMENT RATE
Income in St Joseph
Income Overview in St Joseph
Per Capita Income in St Joseph is $24,883, while median incomes of families and households are $39,375 and $34,643 respectively.
| Characteristic | Number | Measure |
| Per Capita Income | 776 | $24,883 |
| Median Family Income | 137 | $39,375 |
| Mean Family Income | 137 | $46,026 |
| Median Household Income | 302 | $34,643 |
| Mean Household Income | 302 | $59,099 |
| Income Deficit | 137 | $13,091 |
| Wage / Income Gap (%) | 776 | 0.00% |
| Wage / Income Gap ($) | 776 | 100.00¢ per $1 |
| Gini / Inequality Index | 776 | 0.60 |
Earnings by Sex in St Joseph
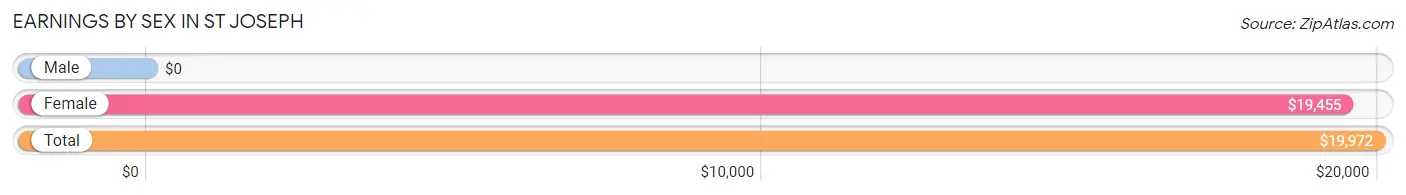
| Sex | Number | Average Earnings |
| Male | 118 (46.3%) | $0 |
| Female | 137 (53.7%) | $19,455 |
| Total | 255 (100.0%) | $19,972 |
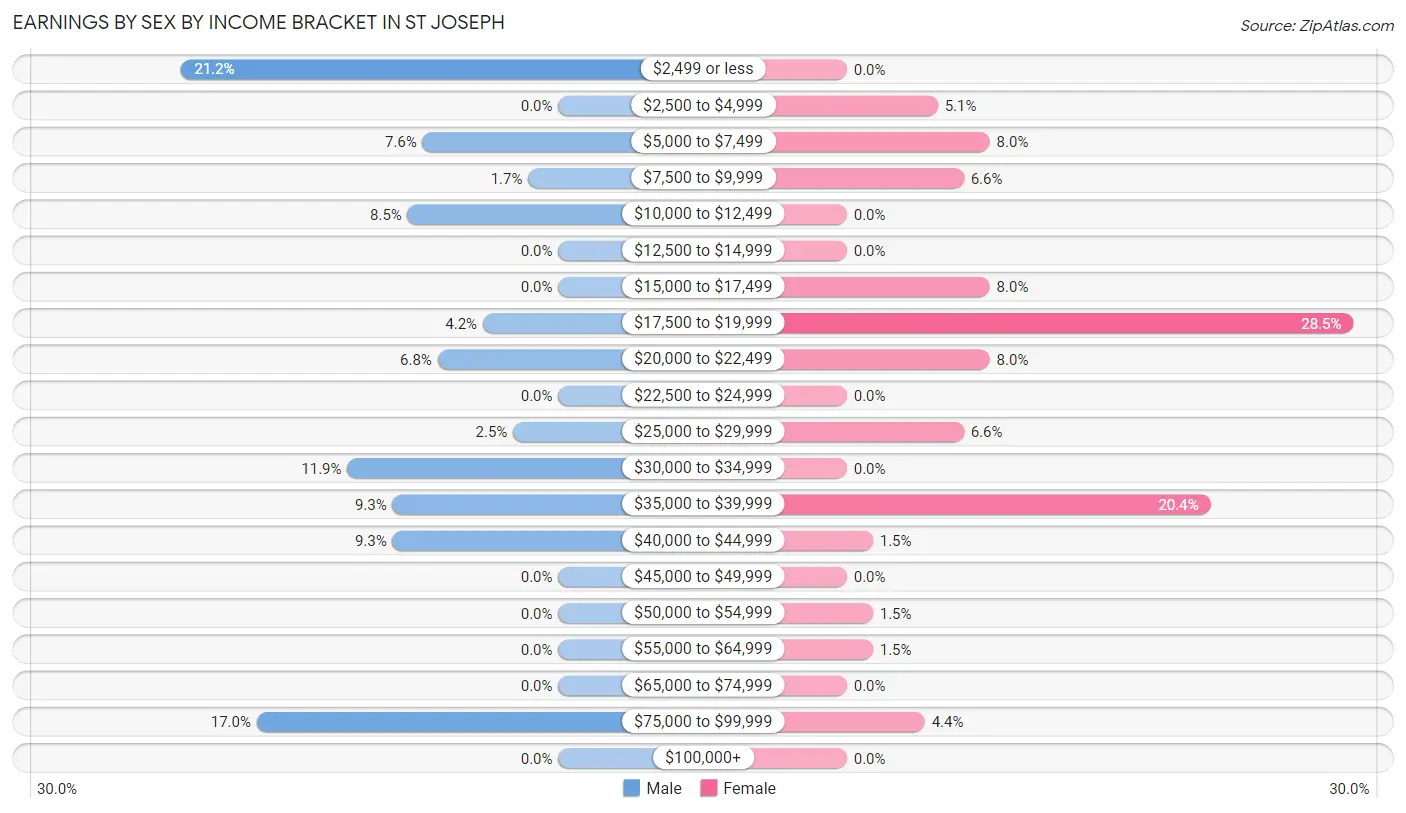
Earnings by Sex by Income Bracket in St Joseph
The most common earnings brackets in St Joseph are $2,499 or less for men (25 | 21.2%) and $17,500 to $19,999 for women (39 | 28.5%).
| Income | Male | Female |
| $2,499 or less | 25 (21.2%) | 0 (0.0%) |
| $2,500 to $4,999 | 0 (0.0%) | 7 (5.1%) |
| $5,000 to $7,499 | 9 (7.6%) | 11 (8.0%) |
| $7,500 to $9,999 | 2 (1.7%) | 9 (6.6%) |
| $10,000 to $12,499 | 10 (8.5%) | 0 (0.0%) |
| $12,500 to $14,999 | 0 (0.0%) | 0 (0.0%) |
| $15,000 to $17,499 | 0 (0.0%) | 11 (8.0%) |
| $17,500 to $19,999 | 5 (4.2%) | 39 (28.5%) |
| $20,000 to $22,499 | 8 (6.8%) | 11 (8.0%) |
| $22,500 to $24,999 | 0 (0.0%) | 0 (0.0%) |
| $25,000 to $29,999 | 3 (2.5%) | 9 (6.6%) |
| $30,000 to $34,999 | 14 (11.9%) | 0 (0.0%) |
| $35,000 to $39,999 | 11 (9.3%) | 28 (20.4%) |
| $40,000 to $44,999 | 11 (9.3%) | 2 (1.5%) |
| $45,000 to $49,999 | 0 (0.0%) | 0 (0.0%) |
| $50,000 to $54,999 | 0 (0.0%) | 2 (1.5%) |
| $55,000 to $64,999 | 0 (0.0%) | 2 (1.5%) |
| $65,000 to $74,999 | 0 (0.0%) | 0 (0.0%) |
| $75,000 to $99,999 | 20 (17.0%) | 6 (4.4%) |
| $100,000+ | 0 (0.0%) | 0 (0.0%) |
| Total | 118 (100.0%) | 137 (100.0%) |
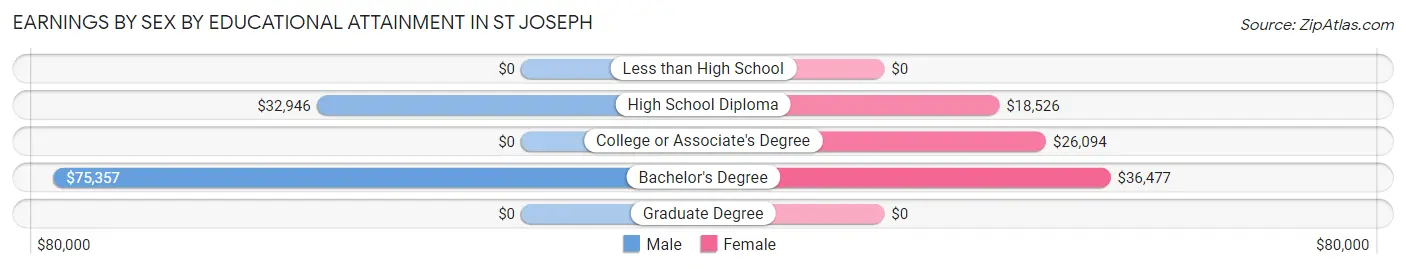
Earnings by Sex by Educational Attainment in St Joseph
Average earnings in St Joseph are $34,196 for men and $19,712 for women, a difference of 42.4%. Men with an educational attainment of bachelor's degree enjoy the highest average annual earnings of $75,357, while those with high school diploma education earn the least with $32,946. Women with an educational attainment of bachelor's degree earn the most with the average annual earnings of $36,477, while those with high school diploma education have the smallest earnings of $18,526.
| Educational Attainment | Male Income | Female Income |
| Less than High School | - | - |
| High School Diploma | $32,946 | $18,526 |
| College or Associate's Degree | - | - |
| Bachelor's Degree | $75,357 | $36,477 |
| Graduate Degree | - | - |
| Total | $34,196 | $19,712 |
Family Income in St Joseph
Family Income Brackets in St Joseph
According to the St Joseph family income data, there are 28 families falling into the less than $10,000 income range, which is the most common income bracket and makes up 20.4% of all families.
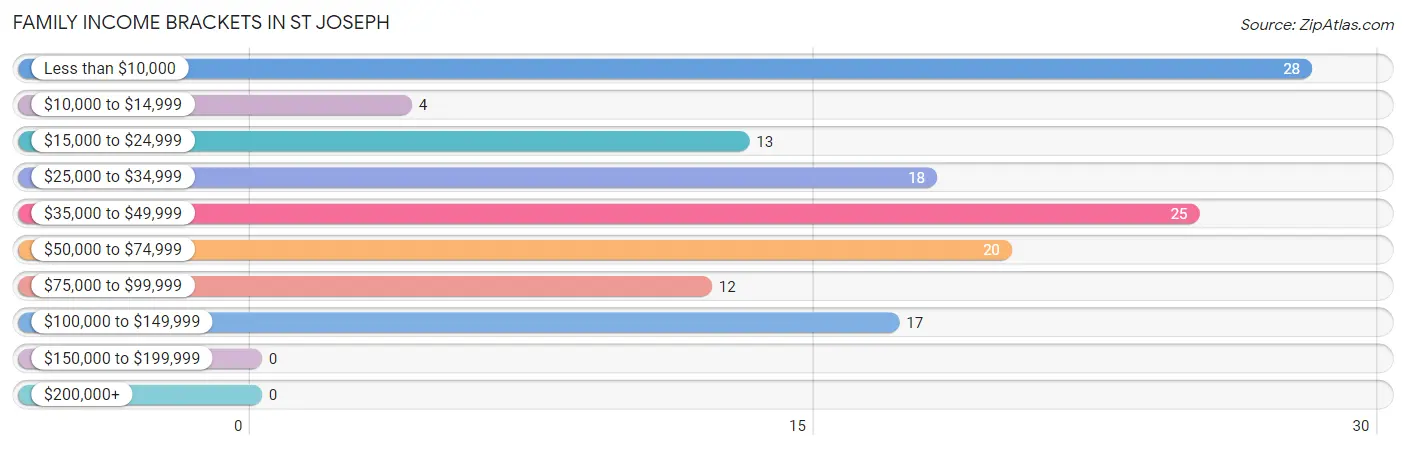
| Income Bracket | # Families | % Families |
| Less than $10,000 | 28 | 20.4% |
| $10,000 to $14,999 | 4 | 2.9% |
| $15,000 to $24,999 | 13 | 9.5% |
| $25,000 to $34,999 | 18 | 13.1% |
| $35,000 to $49,999 | 25 | 18.2% |
| $50,000 to $74,999 | 20 | 14.6% |
| $75,000 to $99,999 | 12 | 8.8% |
| $100,000 to $149,999 | 17 | 12.4% |
| $150,000 to $199,999 | 0 | 0.0% |
| $200,000+ | 0 | 0.0% |
Family Income by Famaliy Size in St Joseph
2-person families (71 | 51.8%) account for the highest median family income in St Joseph with $41,181 per family, while 2-person families (71 | 51.8%) have the highest median income of $20,590 per family member.
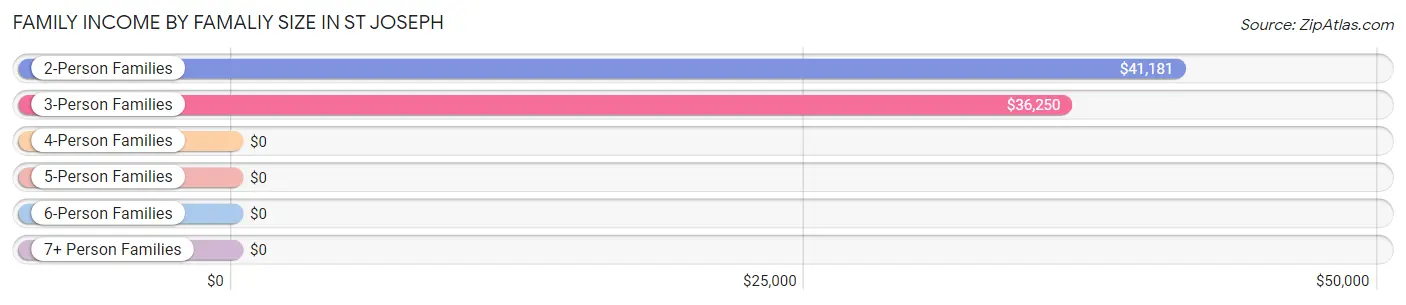
| Income Bracket | # Families | Median Income |
| 2-Person Families | 71 (51.8%) | $41,181 |
| 3-Person Families | 56 (40.9%) | $36,250 |
| 4-Person Families | 0 (0.0%) | $0 |
| 5-Person Families | 0 (0.0%) | $0 |
| 6-Person Families | 0 (0.0%) | $0 |
| 7+ Person Families | 10 (7.3%) | $0 |
| Total | 137 (100.0%) | $39,375 |
Family Income by Number of Earners in St Joseph
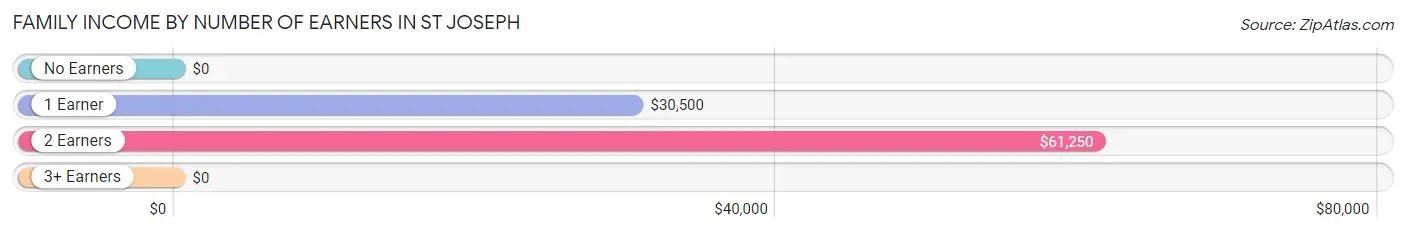
| Number of Earners | # Families | Median Income |
| No Earners | 34 (24.8%) | $0 |
| 1 Earner | 62 (45.3%) | $30,500 |
| 2 Earners | 38 (27.7%) | $61,250 |
| 3+ Earners | 3 (2.2%) | $0 |
| Total | 137 (100.0%) | $39,375 |
Household Income in St Joseph
Household Income Brackets in St Joseph
With 91 households falling in the category, the $35,000 to $49,999 income range is the most frequent in St Joseph, accounting for 30.1% of all households.
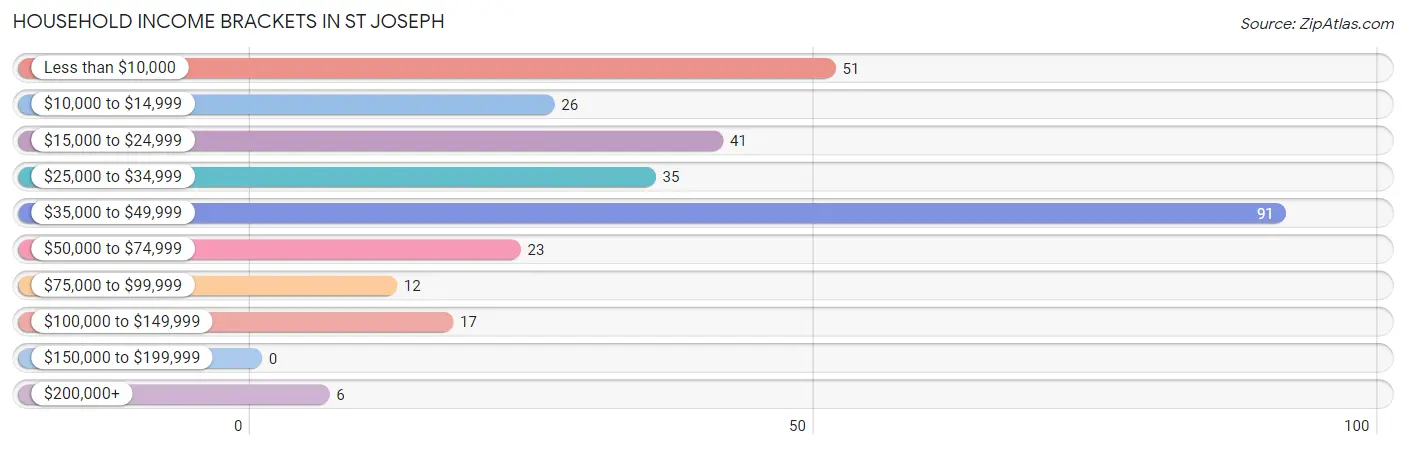
| Income Bracket | # Households | % Households |
| Less than $10,000 | 51 | 16.9% |
| $10,000 to $14,999 | 26 | 8.6% |
| $15,000 to $24,999 | 41 | 13.6% |
| $25,000 to $34,999 | 35 | 11.6% |
| $35,000 to $49,999 | 91 | 30.1% |
| $50,000 to $74,999 | 23 | 7.6% |
| $75,000 to $99,999 | 12 | 4.0% |
| $100,000 to $149,999 | 17 | 5.6% |
| $150,000 to $199,999 | 0 | 0.0% |
| $200,000+ | 6 | 2.0% |
Household Income by Householder Age in St Joseph
The median household income in St Joseph is $34,643, with the highest median household income of $40,962 found in the 65+ years age bracket for the primary householder. A total of 112 households (37.1%) fall into this category.
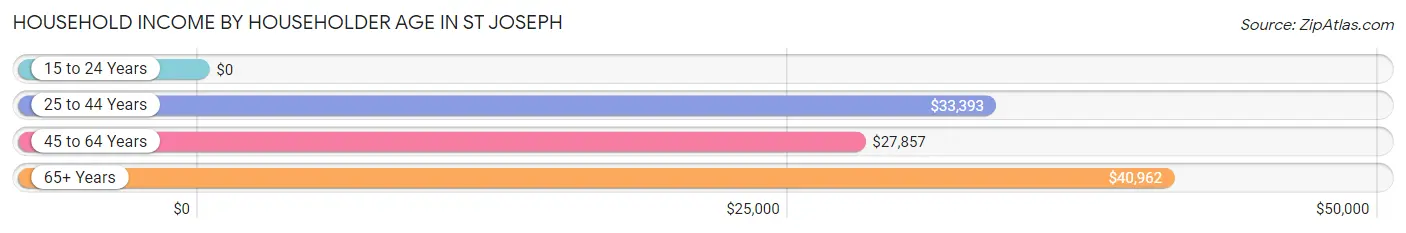
| Income Bracket | # Households | Median Income |
| 15 to 24 Years | 0 (0.0%) | $0 |
| 25 to 44 Years | 50 (16.6%) | $33,393 |
| 45 to 64 Years | 140 (46.4%) | $27,857 |
| 65+ Years | 112 (37.1%) | $40,962 |
| Total | 302 (100.0%) | $34,643 |
Poverty in St Joseph
Income Below Poverty by Sex and Age in St Joseph
With 32.5% poverty level for males and 36.9% for females among the residents of St Joseph, 5 year old males and under 5 year old females are the most vulnerable to poverty, with 17 males (100.0%) and 11 females (100.0%) in their respective age groups living below the poverty level.
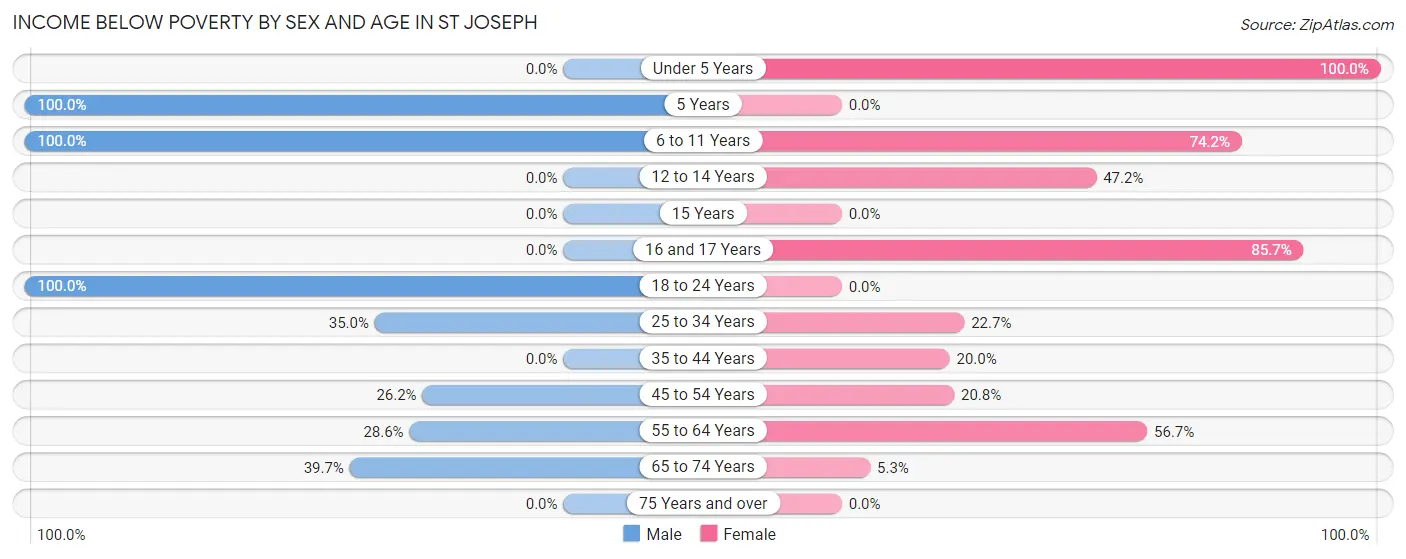
| Age Bracket | Male | Female |
| Under 5 Years | 0 (0.0%) | 11 (100.0%) |
| 5 Years | 17 (100.0%) | 0 (0.0%) |
| 6 to 11 Years | 3 (100.0%) | 49 (74.2%) |
| 12 to 14 Years | 0 (0.0%) | 17 (47.2%) |
| 15 Years | 0 (0.0%) | 0 (0.0%) |
| 16 and 17 Years | 0 (0.0%) | 12 (85.7%) |
| 18 to 24 Years | 17 (100.0%) | 0 (0.0%) |
| 25 to 34 Years | 7 (35.0%) | 10 (22.7%) |
| 35 to 44 Years | 0 (0.0%) | 9 (20.0%) |
| 45 to 54 Years | 17 (26.2%) | 10 (20.8%) |
| 55 to 64 Years | 24 (28.6%) | 34 (56.7%) |
| 65 to 74 Years | 23 (39.7%) | 4 (5.3%) |
| 75 Years and over | 0 (0.0%) | 0 (0.0%) |
| Total | 108 (32.5%) | 156 (36.9%) |
Income Above Poverty by Sex and Age in St Joseph
According to the poverty statistics in St Joseph, males aged 12 to 14 years and females aged 18 to 24 years are the age groups that are most secure financially, with 100.0% of males and 100.0% of females in these age groups living above the poverty line.
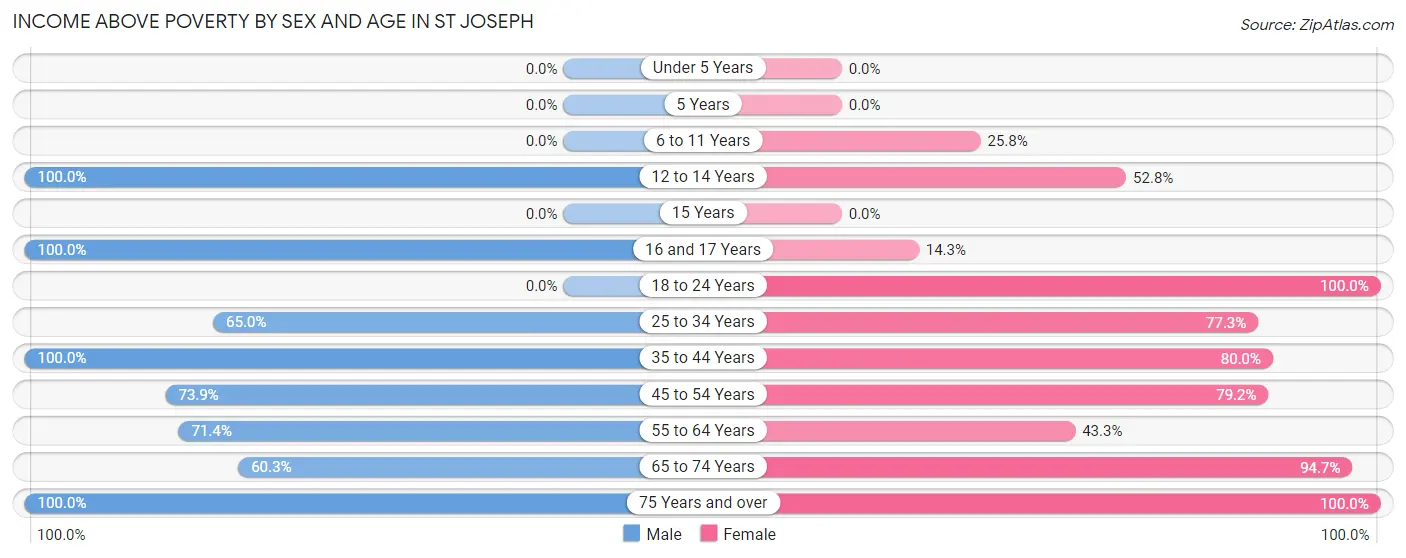
| Age Bracket | Male | Female |
| Under 5 Years | 0 (0.0%) | 0 (0.0%) |
| 5 Years | 0 (0.0%) | 0 (0.0%) |
| 6 to 11 Years | 0 (0.0%) | 17 (25.8%) |
| 12 to 14 Years | 29 (100.0%) | 19 (52.8%) |
| 15 Years | 0 (0.0%) | 0 (0.0%) |
| 16 and 17 Years | 8 (100.0%) | 2 (14.3%) |
| 18 to 24 Years | 0 (0.0%) | 8 (100.0%) |
| 25 to 34 Years | 13 (65.0%) | 34 (77.3%) |
| 35 to 44 Years | 14 (100.0%) | 36 (80.0%) |
| 45 to 54 Years | 48 (73.9%) | 38 (79.2%) |
| 55 to 64 Years | 60 (71.4%) | 26 (43.3%) |
| 65 to 74 Years | 35 (60.3%) | 72 (94.7%) |
| 75 Years and over | 17 (100.0%) | 15 (100.0%) |
| Total | 224 (67.5%) | 267 (63.1%) |
Income Below Poverty Among Married-Couple Families in St Joseph
The poverty statistics for married-couple families in St Joseph show that 23.5% or 19 of the total 81 families live below the poverty line. Families with 1 or 2 children have the highest poverty rate of 44.4%, comprising of 8 families. On the other hand, families with no children have the lowest poverty rate of 17.5%, which includes 11 families.
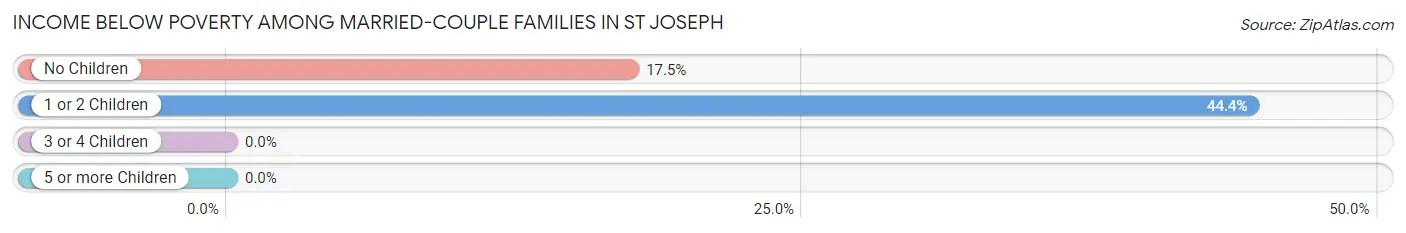
| Children | Above Poverty | Below Poverty |
| No Children | 52 (82.5%) | 11 (17.5%) |
| 1 or 2 Children | 10 (55.6%) | 8 (44.4%) |
| 3 or 4 Children | 0 (0.0%) | 0 (0.0%) |
| 5 or more Children | 0 (0.0%) | 0 (0.0%) |
| Total | 62 (76.5%) | 19 (23.5%) |
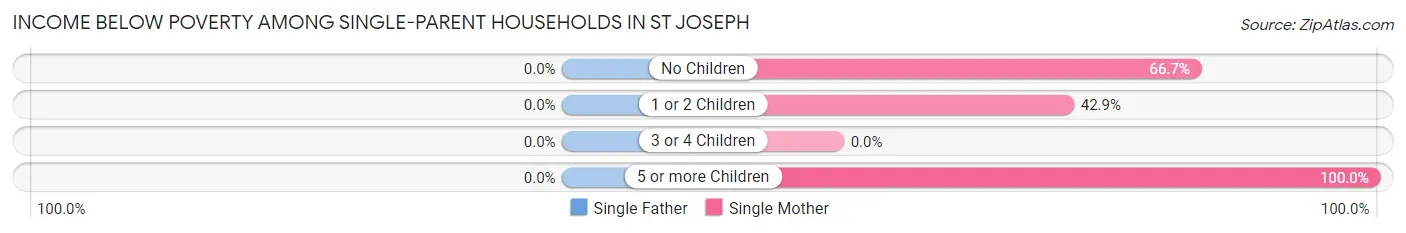
Income Below Poverty Among Single-Parent Households in St Joseph
| Children | Single Father | Single Mother |
| No Children | 0 (0.0%) | 10 (66.7%) |
| 1 or 2 Children | 0 (0.0%) | 6 (42.9%) |
| 3 or 4 Children | 0 (0.0%) | 0 (0.0%) |
| 5 or more Children | 0 (0.0%) | 10 (100.0%) |
| Total | 0 (0.0%) | 26 (66.7%) |
Income Below Poverty Among Married-Couple vs Single-Parent Households in St Joseph
The poverty data for St Joseph shows that 19 of the married-couple family households (23.5%) and 26 of the single-parent households (46.4%) are living below the poverty level. Within the married-couple family households, those with 1 or 2 children have the highest poverty rate, with 8 households (44.4%) falling below the poverty line. Among the single-parent households, those with 5 or more children have the highest poverty rate, with 10 household (100.0%) living below poverty.
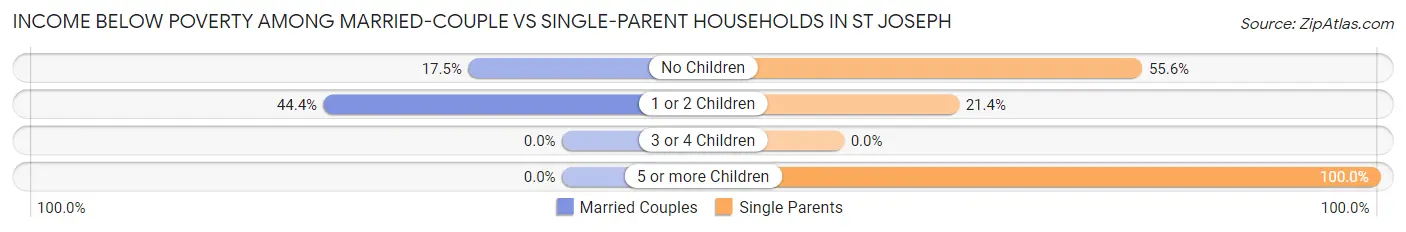
| Children | Married-Couple Families | Single-Parent Households |
| No Children | 11 (17.5%) | 10 (55.6%) |
| 1 or 2 Children | 8 (44.4%) | 6 (21.4%) |
| 3 or 4 Children | 0 (0.0%) | 0 (0.0%) |
| 5 or more Children | 0 (0.0%) | 10 (100.0%) |
| Total | 19 (23.5%) | 26 (46.4%) |
Race in St Joseph
The most populous races in St Joseph are Black / African American (577 | 74.4%), White / Caucasian (180 | 23.2%), and Two or more Races (19 | 2.5%).
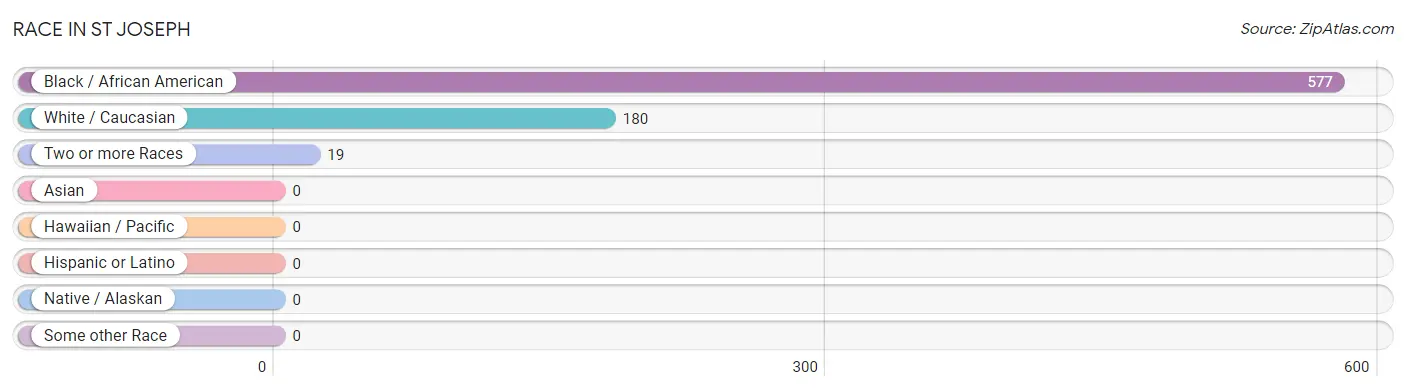
| Race | # Population | % Population |
| Asian | 0 | 0.0% |
| Black / African American | 577 | 74.4% |
| Hawaiian / Pacific | 0 | 0.0% |
| Hispanic or Latino | 0 | 0.0% |
| Native / Alaskan | 0 | 0.0% |
| White / Caucasian | 180 | 23.2% |
| Two or more Races | 19 | 2.5% |
| Some other Race | 0 | 0.0% |
| Total | 776 | 100.0% |
Ancestry in St Joseph
The most populous ancestries reported in St Joseph are American (92 | 11.9%), English (52 | 6.7%), Scottish (46 | 5.9%), French (18 | 2.3%), and Choctaw (2 | 0.3%), together accounting for 27.1% of all St Joseph residents.
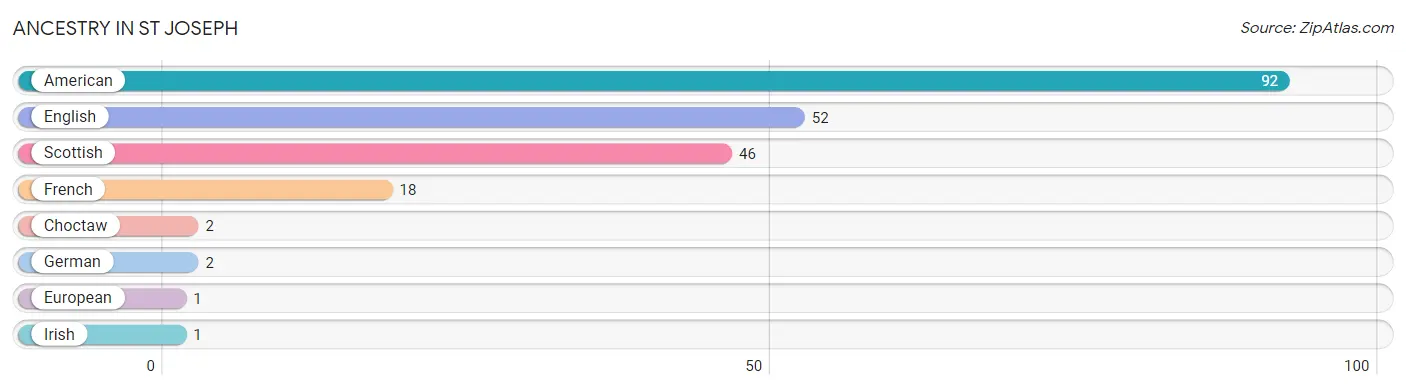
| Ancestry | # Population | % Population |
| American | 92 | 11.9% |
| Choctaw | 2 | 0.3% |
| English | 52 | 6.7% |
| European | 1 | 0.1% |
| French | 18 | 2.3% |
| German | 2 | 0.3% |
| Irish | 1 | 0.1% |
| Scottish | 46 | 5.9% | View All 8 Rows |
Immigrants in St Joseph

| Immigration Origin | # Population | % Population | View All 0 Rows |
Sex and Age in St Joseph
Sex and Age in St Joseph
The most populous age groups in St Joseph are 55 to 59 Years (56 | 15.9%) for men and 70 to 74 Years (56 | 13.2%) for women.
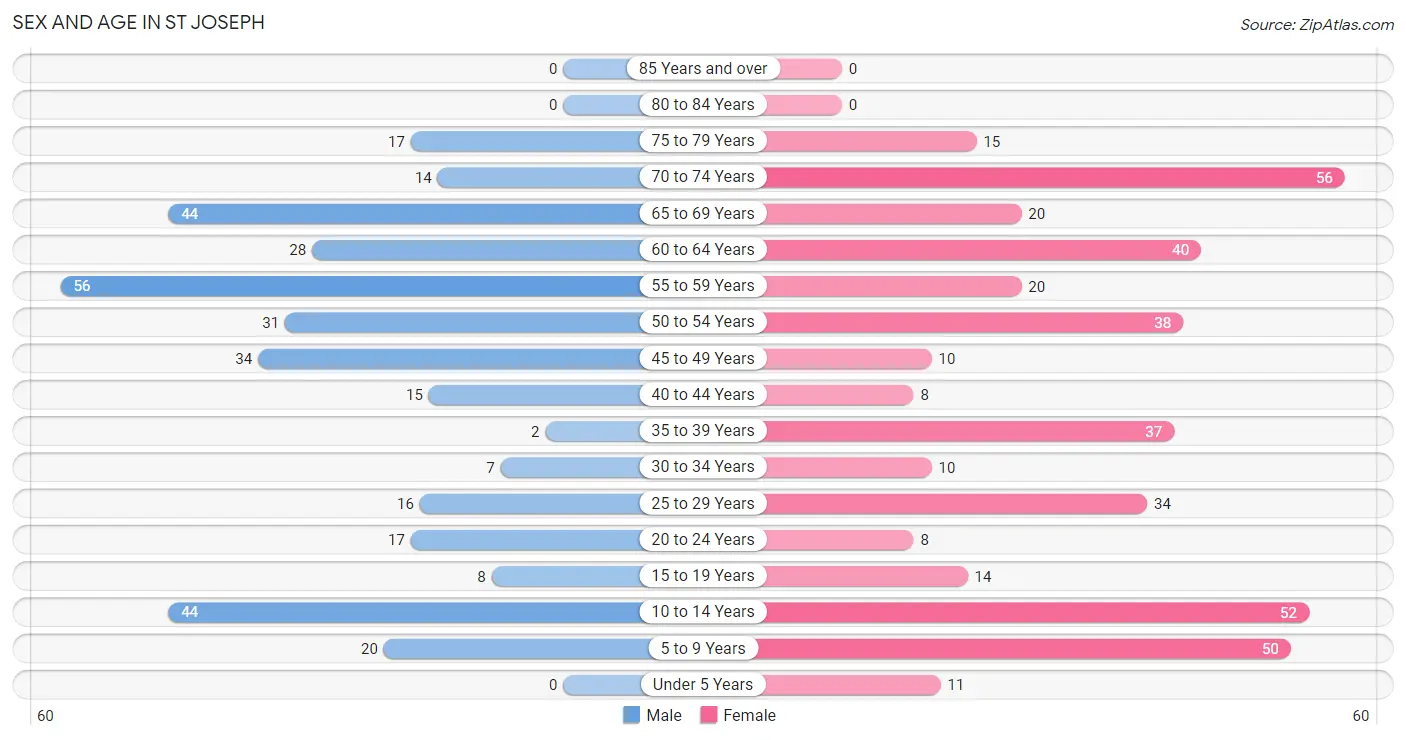
| Age Bracket | Male | Female |
| Under 5 Years | 0 (0.0%) | 11 (2.6%) |
| 5 to 9 Years | 20 (5.7%) | 50 (11.8%) |
| 10 to 14 Years | 44 (12.5%) | 52 (12.3%) |
| 15 to 19 Years | 8 (2.3%) | 14 (3.3%) |
| 20 to 24 Years | 17 (4.8%) | 8 (1.9%) |
| 25 to 29 Years | 16 (4.5%) | 34 (8.0%) |
| 30 to 34 Years | 7 (2.0%) | 10 (2.4%) |
| 35 to 39 Years | 2 (0.6%) | 37 (8.7%) |
| 40 to 44 Years | 15 (4.3%) | 8 (1.9%) |
| 45 to 49 Years | 34 (9.6%) | 10 (2.4%) |
| 50 to 54 Years | 31 (8.8%) | 38 (9.0%) |
| 55 to 59 Years | 56 (15.9%) | 20 (4.7%) |
| 60 to 64 Years | 28 (7.9%) | 40 (9.5%) |
| 65 to 69 Years | 44 (12.5%) | 20 (4.7%) |
| 70 to 74 Years | 14 (4.0%) | 56 (13.2%) |
| 75 to 79 Years | 17 (4.8%) | 15 (3.5%) |
| 80 to 84 Years | 0 (0.0%) | 0 (0.0%) |
| 85 Years and over | 0 (0.0%) | 0 (0.0%) |
| Total | 353 (100.0%) | 423 (100.0%) |
Families and Households in St Joseph
Median Family Size in St Joseph
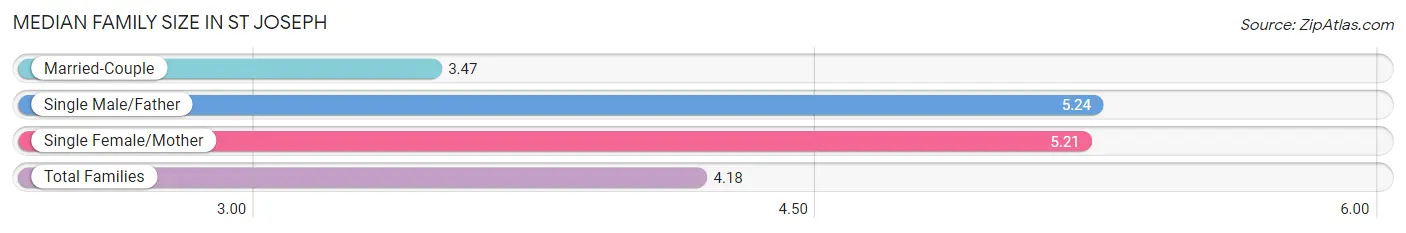
The median family size in St Joseph is 4.18 persons per family, with single male/father families (17 | 12.4%) accounting for the largest median family size of 5.24 persons per family. On the other hand, married-couple families (81 | 59.1%) represent the smallest median family size with 3.47 persons per family.
| Family Type | # Families | Family Size |
| Married-Couple | 81 (59.1%) | 3.47 |
| Single Male/Father | 17 (12.4%) | 5.24 |
| Single Female/Mother | 39 (28.5%) | 5.21 |
| Total Families | 137 (100.0%) | 4.18 |
Median Household Size in St Joseph
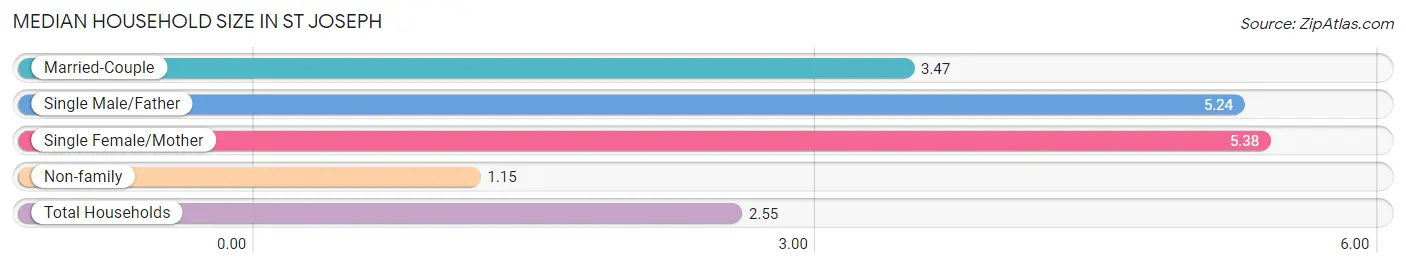
The median household size in St Joseph is 2.55 persons per household, with single female/mother households (39 | 12.9%) accounting for the largest median household size of 5.38 persons per household. non-family households (165 | 54.6%) represent the smallest median household size with 1.15 persons per household.
| Household Type | # Households | Household Size |
| Married-Couple | 81 (26.8%) | 3.47 |
| Single Male/Father | 17 (5.6%) | 5.24 |
| Single Female/Mother | 39 (12.9%) | 5.38 |
| Non-family | 165 (54.6%) | 1.15 |
| Total Households | 302 (100.0%) | 2.55 |
Household Size by Marriage Status in St Joseph
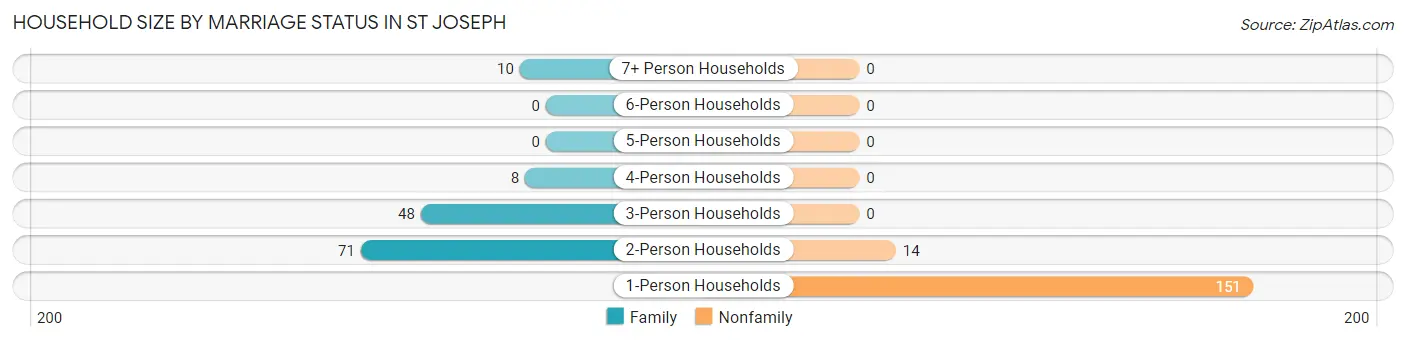
Out of a total of 302 households in St Joseph, 137 (45.4%) are family households, while 165 (54.6%) are nonfamily households. The most numerous type of family households are 2-person households, comprising 71, and the most common type of nonfamily households are 1-person households, comprising 151.
| Household Size | Family Households | Nonfamily Households |
| 1-Person Households | - | 151 (50.0%) |
| 2-Person Households | 71 (23.5%) | 14 (4.6%) |
| 3-Person Households | 48 (15.9%) | 0 (0.0%) |
| 4-Person Households | 8 (2.6%) | 0 (0.0%) |
| 5-Person Households | 0 (0.0%) | 0 (0.0%) |
| 6-Person Households | 0 (0.0%) | 0 (0.0%) |
| 7+ Person Households | 10 (3.3%) | 0 (0.0%) |
| Total | 137 (45.4%) | 165 (54.6%) |
Female Fertility in St Joseph
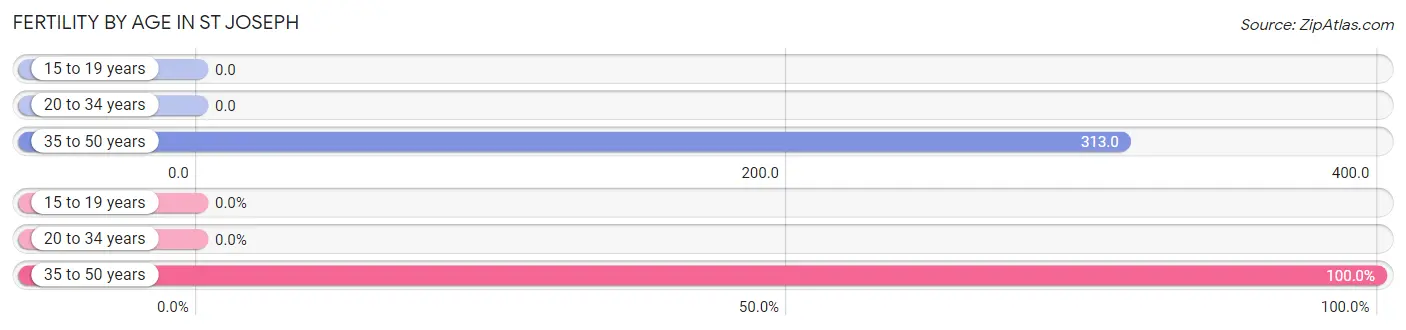
Fertility by Age in St Joseph
Average fertility rate in St Joseph is 174.0 births per 1,000 women. Women in the age bracket of 35 to 50 years have the highest fertility rate with 313.0 births per 1,000 women. Women in the age bracket of 35 to 50 years acount for 100.0% of all women with births.
| Age Bracket | Women with Births | Births / 1,000 Women |
| 15 to 19 years | 0 (0.0%) | 0.0 |
| 20 to 34 years | 0 (0.0%) | 0.0 |
| 35 to 50 years | 26 (100.0%) | 313.0 |
| Total | 26 (100.0%) | 174.0 |
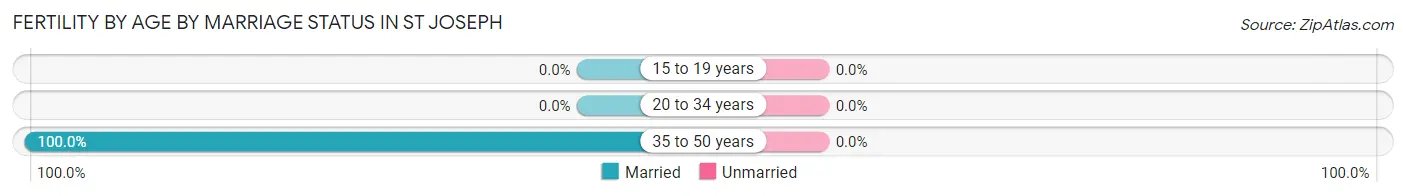
Fertility by Age by Marriage Status in St Joseph
| Age Bracket | Married | Unmarried |
| 15 to 19 years | 0 (0.0%) | 0 (0.0%) |
| 20 to 34 years | 0 (0.0%) | 0 (0.0%) |
| 35 to 50 years | 26 (100.0%) | 0 (0.0%) |
| Total | 26 (100.0%) | 0 (0.0%) |
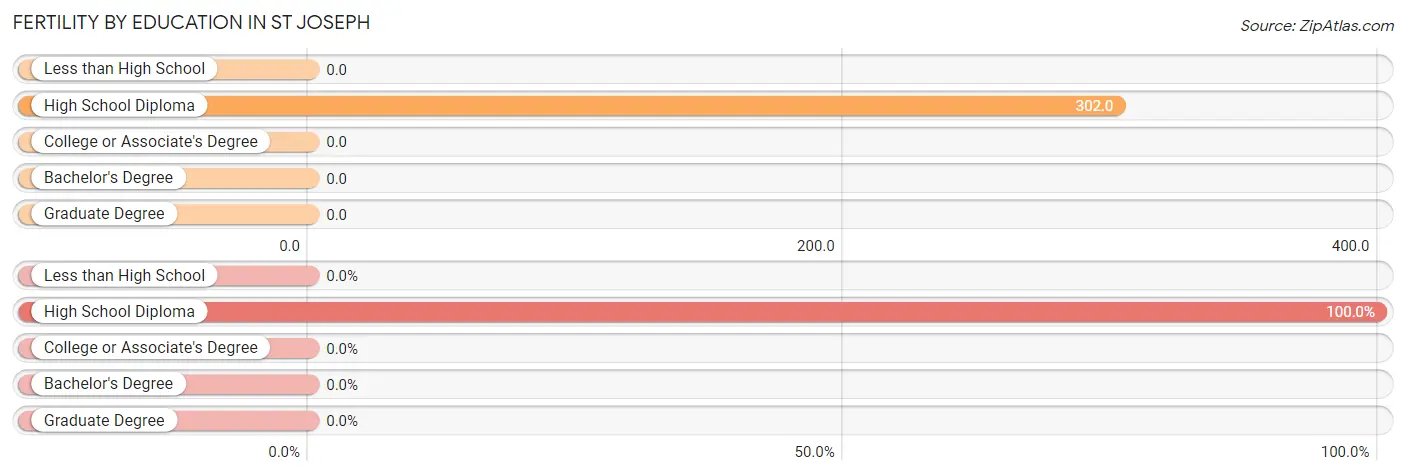
Fertility by Education in St Joseph
| Educational Attainment | Women with Births | Births / 1,000 Women |
| Less than High School | 0 (0.0%) | 0.0 |
| High School Diploma | 26 (100.0%) | 302.0 |
| College or Associate's Degree | 0 (0.0%) | 0.0 |
| Bachelor's Degree | 0 (0.0%) | 0.0 |
| Graduate Degree | 0 (0.0%) | 0.0 |
| Total | 26 (100.0%) | 174.0 |
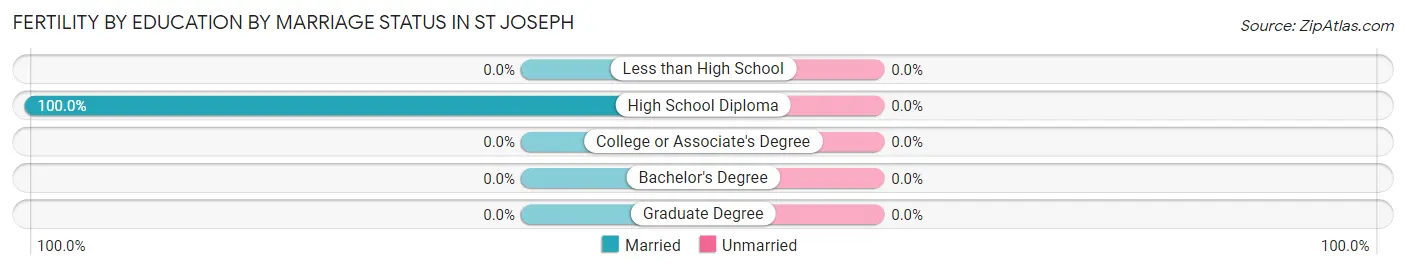
Fertility by Education by Marriage Status in St Joseph
| Educational Attainment | Married | Unmarried |
| Less than High School | 0 (0.0%) | 0 (0.0%) |
| High School Diploma | 26 (100.0%) | 0 (0.0%) |
| College or Associate's Degree | 0 (0.0%) | 0 (0.0%) |
| Bachelor's Degree | 0 (0.0%) | 0 (0.0%) |
| Graduate Degree | 0 (0.0%) | 0 (0.0%) |
| Total | 26 (100.0%) | 0 (0.0%) |
Employment Characteristics in St Joseph
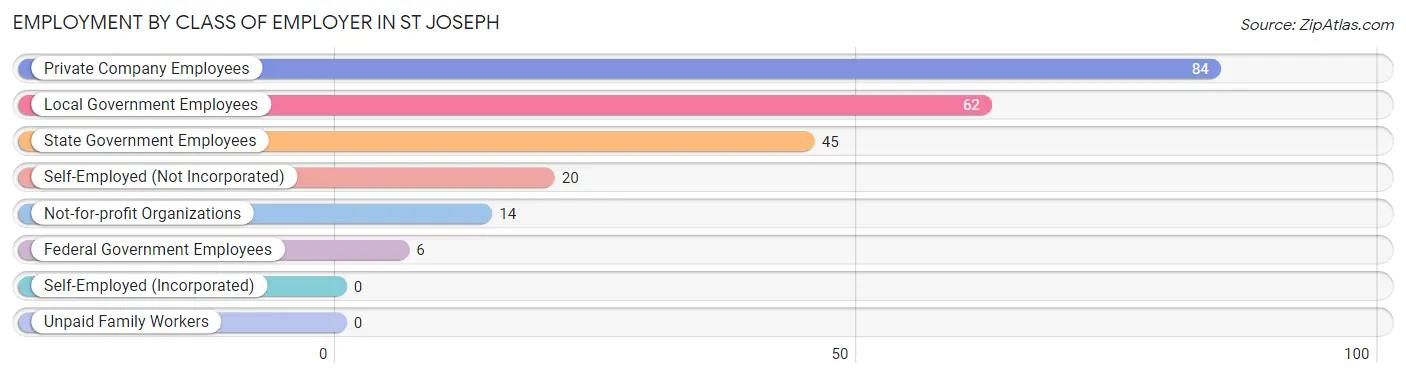
Employment by Class of Employer in St Joseph
Among the 231 employed individuals in St Joseph, private company employees (84 | 36.4%), local government employees (62 | 26.8%), and state government employees (45 | 19.5%) make up the most common classes of employment.
| Employer Class | # Employees | % Employees |
| Private Company Employees | 84 | 36.4% |
| Self-Employed (Incorporated) | 0 | 0.0% |
| Self-Employed (Not Incorporated) | 20 | 8.7% |
| Not-for-profit Organizations | 14 | 6.1% |
| Local Government Employees | 62 | 26.8% |
| State Government Employees | 45 | 19.5% |
| Federal Government Employees | 6 | 2.6% |
| Unpaid Family Workers | 0 | 0.0% |
| Total | 231 | 100.0% |
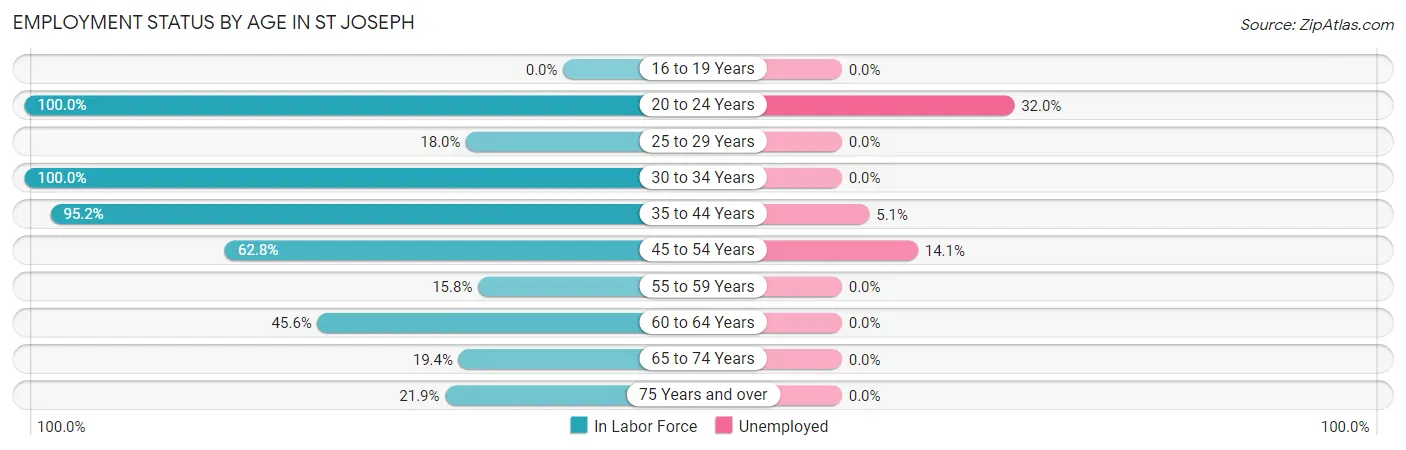
Employment Status by Age in St Joseph
According to the labor force statistics for St Joseph, out of the total population over 16 years of age (599), 42.9% or 257 individuals are in the labor force, with 8.2% or 21 of them unemployed. The age group with the highest labor force participation rate is 20 to 24 years, with 100.0% or 25 individuals in the labor force. Within the labor force, the 20 to 24 years age range has the highest percentage of unemployed individuals, with 32.0% or 8 of them being unemployed.
| Age Bracket | In Labor Force | Unemployed |
| 16 to 19 Years | 0 (0.0%) | 0 (0.0%) |
| 20 to 24 Years | 25 (100.0%) | 8 (32.0%) |
| 25 to 29 Years | 9 (18.0%) | 0 (0.0%) |
| 30 to 34 Years | 17 (100.0%) | 0 (0.0%) |
| 35 to 44 Years | 59 (95.2%) | 3 (5.1%) |
| 45 to 54 Years | 71 (62.8%) | 10 (14.1%) |
| 55 to 59 Years | 12 (15.8%) | 0 (0.0%) |
| 60 to 64 Years | 31 (45.6%) | 0 (0.0%) |
| 65 to 74 Years | 26 (19.4%) | 0 (0.0%) |
| 75 Years and over | 7 (21.9%) | 0 (0.0%) |
| Total | 257 (42.9%) | 21 (8.2%) |
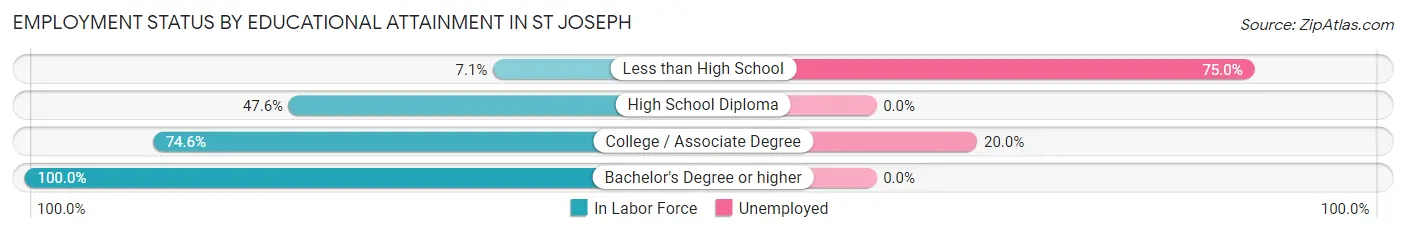
Employment Status by Educational Attainment in St Joseph
According to labor force statistics for St Joseph, 51.6% of individuals (199) out of the total population between 25 and 64 years of age (386) are in the labor force, with 6.5% or 13 of them being unemployed. The group with the highest labor force participation rate are those with the educational attainment of bachelor's degree or higher, with 100.0% or 38 individuals in the labor force. Within the labor force, individuals with less than high school education have the highest percentage of unemployment, with 75.0% or 3 of them being unemployed.
| Educational Attainment | In Labor Force | Unemployed |
| Less than High School | 4 (7.1%) | 42 (75.0%) |
| High School Diploma | 107 (47.6%) | 0 (0.0%) |
| College / Associate Degree | 50 (74.6%) | 13 (20.0%) |
| Bachelor's Degree or higher | 38 (100.0%) | 0 (0.0%) |
| Total | 199 (51.6%) | 25 (6.5%) |
Employment Occupations by Sex in St Joseph
Management, Business, Science and Arts Occupations
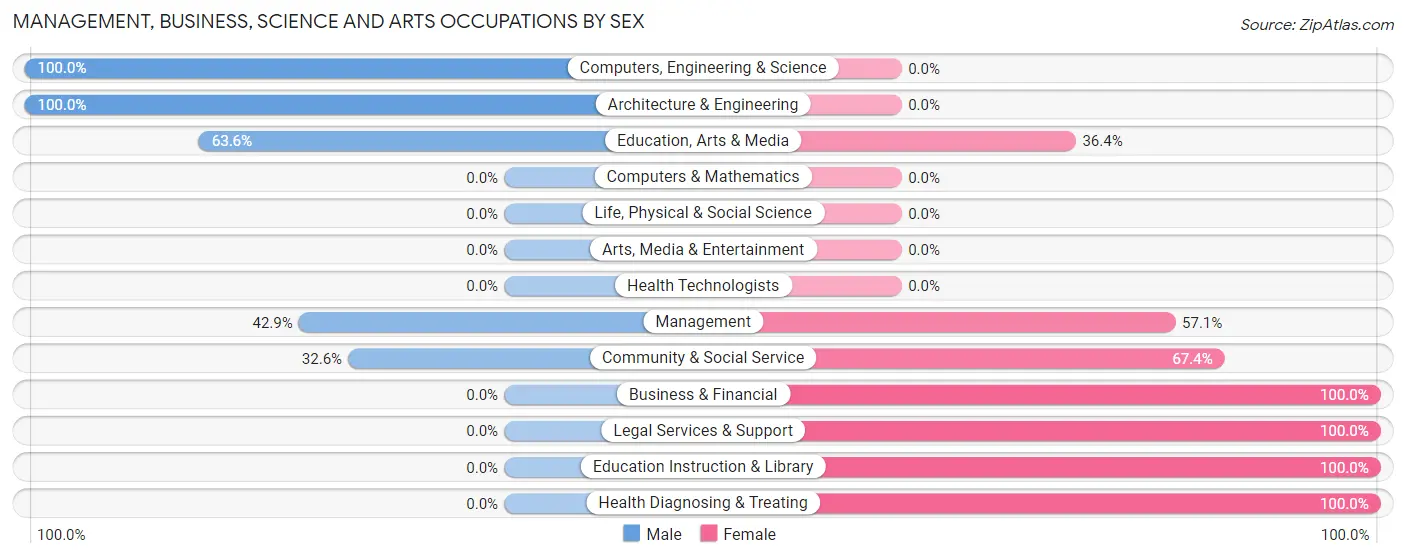
The most common Management, Business, Science and Arts occupations in St Joseph are Community & Social Service (43 | 18.2%), Education, Arts & Media (22 | 9.3%), Management (14 | 5.9%), Education Instruction & Library (14 | 5.9%), and Health Diagnosing & Treating (8 | 3.4%).
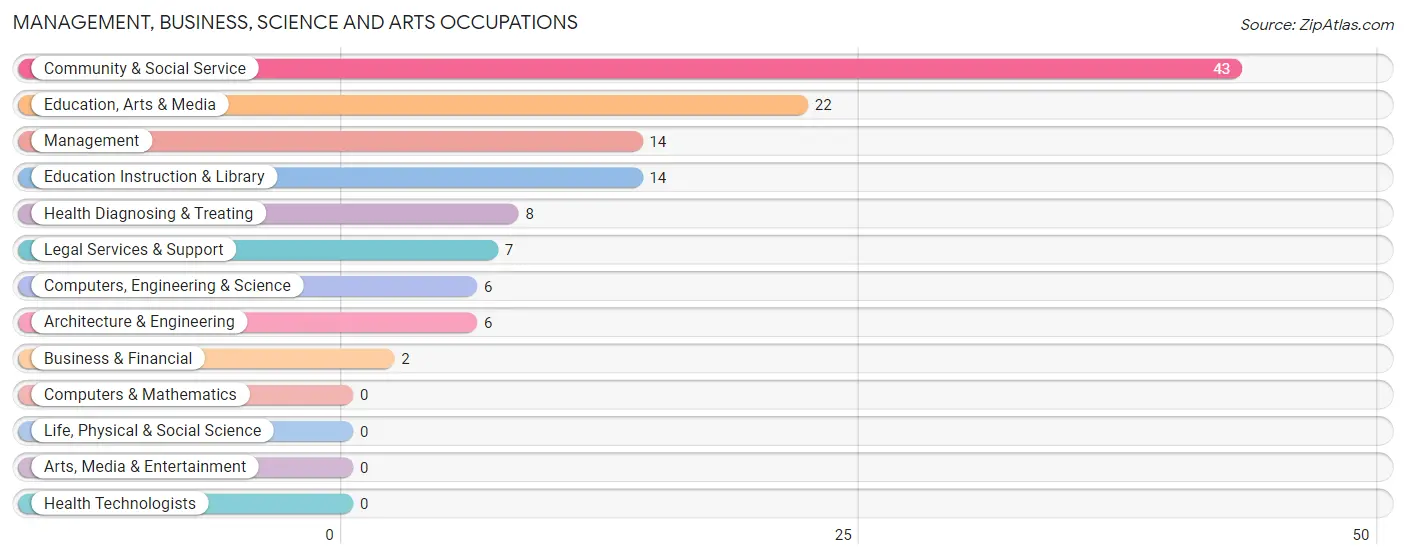
Management, Business, Science and Arts Occupations by Sex
Within the Management, Business, Science and Arts occupations in St Joseph, the most male-oriented occupations are Computers, Engineering & Science (100.0%), Architecture & Engineering (100.0%), and Education, Arts & Media (63.6%), while the most female-oriented occupations are Business & Financial (100.0%), Legal Services & Support (100.0%), and Education Instruction & Library (100.0%).
| Occupation | Male | Female |
| Management | 6 (42.9%) | 8 (57.1%) |
| Business & Financial | 0 (0.0%) | 2 (100.0%) |
| Computers, Engineering & Science | 6 (100.0%) | 0 (0.0%) |
| Computers & Mathematics | 0 (0.0%) | 0 (0.0%) |
| Architecture & Engineering | 6 (100.0%) | 0 (0.0%) |
| Life, Physical & Social Science | 0 (0.0%) | 0 (0.0%) |
| Community & Social Service | 14 (32.6%) | 29 (67.4%) |
| Education, Arts & Media | 14 (63.6%) | 8 (36.4%) |
| Legal Services & Support | 0 (0.0%) | 7 (100.0%) |
| Education Instruction & Library | 0 (0.0%) | 14 (100.0%) |
| Arts, Media & Entertainment | 0 (0.0%) | 0 (0.0%) |
| Health Diagnosing & Treating | 0 (0.0%) | 8 (100.0%) |
| Health Technologists | 0 (0.0%) | 0 (0.0%) |
| Total (Category) | 26 (35.6%) | 47 (64.4%) |
| Total (Overall) | 108 (45.8%) | 128 (54.2%) |
Services Occupations
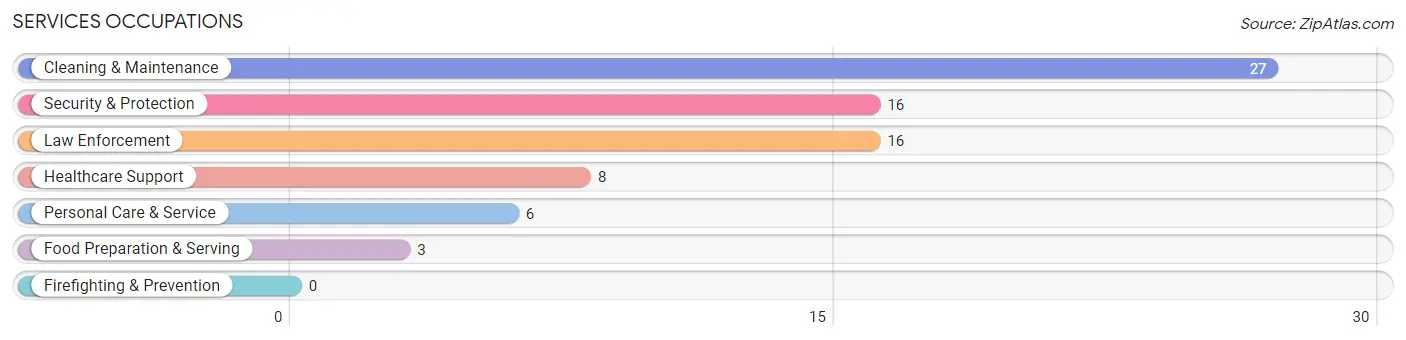
The most common Services occupations in St Joseph are Cleaning & Maintenance (27 | 11.4%), Security & Protection (16 | 6.8%), Law Enforcement (16 | 6.8%), Healthcare Support (8 | 3.4%), and Personal Care & Service (6 | 2.5%).
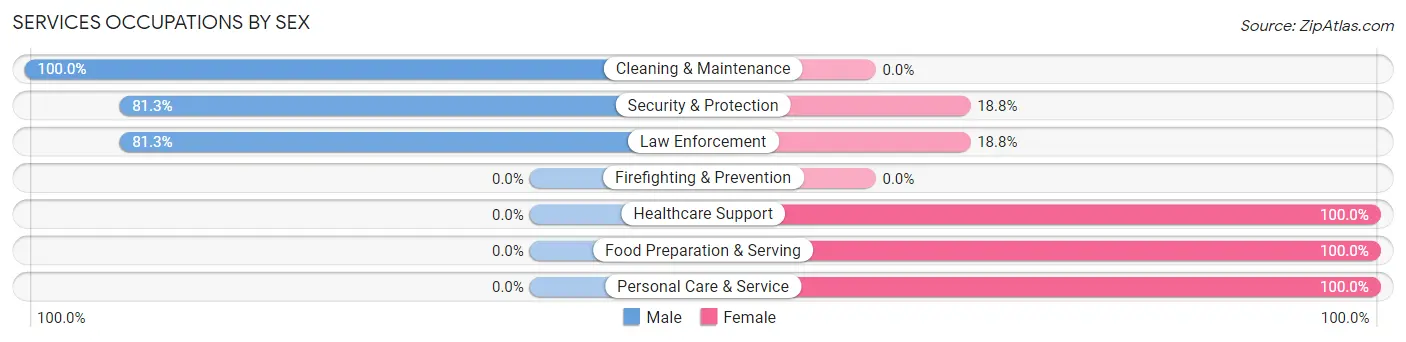
Services Occupations by Sex
Within the Services occupations in St Joseph, the most male-oriented occupations are Cleaning & Maintenance (100.0%), Security & Protection (81.2%), and Law Enforcement (81.2%), while the most female-oriented occupations are Healthcare Support (100.0%), Food Preparation & Serving (100.0%), and Personal Care & Service (100.0%).
| Occupation | Male | Female |
| Healthcare Support | 0 (0.0%) | 8 (100.0%) |
| Security & Protection | 13 (81.2%) | 3 (18.8%) |
| Firefighting & Prevention | 0 (0.0%) | 0 (0.0%) |
| Law Enforcement | 13 (81.2%) | 3 (18.8%) |
| Food Preparation & Serving | 0 (0.0%) | 3 (100.0%) |
| Cleaning & Maintenance | 27 (100.0%) | 0 (0.0%) |
| Personal Care & Service | 0 (0.0%) | 6 (100.0%) |
| Total (Category) | 40 (66.7%) | 20 (33.3%) |
| Total (Overall) | 108 (45.8%) | 128 (54.2%) |
Sales and Office Occupations
The most common Sales and Office occupations in St Joseph are Office & Administration (51 | 21.6%), and Sales & Related (10 | 4.2%).
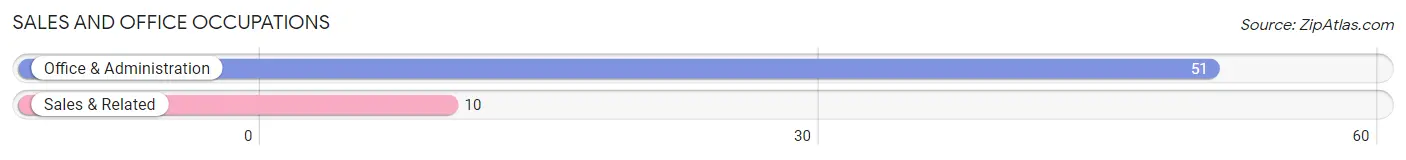
Sales and Office Occupations by Sex
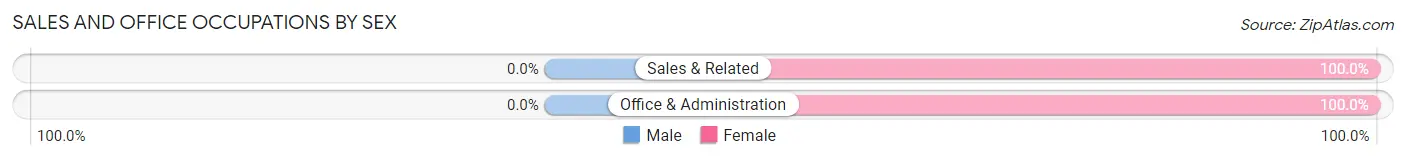
| Occupation | Male | Female |
| Sales & Related | 0 (0.0%) | 10 (100.0%) |
| Office & Administration | 0 (0.0%) | 51 (100.0%) |
| Total (Category) | 0 (0.0%) | 61 (100.0%) |
| Total (Overall) | 108 (45.8%) | 128 (54.2%) |
Natural Resources, Construction and Maintenance Occupations
The most common Natural Resources, Construction and Maintenance occupations in St Joseph are Construction & Extraction (18 | 7.6%), and Farming, Fishing & Forestry (16 | 6.8%).
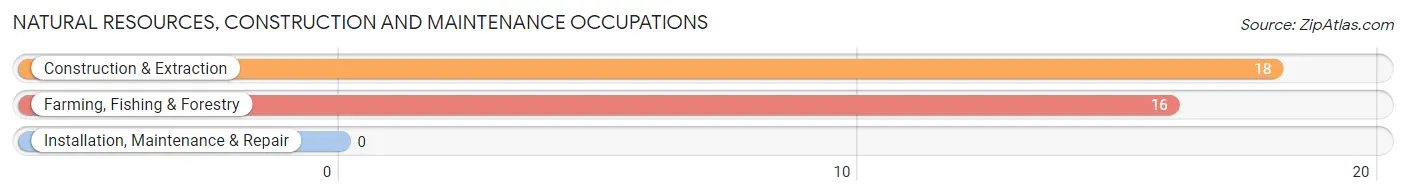
Natural Resources, Construction and Maintenance Occupations by Sex
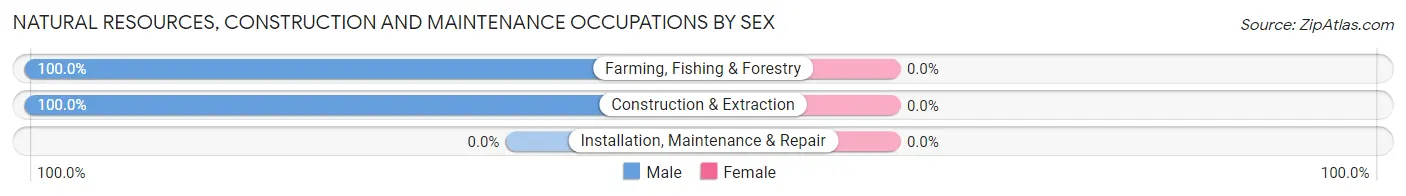
| Occupation | Male | Female |
| Farming, Fishing & Forestry | 16 (100.0%) | 0 (0.0%) |
| Construction & Extraction | 18 (100.0%) | 0 (0.0%) |
| Installation, Maintenance & Repair | 0 (0.0%) | 0 (0.0%) |
| Total (Category) | 34 (100.0%) | 0 (0.0%) |
| Total (Overall) | 108 (45.8%) | 128 (54.2%) |
Production, Transportation and Moving Occupations
The most common Production, Transportation and Moving occupations in St Joseph are Production (7 | 3.0%), and Transportation (1 | 0.4%).
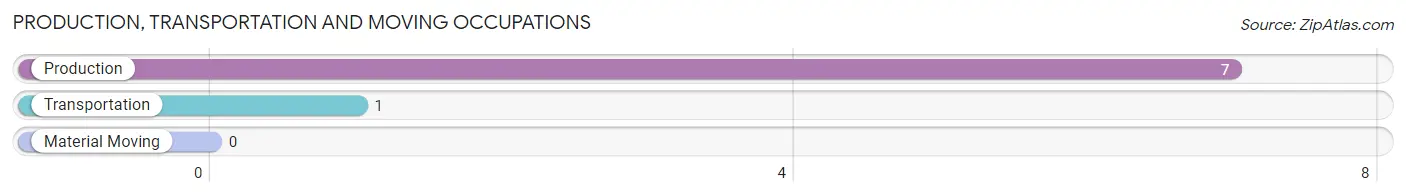
Production, Transportation and Moving Occupations by Sex
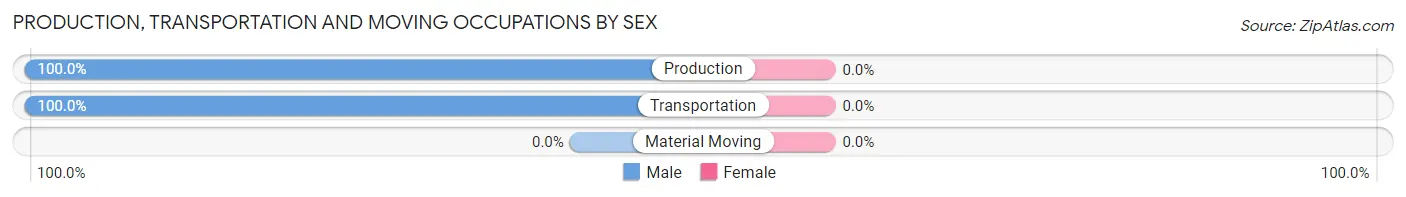
| Occupation | Male | Female |
| Production | 7 (100.0%) | 0 (0.0%) |
| Transportation | 1 (100.0%) | 0 (0.0%) |
| Material Moving | 0 (0.0%) | 0 (0.0%) |
| Total (Category) | 8 (100.0%) | 0 (0.0%) |
| Total (Overall) | 108 (45.8%) | 128 (54.2%) |
Employment Industries by Sex in St Joseph
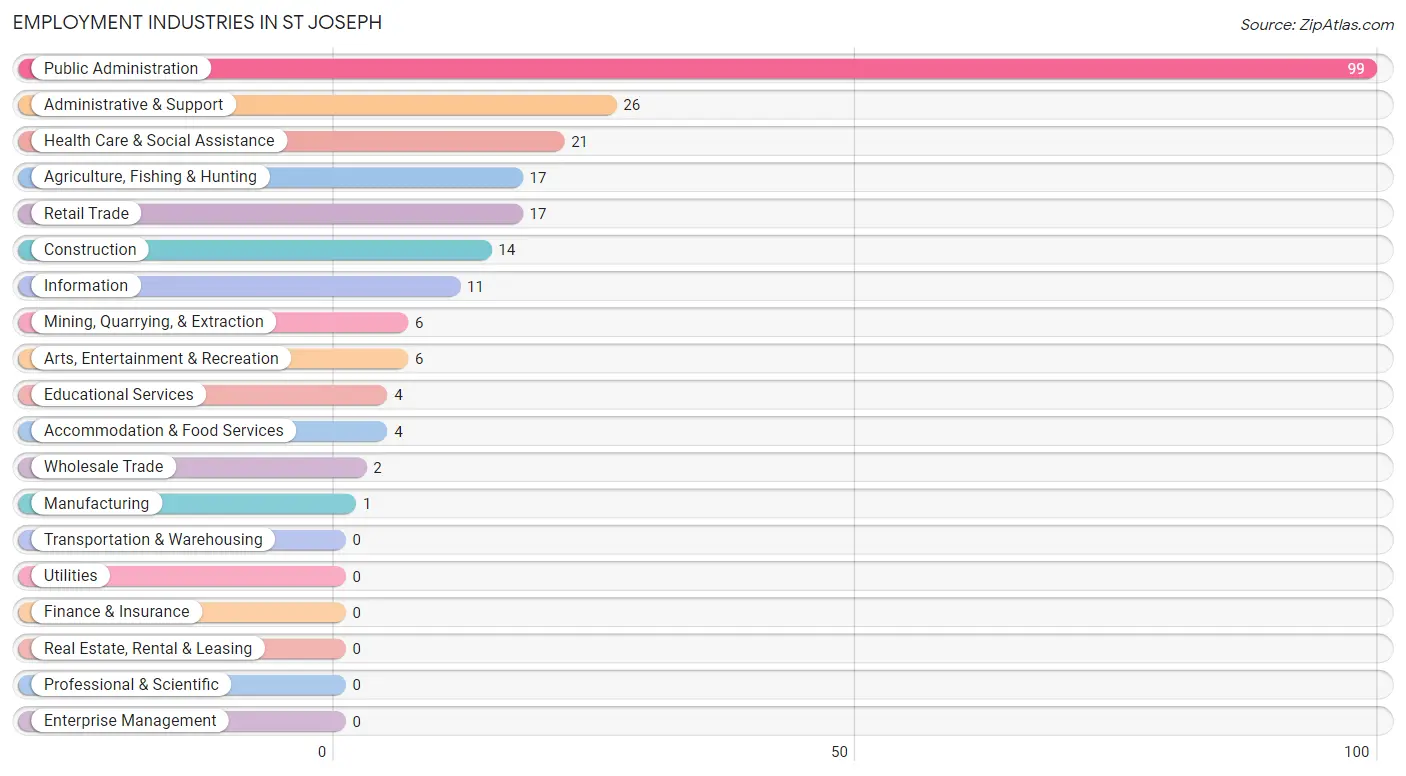
Employment Industries in St Joseph
The major employment industries in St Joseph include Public Administration (99 | 41.9%), Administrative & Support (26 | 11.0%), Health Care & Social Assistance (21 | 8.9%), Agriculture, Fishing & Hunting (17 | 7.2%), and Retail Trade (17 | 7.2%).
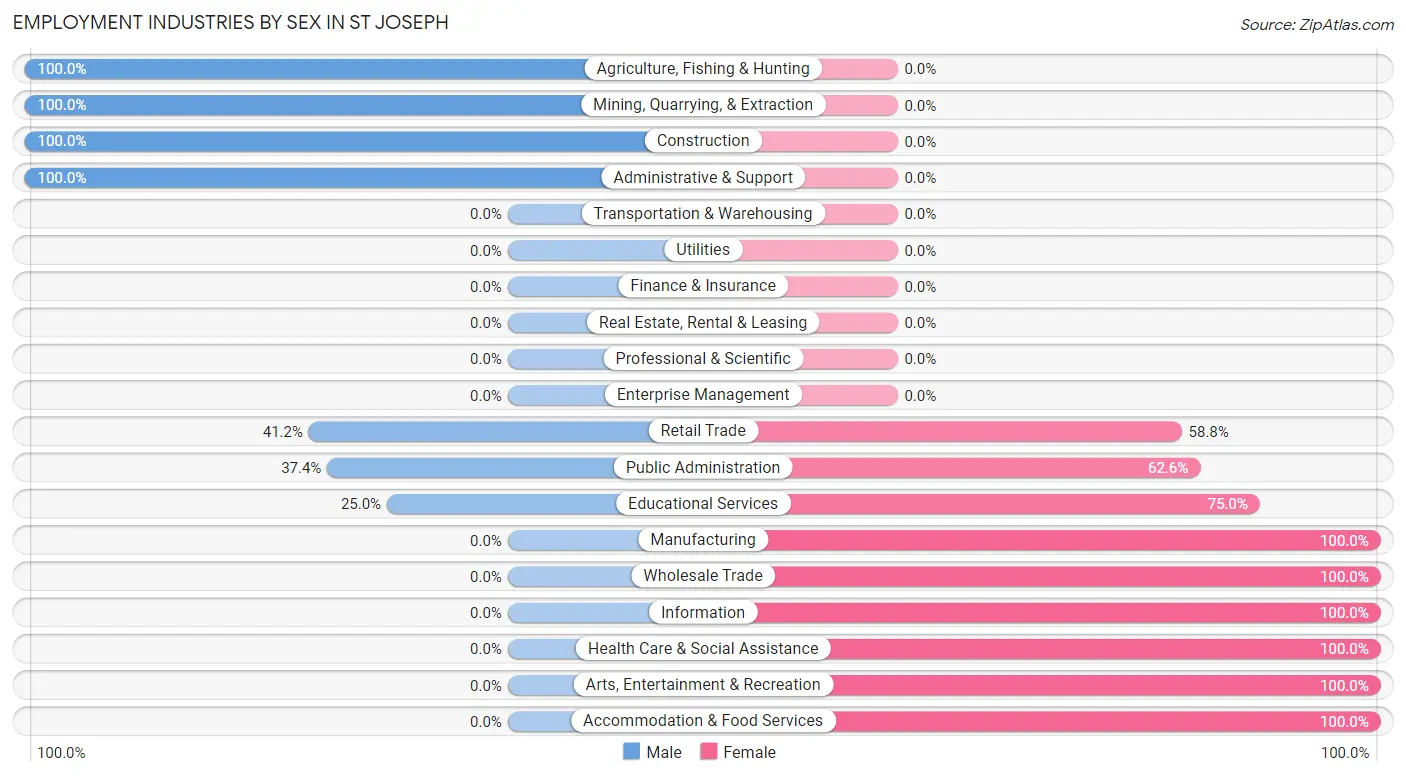
Employment Industries by Sex in St Joseph
The St Joseph industries that see more men than women are Agriculture, Fishing & Hunting (100.0%), Mining, Quarrying, & Extraction (100.0%), and Construction (100.0%), whereas the industries that tend to have a higher number of women are Manufacturing (100.0%), Wholesale Trade (100.0%), and Information (100.0%).
| Industry | Male | Female |
| Agriculture, Fishing & Hunting | 17 (100.0%) | 0 (0.0%) |
| Mining, Quarrying, & Extraction | 6 (100.0%) | 0 (0.0%) |
| Construction | 14 (100.0%) | 0 (0.0%) |
| Manufacturing | 0 (0.0%) | 1 (100.0%) |
| Wholesale Trade | 0 (0.0%) | 2 (100.0%) |
| Retail Trade | 7 (41.2%) | 10 (58.8%) |
| Transportation & Warehousing | 0 (0.0%) | 0 (0.0%) |
| Utilities | 0 (0.0%) | 0 (0.0%) |
| Information | 0 (0.0%) | 11 (100.0%) |
| Finance & Insurance | 0 (0.0%) | 0 (0.0%) |
| Real Estate, Rental & Leasing | 0 (0.0%) | 0 (0.0%) |
| Professional & Scientific | 0 (0.0%) | 0 (0.0%) |
| Enterprise Management | 0 (0.0%) | 0 (0.0%) |
| Administrative & Support | 26 (100.0%) | 0 (0.0%) |
| Educational Services | 1 (25.0%) | 3 (75.0%) |
| Health Care & Social Assistance | 0 (0.0%) | 21 (100.0%) |
| Arts, Entertainment & Recreation | 0 (0.0%) | 6 (100.0%) |
| Accommodation & Food Services | 0 (0.0%) | 4 (100.0%) |
| Public Administration | 37 (37.4%) | 62 (62.6%) |
| Total | 108 (45.8%) | 128 (54.2%) |
Education in St Joseph
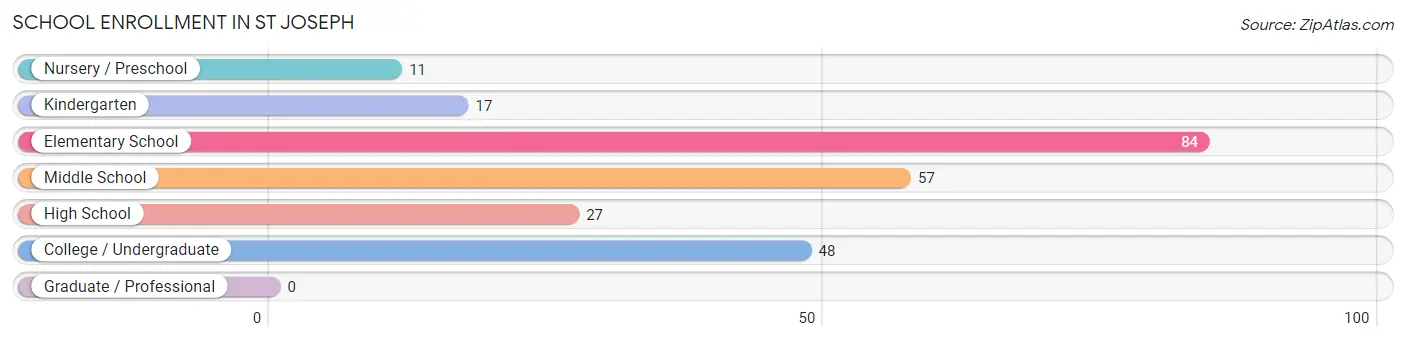
School Enrollment in St Joseph
The most common levels of schooling among the 244 students in St Joseph are elementary school (84 | 34.4%), middle school (57 | 23.4%), and college / undergraduate (48 | 19.7%).
| School Level | # Students | % Students |
| Nursery / Preschool | 11 | 4.5% |
| Kindergarten | 17 | 7.0% |
| Elementary School | 84 | 34.4% |
| Middle School | 57 | 23.4% |
| High School | 27 | 11.1% |
| College / Undergraduate | 48 | 19.7% |
| Graduate / Professional | 0 | 0.0% |
| Total | 244 | 100.0% |
School Enrollment by Age by Funding Source in St Joseph
Out of a total of 244 students who are enrolled in schools in St Joseph, 19 (7.8%) attend a private institution, while the remaining 225 (92.2%) are enrolled in public schools. The age group of 15 to 17 year olds has the highest likelihood of being enrolled in private schools, with 8 (42.1% in the age bracket) enrolled. Conversely, the age group of 3 to 4 year olds has the lowest likelihood of being enrolled in a private school, with 11 (100.0% in the age bracket) attending a public institution.
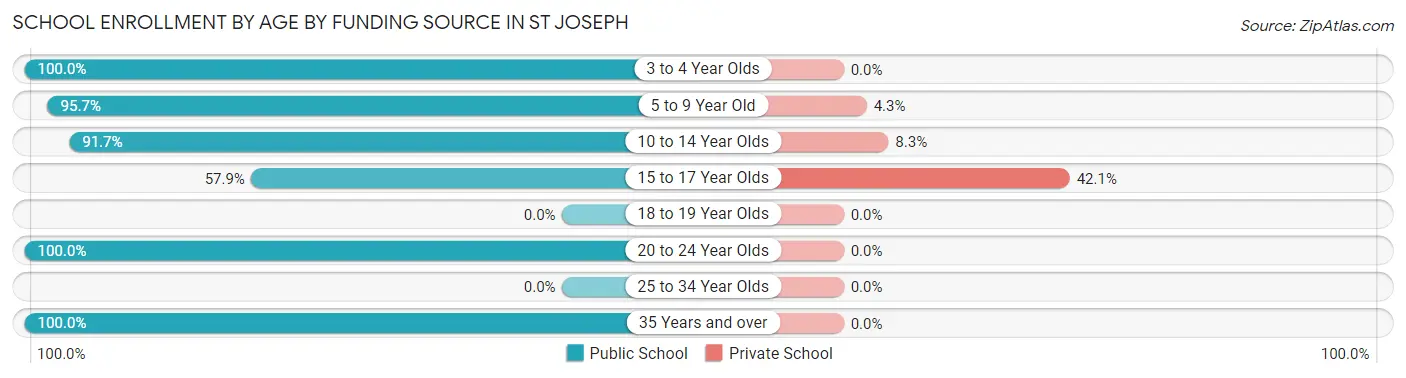
| Age Bracket | Public School | Private School |
| 3 to 4 Year Olds | 11 (100.0%) | 0 (0.0%) |
| 5 to 9 Year Old | 67 (95.7%) | 3 (4.3%) |
| 10 to 14 Year Olds | 88 (91.7%) | 8 (8.3%) |
| 15 to 17 Year Olds | 11 (57.9%) | 8 (42.1%) |
| 18 to 19 Year Olds | 0 (0.0%) | 0 (0.0%) |
| 20 to 24 Year Olds | 17 (100.0%) | 0 (0.0%) |
| 25 to 34 Year Olds | 0 (0.0%) | 0 (0.0%) |
| 35 Years and over | 31 (100.0%) | 0 (0.0%) |
| Total | 225 (92.2%) | 19 (7.8%) |
Educational Attainment by Field of Study in St Joseph
Education (33 | 38.8%), business (30 | 35.3%), arts & humanities (8 | 9.4%), bio, nature & agricultural (7 | 8.2%), and psychology (6 | 7.1%) are the most common fields of study among 85 individuals in St Joseph who have obtained a bachelor's degree or higher.
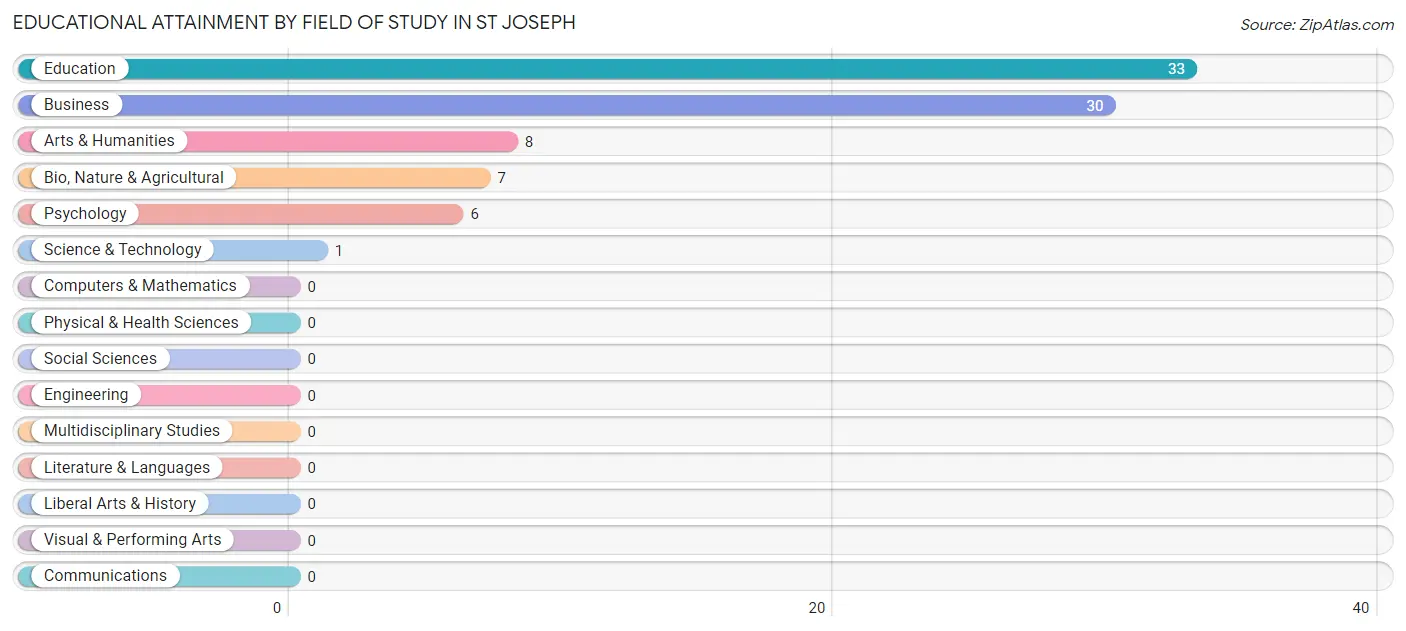
| Field of Study | # Graduates | % Graduates |
| Computers & Mathematics | 0 | 0.0% |
| Bio, Nature & Agricultural | 7 | 8.2% |
| Physical & Health Sciences | 0 | 0.0% |
| Psychology | 6 | 7.1% |
| Social Sciences | 0 | 0.0% |
| Engineering | 0 | 0.0% |
| Multidisciplinary Studies | 0 | 0.0% |
| Science & Technology | 1 | 1.2% |
| Business | 30 | 35.3% |
| Education | 33 | 38.8% |
| Literature & Languages | 0 | 0.0% |
| Liberal Arts & History | 0 | 0.0% |
| Visual & Performing Arts | 0 | 0.0% |
| Communications | 0 | 0.0% |
| Arts & Humanities | 8 | 9.4% |
| Total | 85 | 100.0% |
Transportation & Commute in St Joseph
Vehicle Availability by Sex in St Joseph
The most prevalent vehicle ownership categories in St Joseph are males with 2 vehicles (35, accounting for 32.4%) and females with 2 vehicles (11, making up 28.5%).
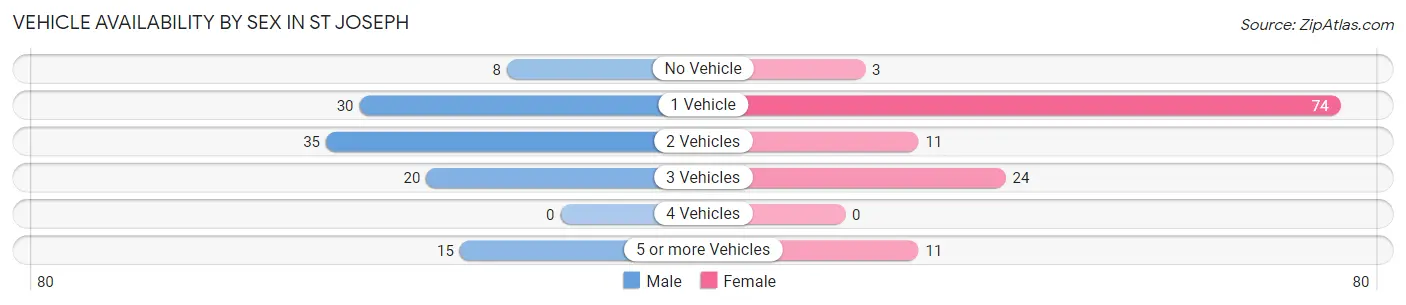
| Vehicles Available | Male | Female |
| No Vehicle | 8 (7.4%) | 3 (2.4%) |
| 1 Vehicle | 30 (27.8%) | 74 (60.2%) |
| 2 Vehicles | 35 (32.4%) | 11 (8.9%) |
| 3 Vehicles | 20 (18.5%) | 24 (19.5%) |
| 4 Vehicles | 0 (0.0%) | 0 (0.0%) |
| 5 or more Vehicles | 15 (13.9%) | 11 (8.9%) |
| Total | 108 (100.0%) | 123 (100.0%) |
Commute Time in St Joseph
The most frequently occuring commute durations in St Joseph are 45 to 59 minutes (55 commuters, 24.4%), less than 5 minutes (53 commuters, 23.6%), and 5 to 9 minutes (32 commuters, 14.2%).
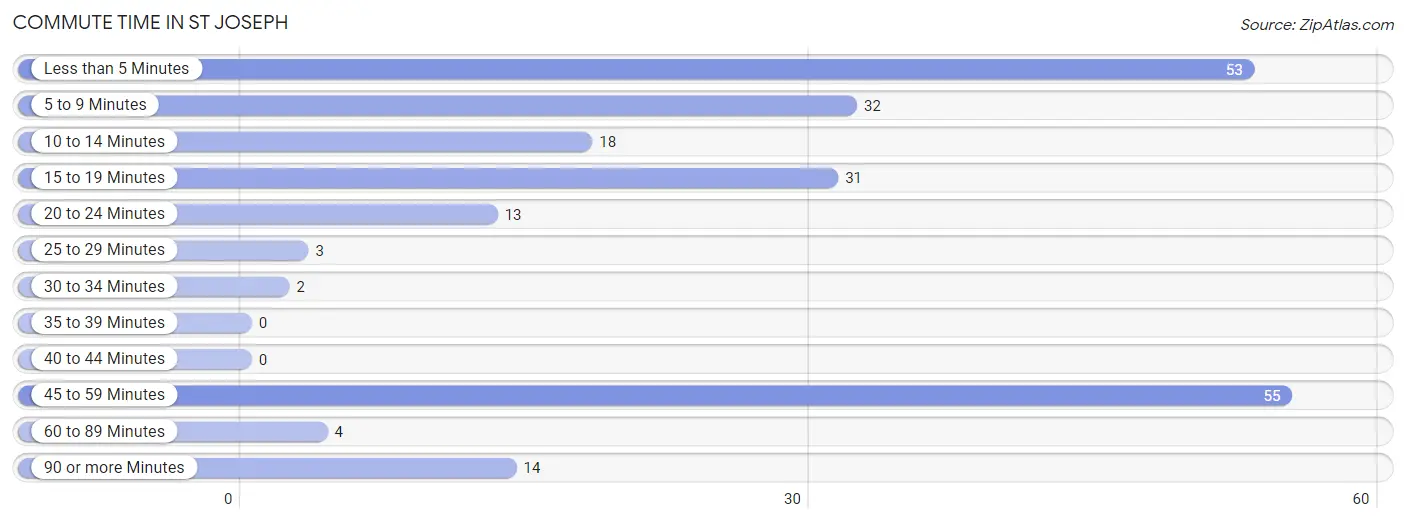
| Commute Time | # Commuters | % Commuters |
| Less than 5 Minutes | 53 | 23.6% |
| 5 to 9 Minutes | 32 | 14.2% |
| 10 to 14 Minutes | 18 | 8.0% |
| 15 to 19 Minutes | 31 | 13.8% |
| 20 to 24 Minutes | 13 | 5.8% |
| 25 to 29 Minutes | 3 | 1.3% |
| 30 to 34 Minutes | 2 | 0.9% |
| 35 to 39 Minutes | 0 | 0.0% |
| 40 to 44 Minutes | 0 | 0.0% |
| 45 to 59 Minutes | 55 | 24.4% |
| 60 to 89 Minutes | 4 | 1.8% |
| 90 or more Minutes | 14 | 6.2% |
Commute Time by Sex in St Joseph
The most common commute times in St Joseph are 5 to 9 minutes (25 commuters, 23.2%) for males and 45 to 59 minutes (55 commuters, 47.0%) for females.
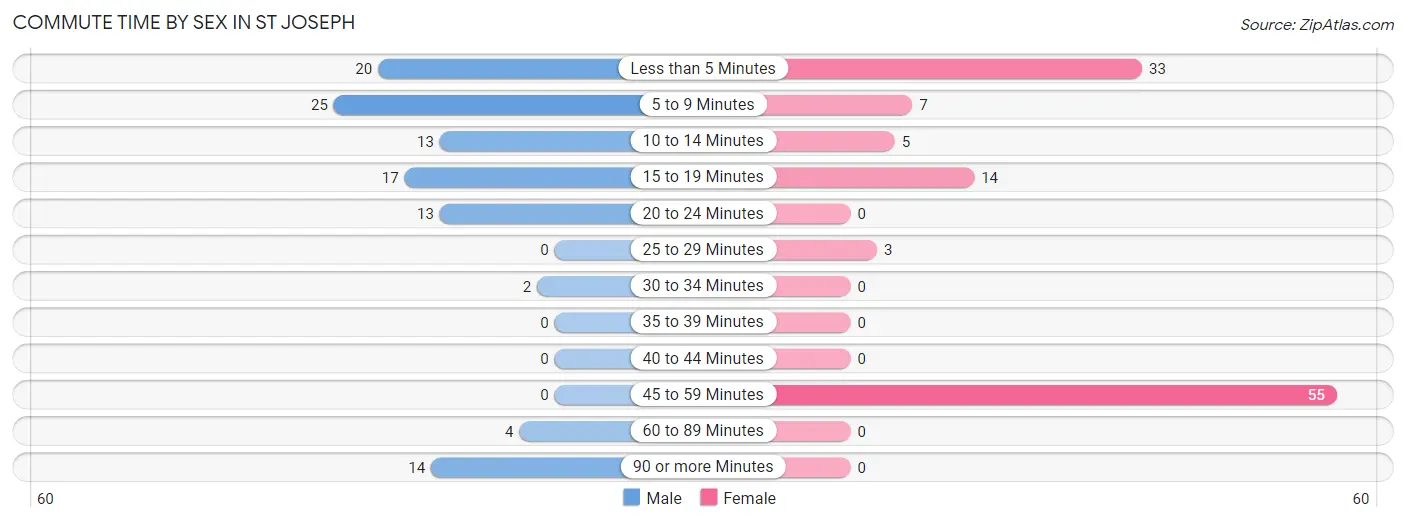
| Commute Time | Male | Female |
| Less than 5 Minutes | 20 (18.5%) | 33 (28.2%) |
| 5 to 9 Minutes | 25 (23.2%) | 7 (6.0%) |
| 10 to 14 Minutes | 13 (12.0%) | 5 (4.3%) |
| 15 to 19 Minutes | 17 (15.7%) | 14 (12.0%) |
| 20 to 24 Minutes | 13 (12.0%) | 0 (0.0%) |
| 25 to 29 Minutes | 0 (0.0%) | 3 (2.6%) |
| 30 to 34 Minutes | 2 (1.8%) | 0 (0.0%) |
| 35 to 39 Minutes | 0 (0.0%) | 0 (0.0%) |
| 40 to 44 Minutes | 0 (0.0%) | 0 (0.0%) |
| 45 to 59 Minutes | 0 (0.0%) | 55 (47.0%) |
| 60 to 89 Minutes | 4 (3.7%) | 0 (0.0%) |
| 90 or more Minutes | 14 (13.0%) | 0 (0.0%) |
Time of Departure to Work by Sex in St Joseph
The most frequent times of departure to work in St Joseph are 8:00 AM to 8:29 AM (39, 36.1%) for males and 7:30 AM to 7:59 AM (45, 38.5%) for females.
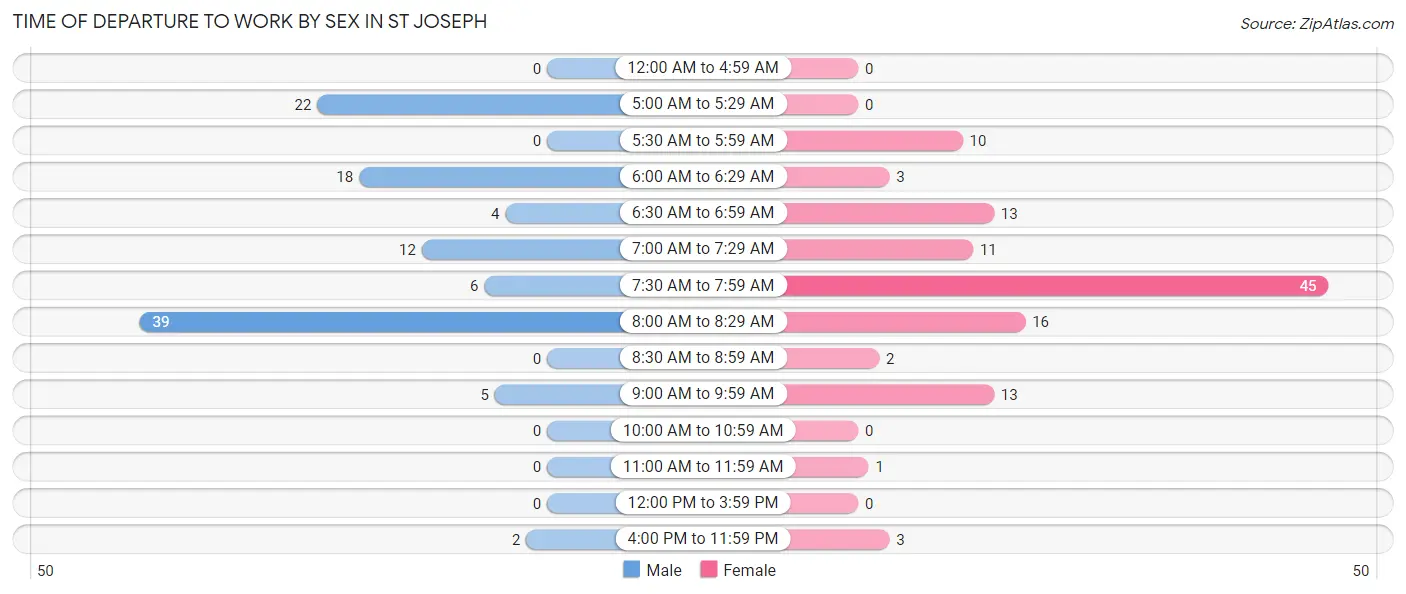
| Time of Departure | Male | Female |
| 12:00 AM to 4:59 AM | 0 (0.0%) | 0 (0.0%) |
| 5:00 AM to 5:29 AM | 22 (20.4%) | 0 (0.0%) |
| 5:30 AM to 5:59 AM | 0 (0.0%) | 10 (8.6%) |
| 6:00 AM to 6:29 AM | 18 (16.7%) | 3 (2.6%) |
| 6:30 AM to 6:59 AM | 4 (3.7%) | 13 (11.1%) |
| 7:00 AM to 7:29 AM | 12 (11.1%) | 11 (9.4%) |
| 7:30 AM to 7:59 AM | 6 (5.6%) | 45 (38.5%) |
| 8:00 AM to 8:29 AM | 39 (36.1%) | 16 (13.7%) |
| 8:30 AM to 8:59 AM | 0 (0.0%) | 2 (1.7%) |
| 9:00 AM to 9:59 AM | 5 (4.6%) | 13 (11.1%) |
| 10:00 AM to 10:59 AM | 0 (0.0%) | 0 (0.0%) |
| 11:00 AM to 11:59 AM | 0 (0.0%) | 1 (0.9%) |
| 12:00 PM to 3:59 PM | 0 (0.0%) | 0 (0.0%) |
| 4:00 PM to 11:59 PM | 2 (1.8%) | 3 (2.6%) |
| Total | 108 (100.0%) | 117 (100.0%) |
Housing Occupancy in St Joseph
Occupancy by Ownership in St Joseph
Of the total 302 dwellings in St Joseph, owner-occupied units account for 184 (60.9%), while renter-occupied units make up 118 (39.1%).
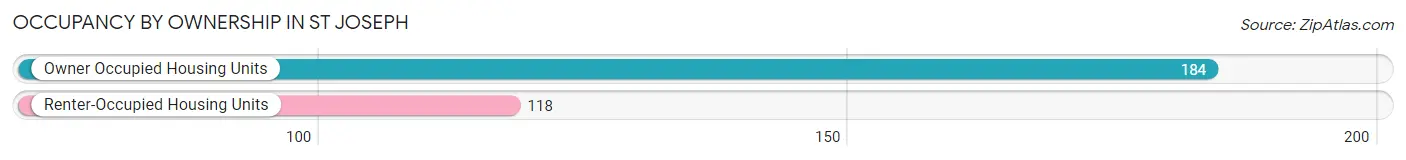
| Occupancy | # Housing Units | % Housing Units |
| Owner Occupied Housing Units | 184 | 60.9% |
| Renter-Occupied Housing Units | 118 | 39.1% |
| Total Occupied Housing Units | 302 | 100.0% |
Occupancy by Household Size in St Joseph
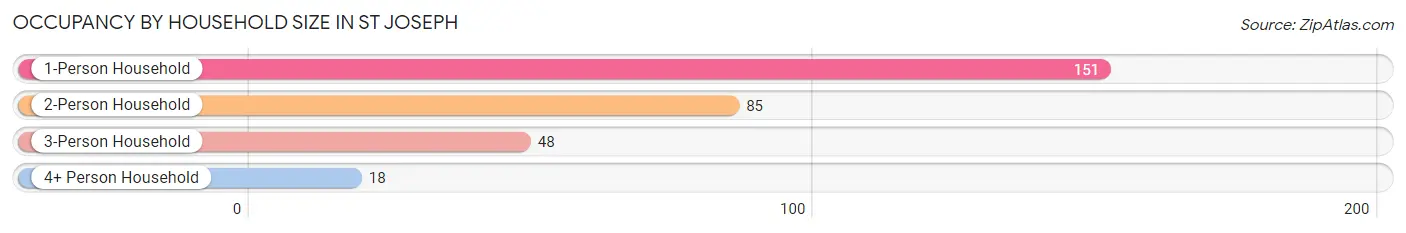
| Household Size | # Housing Units | % Housing Units |
| 1-Person Household | 151 | 50.0% |
| 2-Person Household | 85 | 28.1% |
| 3-Person Household | 48 | 15.9% |
| 4+ Person Household | 18 | 6.0% |
| Total Housing Units | 302 | 100.0% |
Occupancy by Ownership by Household Size in St Joseph
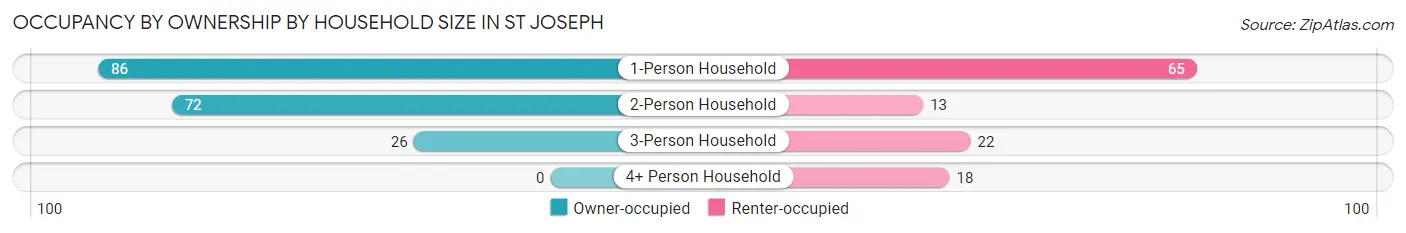
| Household Size | Owner-occupied | Renter-occupied |
| 1-Person Household | 86 (57.0%) | 65 (43.0%) |
| 2-Person Household | 72 (84.7%) | 13 (15.3%) |
| 3-Person Household | 26 (54.2%) | 22 (45.8%) |
| 4+ Person Household | 0 (0.0%) | 18 (100.0%) |
| Total Housing Units | 184 (60.9%) | 118 (39.1%) |
Occupancy by Educational Attainment in St Joseph
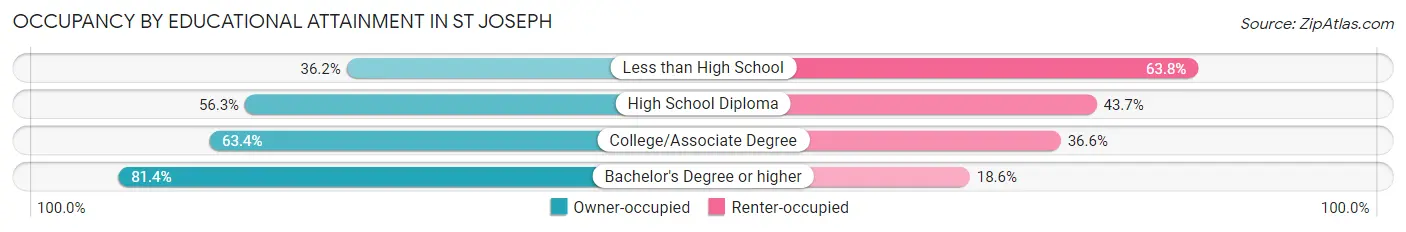
| Household Size | Owner-occupied | Renter-occupied |
| Less than High School | 17 (36.2%) | 30 (63.8%) |
| High School Diploma | 58 (56.3%) | 45 (43.7%) |
| College/Associate Degree | 52 (63.4%) | 30 (36.6%) |
| Bachelor's Degree or higher | 57 (81.4%) | 13 (18.6%) |
Occupancy by Age of Householder in St Joseph
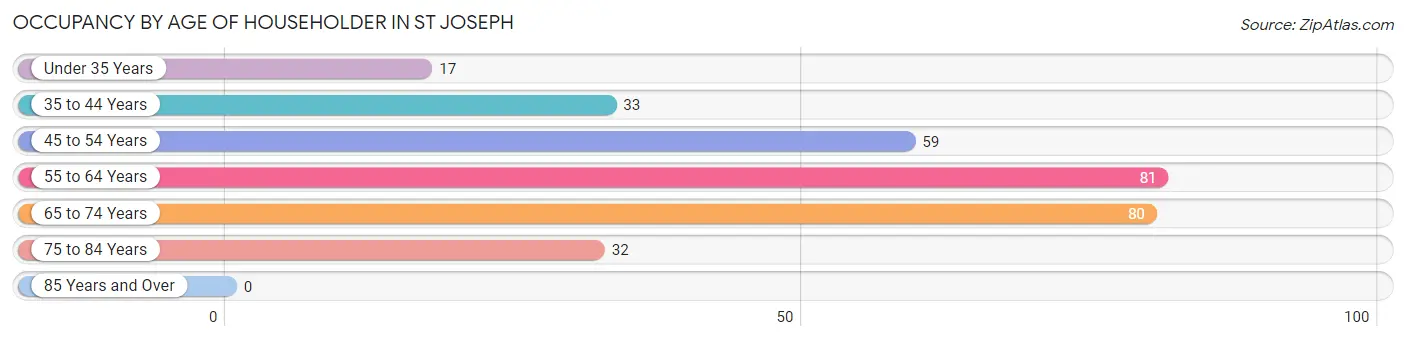
| Age Bracket | # Households | % Households |
| Under 35 Years | 17 | 5.6% |
| 35 to 44 Years | 33 | 10.9% |
| 45 to 54 Years | 59 | 19.5% |
| 55 to 64 Years | 81 | 26.8% |
| 65 to 74 Years | 80 | 26.5% |
| 75 to 84 Years | 32 | 10.6% |
| 85 Years and Over | 0 | 0.0% |
| Total | 302 | 100.0% |
Housing Finances in St Joseph
Median Income by Occupancy in St Joseph
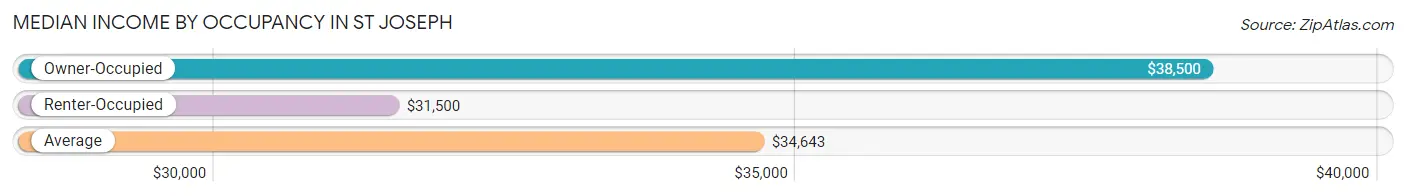
| Occupancy Type | # Households | Median Income |
| Owner-Occupied | 184 (60.9%) | $38,500 |
| Renter-Occupied | 118 (39.1%) | $31,500 |
| Average | 302 (100.0%) | $34,643 |
Occupancy by Householder Income Bracket in St Joseph
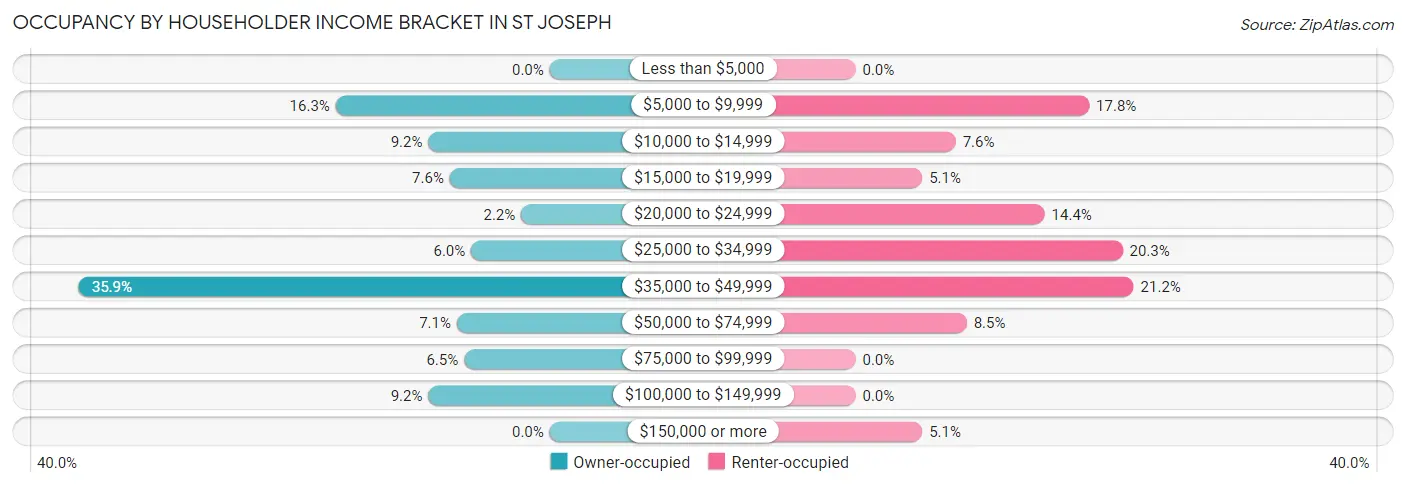
| Income Bracket | Owner-occupied | Renter-occupied |
| Less than $5,000 | 0 (0.0%) | 0 (0.0%) |
| $5,000 to $9,999 | 30 (16.3%) | 21 (17.8%) |
| $10,000 to $14,999 | 17 (9.2%) | 9 (7.6%) |
| $15,000 to $19,999 | 14 (7.6%) | 6 (5.1%) |
| $20,000 to $24,999 | 4 (2.2%) | 17 (14.4%) |
| $25,000 to $34,999 | 11 (6.0%) | 24 (20.3%) |
| $35,000 to $49,999 | 66 (35.9%) | 25 (21.2%) |
| $50,000 to $74,999 | 13 (7.1%) | 10 (8.5%) |
| $75,000 to $99,999 | 12 (6.5%) | 0 (0.0%) |
| $100,000 to $149,999 | 17 (9.2%) | 0 (0.0%) |
| $150,000 or more | 0 (0.0%) | 6 (5.1%) |
| Total | 184 (100.0%) | 118 (100.0%) |
Monthly Housing Cost Tiers in St Joseph
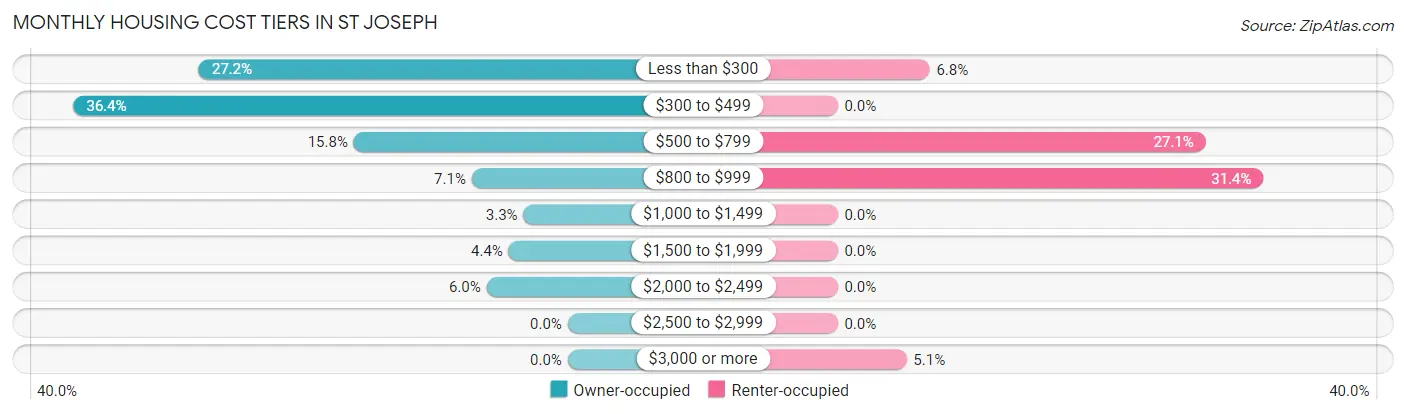
| Monthly Cost | Owner-occupied | Renter-occupied |
| Less than $300 | 50 (27.2%) | 8 (6.8%) |
| $300 to $499 | 67 (36.4%) | 0 (0.0%) |
| $500 to $799 | 29 (15.8%) | 32 (27.1%) |
| $800 to $999 | 13 (7.1%) | 37 (31.4%) |
| $1,000 to $1,499 | 6 (3.3%) | 0 (0.0%) |
| $1,500 to $1,999 | 8 (4.3%) | 0 (0.0%) |
| $2,000 to $2,499 | 11 (6.0%) | 0 (0.0%) |
| $2,500 to $2,999 | 0 (0.0%) | 0 (0.0%) |
| $3,000 or more | 0 (0.0%) | 6 (5.1%) |
| Total | 184 (100.0%) | 118 (100.0%) |
Physical Housing Characteristics in St Joseph
Housing Structures in St Joseph
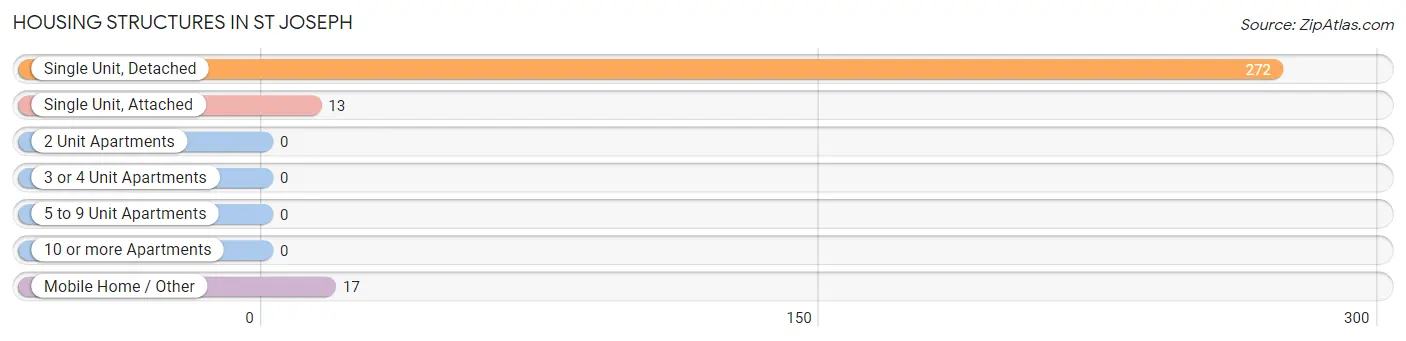
| Structure Type | # Housing Units | % Housing Units |
| Single Unit, Detached | 272 | 90.1% |
| Single Unit, Attached | 13 | 4.3% |
| 2 Unit Apartments | 0 | 0.0% |
| 3 or 4 Unit Apartments | 0 | 0.0% |
| 5 to 9 Unit Apartments | 0 | 0.0% |
| 10 or more Apartments | 0 | 0.0% |
| Mobile Home / Other | 17 | 5.6% |
| Total | 302 | 100.0% |
Housing Structures by Occupancy in St Joseph
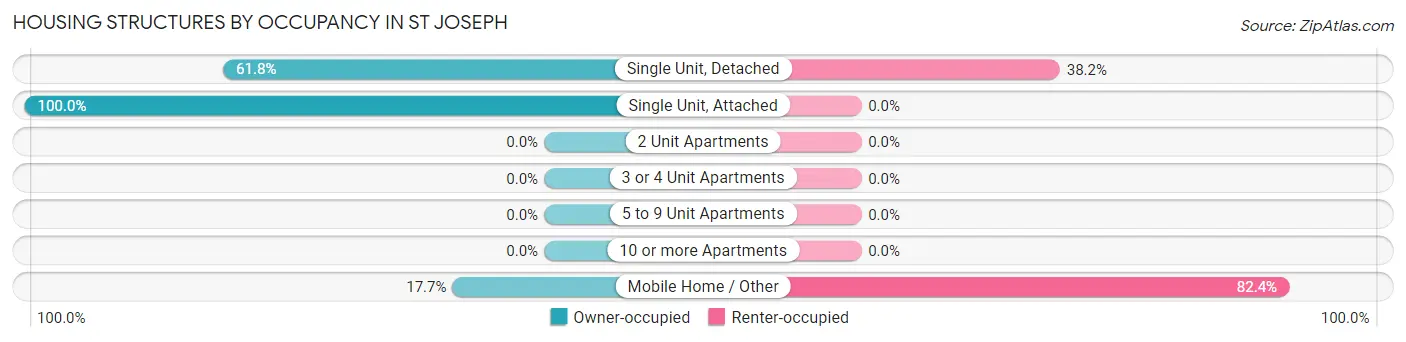
| Structure Type | Owner-occupied | Renter-occupied |
| Single Unit, Detached | 168 (61.8%) | 104 (38.2%) |
| Single Unit, Attached | 13 (100.0%) | 0 (0.0%) |
| 2 Unit Apartments | 0 (0.0%) | 0 (0.0%) |
| 3 or 4 Unit Apartments | 0 (0.0%) | 0 (0.0%) |
| 5 to 9 Unit Apartments | 0 (0.0%) | 0 (0.0%) |
| 10 or more Apartments | 0 (0.0%) | 0 (0.0%) |
| Mobile Home / Other | 3 (17.6%) | 14 (82.4%) |
| Total | 184 (60.9%) | 118 (39.1%) |
Housing Structures by Number of Rooms in St Joseph
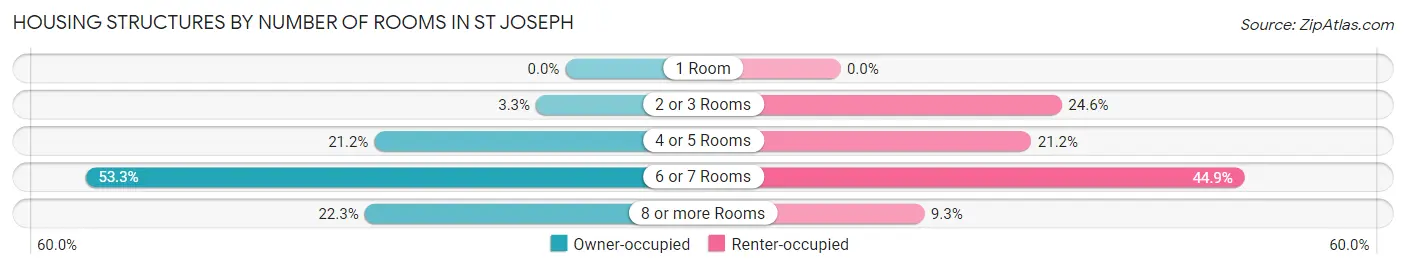
| Number of Rooms | Owner-occupied | Renter-occupied |
| 1 Room | 0 (0.0%) | 0 (0.0%) |
| 2 or 3 Rooms | 6 (3.3%) | 29 (24.6%) |
| 4 or 5 Rooms | 39 (21.2%) | 25 (21.2%) |
| 6 or 7 Rooms | 98 (53.3%) | 53 (44.9%) |
| 8 or more Rooms | 41 (22.3%) | 11 (9.3%) |
| Total | 184 (100.0%) | 118 (100.0%) |
Housing Structure by Heating Type in St Joseph
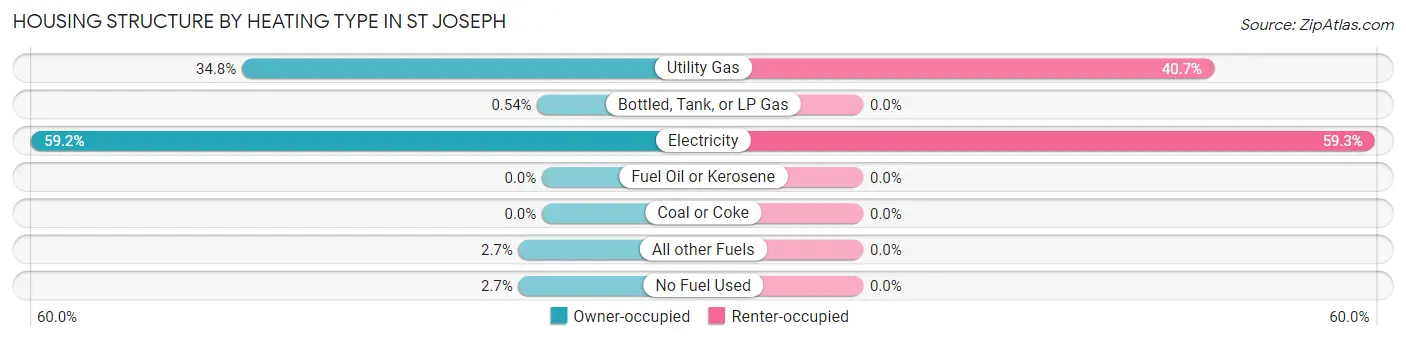
| Heating Type | Owner-occupied | Renter-occupied |
| Utility Gas | 64 (34.8%) | 48 (40.7%) |
| Bottled, Tank, or LP Gas | 1 (0.5%) | 0 (0.0%) |
| Electricity | 109 (59.2%) | 70 (59.3%) |
| Fuel Oil or Kerosene | 0 (0.0%) | 0 (0.0%) |
| Coal or Coke | 0 (0.0%) | 0 (0.0%) |
| All other Fuels | 5 (2.7%) | 0 (0.0%) |
| No Fuel Used | 5 (2.7%) | 0 (0.0%) |
| Total | 184 (100.0%) | 118 (100.0%) |
Household Vehicle Usage in St Joseph
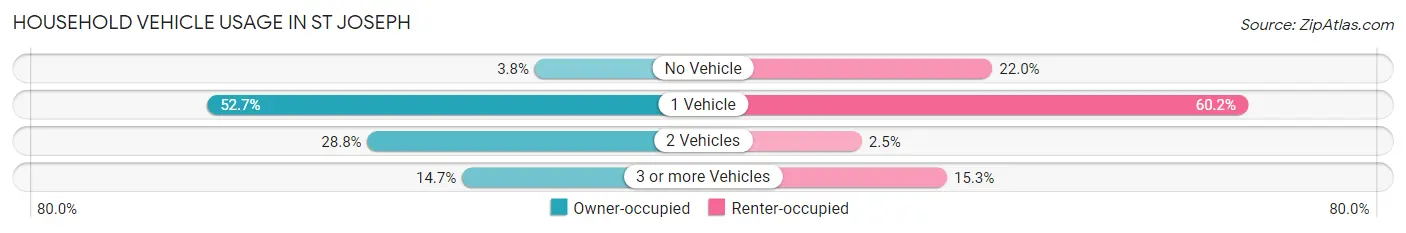
| Vehicles per Household | Owner-occupied | Renter-occupied |
| No Vehicle | 7 (3.8%) | 26 (22.0%) |
| 1 Vehicle | 97 (52.7%) | 71 (60.2%) |
| 2 Vehicles | 53 (28.8%) | 3 (2.5%) |
| 3 or more Vehicles | 27 (14.7%) | 18 (15.2%) |
| Total | 184 (100.0%) | 118 (100.0%) |
Real Estate & Mortgages in St Joseph
Real Estate and Mortgage Overview in St Joseph
| Characteristic | Without Mortgage | With Mortgage |
| Housing Units | 147 | 37 |
| Median Property Value | $60,400 | $110,200 |
| Median Household Income | $37,396 | $0 |
| Monthly Housing Costs | $335 | $0 |
| Real Estate Taxes | $199 | $9 |
Property Value by Mortgage Status in St Joseph
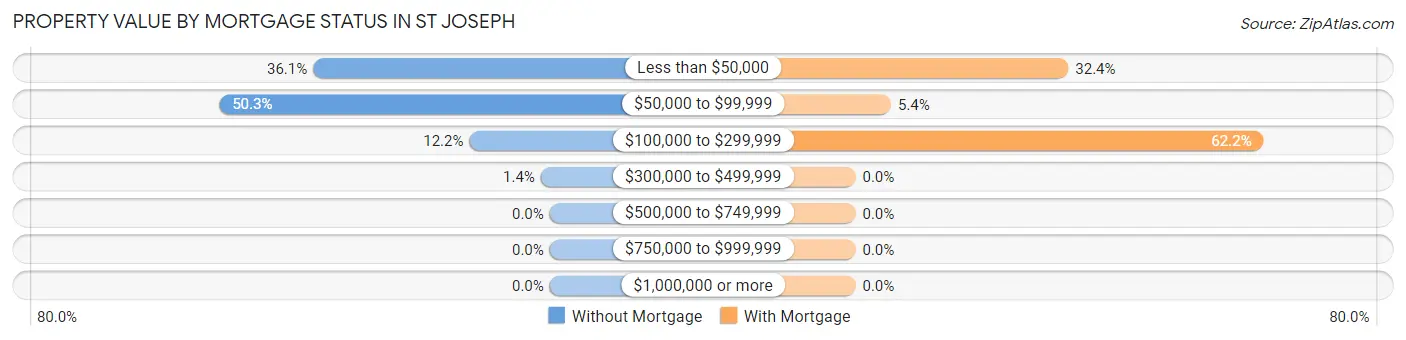
| Property Value | Without Mortgage | With Mortgage |
| Less than $50,000 | 53 (36.0%) | 12 (32.4%) |
| $50,000 to $99,999 | 74 (50.3%) | 2 (5.4%) |
| $100,000 to $299,999 | 18 (12.2%) | 23 (62.2%) |
| $300,000 to $499,999 | 2 (1.4%) | 0 (0.0%) |
| $500,000 to $749,999 | 0 (0.0%) | 0 (0.0%) |
| $750,000 to $999,999 | 0 (0.0%) | 0 (0.0%) |
| $1,000,000 or more | 0 (0.0%) | 0 (0.0%) |
| Total | 147 (100.0%) | 37 (100.0%) |
Household Income by Mortgage Status in St Joseph
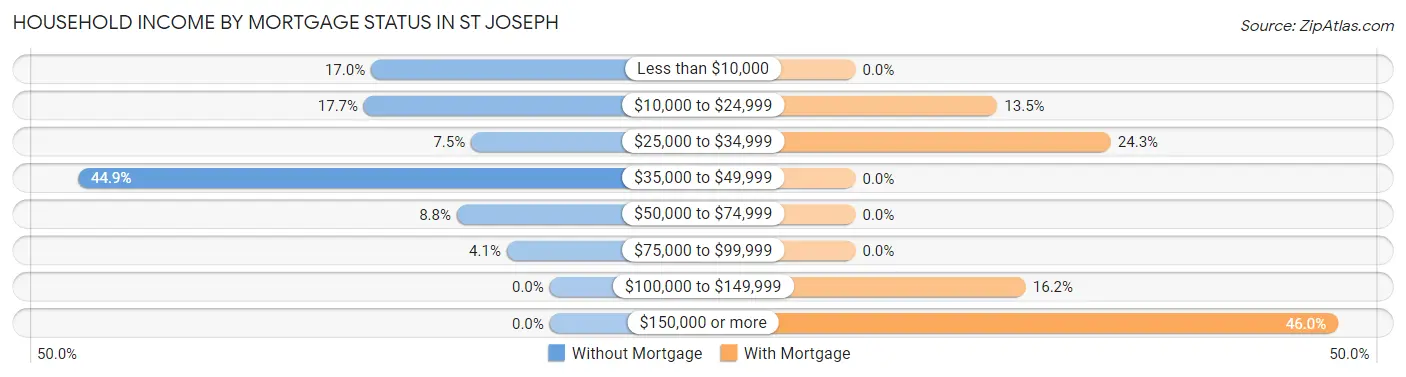
| Household Income | Without Mortgage | With Mortgage |
| Less than $10,000 | 25 (17.0%) | 0 (0.0%) |
| $10,000 to $24,999 | 26 (17.7%) | 5 (13.5%) |
| $25,000 to $34,999 | 11 (7.5%) | 9 (24.3%) |
| $35,000 to $49,999 | 66 (44.9%) | 0 (0.0%) |
| $50,000 to $74,999 | 13 (8.8%) | 0 (0.0%) |
| $75,000 to $99,999 | 6 (4.1%) | 0 (0.0%) |
| $100,000 to $149,999 | 0 (0.0%) | 6 (16.2%) |
| $150,000 or more | 0 (0.0%) | 17 (46.0%) |
| Total | 147 (100.0%) | 37 (100.0%) |
Property Value to Household Income Ratio in St Joseph
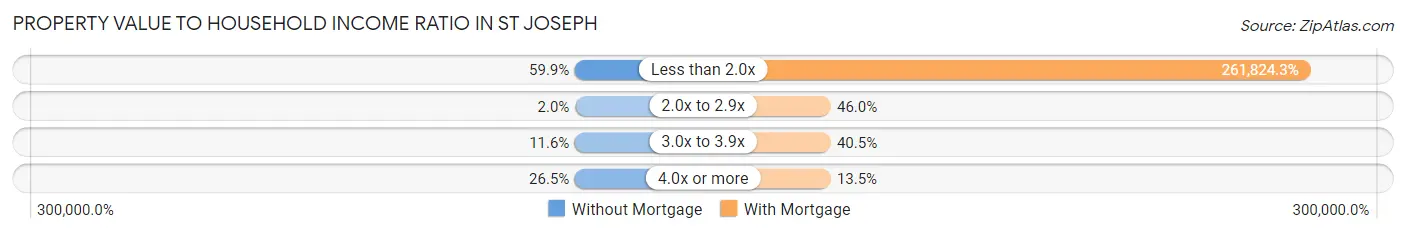
| Value-to-Income Ratio | Without Mortgage | With Mortgage |
| Less than 2.0x | 88 (59.9%) | 96,875 (261,824.3%) |
| 2.0x to 2.9x | 3 (2.0%) | 17 (46.0%) |
| 3.0x to 3.9x | 17 (11.6%) | 15 (40.5%) |
| 4.0x or more | 39 (26.5%) | 5 (13.5%) |
| Total | 147 (100.0%) | 37 (100.0%) |
Real Estate Taxes by Mortgage Status in St Joseph
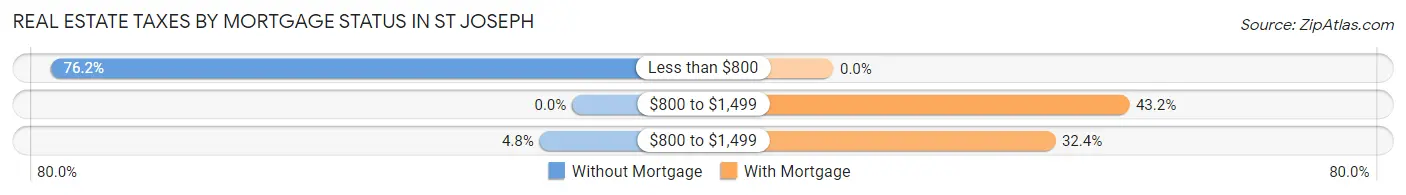
| Property Taxes | Without Mortgage | With Mortgage |
| Less than $800 | 112 (76.2%) | 0 (0.0%) |
| $800 to $1,499 | 0 (0.0%) | 16 (43.2%) |
| $800 to $1,499 | 7 (4.8%) | 12 (32.4%) |
| Total | 147 (100.0%) | 37 (100.0%) |
Health & Disability in St Joseph
Health Insurance Coverage by Age in St Joseph
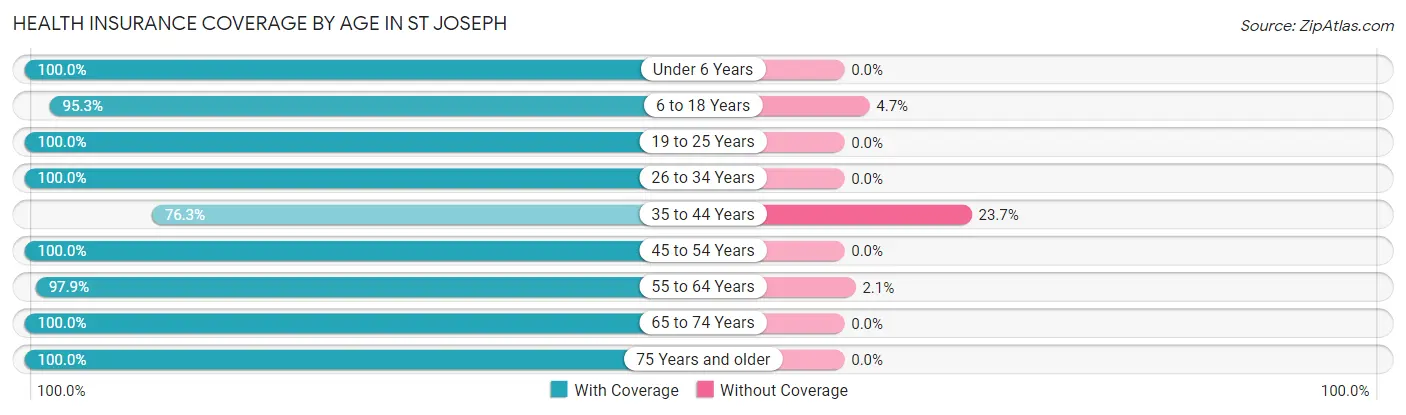
| Age Bracket | With Coverage | Without Coverage |
| Under 6 Years | 28 (100.0%) | 0 (0.0%) |
| 6 to 18 Years | 163 (95.3%) | 8 (4.7%) |
| 19 to 25 Years | 31 (100.0%) | 0 (0.0%) |
| 26 to 34 Years | 58 (100.0%) | 0 (0.0%) |
| 35 to 44 Years | 45 (76.3%) | 14 (23.7%) |
| 45 to 54 Years | 113 (100.0%) | 0 (0.0%) |
| 55 to 64 Years | 141 (97.9%) | 3 (2.1%) |
| 65 to 74 Years | 134 (100.0%) | 0 (0.0%) |
| 75 Years and older | 32 (100.0%) | 0 (0.0%) |
| Total | 745 (96.8%) | 25 (3.3%) |
Health Insurance Coverage by Citizenship Status in St Joseph
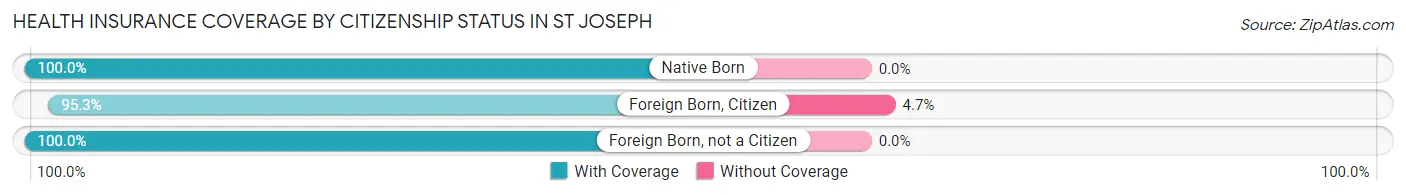
| Citizenship Status | With Coverage | Without Coverage |
| Native Born | 28 (100.0%) | 0 (0.0%) |
| Foreign Born, Citizen | 163 (95.3%) | 8 (4.7%) |
| Foreign Born, not a Citizen | 31 (100.0%) | 0 (0.0%) |
Health Insurance Coverage by Household Income in St Joseph
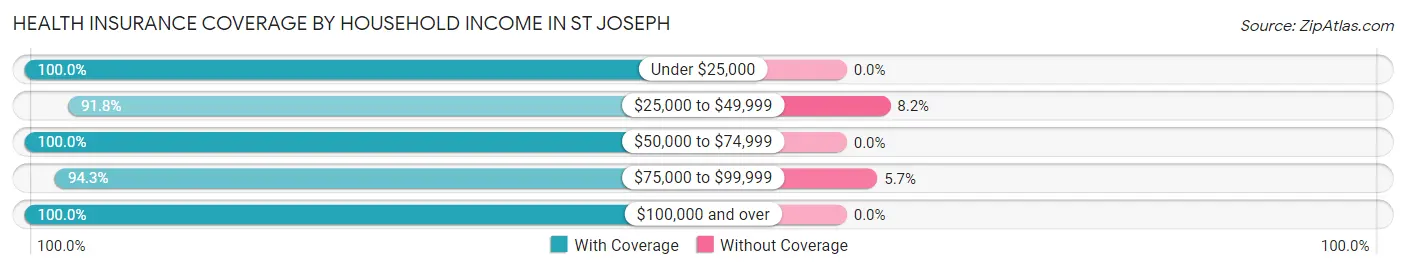
| Household Income | With Coverage | Without Coverage |
| Under $25,000 | 278 (100.0%) | 0 (0.0%) |
| $25,000 to $49,999 | 259 (91.8%) | 23 (8.2%) |
| $50,000 to $74,999 | 83 (100.0%) | 0 (0.0%) |
| $75,000 to $99,999 | 33 (94.3%) | 2 (5.7%) |
| $100,000 and over | 92 (100.0%) | 0 (0.0%) |
Public vs Private Health Insurance Coverage by Age in St Joseph
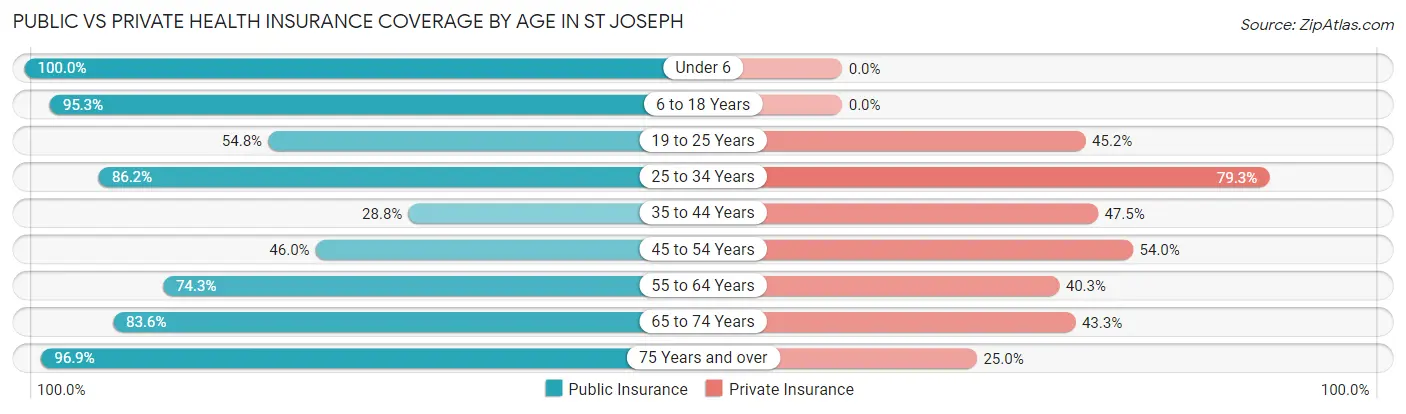
| Age Bracket | Public Insurance | Private Insurance |
| Under 6 | 28 (100.0%) | 0 (0.0%) |
| 6 to 18 Years | 163 (95.3%) | 0 (0.0%) |
| 19 to 25 Years | 17 (54.8%) | 14 (45.2%) |
| 25 to 34 Years | 50 (86.2%) | 46 (79.3%) |
| 35 to 44 Years | 17 (28.8%) | 28 (47.5%) |
| 45 to 54 Years | 52 (46.0%) | 61 (54.0%) |
| 55 to 64 Years | 107 (74.3%) | 58 (40.3%) |
| 65 to 74 Years | 112 (83.6%) | 58 (43.3%) |
| 75 Years and over | 31 (96.9%) | 8 (25.0%) |
| Total | 577 (74.9%) | 273 (35.4%) |
Disability Status by Sex by Age in St Joseph
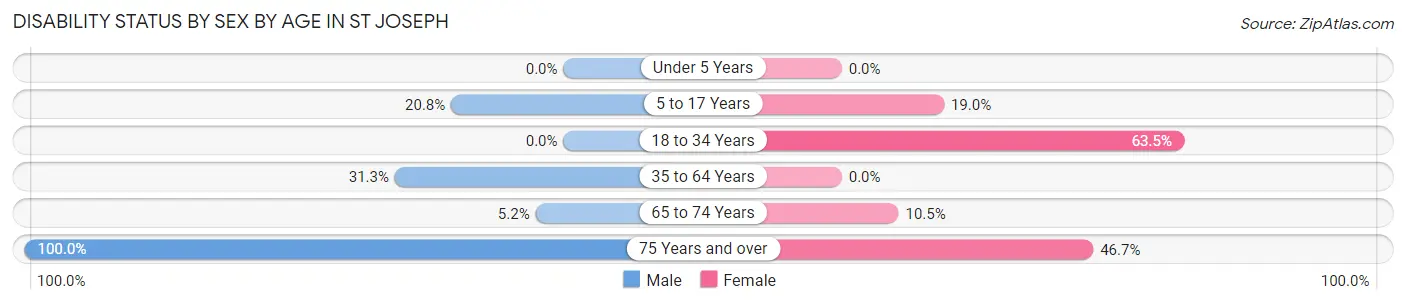
| Age Bracket | Male | Female |
| Under 5 Years | 0 (0.0%) | 0 (0.0%) |
| 5 to 17 Years | 15 (20.8%) | 22 (19.0%) |
| 18 to 34 Years | 0 (0.0%) | 33 (63.5%) |
| 35 to 64 Years | 51 (31.3%) | 0 (0.0%) |
| 65 to 74 Years | 3 (5.2%) | 8 (10.5%) |
| 75 Years and over | 17 (100.0%) | 7 (46.7%) |
Disability Class by Sex by Age in St Joseph
Disability Class: Hearing Difficulty
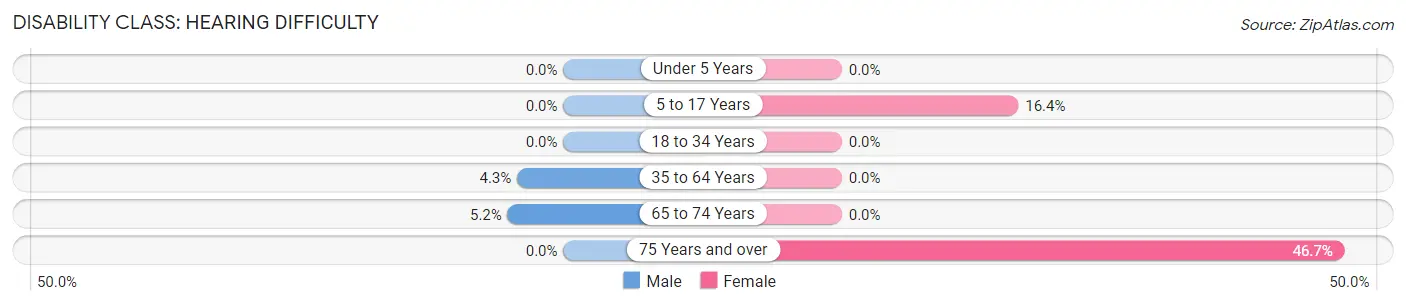
| Age Bracket | Male | Female |
| Under 5 Years | 0 (0.0%) | 0 (0.0%) |
| 5 to 17 Years | 0 (0.0%) | 19 (16.4%) |
| 18 to 34 Years | 0 (0.0%) | 0 (0.0%) |
| 35 to 64 Years | 7 (4.3%) | 0 (0.0%) |
| 65 to 74 Years | 3 (5.2%) | 0 (0.0%) |
| 75 Years and over | 0 (0.0%) | 7 (46.7%) |
Disability Class: Vision Difficulty
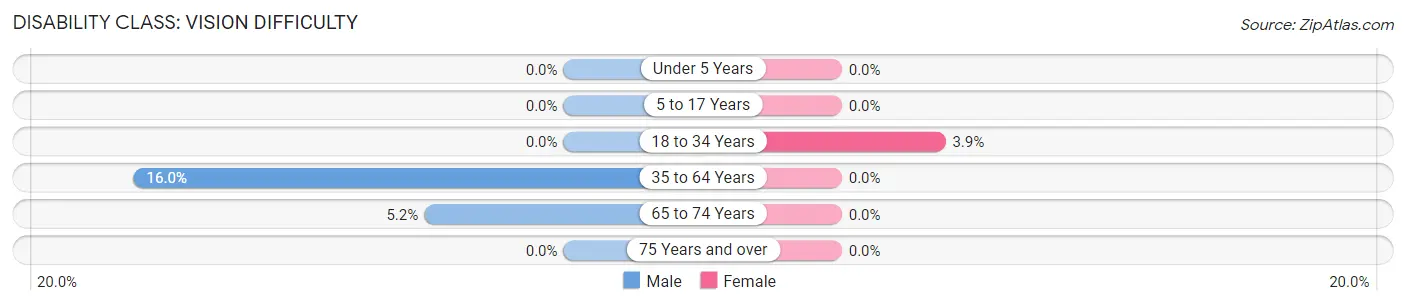
| Age Bracket | Male | Female |
| Under 5 Years | 0 (0.0%) | 0 (0.0%) |
| 5 to 17 Years | 0 (0.0%) | 0 (0.0%) |
| 18 to 34 Years | 0 (0.0%) | 2 (3.8%) |
| 35 to 64 Years | 26 (16.0%) | 0 (0.0%) |
| 65 to 74 Years | 3 (5.2%) | 0 (0.0%) |
| 75 Years and over | 0 (0.0%) | 0 (0.0%) |
Disability Class: Cognitive Difficulty
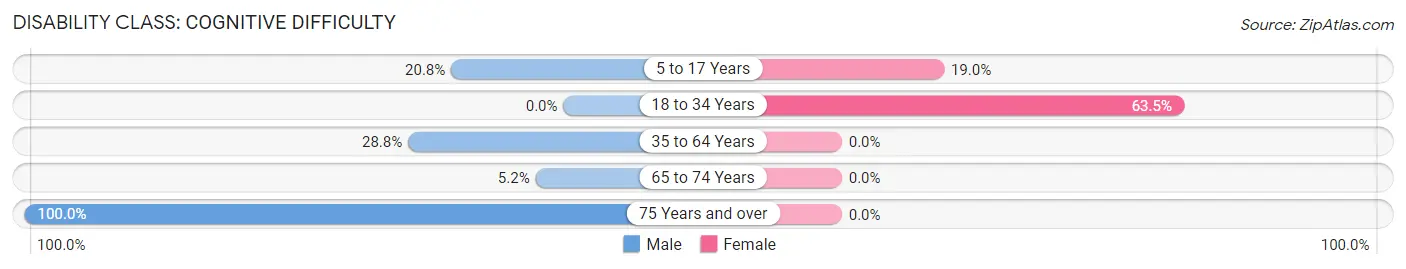
| Age Bracket | Male | Female |
| 5 to 17 Years | 15 (20.8%) | 22 (19.0%) |
| 18 to 34 Years | 0 (0.0%) | 33 (63.5%) |
| 35 to 64 Years | 47 (28.8%) | 0 (0.0%) |
| 65 to 74 Years | 3 (5.2%) | 0 (0.0%) |
| 75 Years and over | 17 (100.0%) | 0 (0.0%) |
Disability Class: Ambulatory Difficulty
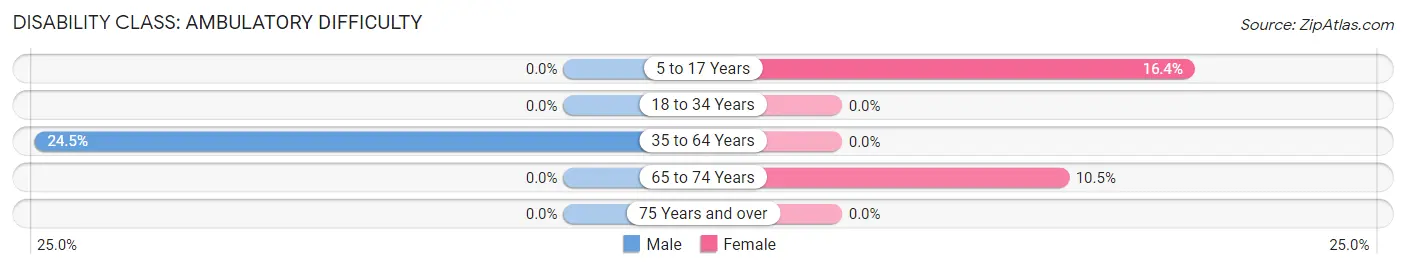
| Age Bracket | Male | Female |
| 5 to 17 Years | 0 (0.0%) | 19 (16.4%) |
| 18 to 34 Years | 0 (0.0%) | 0 (0.0%) |
| 35 to 64 Years | 40 (24.5%) | 0 (0.0%) |
| 65 to 74 Years | 0 (0.0%) | 8 (10.5%) |
| 75 Years and over | 0 (0.0%) | 0 (0.0%) |
Disability Class: Self-Care Difficulty
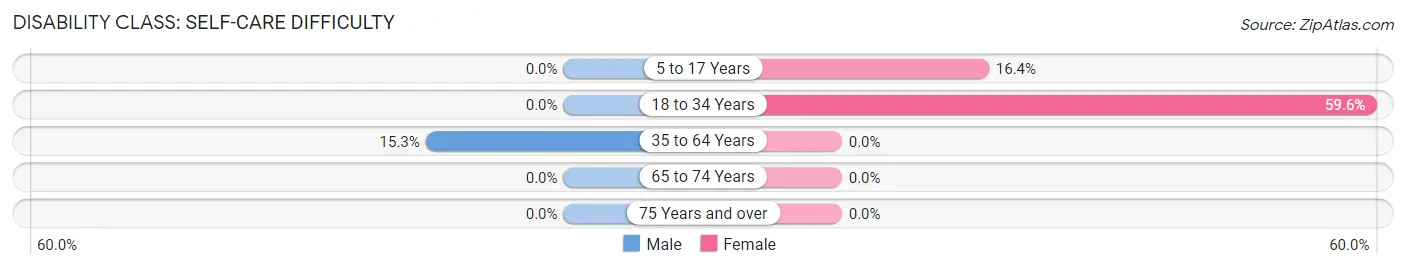
| Age Bracket | Male | Female |
| 5 to 17 Years | 0 (0.0%) | 19 (16.4%) |
| 18 to 34 Years | 0 (0.0%) | 31 (59.6%) |
| 35 to 64 Years | 25 (15.3%) | 0 (0.0%) |
| 65 to 74 Years | 0 (0.0%) | 0 (0.0%) |
| 75 Years and over | 0 (0.0%) | 0 (0.0%) |
Technology Access in St Joseph
Computing Device Access in St Joseph
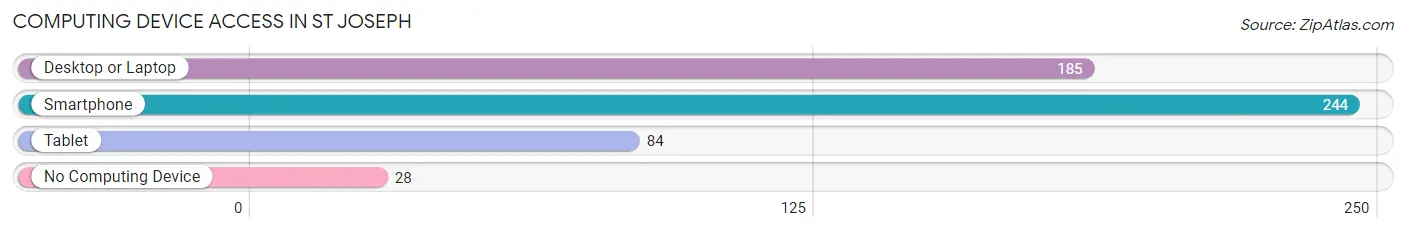
| Device Type | # Households | % Households |
| Desktop or Laptop | 185 | 61.3% |
| Smartphone | 244 | 80.8% |
| Tablet | 84 | 27.8% |
| No Computing Device | 28 | 9.3% |
| Total | 302 | 100.0% |
Internet Access in St Joseph
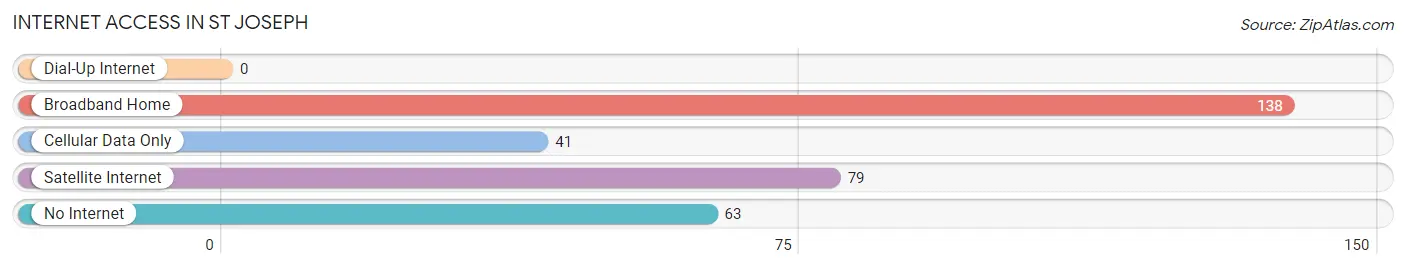
| Internet Type | # Households | % Households |
| Dial-Up Internet | 0 | 0.0% |
| Broadband Home | 138 | 45.7% |
| Cellular Data Only | 41 | 13.6% |
| Satellite Internet | 79 | 26.2% |
| No Internet | 63 | 20.9% |
| Total | 302 | 100.0% |
St Joseph Summary
St. Joseph is a small town located in Tensas Parish, Louisiana. It is situated on the banks of the Mississippi River, approximately 40 miles north of Baton Rouge. The town has a population of 1,845 people, according to the 2010 census.
History
St. Joseph was founded in 1820 by a group of French-speaking settlers from the nearby town of St. Francisville. The town was named after the patron saint of the Catholic Church, St. Joseph. The settlers were attracted to the area due to its fertile soil and abundant wildlife.
The town quickly grew and by the mid-1800s, it had become a thriving port town. It was a major hub for the cotton and sugar industries, as well as a center for trade and commerce. The town was also home to a number of churches, schools, and other businesses.
In the late 1800s, St. Joseph was hit hard by the Civil War. The town was occupied by Union forces and many of its buildings were destroyed. After the war, the town slowly began to rebuild and by the early 1900s, it had become a prosperous agricultural center.
Geography
St. Joseph is located in the southeastern corner of Tensas Parish, Louisiana. It is situated on the banks of the Mississippi River, approximately 40 miles north of Baton Rouge. The town is surrounded by a number of small towns and villages, including St. Francisville, Newellton, and Waterproof.
The town is located in a flat, low-lying area and is prone to flooding. The town is also located in an area of high humidity and temperatures can reach over 100 degrees Fahrenheit in the summer months.
Economy
St. Joseph’s economy is largely based on agriculture. The town is home to a number of farms and ranches, which produce a variety of crops, including cotton, soybeans, corn, and wheat. The town is also home to a number of small businesses, including restaurants, stores, and other services.
The town is also home to a number of manufacturing companies, including a paper mill and a furniture factory. The town is also home to a number of tourist attractions, including the Tensas River National Wildlife Refuge and the St. Joseph Museum.
Demographics
According to the 2010 census, St. Joseph has a population of 1,845 people. The town is predominantly white, with a small African American population. The median household income is $30,000 and the median age is 37.
St. Joseph is a small town with a rich history and a vibrant economy. The town is home to a number of farms and businesses, as well as a number of tourist attractions. The town is also home to a diverse population, with a mix of races and cultures.
Common Questions
What is Per Capita Income in St Joseph?
Per Capita income in St Joseph is $24,883.
What is the Median Family Income in St Joseph?
Median Family Income in St Joseph is $39,375.
What is the Median Household income in St Joseph?
Median Household Income in St Joseph is $34,643.
What is Family Income Deficit in St Joseph?
Family Income Deficit in St Joseph is $13,091.
Families that are below poverty line in St Joseph earn $13,091 less on average than the poverty threshold level.
What is Inequality or Gini Index in St Joseph?
Inequality or Gini Index in St Joseph is 0.60.
What is the Total Population of St Joseph?
Total Population of St Joseph is 776.
What is the Total Male Population of St Joseph?
Total Male Population of St Joseph is 353.
What is the Total Female Population of St Joseph?
Total Female Population of St Joseph is 423.
What is the Ratio of Males per 100 Females in St Joseph?
There are 83.45 Males per 100 Females in St Joseph.
What is the Ratio of Females per 100 Males in St Joseph?
There are 119.83 Females per 100 Males in St Joseph.
What is the Median Population Age in St Joseph?
Median Population Age in St Joseph is 49.5 Years.
What is the Average Family Size in St Joseph
Average Family Size in St Joseph is 4.2 People.
What is the Average Household Size in St Joseph
Average Household Size in St Joseph is 2.5 People.
How Large is the Labor Force in St Joseph?
There are 257 People in the Labor Forcein in St Joseph.
What is the Percentage of People in the Labor Force in St Joseph?
42.9% of People are in the Labor Force in St Joseph.
What is the Unemployment Rate in St Joseph?
Unemployment Rate in St Joseph is 8.2%.