Zip Codes with the Highest Percentage of Population Employed in Architecture & Engineering in Covington, LA
RELATED REPORTS & OPTIONS
Architecture & Engineering
Covington
Compare Zip Codes
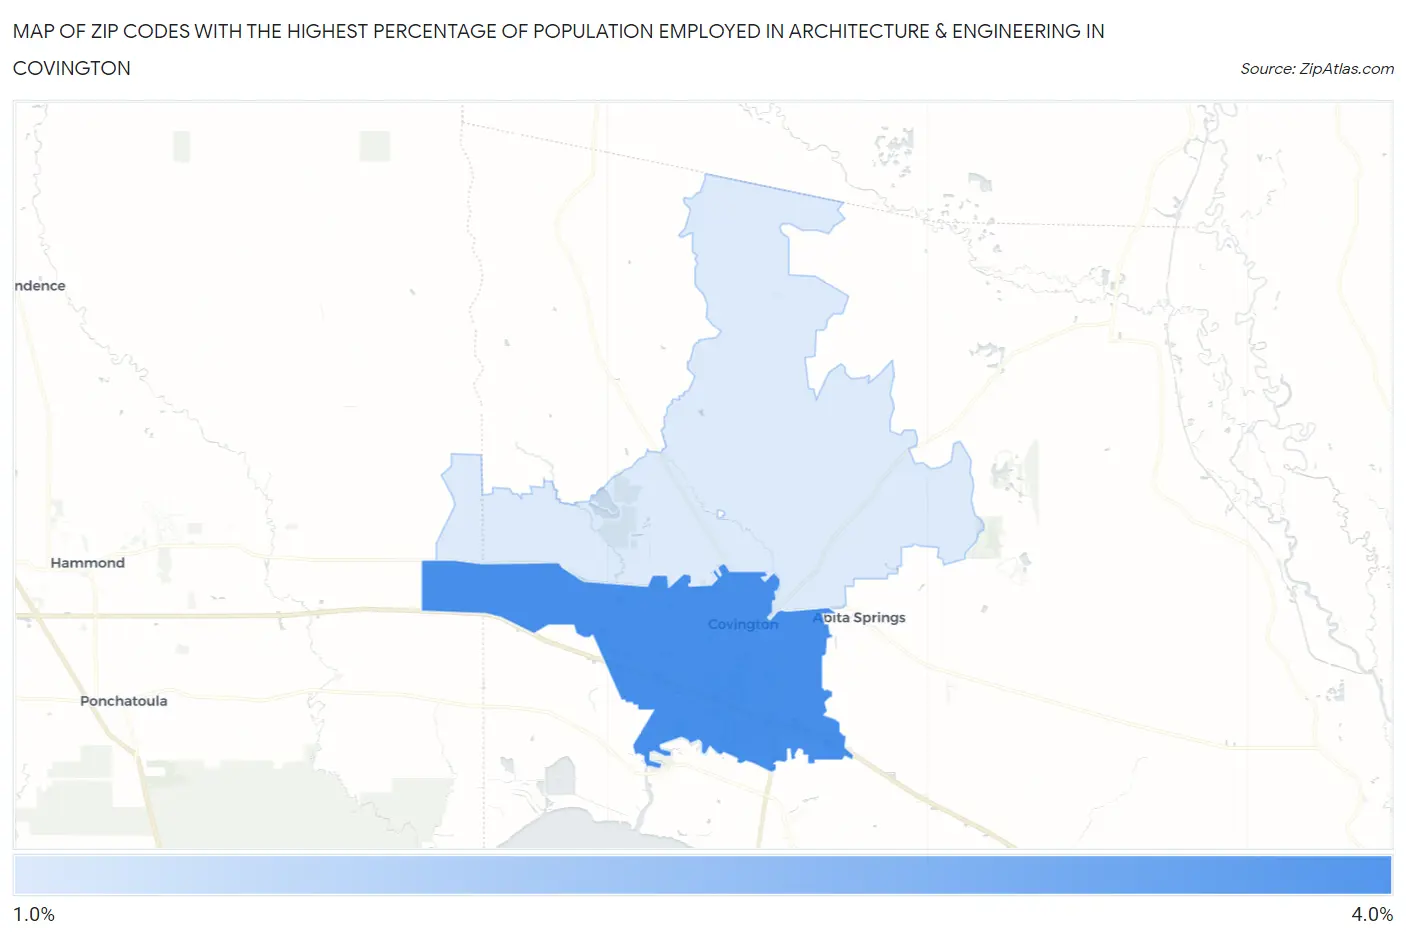
Map of Zip Codes with the Highest Percentage of Population Employed in Architecture & Engineering in Covington
1.2%
3.2%
Zip Codes with the Highest Percentage of Population Employed in Architecture & Engineering in Covington, LA
| Zip Code | % Employed | vs State | vs National | |
| 1. | 70433 | 3.2% | 1.9%(+1.30)#59 | 2.1%(+1.09)#4,349 |
| 2. | 70435 | 1.2% | 1.9%(-0.769)#200 | 2.1%(-0.977)#15,303 |
1
Common Questions
What are the Top Zip Codes with the Highest Percentage of Population Employed in Architecture & Engineering in Covington, LA?
Top Zip Codes with the Highest Percentage of Population Employed in Architecture & Engineering in Covington, LA are:
What zip code has the Highest Percentage of Population Employed in Architecture & Engineering in Covington, LA?
70433 has the Highest Percentage of Population Employed in Architecture & Engineering in Covington, LA with 3.2%.
What is the Percentage of Population Employed in Architecture & Engineering in Covington, LA?
Percentage of Population Employed in Architecture & Engineering in Covington is 1.7%.
What is the Percentage of Population Employed in Architecture & Engineering in Louisiana?
Percentage of Population Employed in Architecture & Engineering in Louisiana is 1.9%.
What is the Percentage of Population Employed in Architecture & Engineering in the United States?
Percentage of Population Employed in Architecture & Engineering in the United States is 2.1%.