Bourg, LA Map & Demographics
Bourg Map
Bourg Overview
$40,015
PER CAPITA INCOME
$98,875
AVG FAMILY INCOME
$97,594
AVG HOUSEHOLD INCOME
31.7%
WAGE / INCOME GAP [ % ]
68.3¢/ $1
WAGE / INCOME GAP [ $ ]
0.37
INEQUALITY / GINI INDEX
2,010
TOTAL POPULATION
956
MALE POPULATION
1,054
FEMALE POPULATION
90.70
MALES / 100 FEMALES
110.25
FEMALES / 100 MALES
46.4
MEDIAN AGE
2.6
AVG FAMILY SIZE
2.5
AVG HOUSEHOLD SIZE
1,062
LABOR FORCE [ PEOPLE ]
66.6%
PERCENT IN LABOR FORCE
0.8%
UNEMPLOYMENT RATE
Bourg Zip Codes
Bourg Area Codes
Income in Bourg
Income Overview in Bourg
Per Capita Income in Bourg is $40,015, while median incomes of families and households are $98,875 and $97,594 respectively.
| Characteristic | Number | Measure |
| Per Capita Income | 2,010 | $40,015 |
| Median Family Income | 700 | $98,875 |
| Mean Family Income | 700 | $108,751 |
| Median Household Income | 787 | $97,594 |
| Mean Household Income | 787 | $105,747 |
| Income Deficit | 700 | $0 |
| Wage / Income Gap (%) | 2,010 | 31.69% |
| Wage / Income Gap ($) | 2,010 | 68.31¢ per $1 |
| Gini / Inequality Index | 2,010 | 0.37 |
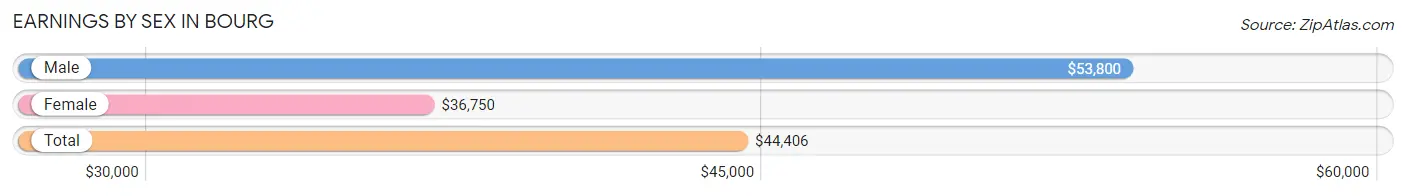
Earnings by Sex in Bourg
Average Earnings in Bourg are $44,406, $53,800 for men and $36,750 for women, a difference of 31.7%.
| Sex | Number | Average Earnings |
| Male | 588 (52.3%) | $53,800 |
| Female | 537 (47.7%) | $36,750 |
| Total | 1,125 (100.0%) | $44,406 |
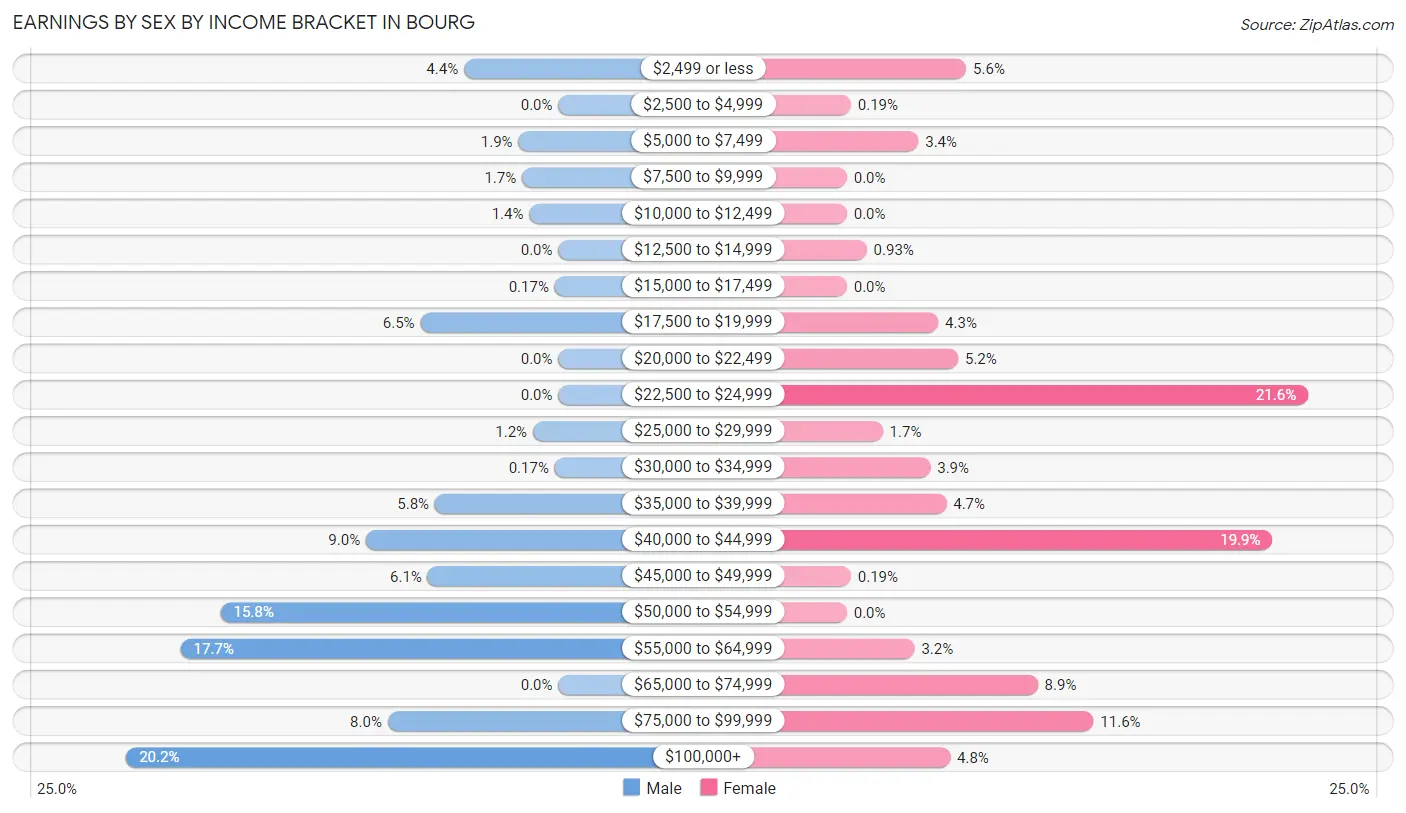
Earnings by Sex by Income Bracket in Bourg
The most common earnings brackets in Bourg are $100,000+ for men (119 | 20.2%) and $22,500 to $24,999 for women (116 | 21.6%).
| Income | Male | Female |
| $2,499 or less | 26 (4.4%) | 30 (5.6%) |
| $2,500 to $4,999 | 0 (0.0%) | 1 (0.2%) |
| $5,000 to $7,499 | 11 (1.9%) | 18 (3.4%) |
| $7,500 to $9,999 | 10 (1.7%) | 0 (0.0%) |
| $10,000 to $12,499 | 8 (1.4%) | 0 (0.0%) |
| $12,500 to $14,999 | 0 (0.0%) | 5 (0.9%) |
| $15,000 to $17,499 | 1 (0.2%) | 0 (0.0%) |
| $17,500 to $19,999 | 38 (6.5%) | 23 (4.3%) |
| $20,000 to $22,499 | 0 (0.0%) | 28 (5.2%) |
| $22,500 to $24,999 | 0 (0.0%) | 116 (21.6%) |
| $25,000 to $29,999 | 7 (1.2%) | 9 (1.7%) |
| $30,000 to $34,999 | 1 (0.2%) | 21 (3.9%) |
| $35,000 to $39,999 | 34 (5.8%) | 25 (4.7%) |
| $40,000 to $44,999 | 53 (9.0%) | 107 (19.9%) |
| $45,000 to $49,999 | 36 (6.1%) | 1 (0.2%) |
| $50,000 to $54,999 | 93 (15.8%) | 0 (0.0%) |
| $55,000 to $64,999 | 104 (17.7%) | 17 (3.2%) |
| $65,000 to $74,999 | 0 (0.0%) | 48 (8.9%) |
| $75,000 to $99,999 | 47 (8.0%) | 62 (11.6%) |
| $100,000+ | 119 (20.2%) | 26 (4.8%) |
| Total | 588 (100.0%) | 537 (100.0%) |
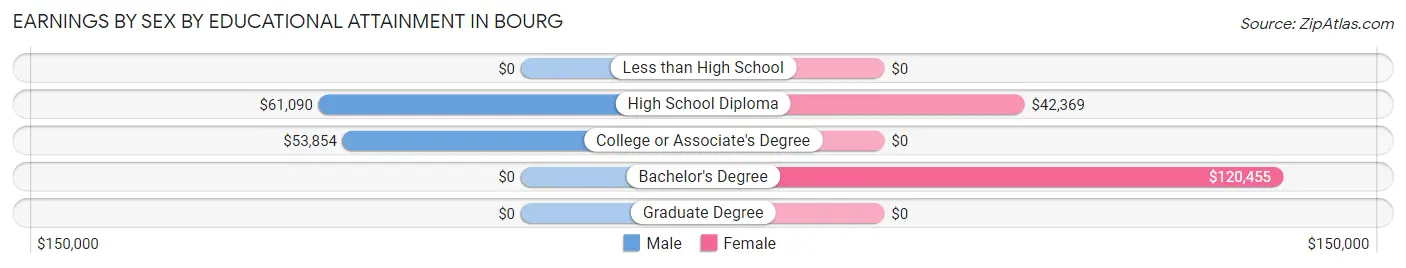
Earnings by Sex by Educational Attainment in Bourg
Average earnings in Bourg are $55,888 for men and $40,784 for women, a difference of 27.0%. Men with an educational attainment of high school diploma enjoy the highest average annual earnings of $61,090, while those with college or associate's degree education earn the least with $53,854. Women with an educational attainment of bachelor's degree earn the most with the average annual earnings of $120,455, while those with high school diploma education have the smallest earnings of $42,369.
| Educational Attainment | Male Income | Female Income |
| Less than High School | - | - |
| High School Diploma | $61,090 | $42,369 |
| College or Associate's Degree | $53,854 | $0 |
| Bachelor's Degree | - | - |
| Graduate Degree | - | - |
| Total | $55,888 | $40,784 |
Family Income in Bourg
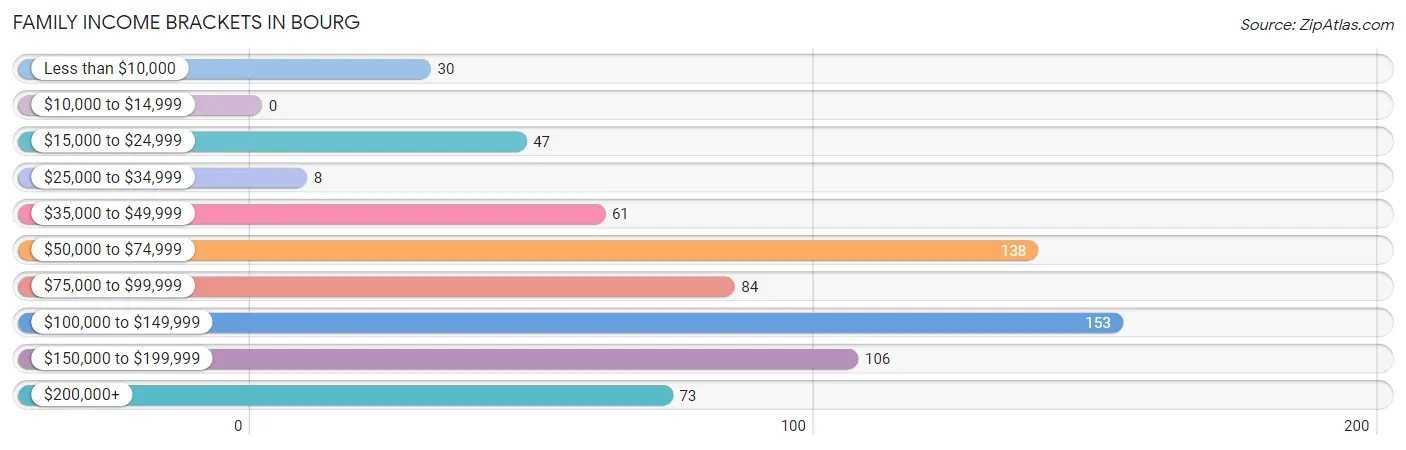
Family Income Brackets in Bourg
According to the Bourg family income data, there are 153 families falling into the $100,000 to $149,999 income range, which is the most common income bracket and makes up 21.9% of all families.
| Income Bracket | # Families | % Families |
| Less than $10,000 | 30 | 4.3% |
| $10,000 to $14,999 | 0 | 0.0% |
| $15,000 to $24,999 | 47 | 6.7% |
| $25,000 to $34,999 | 8 | 1.1% |
| $35,000 to $49,999 | 61 | 8.7% |
| $50,000 to $74,999 | 138 | 19.7% |
| $75,000 to $99,999 | 84 | 12.0% |
| $100,000 to $149,999 | 153 | 21.9% |
| $150,000 to $199,999 | 106 | 15.1% |
| $200,000+ | 73 | 10.4% |
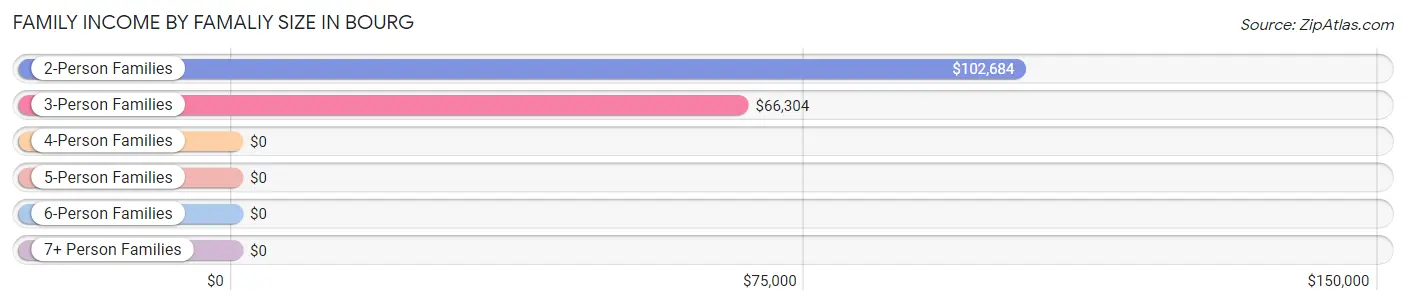
Family Income by Famaliy Size in Bourg
2-person families (275 | 39.3%) account for the highest median family income in Bourg with $102,684 per family, while 2-person families (275 | 39.3%) have the highest median income of $51,342 per family member.
| Income Bracket | # Families | Median Income |
| 2-Person Families | 275 (39.3%) | $102,684 |
| 3-Person Families | 237 (33.9%) | $66,304 |
| 4-Person Families | 161 (23.0%) | $0 |
| 5-Person Families | 26 (3.7%) | $0 |
| 6-Person Families | 1 (0.1%) | $0 |
| 7+ Person Families | 0 (0.0%) | $0 |
| Total | 700 (100.0%) | $98,875 |
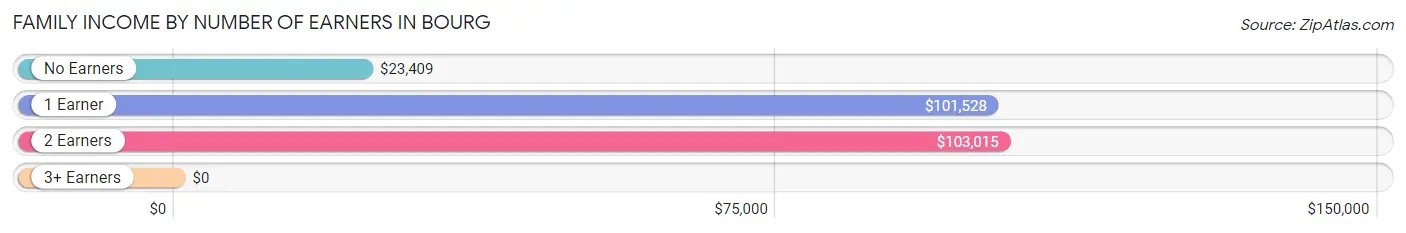
Family Income by Number of Earners in Bourg
| Number of Earners | # Families | Median Income |
| No Earners | 126 (18.0%) | $23,409 |
| 1 Earner | 166 (23.7%) | $101,528 |
| 2 Earners | 326 (46.6%) | $103,015 |
| 3+ Earners | 82 (11.7%) | $0 |
| Total | 700 (100.0%) | $98,875 |
Household Income in Bourg
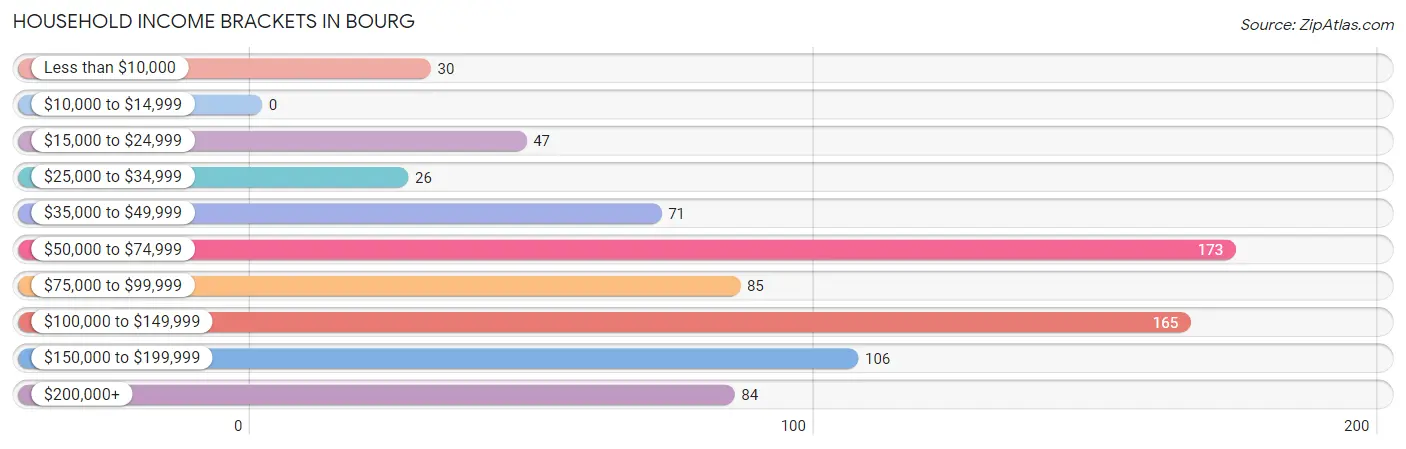
Household Income Brackets in Bourg
With 173 households falling in the category, the $50,000 to $74,999 income range is the most frequent in Bourg, accounting for 22.0% of all households.
| Income Bracket | # Households | % Households |
| Less than $10,000 | 30 | 3.8% |
| $10,000 to $14,999 | 0 | 0.0% |
| $15,000 to $24,999 | 47 | 6.0% |
| $25,000 to $34,999 | 26 | 3.3% |
| $35,000 to $49,999 | 71 | 9.0% |
| $50,000 to $74,999 | 173 | 22.0% |
| $75,000 to $99,999 | 85 | 10.8% |
| $100,000 to $149,999 | 165 | 21.0% |
| $150,000 to $199,999 | 106 | 13.5% |
| $200,000+ | 84 | 10.7% |
Household Income by Householder Age in Bourg
The median household income in Bourg is $97,594, with the highest median household income of $100,586 found in the 45 to 64 years age bracket for the primary householder. A total of 345 households (43.8%) fall into this category. Meanwhile, the 15 to 24 years age bracket for the primary householder has the lowest median household income of $0, with 25 households (3.2%) in this group.
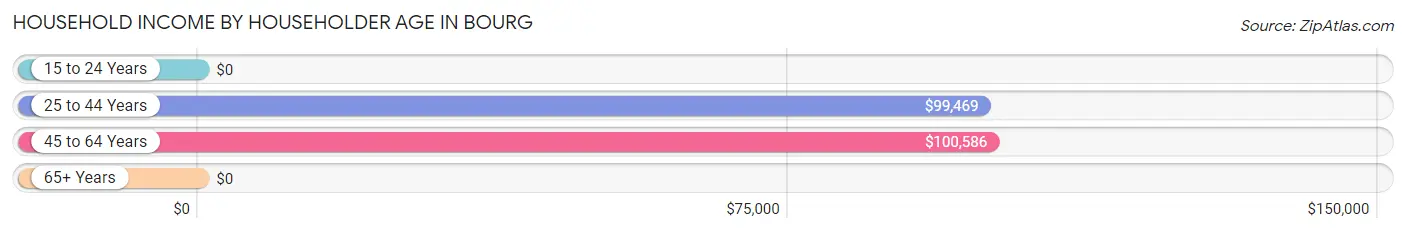
| Income Bracket | # Households | Median Income |
| 15 to 24 Years | 25 (3.2%) | $0 |
| 25 to 44 Years | 173 (22.0%) | $99,469 |
| 45 to 64 Years | 345 (43.8%) | $100,586 |
| 65+ Years | 244 (31.0%) | $0 |
| Total | 787 (100.0%) | $97,594 |
Poverty in Bourg
Income Below Poverty by Sex and Age in Bourg
With 5.7% poverty level for males and 8.9% for females among the residents of Bourg, 65 to 74 year old males and 25 to 34 year old females are the most vulnerable to poverty, with 35 males (20.5%) and 30 females (30.9%) in their respective age groups living below the poverty level.
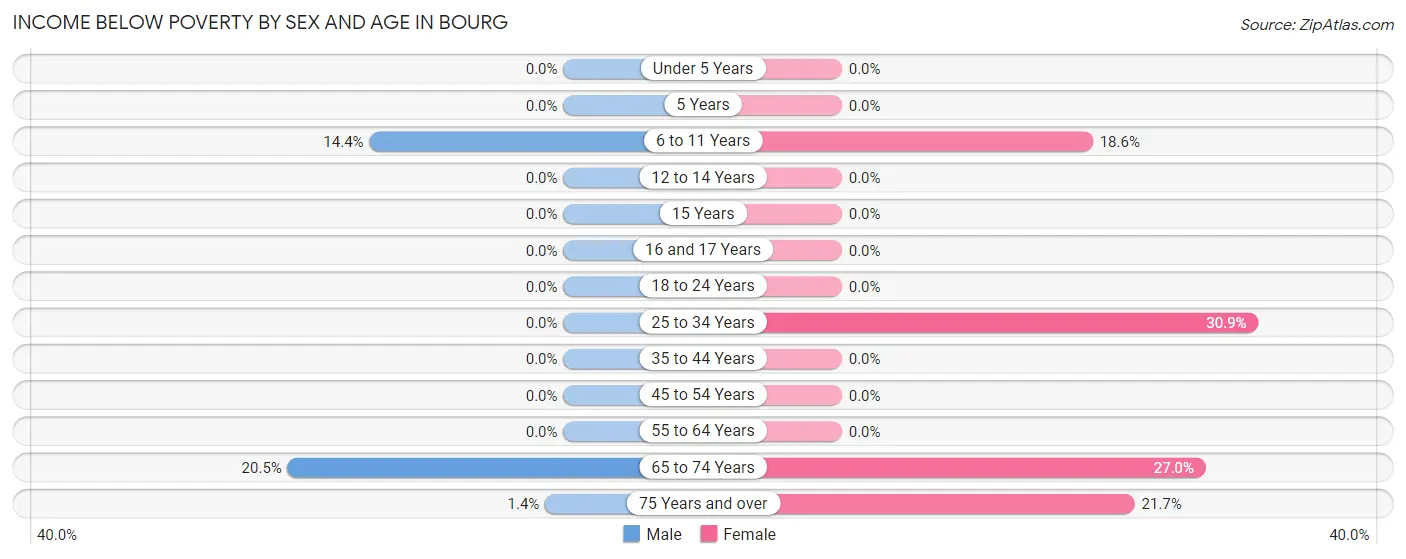
| Age Bracket | Male | Female |
| Under 5 Years | 0 (0.0%) | 0 (0.0%) |
| 5 Years | 0 (0.0%) | 0 (0.0%) |
| 6 to 11 Years | 18 (14.4%) | 19 (18.6%) |
| 12 to 14 Years | 0 (0.0%) | 0 (0.0%) |
| 15 Years | 0 (0.0%) | 0 (0.0%) |
| 16 and 17 Years | 0 (0.0%) | 0 (0.0%) |
| 18 to 24 Years | 0 (0.0%) | 0 (0.0%) |
| 25 to 34 Years | 0 (0.0%) | 30 (30.9%) |
| 35 to 44 Years | 0 (0.0%) | 0 (0.0%) |
| 45 to 54 Years | 0 (0.0%) | 0 (0.0%) |
| 55 to 64 Years | 0 (0.0%) | 0 (0.0%) |
| 65 to 74 Years | 35 (20.5%) | 30 (27.0%) |
| 75 Years and over | 1 (1.3%) | 15 (21.7%) |
| Total | 54 (5.7%) | 94 (8.9%) |
Income Above Poverty by Sex and Age in Bourg
According to the poverty statistics in Bourg, males aged 12 to 14 years and females aged under 5 years are the age groups that are most secure financially, with 100.0% of males and 100.0% of females in these age groups living above the poverty line.
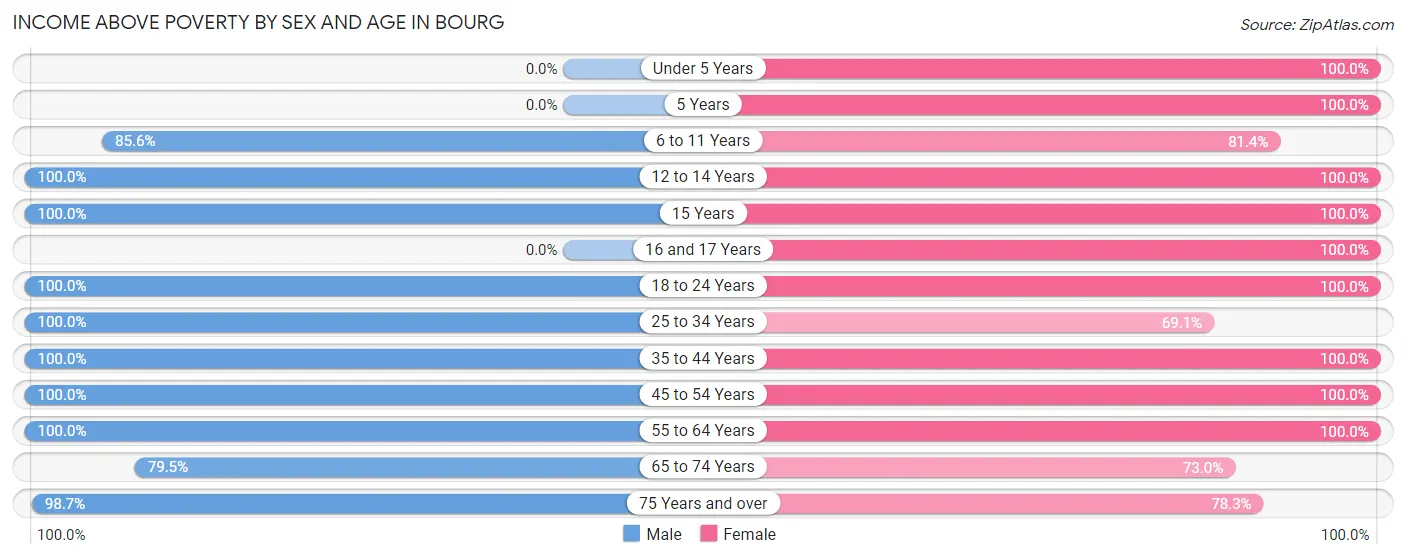
| Age Bracket | Male | Female |
| Under 5 Years | 0 (0.0%) | 25 (100.0%) |
| 5 Years | 0 (0.0%) | 30 (100.0%) |
| 6 to 11 Years | 107 (85.6%) | 83 (81.4%) |
| 12 to 14 Years | 55 (100.0%) | 27 (100.0%) |
| 15 Years | 16 (100.0%) | 36 (100.0%) |
| 16 and 17 Years | 0 (0.0%) | 9 (100.0%) |
| 18 to 24 Years | 89 (100.0%) | 57 (100.0%) |
| 25 to 34 Years | 70 (100.0%) | 67 (69.1%) |
| 35 to 44 Years | 108 (100.0%) | 106 (100.0%) |
| 45 to 54 Years | 89 (100.0%) | 167 (100.0%) |
| 55 to 64 Years | 159 (100.0%) | 218 (100.0%) |
| 65 to 74 Years | 136 (79.5%) | 81 (73.0%) |
| 75 Years and over | 73 (98.7%) | 54 (78.3%) |
| Total | 902 (94.4%) | 960 (91.1%) |
Income Below Poverty Among Married-Couple Families in Bourg
The poverty statistics for married-couple families in Bourg show that 4.8% or 30 of the total 621 families live below the poverty line. Families with no children have the highest poverty rate of 9.0%, comprising of 30 families. On the other hand, families with 1 or 2 children have the lowest poverty rate of 0.0%, which includes 0 families.
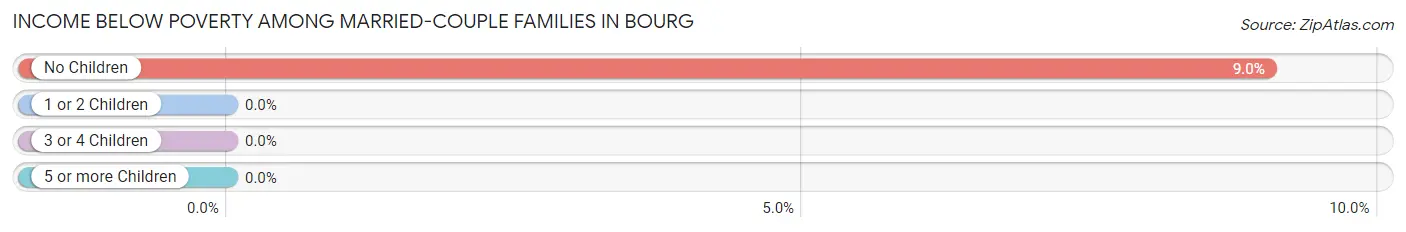
| Children | Above Poverty | Below Poverty |
| No Children | 302 (91.0%) | 30 (9.0%) |
| 1 or 2 Children | 271 (100.0%) | 0 (0.0%) |
| 3 or 4 Children | 18 (100.0%) | 0 (0.0%) |
| 5 or more Children | 0 (0.0%) | 0 (0.0%) |
| Total | 591 (95.2%) | 30 (4.8%) |
Income Below Poverty Among Single-Parent Households in Bourg
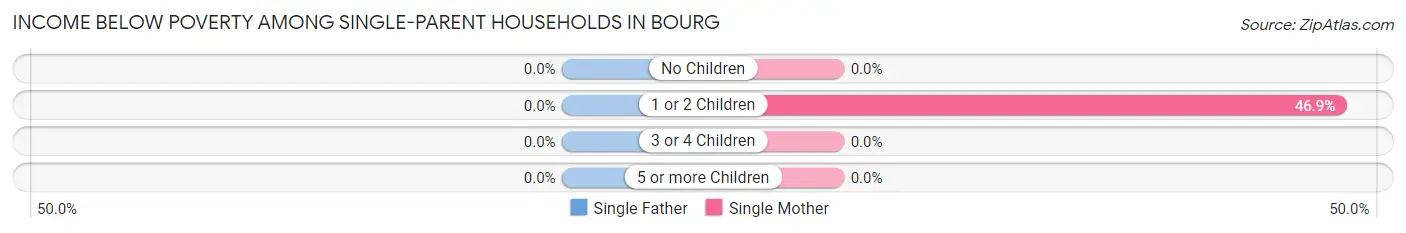
| Children | Single Father | Single Mother |
| No Children | 0 (0.0%) | 0 (0.0%) |
| 1 or 2 Children | 0 (0.0%) | 15 (46.9%) |
| 3 or 4 Children | 0 (0.0%) | 0 (0.0%) |
| 5 or more Children | 0 (0.0%) | 0 (0.0%) |
| Total | 0 (0.0%) | 15 (46.9%) |
Income Below Poverty Among Married-Couple vs Single-Parent Households in Bourg
The poverty data for Bourg shows that 30 of the married-couple family households (4.8%) and 15 of the single-parent households (19.0%) are living below the poverty level. Within the married-couple family households, those with no children have the highest poverty rate, with 30 households (9.0%) falling below the poverty line. Among the single-parent households, those with 1 or 2 children have the highest poverty rate, with 15 household (19.0%) living below poverty.
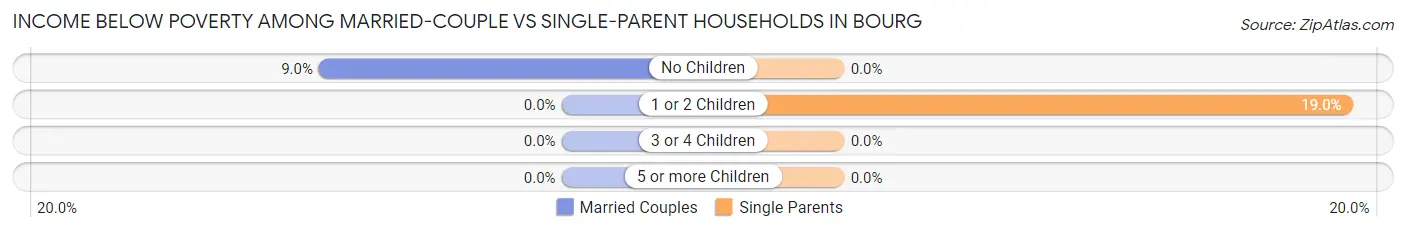
| Children | Married-Couple Families | Single-Parent Households |
| No Children | 30 (9.0%) | 0 (0.0%) |
| 1 or 2 Children | 0 (0.0%) | 15 (19.0%) |
| 3 or 4 Children | 0 (0.0%) | 0 (0.0%) |
| 5 or more Children | 0 (0.0%) | 0 (0.0%) |
| Total | 30 (4.8%) | 15 (19.0%) |
Race in Bourg
The most populous races in Bourg are White / Caucasian (1,743 | 86.7%), Native / Alaskan (140 | 7.0%), and Two or more Races (127 | 6.3%).
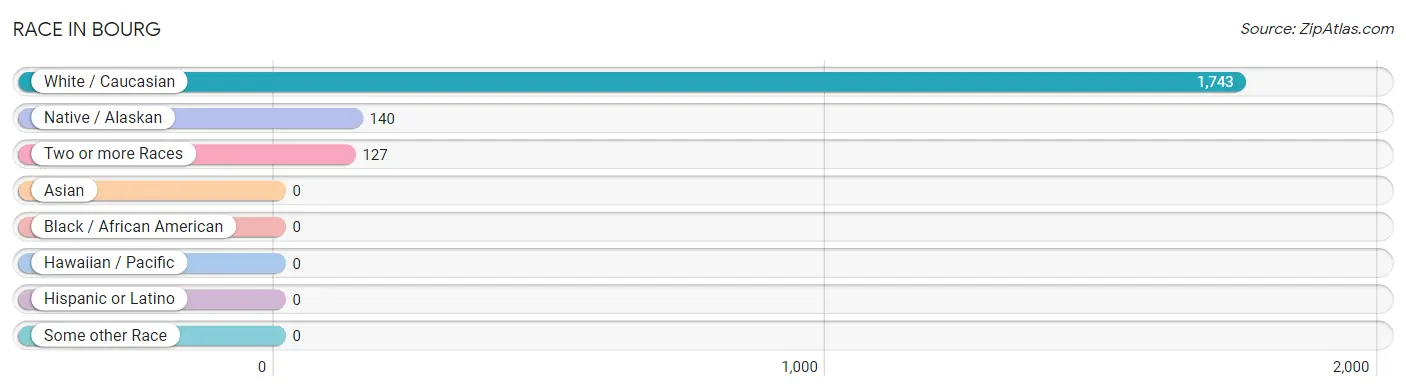
| Race | # Population | % Population |
| Asian | 0 | 0.0% |
| Black / African American | 0 | 0.0% |
| Hawaiian / Pacific | 0 | 0.0% |
| Hispanic or Latino | 0 | 0.0% |
| Native / Alaskan | 140 | 7.0% |
| White / Caucasian | 1,743 | 86.7% |
| Two or more Races | 127 | 6.3% |
| Some other Race | 0 | 0.0% |
| Total | 2,010 | 100.0% |
Ancestry in Bourg
The most populous ancestries reported in Bourg are French (471 | 23.4%), English (316 | 15.7%), German (153 | 7.6%), American (113 | 5.6%), and Choctaw (85 | 4.2%), together accounting for 56.6% of all Bourg residents.
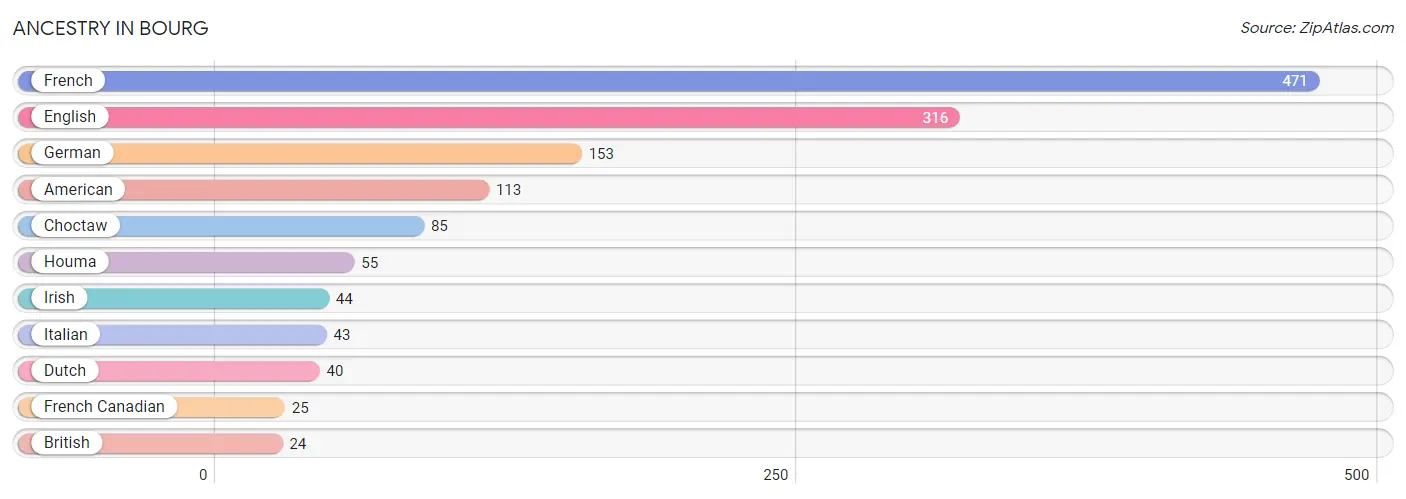
| Ancestry | # Population | % Population |
| American | 113 | 5.6% |
| British | 24 | 1.2% |
| Choctaw | 85 | 4.2% |
| Dutch | 40 | 2.0% |
| English | 316 | 15.7% |
| French | 471 | 23.4% |
| French Canadian | 25 | 1.2% |
| German | 153 | 7.6% |
| Houma | 55 | 2.7% |
| Irish | 44 | 2.2% |
| Italian | 43 | 2.1% | View All 11 Rows |
Immigrants in Bourg
The most numerous immigrant groups reported in Bourg came from Europe (21 | 1.0%), Netherlands (21 | 1.0%), and Western Europe (21 | 1.0%), together accounting for 3.1% of all Bourg residents.
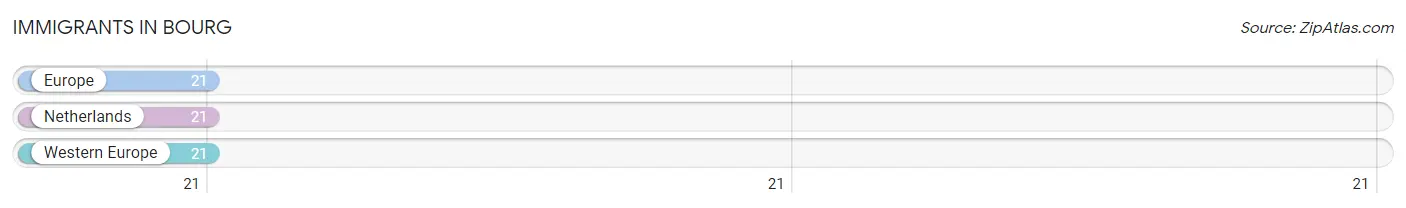
| Immigration Origin | # Population | % Population |
| Europe | 21 | 1.0% |
| Netherlands | 21 | 1.0% |
| Western Europe | 21 | 1.0% | View All 3 Rows |
Sex and Age in Bourg
Sex and Age in Bourg
The most populous age groups in Bourg are 55 to 59 Years (108 | 11.3%) for men and 45 to 49 Years (145 | 13.8%) for women.
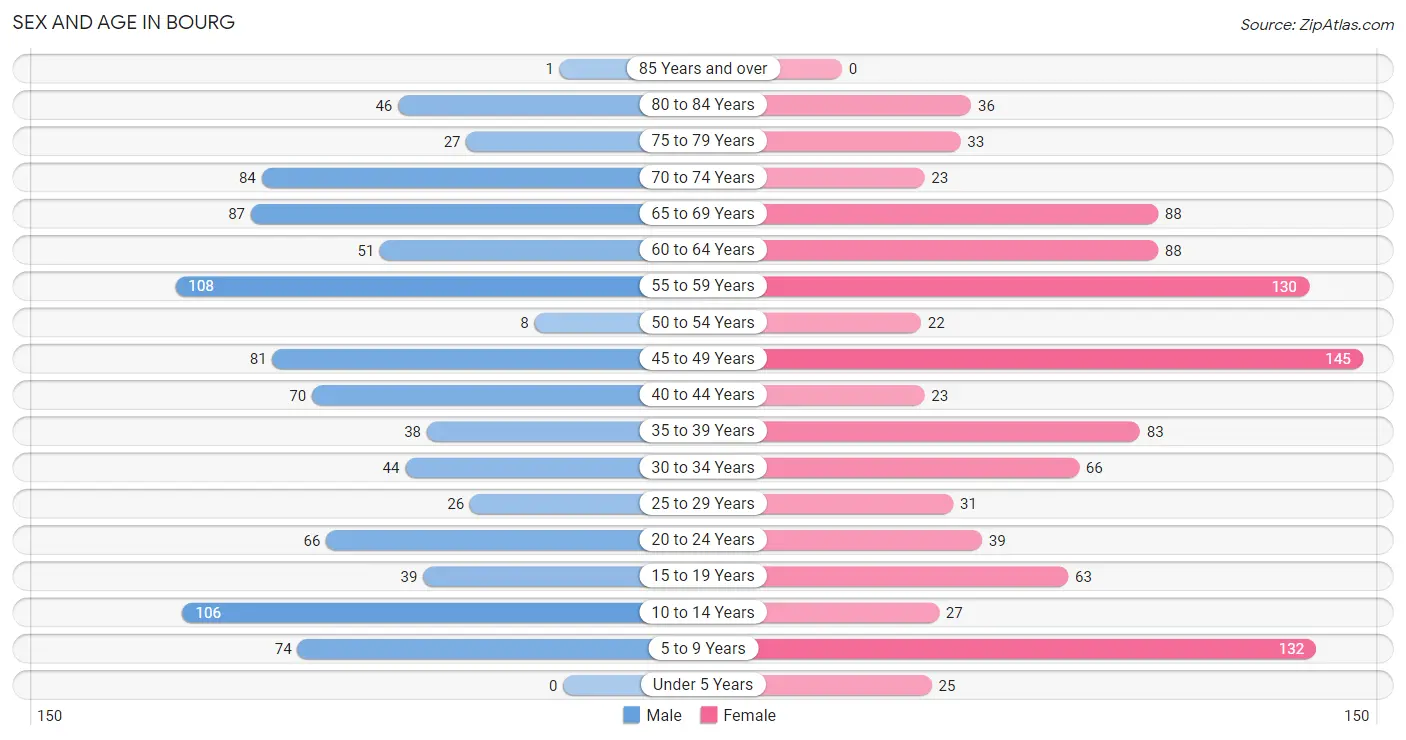
| Age Bracket | Male | Female |
| Under 5 Years | 0 (0.0%) | 25 (2.4%) |
| 5 to 9 Years | 74 (7.7%) | 132 (12.5%) |
| 10 to 14 Years | 106 (11.1%) | 27 (2.6%) |
| 15 to 19 Years | 39 (4.1%) | 63 (6.0%) |
| 20 to 24 Years | 66 (6.9%) | 39 (3.7%) |
| 25 to 29 Years | 26 (2.7%) | 31 (2.9%) |
| 30 to 34 Years | 44 (4.6%) | 66 (6.3%) |
| 35 to 39 Years | 38 (4.0%) | 83 (7.9%) |
| 40 to 44 Years | 70 (7.3%) | 23 (2.2%) |
| 45 to 49 Years | 81 (8.5%) | 145 (13.8%) |
| 50 to 54 Years | 8 (0.8%) | 22 (2.1%) |
| 55 to 59 Years | 108 (11.3%) | 130 (12.3%) |
| 60 to 64 Years | 51 (5.3%) | 88 (8.4%) |
| 65 to 69 Years | 87 (9.1%) | 88 (8.4%) |
| 70 to 74 Years | 84 (8.8%) | 23 (2.2%) |
| 75 to 79 Years | 27 (2.8%) | 33 (3.1%) |
| 80 to 84 Years | 46 (4.8%) | 36 (3.4%) |
| 85 Years and over | 1 (0.1%) | 0 (0.0%) |
| Total | 956 (100.0%) | 1,054 (100.0%) |
Families and Households in Bourg
Median Family Size in Bourg
The median family size in Bourg is 2.64 persons per family, with single female/mother families (32 | 4.6%) accounting for the largest median family size of 3.31 persons per family. On the other hand, single male/father families (47 | 6.7%) represent the smallest median family size with 2.57 persons per family.
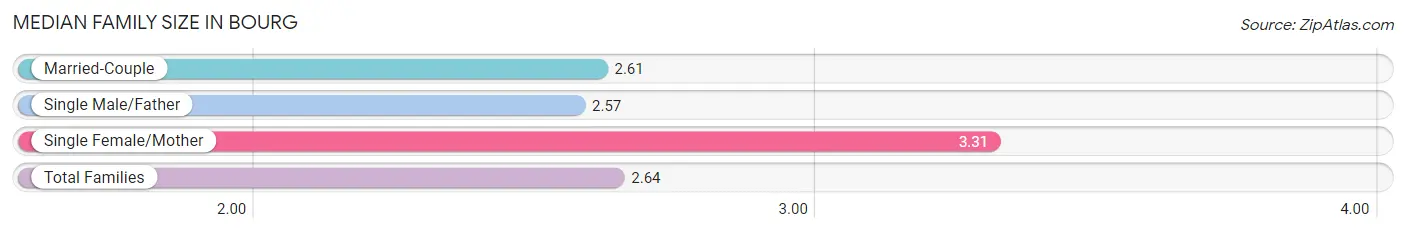
| Family Type | # Families | Family Size |
| Married-Couple | 621 (88.7%) | 2.61 |
| Single Male/Father | 47 (6.7%) | 2.57 |
| Single Female/Mother | 32 (4.6%) | 3.31 |
| Total Families | 700 (100.0%) | 2.64 |
Median Household Size in Bourg
The median household size in Bourg is 2.55 persons per household, with single female/mother households (32 | 4.1%) accounting for the largest median household size of 3.97 persons per household. non-family households (87 | 11.1%) represent the smallest median household size with 1.10 persons per household.
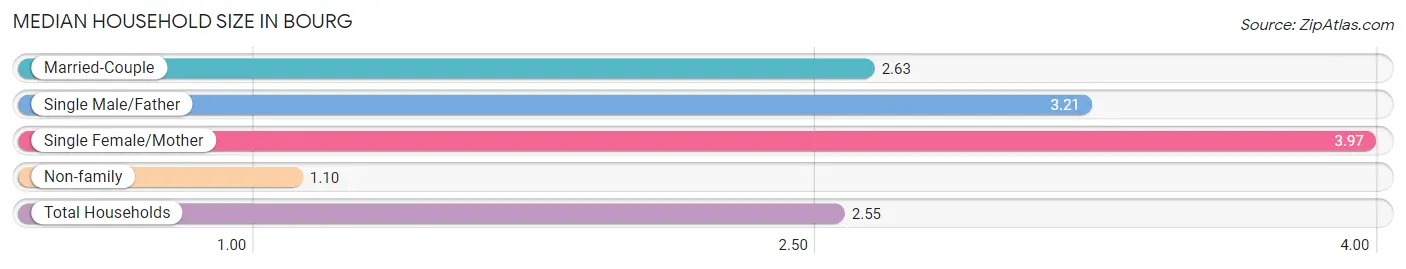
| Household Type | # Households | Household Size |
| Married-Couple | 621 (78.9%) | 2.63 |
| Single Male/Father | 47 (6.0%) | 3.21 |
| Single Female/Mother | 32 (4.1%) | 3.97 |
| Non-family | 87 (11.1%) | 1.10 |
| Total Households | 787 (100.0%) | 2.55 |
Household Size by Marriage Status in Bourg
Out of a total of 787 households in Bourg, 700 (88.9%) are family households, while 87 (11.1%) are nonfamily households. The most numerous type of family households are 2-person households, comprising 275, and the most common type of nonfamily households are 1-person households, comprising 75.
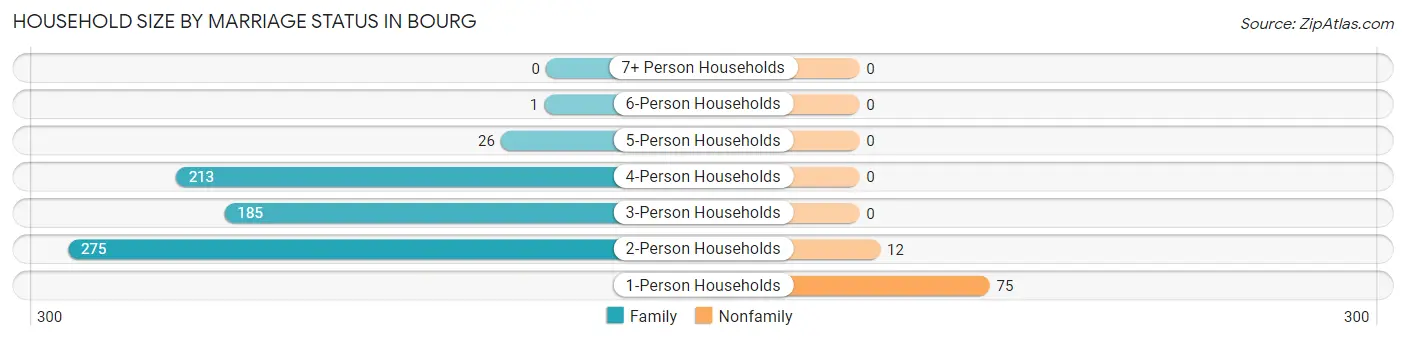
| Household Size | Family Households | Nonfamily Households |
| 1-Person Households | - | 75 (9.5%) |
| 2-Person Households | 275 (34.9%) | 12 (1.5%) |
| 3-Person Households | 185 (23.5%) | 0 (0.0%) |
| 4-Person Households | 213 (27.1%) | 0 (0.0%) |
| 5-Person Households | 26 (3.3%) | 0 (0.0%) |
| 6-Person Households | 1 (0.1%) | 0 (0.0%) |
| 7+ Person Households | 0 (0.0%) | 0 (0.0%) |
| Total | 700 (88.9%) | 87 (11.1%) |
Female Fertility in Bourg
Fertility by Age in Bourg
| Age Bracket | Women with Births | Births / 1,000 Women |
| 15 to 19 years | 0 (0.0%) | 0.0 |
| 20 to 34 years | 0 (0.0%) | 0.0 |
| 35 to 50 years | 0 (0.0%) | 0.0 |
| Total | 0 (0.0%) | 0.0 |
Fertility by Age by Marriage Status in Bourg
| Age Bracket | Married | Unmarried |
| 15 to 19 years | 0 (0.0%) | 0 (0.0%) |
| 20 to 34 years | 0 (0.0%) | 0 (0.0%) |
| 35 to 50 years | 0 (0.0%) | 0 (0.0%) |
| Total | 0 (0.0%) | 0 (0.0%) |
Fertility by Education in Bourg
| Educational Attainment | Women with Births | Births / 1,000 Women |
| Less than High School | 0 (0.0%) | 0.0 |
| High School Diploma | 0 (0.0%) | 0.0 |
| College or Associate's Degree | 0 (0.0%) | 0.0 |
| Bachelor's Degree | 0 (0.0%) | 0.0 |
| Graduate Degree | 0 (0.0%) | 0.0 |
| Total | 0 (0.0%) | 0.0 |
Fertility by Education by Marriage Status in Bourg
| Educational Attainment | Married | Unmarried |
| Less than High School | 0 (0.0%) | 0 (0.0%) |
| High School Diploma | 0 (0.0%) | 0 (0.0%) |
| College or Associate's Degree | 0 (0.0%) | 0 (0.0%) |
| Bachelor's Degree | 0 (0.0%) | 0 (0.0%) |
| Graduate Degree | 0 (0.0%) | 0 (0.0%) |
| Total | 0 (0.0%) | 0 (0.0%) |
Employment Characteristics in Bourg
Employment by Class of Employer in Bourg
Among the 1,039 employed individuals in Bourg, private company employees (731 | 70.4%), not-for-profit organizations (117 | 11.3%), and local government employees (84 | 8.1%) make up the most common classes of employment.
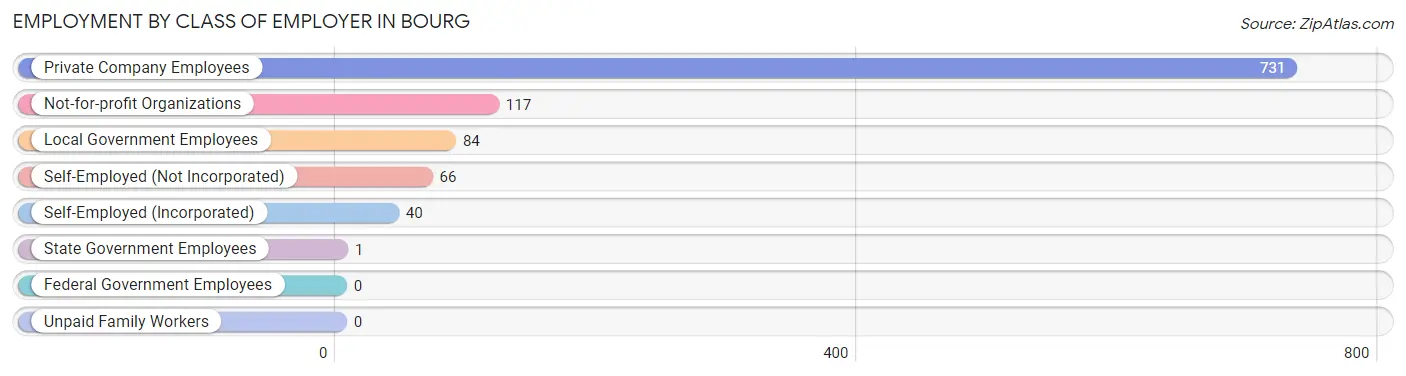
| Employer Class | # Employees | % Employees |
| Private Company Employees | 731 | 70.4% |
| Self-Employed (Incorporated) | 40 | 3.8% |
| Self-Employed (Not Incorporated) | 66 | 6.4% |
| Not-for-profit Organizations | 117 | 11.3% |
| Local Government Employees | 84 | 8.1% |
| State Government Employees | 1 | 0.1% |
| Federal Government Employees | 0 | 0.0% |
| Unpaid Family Workers | 0 | 0.0% |
| Total | 1,039 | 100.0% |
Employment Status by Age in Bourg
According to the labor force statistics for Bourg, out of the total population over 16 years of age (1,594), 66.6% or 1,062 individuals are in the labor force, with 0.8% or 8 of them unemployed. The age group with the highest labor force participation rate is 25 to 29 years, with 100.0% or 57 individuals in the labor force. Within the labor force, the 45 to 54 years age range has the highest percentage of unemployed individuals, with 3.5% or 8 of them being unemployed.
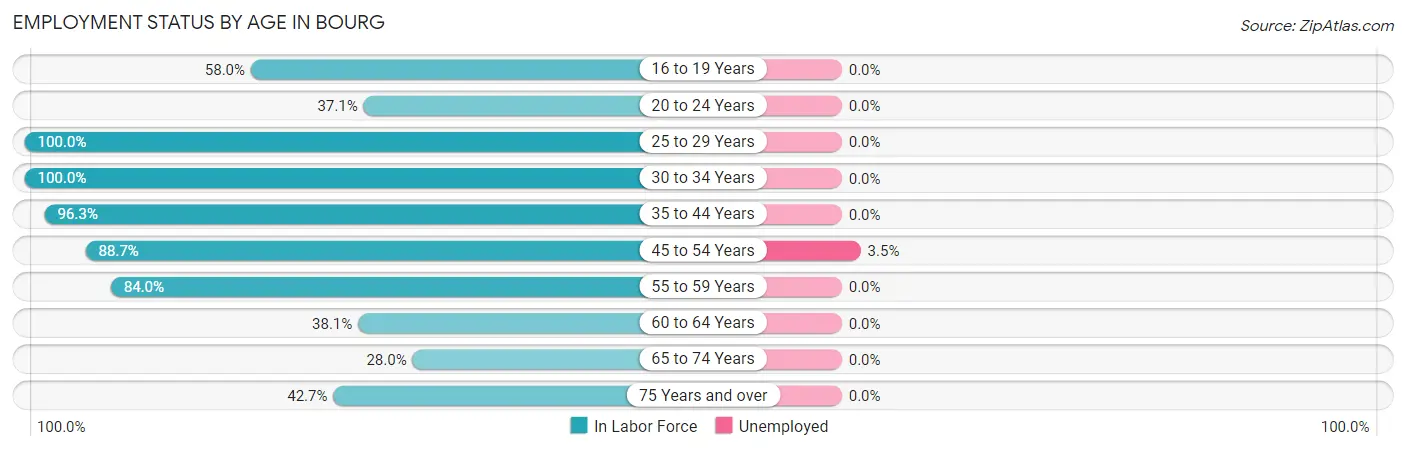
| Age Bracket | In Labor Force | Unemployed |
| 16 to 19 Years | 29 (58.0%) | 0 (0.0%) |
| 20 to 24 Years | 39 (37.1%) | 0 (0.0%) |
| 25 to 29 Years | 57 (100.0%) | 0 (0.0%) |
| 30 to 34 Years | 110 (100.0%) | 0 (0.0%) |
| 35 to 44 Years | 206 (96.3%) | 0 (0.0%) |
| 45 to 54 Years | 227 (88.7%) | 8 (3.5%) |
| 55 to 59 Years | 200 (84.0%) | 0 (0.0%) |
| 60 to 64 Years | 53 (38.1%) | 0 (0.0%) |
| 65 to 74 Years | 79 (28.0%) | 0 (0.0%) |
| 75 Years and over | 61 (42.7%) | 0 (0.0%) |
| Total | 1,062 (66.6%) | 8 (0.8%) |
Employment Status by Educational Attainment in Bourg
According to labor force statistics for Bourg, 84.1% of individuals (853) out of the total population between 25 and 64 years of age (1,014) are in the labor force, with 0.9% or 8 of them being unemployed. The group with the highest labor force participation rate are those with the educational attainment of bachelor's degree or higher, with 100.0% or 181 individuals in the labor force. Within the labor force, individuals with high school diploma education have the highest percentage of unemployment, with 1.7% or 8 of them being unemployed.
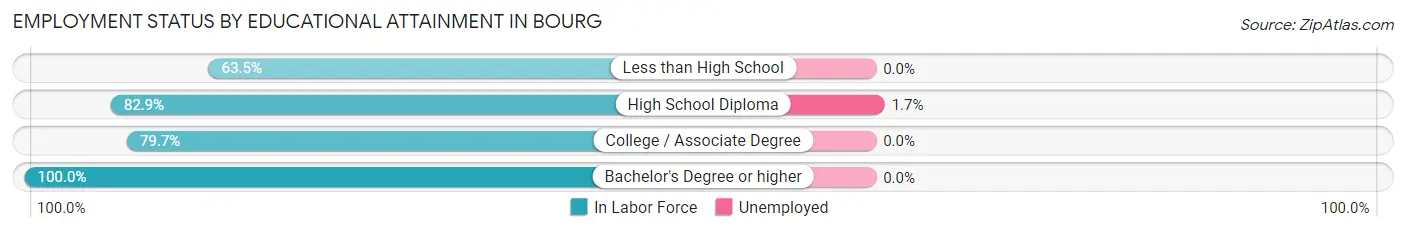
| Educational Attainment | In Labor Force | Unemployed |
| Less than High School | 40 (63.5%) | 0 (0.0%) |
| High School Diploma | 467 (82.9%) | 10 (1.7%) |
| College / Associate Degree | 165 (79.7%) | 0 (0.0%) |
| Bachelor's Degree or higher | 181 (100.0%) | 0 (0.0%) |
| Total | 853 (84.1%) | 9 (0.9%) |
Employment Occupations by Sex in Bourg
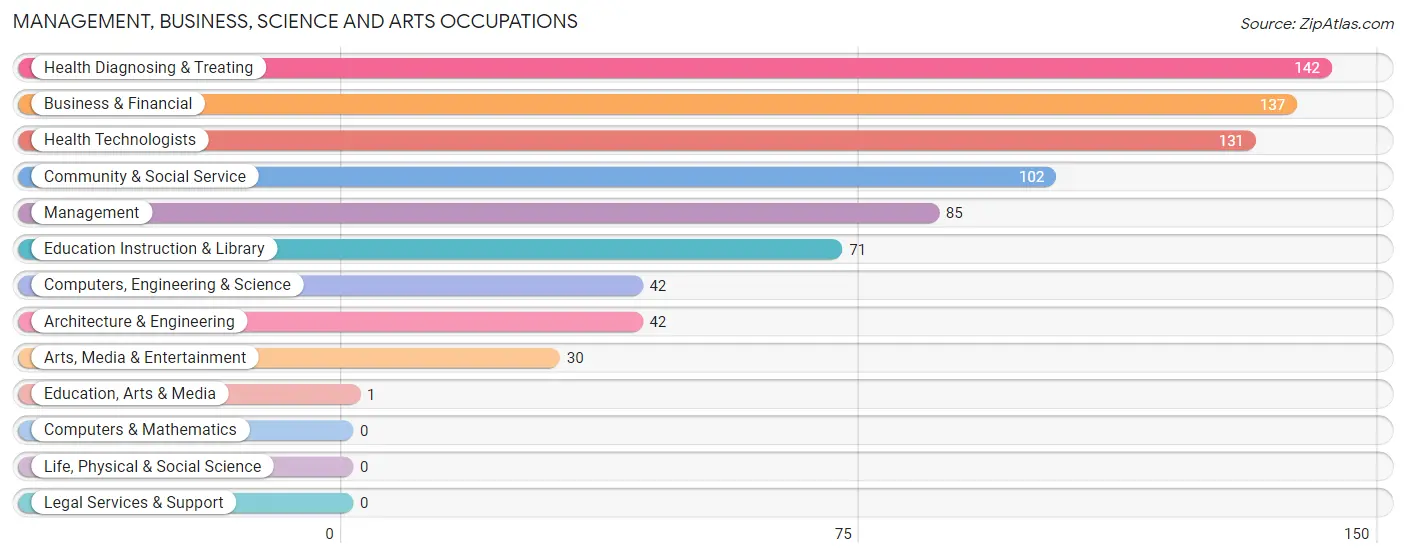
Management, Business, Science and Arts Occupations
The most common Management, Business, Science and Arts occupations in Bourg are Health Diagnosing & Treating (142 | 13.5%), Business & Financial (137 | 13.0%), Health Technologists (131 | 12.4%), Community & Social Service (102 | 9.7%), and Management (85 | 8.1%).
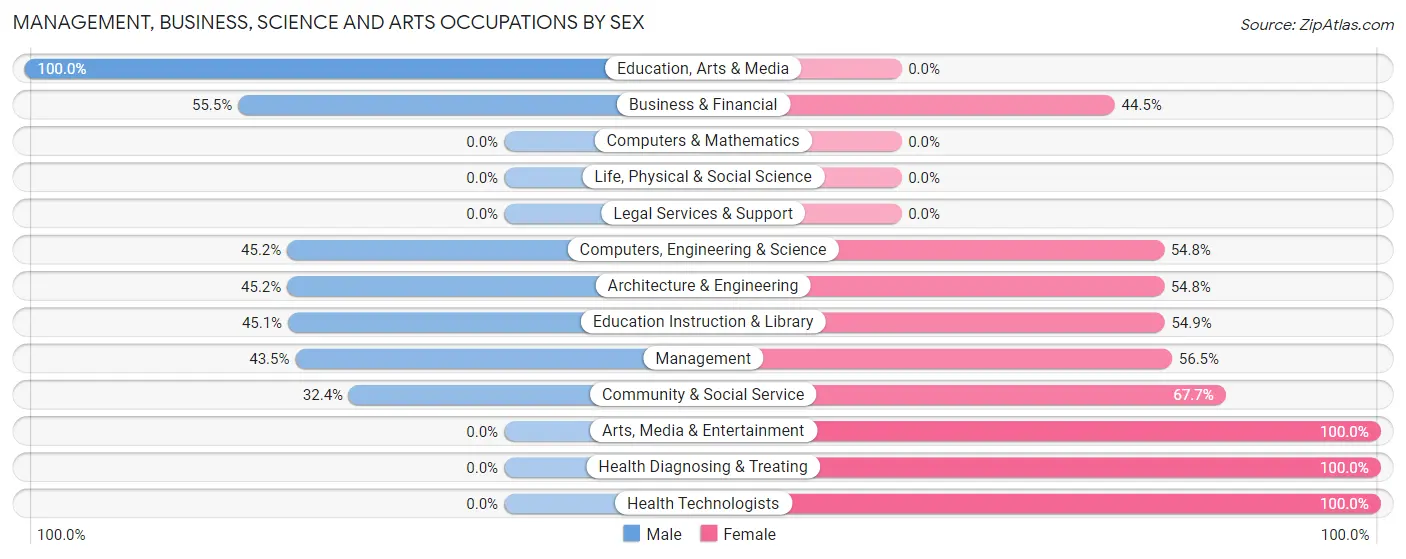
Management, Business, Science and Arts Occupations by Sex
Within the Management, Business, Science and Arts occupations in Bourg, the most male-oriented occupations are Education, Arts & Media (100.0%), Business & Financial (55.5%), and Computers, Engineering & Science (45.2%), while the most female-oriented occupations are Arts, Media & Entertainment (100.0%), Health Diagnosing & Treating (100.0%), and Health Technologists (100.0%).
| Occupation | Male | Female |
| Management | 37 (43.5%) | 48 (56.5%) |
| Business & Financial | 76 (55.5%) | 61 (44.5%) |
| Computers, Engineering & Science | 19 (45.2%) | 23 (54.8%) |
| Computers & Mathematics | 0 (0.0%) | 0 (0.0%) |
| Architecture & Engineering | 19 (45.2%) | 23 (54.8%) |
| Life, Physical & Social Science | 0 (0.0%) | 0 (0.0%) |
| Community & Social Service | 33 (32.4%) | 69 (67.6%) |
| Education, Arts & Media | 1 (100.0%) | 0 (0.0%) |
| Legal Services & Support | 0 (0.0%) | 0 (0.0%) |
| Education Instruction & Library | 32 (45.1%) | 39 (54.9%) |
| Arts, Media & Entertainment | 0 (0.0%) | 30 (100.0%) |
| Health Diagnosing & Treating | 0 (0.0%) | 142 (100.0%) |
| Health Technologists | 0 (0.0%) | 131 (100.0%) |
| Total (Category) | 165 (32.5%) | 343 (67.5%) |
| Total (Overall) | 516 (49.0%) | 537 (51.0%) |
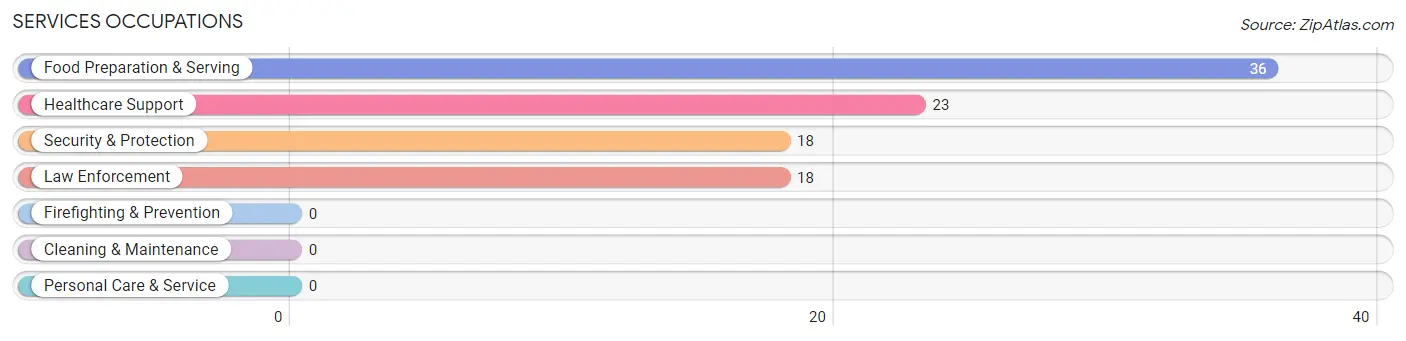
Services Occupations
The most common Services occupations in Bourg are Food Preparation & Serving (36 | 3.4%), Healthcare Support (23 | 2.2%), Security & Protection (18 | 1.7%), and Law Enforcement (18 | 1.7%).
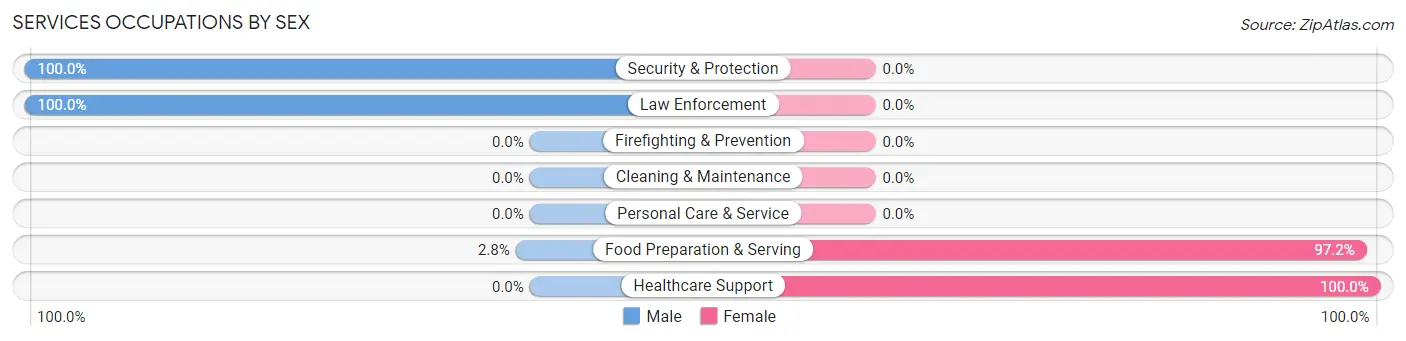
Services Occupations by Sex
Within the Services occupations in Bourg, the most male-oriented occupations are Security & Protection (100.0%), Law Enforcement (100.0%), and Food Preparation & Serving (2.8%), while the most female-oriented occupations are Healthcare Support (100.0%), and Food Preparation & Serving (97.2%).
| Occupation | Male | Female |
| Healthcare Support | 0 (0.0%) | 23 (100.0%) |
| Security & Protection | 18 (100.0%) | 0 (0.0%) |
| Firefighting & Prevention | 0 (0.0%) | 0 (0.0%) |
| Law Enforcement | 18 (100.0%) | 0 (0.0%) |
| Food Preparation & Serving | 1 (2.8%) | 35 (97.2%) |
| Cleaning & Maintenance | 0 (0.0%) | 0 (0.0%) |
| Personal Care & Service | 0 (0.0%) | 0 (0.0%) |
| Total (Category) | 19 (24.7%) | 58 (75.3%) |
| Total (Overall) | 516 (49.0%) | 537 (51.0%) |
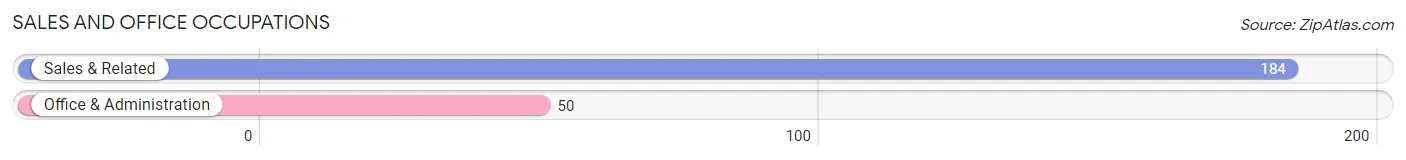
Sales and Office Occupations
The most common Sales and Office occupations in Bourg are Sales & Related (184 | 17.5%), and Office & Administration (50 | 4.8%).
Sales and Office Occupations by Sex

| Occupation | Male | Female |
| Sales & Related | 134 (72.8%) | 50 (27.2%) |
| Office & Administration | 0 (0.0%) | 50 (100.0%) |
| Total (Category) | 134 (57.3%) | 100 (42.7%) |
| Total (Overall) | 516 (49.0%) | 537 (51.0%) |
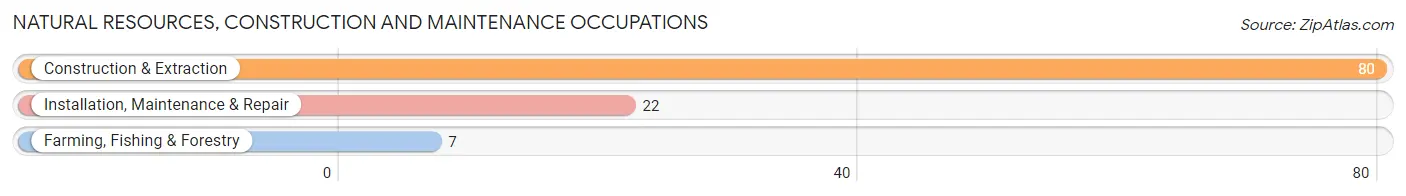
Natural Resources, Construction and Maintenance Occupations
The most common Natural Resources, Construction and Maintenance occupations in Bourg are Construction & Extraction (80 | 7.6%), Installation, Maintenance & Repair (22 | 2.1%), and Farming, Fishing & Forestry (7 | 0.7%).
Natural Resources, Construction and Maintenance Occupations by Sex
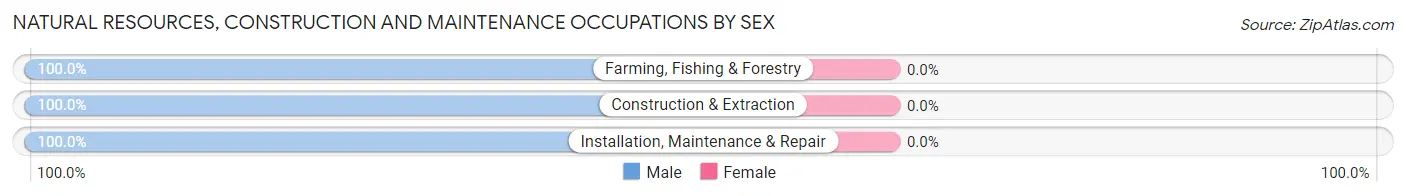
| Occupation | Male | Female |
| Farming, Fishing & Forestry | 7 (100.0%) | 0 (0.0%) |
| Construction & Extraction | 80 (100.0%) | 0 (0.0%) |
| Installation, Maintenance & Repair | 22 (100.0%) | 0 (0.0%) |
| Total (Category) | 109 (100.0%) | 0 (0.0%) |
| Total (Overall) | 516 (49.0%) | 537 (51.0%) |
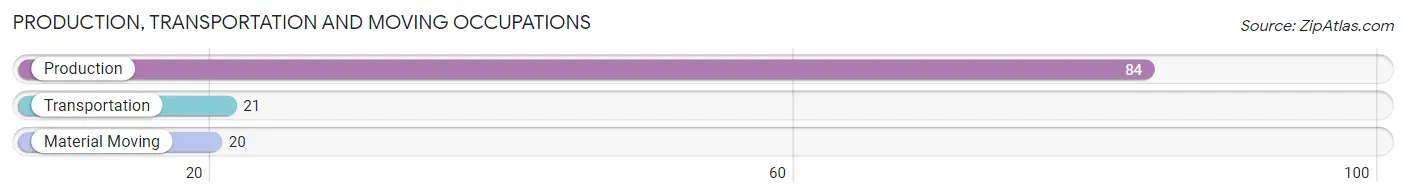
Production, Transportation and Moving Occupations
The most common Production, Transportation and Moving occupations in Bourg are Production (84 | 8.0%), Transportation (21 | 2.0%), and Material Moving (20 | 1.9%).
Production, Transportation and Moving Occupations by Sex
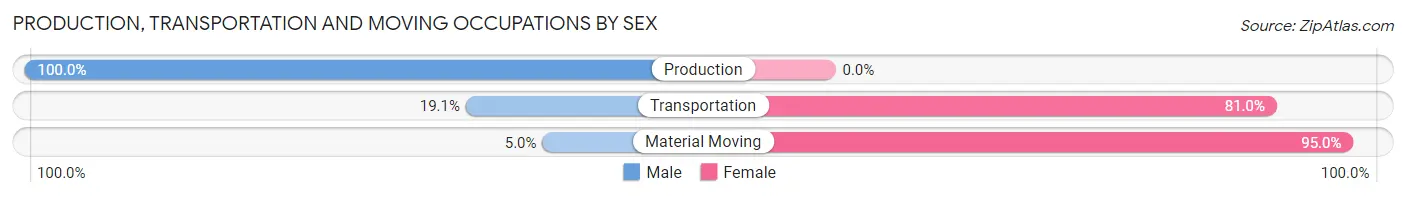
| Occupation | Male | Female |
| Production | 84 (100.0%) | 0 (0.0%) |
| Transportation | 4 (19.1%) | 17 (80.9%) |
| Material Moving | 1 (5.0%) | 19 (95.0%) |
| Total (Category) | 89 (71.2%) | 36 (28.8%) |
| Total (Overall) | 516 (49.0%) | 537 (51.0%) |
Employment Industries by Sex in Bourg
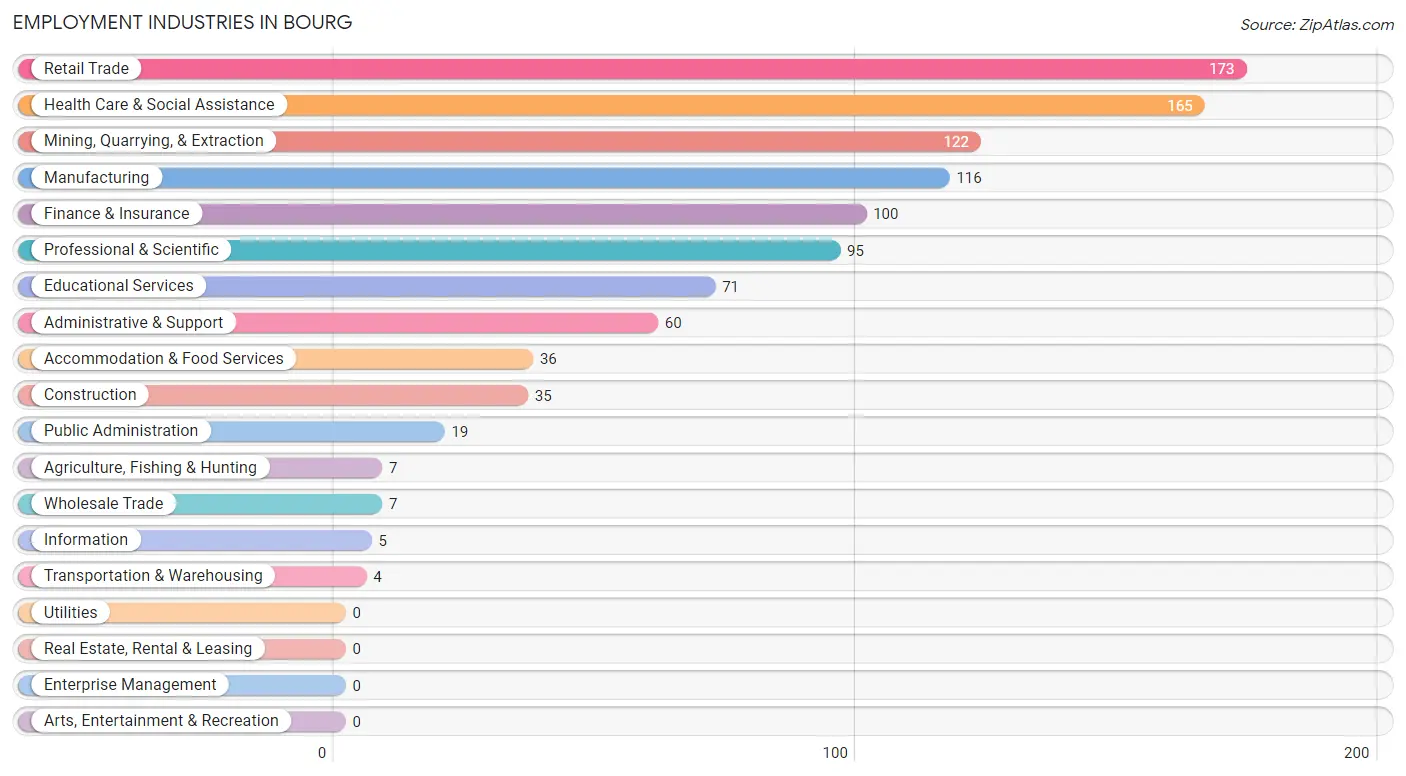
Employment Industries in Bourg
The major employment industries in Bourg include Retail Trade (173 | 16.4%), Health Care & Social Assistance (165 | 15.7%), Mining, Quarrying, & Extraction (122 | 11.6%), Manufacturing (116 | 11.0%), and Finance & Insurance (100 | 9.5%).
Employment Industries by Sex in Bourg
The Bourg industries that see more men than women are Agriculture, Fishing & Hunting (100.0%), Construction (100.0%), and Wholesale Trade (100.0%), whereas the industries that tend to have a higher number of women are Information (100.0%), Finance & Insurance (100.0%), and Administrative & Support (100.0%).
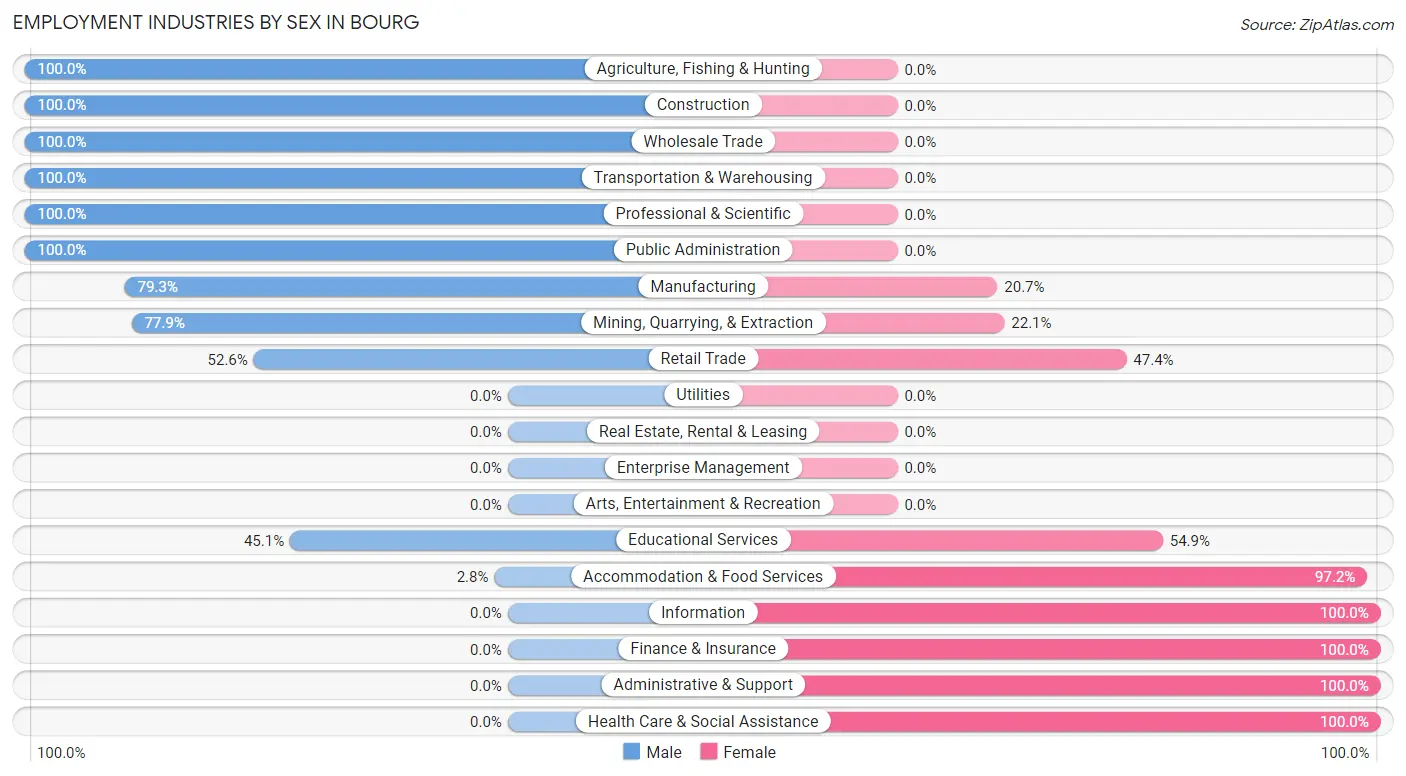
| Industry | Male | Female |
| Agriculture, Fishing & Hunting | 7 (100.0%) | 0 (0.0%) |
| Mining, Quarrying, & Extraction | 95 (77.9%) | 27 (22.1%) |
| Construction | 35 (100.0%) | 0 (0.0%) |
| Manufacturing | 92 (79.3%) | 24 (20.7%) |
| Wholesale Trade | 7 (100.0%) | 0 (0.0%) |
| Retail Trade | 91 (52.6%) | 82 (47.4%) |
| Transportation & Warehousing | 4 (100.0%) | 0 (0.0%) |
| Utilities | 0 (0.0%) | 0 (0.0%) |
| Information | 0 (0.0%) | 5 (100.0%) |
| Finance & Insurance | 0 (0.0%) | 100 (100.0%) |
| Real Estate, Rental & Leasing | 0 (0.0%) | 0 (0.0%) |
| Professional & Scientific | 95 (100.0%) | 0 (0.0%) |
| Enterprise Management | 0 (0.0%) | 0 (0.0%) |
| Administrative & Support | 0 (0.0%) | 60 (100.0%) |
| Educational Services | 32 (45.1%) | 39 (54.9%) |
| Health Care & Social Assistance | 0 (0.0%) | 165 (100.0%) |
| Arts, Entertainment & Recreation | 0 (0.0%) | 0 (0.0%) |
| Accommodation & Food Services | 1 (2.8%) | 35 (97.2%) |
| Public Administration | 19 (100.0%) | 0 (0.0%) |
| Total | 516 (49.0%) | 537 (51.0%) |
Education in Bourg
School Enrollment in Bourg
The most common levels of schooling among the 422 students in Bourg are elementary school (142 | 33.7%), high school (95 | 22.5%), and middle school (58 | 13.7%).
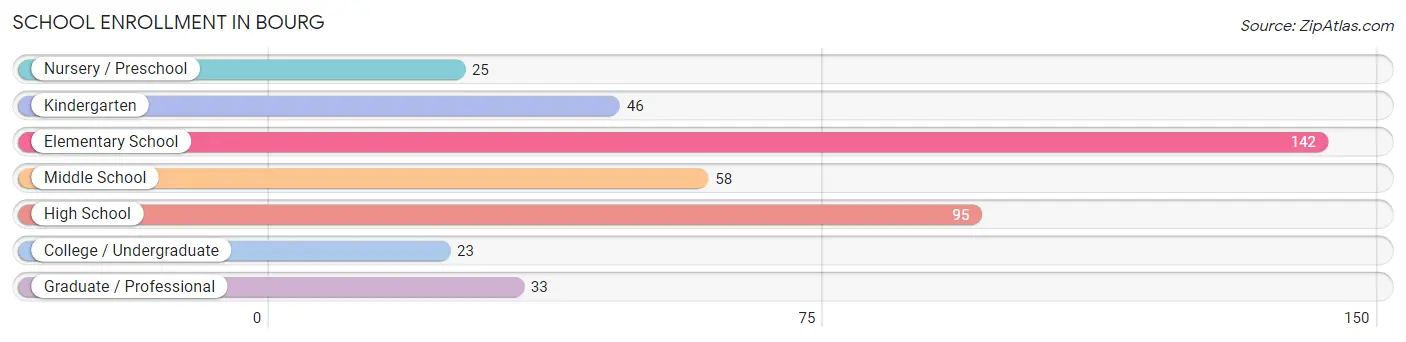
| School Level | # Students | % Students |
| Nursery / Preschool | 25 | 5.9% |
| Kindergarten | 46 | 10.9% |
| Elementary School | 142 | 33.7% |
| Middle School | 58 | 13.7% |
| High School | 95 | 22.5% |
| College / Undergraduate | 23 | 5.4% |
| Graduate / Professional | 33 | 7.8% |
| Total | 422 | 100.0% |
School Enrollment by Age by Funding Source in Bourg
Out of a total of 422 students who are enrolled in schools in Bourg, 71 (16.8%) attend a private institution, while the remaining 351 (83.2%) are enrolled in public schools. The age group of 5 to 9 year old has the highest likelihood of being enrolled in private schools, with 64 (34.2% in the age bracket) enrolled. Conversely, the age group of 15 to 17 year olds has the lowest likelihood of being enrolled in a private school, with 61 (100.0% in the age bracket) attending a public institution.
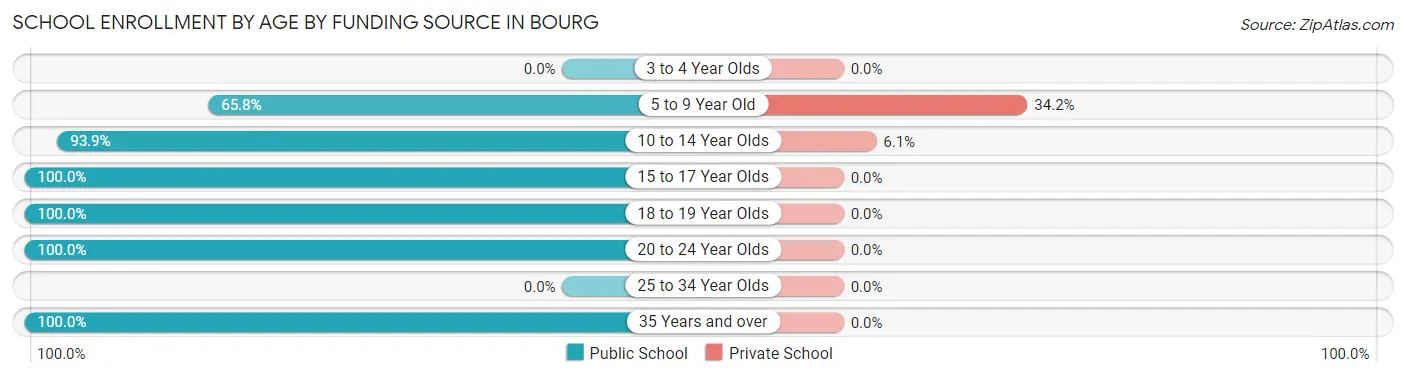
| Age Bracket | Public School | Private School |
| 3 to 4 Year Olds | 0 (0.0%) | 0 (0.0%) |
| 5 to 9 Year Old | 123 (65.8%) | 64 (34.2%) |
| 10 to 14 Year Olds | 108 (93.9%) | 7 (6.1%) |
| 15 to 17 Year Olds | 61 (100.0%) | 0 (0.0%) |
| 18 to 19 Year Olds | 12 (100.0%) | 0 (0.0%) |
| 20 to 24 Year Olds | 39 (100.0%) | 0 (0.0%) |
| 25 to 34 Year Olds | 0 (0.0%) | 0 (0.0%) |
| 35 Years and over | 8 (100.0%) | 0 (0.0%) |
| Total | 351 (83.2%) | 71 (16.8%) |
Educational Attainment by Field of Study in Bourg
Social sciences (116 | 56.9%), engineering (27 | 13.2%), business (15 | 7.3%), education (15 | 7.3%), and science & technology (12 | 5.9%) are the most common fields of study among 204 individuals in Bourg who have obtained a bachelor's degree or higher.
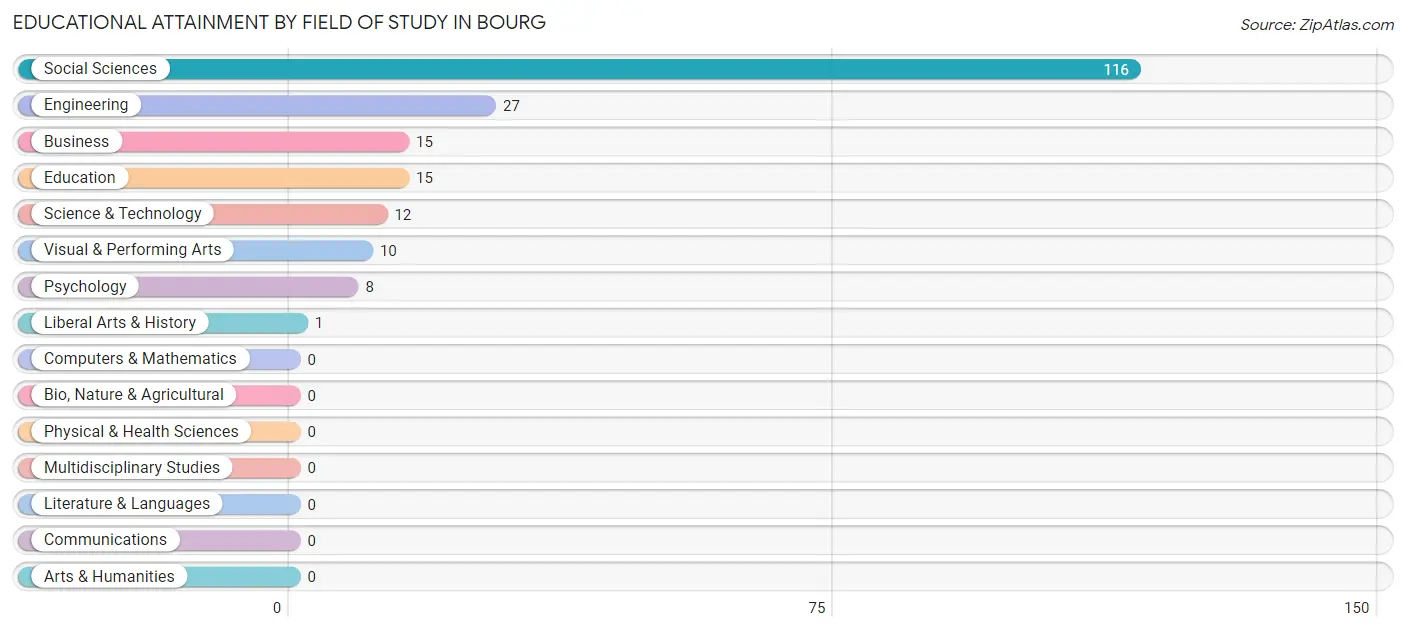
| Field of Study | # Graduates | % Graduates |
| Computers & Mathematics | 0 | 0.0% |
| Bio, Nature & Agricultural | 0 | 0.0% |
| Physical & Health Sciences | 0 | 0.0% |
| Psychology | 8 | 3.9% |
| Social Sciences | 116 | 56.9% |
| Engineering | 27 | 13.2% |
| Multidisciplinary Studies | 0 | 0.0% |
| Science & Technology | 12 | 5.9% |
| Business | 15 | 7.3% |
| Education | 15 | 7.3% |
| Literature & Languages | 0 | 0.0% |
| Liberal Arts & History | 1 | 0.5% |
| Visual & Performing Arts | 10 | 4.9% |
| Communications | 0 | 0.0% |
| Arts & Humanities | 0 | 0.0% |
| Total | 204 | 100.0% |
Transportation & Commute in Bourg
Vehicle Availability by Sex in Bourg
The most prevalent vehicle ownership categories in Bourg are males with 2 vehicles (309, accounting for 60.1%) and females with 2 vehicles (350, making up 59.1%).
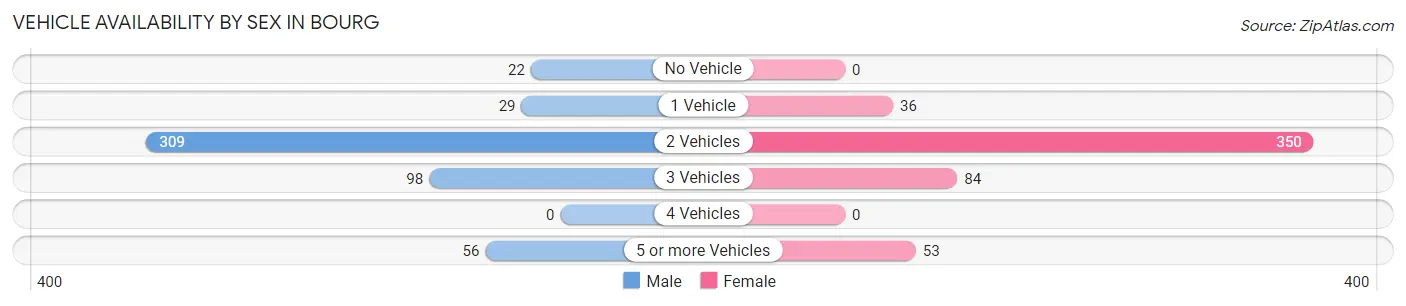
| Vehicles Available | Male | Female |
| No Vehicle | 22 (4.3%) | 0 (0.0%) |
| 1 Vehicle | 29 (5.6%) | 36 (6.9%) |
| 2 Vehicles | 309 (60.1%) | 350 (66.9%) |
| 3 Vehicles | 98 (19.1%) | 84 (16.1%) |
| 4 Vehicles | 0 (0.0%) | 0 (0.0%) |
| 5 or more Vehicles | 56 (10.9%) | 53 (10.1%) |
| Total | 514 (100.0%) | 523 (100.0%) |
Commute Time in Bourg
The most frequently occuring commute durations in Bourg are 20 to 24 minutes (196 commuters, 21.2%), 30 to 34 minutes (166 commuters, 18.0%), and 15 to 19 minutes (126 commuters, 13.6%).
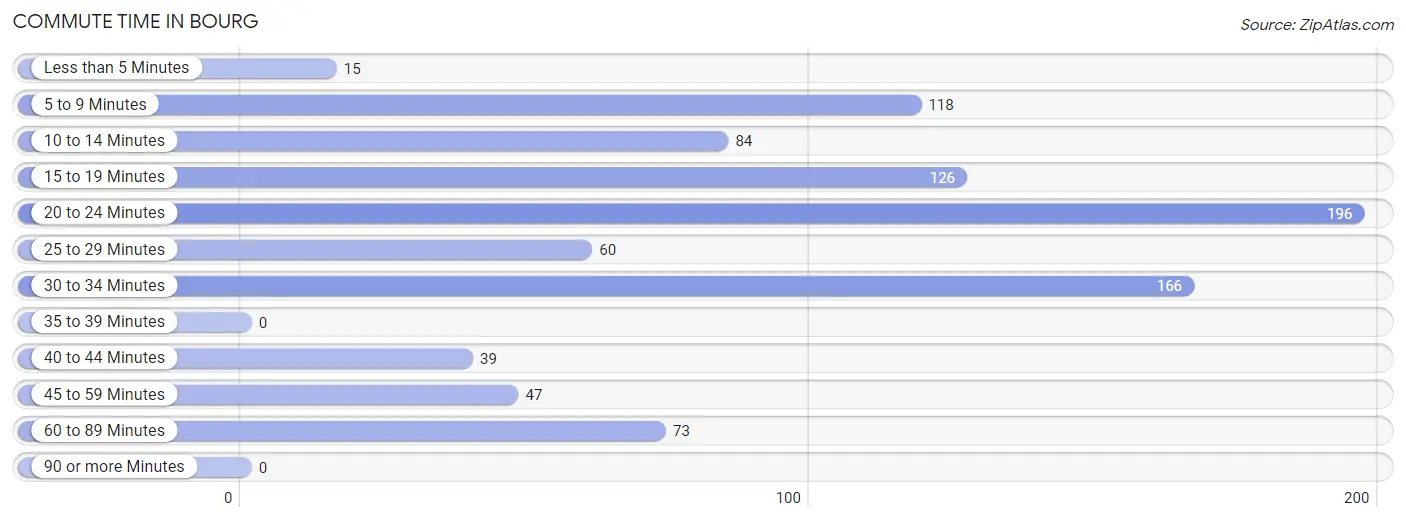
| Commute Time | # Commuters | % Commuters |
| Less than 5 Minutes | 15 | 1.6% |
| 5 to 9 Minutes | 118 | 12.8% |
| 10 to 14 Minutes | 84 | 9.1% |
| 15 to 19 Minutes | 126 | 13.6% |
| 20 to 24 Minutes | 196 | 21.2% |
| 25 to 29 Minutes | 60 | 6.5% |
| 30 to 34 Minutes | 166 | 18.0% |
| 35 to 39 Minutes | 0 | 0.0% |
| 40 to 44 Minutes | 39 | 4.2% |
| 45 to 59 Minutes | 47 | 5.1% |
| 60 to 89 Minutes | 73 | 7.9% |
| 90 or more Minutes | 0 | 0.0% |
Commute Time by Sex in Bourg
The most common commute times in Bourg are 15 to 19 minutes (101 commuters, 22.8%) for males and 20 to 24 minutes (178 commuters, 37.0%) for females.
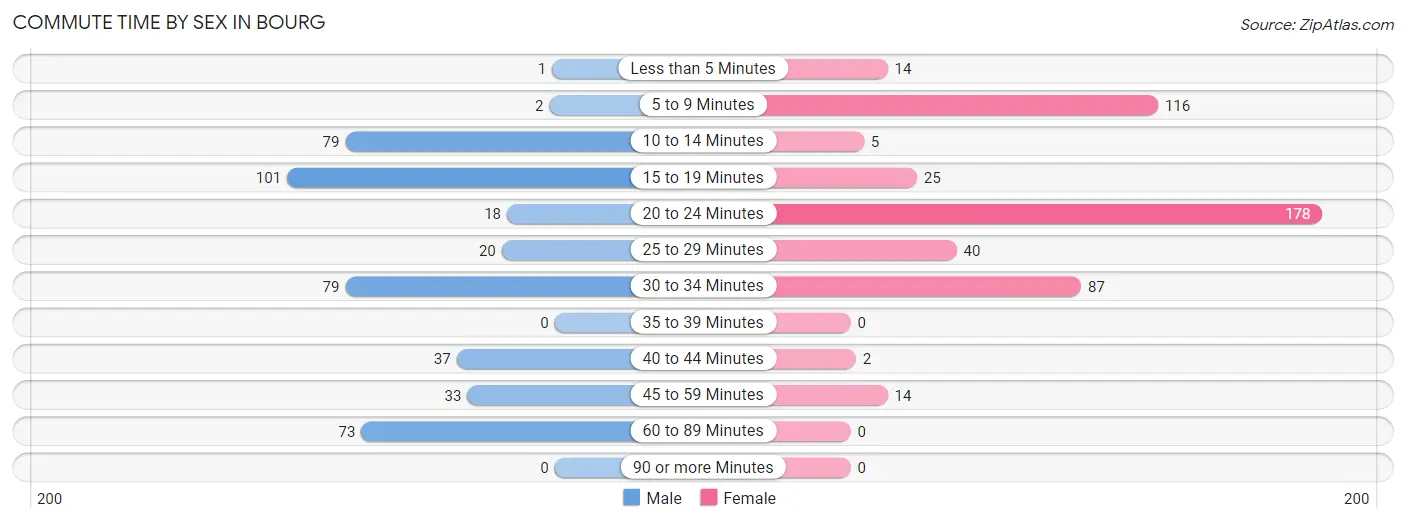
| Commute Time | Male | Female |
| Less than 5 Minutes | 1 (0.2%) | 14 (2.9%) |
| 5 to 9 Minutes | 2 (0.4%) | 116 (24.1%) |
| 10 to 14 Minutes | 79 (17.8%) | 5 (1.0%) |
| 15 to 19 Minutes | 101 (22.8%) | 25 (5.2%) |
| 20 to 24 Minutes | 18 (4.1%) | 178 (37.0%) |
| 25 to 29 Minutes | 20 (4.5%) | 40 (8.3%) |
| 30 to 34 Minutes | 79 (17.8%) | 87 (18.1%) |
| 35 to 39 Minutes | 0 (0.0%) | 0 (0.0%) |
| 40 to 44 Minutes | 37 (8.4%) | 2 (0.4%) |
| 45 to 59 Minutes | 33 (7.4%) | 14 (2.9%) |
| 60 to 89 Minutes | 73 (16.5%) | 0 (0.0%) |
| 90 or more Minutes | 0 (0.0%) | 0 (0.0%) |
Time of Departure to Work by Sex in Bourg
The most frequent times of departure to work in Bourg are 12:00 AM to 4:59 AM (90, 20.3%) for males and 6:30 AM to 6:59 AM (169, 35.1%) for females.
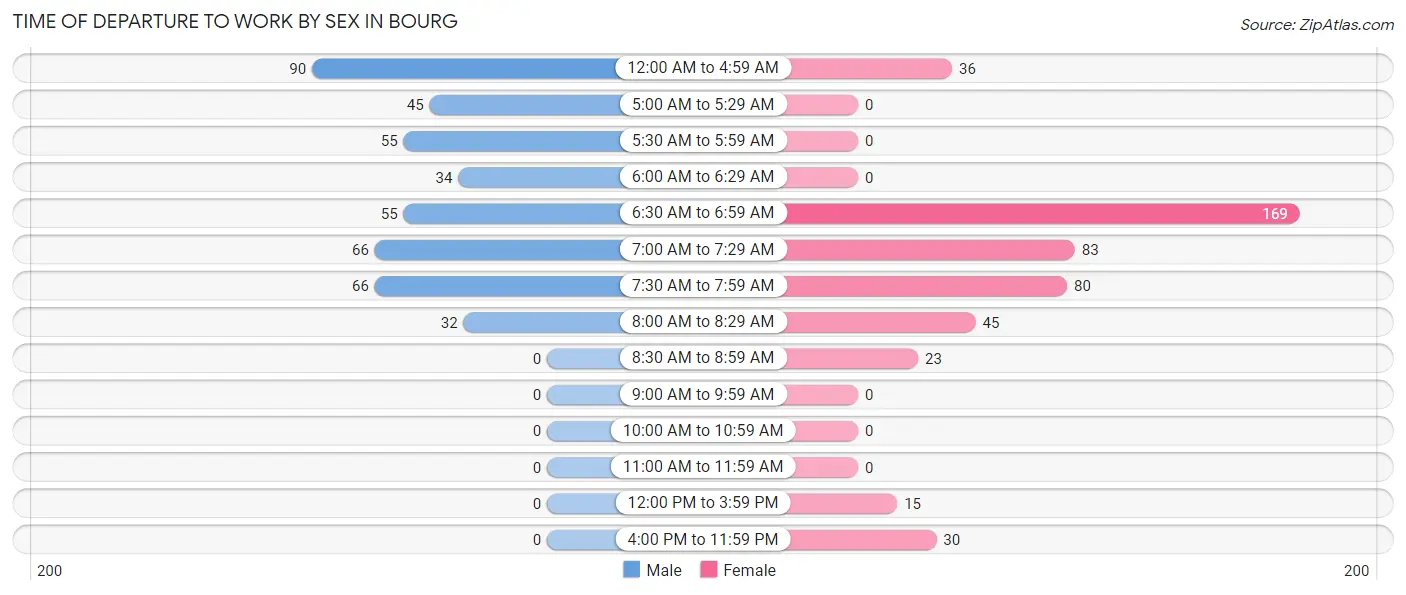
| Time of Departure | Male | Female |
| 12:00 AM to 4:59 AM | 90 (20.3%) | 36 (7.5%) |
| 5:00 AM to 5:29 AM | 45 (10.2%) | 0 (0.0%) |
| 5:30 AM to 5:59 AM | 55 (12.4%) | 0 (0.0%) |
| 6:00 AM to 6:29 AM | 34 (7.7%) | 0 (0.0%) |
| 6:30 AM to 6:59 AM | 55 (12.4%) | 169 (35.1%) |
| 7:00 AM to 7:29 AM | 66 (14.9%) | 83 (17.3%) |
| 7:30 AM to 7:59 AM | 66 (14.9%) | 80 (16.6%) |
| 8:00 AM to 8:29 AM | 32 (7.2%) | 45 (9.4%) |
| 8:30 AM to 8:59 AM | 0 (0.0%) | 23 (4.8%) |
| 9:00 AM to 9:59 AM | 0 (0.0%) | 0 (0.0%) |
| 10:00 AM to 10:59 AM | 0 (0.0%) | 0 (0.0%) |
| 11:00 AM to 11:59 AM | 0 (0.0%) | 0 (0.0%) |
| 12:00 PM to 3:59 PM | 0 (0.0%) | 15 (3.1%) |
| 4:00 PM to 11:59 PM | 0 (0.0%) | 30 (6.2%) |
| Total | 443 (100.0%) | 481 (100.0%) |
Housing Occupancy in Bourg
Occupancy by Ownership in Bourg
Of the total 787 dwellings in Bourg, owner-occupied units account for 671 (85.3%), while renter-occupied units make up 116 (14.7%).
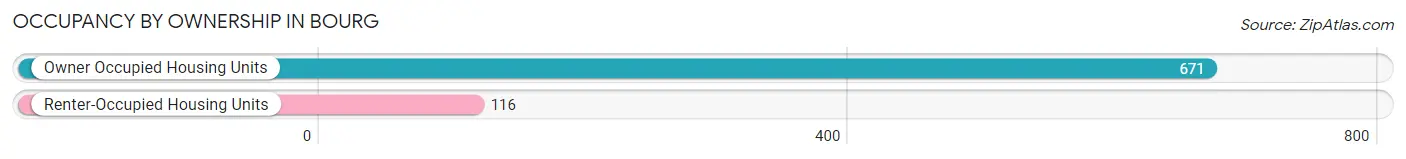
| Occupancy | # Housing Units | % Housing Units |
| Owner Occupied Housing Units | 671 | 85.3% |
| Renter-Occupied Housing Units | 116 | 14.7% |
| Total Occupied Housing Units | 787 | 100.0% |
Occupancy by Household Size in Bourg
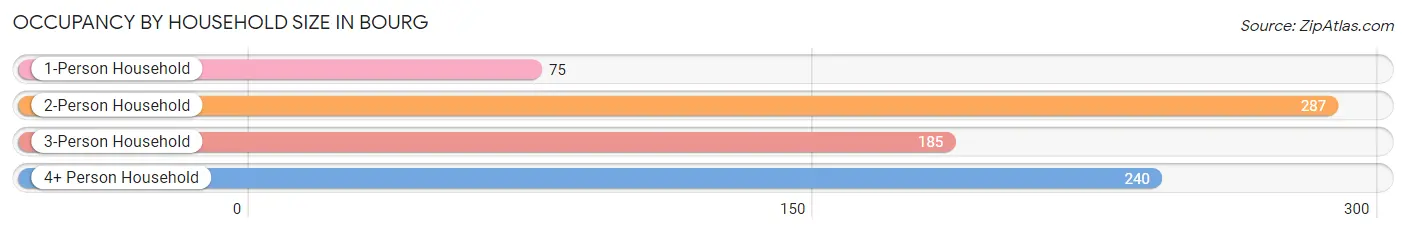
| Household Size | # Housing Units | % Housing Units |
| 1-Person Household | 75 | 9.5% |
| 2-Person Household | 287 | 36.5% |
| 3-Person Household | 185 | 23.5% |
| 4+ Person Household | 240 | 30.5% |
| Total Housing Units | 787 | 100.0% |
Occupancy by Ownership by Household Size in Bourg
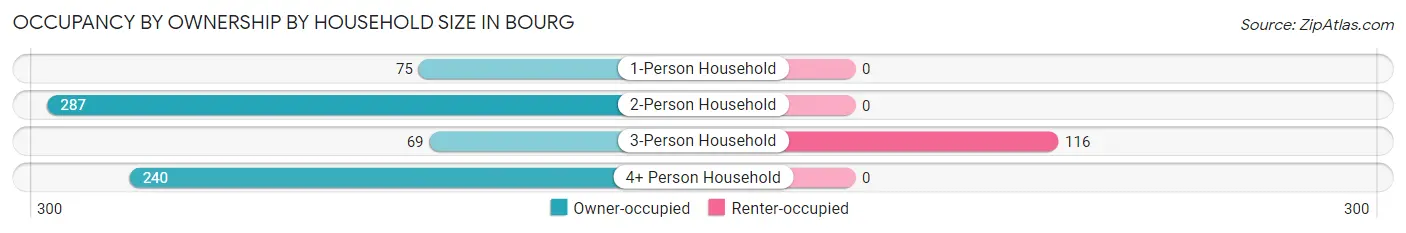
| Household Size | Owner-occupied | Renter-occupied |
| 1-Person Household | 75 (100.0%) | 0 (0.0%) |
| 2-Person Household | 287 (100.0%) | 0 (0.0%) |
| 3-Person Household | 69 (37.3%) | 116 (62.7%) |
| 4+ Person Household | 240 (100.0%) | 0 (0.0%) |
| Total Housing Units | 671 (85.3%) | 116 (14.7%) |
Occupancy by Educational Attainment in Bourg
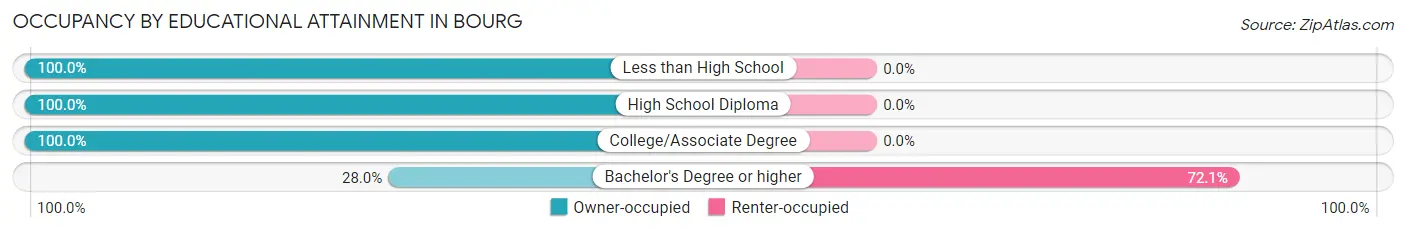
| Household Size | Owner-occupied | Renter-occupied |
| Less than High School | 84 (100.0%) | 0 (0.0%) |
| High School Diploma | 451 (100.0%) | 0 (0.0%) |
| College/Associate Degree | 91 (100.0%) | 0 (0.0%) |
| Bachelor's Degree or higher | 45 (28.0%) | 116 (72.1%) |
Occupancy by Age of Householder in Bourg
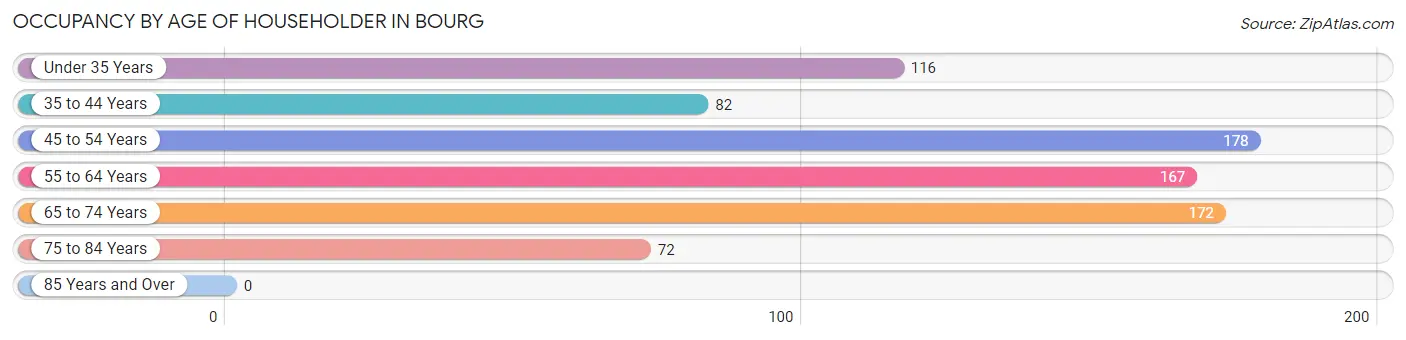
| Age Bracket | # Households | % Households |
| Under 35 Years | 116 | 14.7% |
| 35 to 44 Years | 82 | 10.4% |
| 45 to 54 Years | 178 | 22.6% |
| 55 to 64 Years | 167 | 21.2% |
| 65 to 74 Years | 172 | 21.9% |
| 75 to 84 Years | 72 | 9.1% |
| 85 Years and Over | 0 | 0.0% |
| Total | 787 | 100.0% |
Housing Finances in Bourg
Median Income by Occupancy in Bourg
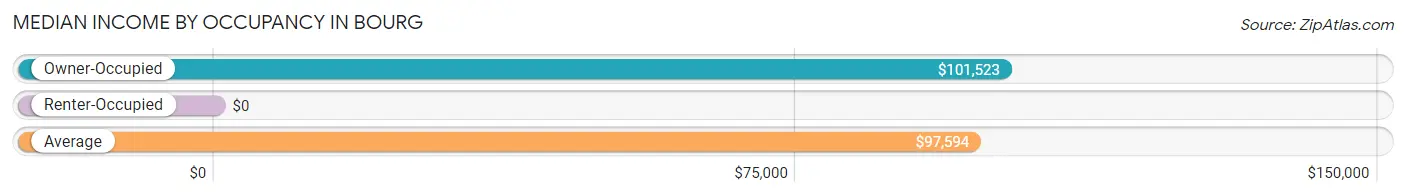
| Occupancy Type | # Households | Median Income |
| Owner-Occupied | 671 (85.3%) | $101,523 |
| Renter-Occupied | 116 (14.7%) | $0 |
| Average | 787 (100.0%) | $97,594 |
Occupancy by Householder Income Bracket in Bourg
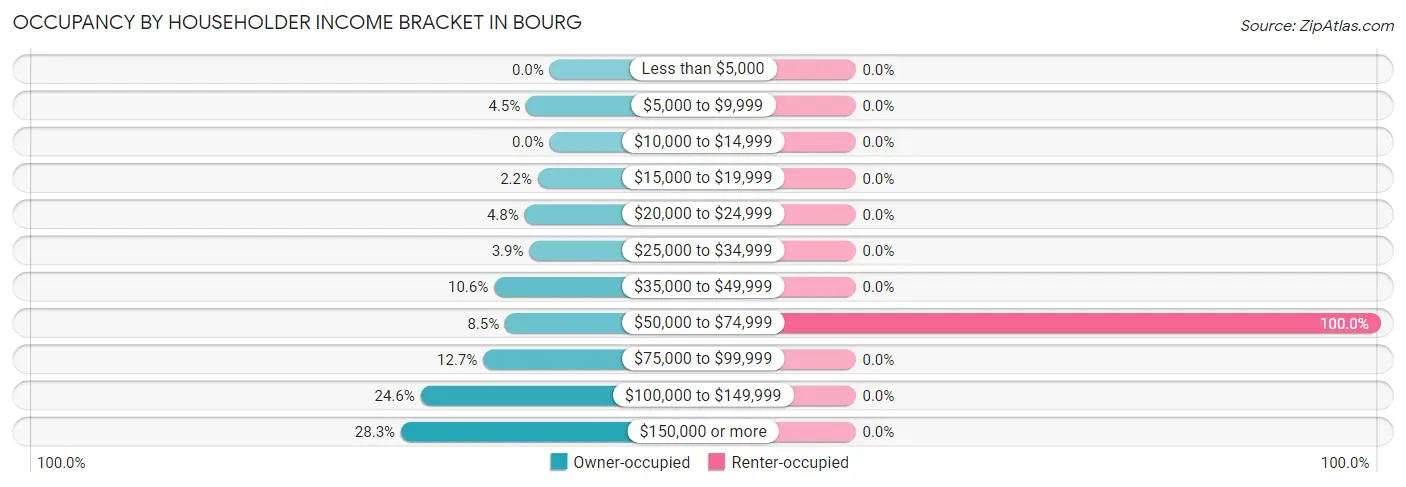
| Income Bracket | Owner-occupied | Renter-occupied |
| Less than $5,000 | 0 (0.0%) | 0 (0.0%) |
| $5,000 to $9,999 | 30 (4.5%) | 0 (0.0%) |
| $10,000 to $14,999 | 0 (0.0%) | 0 (0.0%) |
| $15,000 to $19,999 | 15 (2.2%) | 0 (0.0%) |
| $20,000 to $24,999 | 32 (4.8%) | 0 (0.0%) |
| $25,000 to $34,999 | 26 (3.9%) | 0 (0.0%) |
| $35,000 to $49,999 | 71 (10.6%) | 0 (0.0%) |
| $50,000 to $74,999 | 57 (8.5%) | 116 (100.0%) |
| $75,000 to $99,999 | 85 (12.7%) | 0 (0.0%) |
| $100,000 to $149,999 | 165 (24.6%) | 0 (0.0%) |
| $150,000 or more | 190 (28.3%) | 0 (0.0%) |
| Total | 671 (100.0%) | 116 (100.0%) |
Monthly Housing Cost Tiers in Bourg
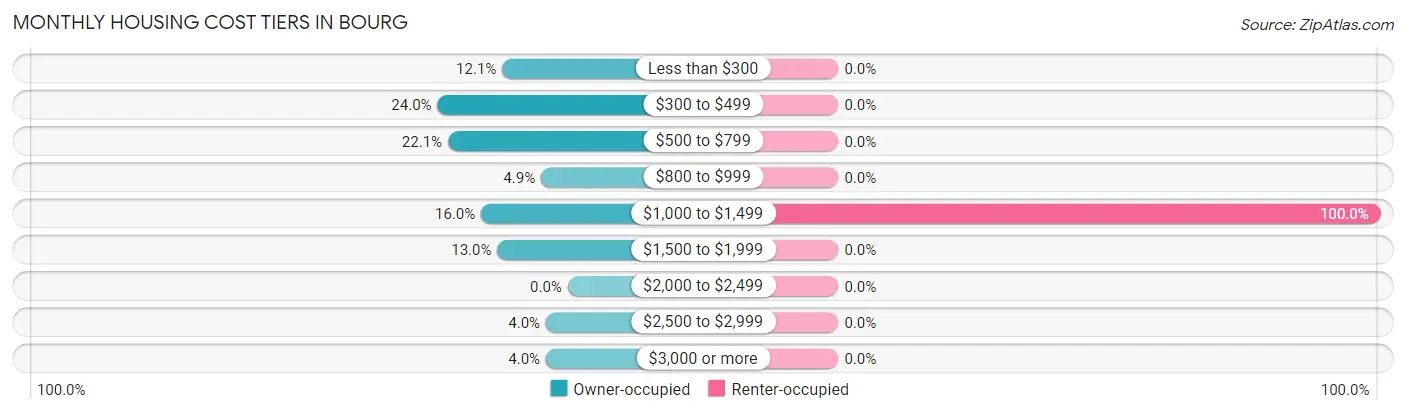
| Monthly Cost | Owner-occupied | Renter-occupied |
| Less than $300 | 81 (12.1%) | 0 (0.0%) |
| $300 to $499 | 161 (24.0%) | 0 (0.0%) |
| $500 to $799 | 148 (22.1%) | 0 (0.0%) |
| $800 to $999 | 33 (4.9%) | 0 (0.0%) |
| $1,000 to $1,499 | 107 (16.0%) | 116 (100.0%) |
| $1,500 to $1,999 | 87 (13.0%) | 0 (0.0%) |
| $2,000 to $2,499 | 0 (0.0%) | 0 (0.0%) |
| $2,500 to $2,999 | 27 (4.0%) | 0 (0.0%) |
| $3,000 or more | 27 (4.0%) | 0 (0.0%) |
| Total | 671 (100.0%) | 116 (100.0%) |
Physical Housing Characteristics in Bourg
Housing Structures in Bourg
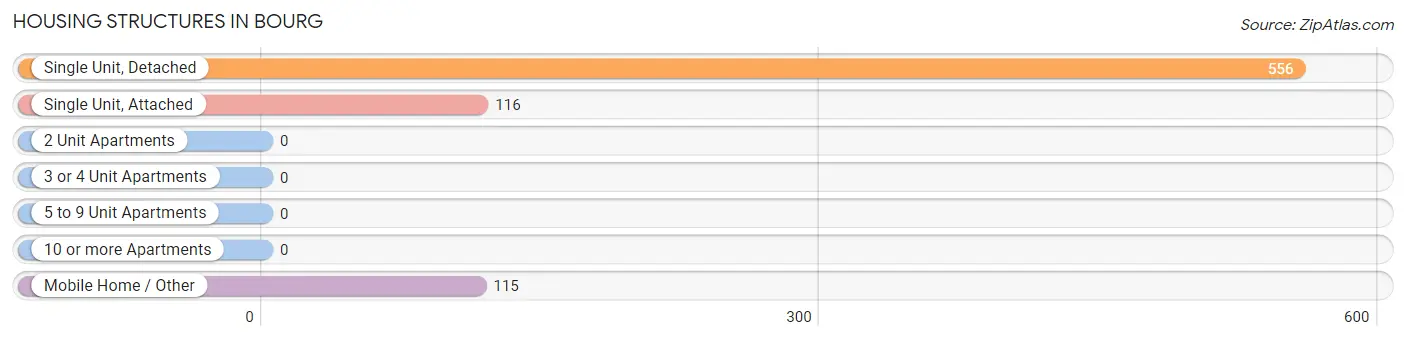
| Structure Type | # Housing Units | % Housing Units |
| Single Unit, Detached | 556 | 70.7% |
| Single Unit, Attached | 116 | 14.7% |
| 2 Unit Apartments | 0 | 0.0% |
| 3 or 4 Unit Apartments | 0 | 0.0% |
| 5 to 9 Unit Apartments | 0 | 0.0% |
| 10 or more Apartments | 0 | 0.0% |
| Mobile Home / Other | 115 | 14.6% |
| Total | 787 | 100.0% |
Housing Structures by Occupancy in Bourg
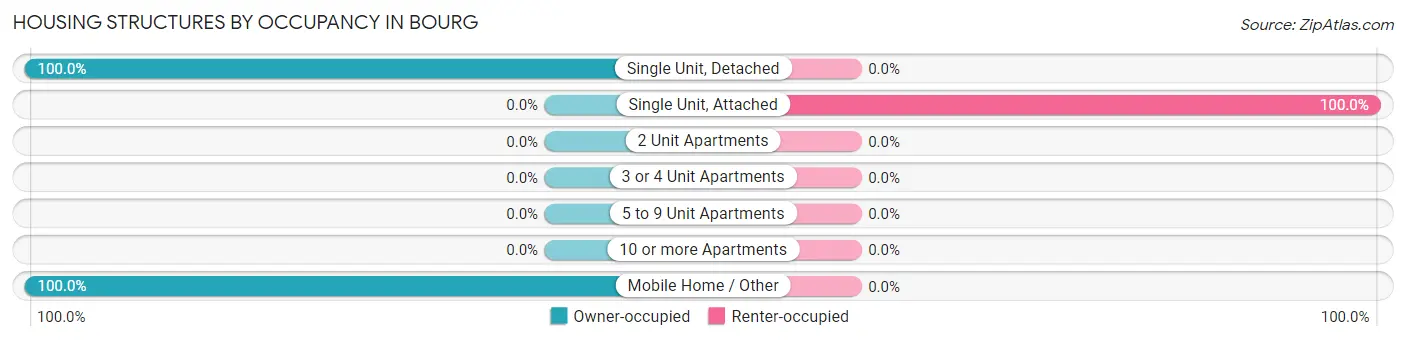
| Structure Type | Owner-occupied | Renter-occupied |
| Single Unit, Detached | 556 (100.0%) | 0 (0.0%) |
| Single Unit, Attached | 0 (0.0%) | 116 (100.0%) |
| 2 Unit Apartments | 0 (0.0%) | 0 (0.0%) |
| 3 or 4 Unit Apartments | 0 (0.0%) | 0 (0.0%) |
| 5 to 9 Unit Apartments | 0 (0.0%) | 0 (0.0%) |
| 10 or more Apartments | 0 (0.0%) | 0 (0.0%) |
| Mobile Home / Other | 115 (100.0%) | 0 (0.0%) |
| Total | 671 (85.3%) | 116 (14.7%) |
Housing Structures by Number of Rooms in Bourg
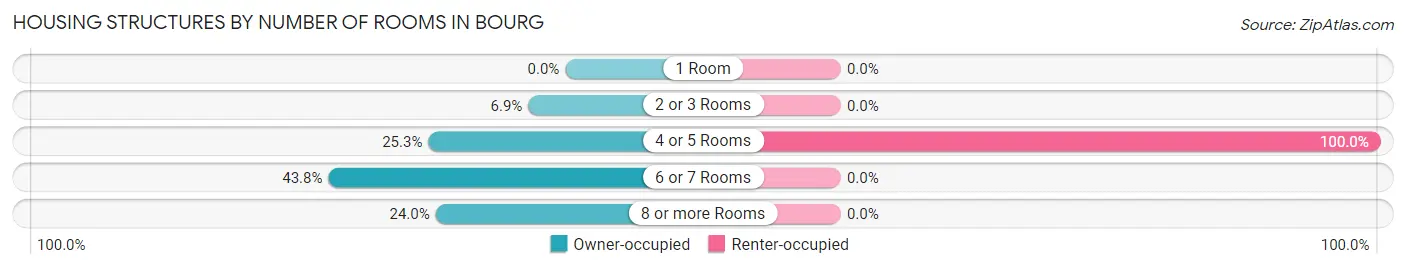
| Number of Rooms | Owner-occupied | Renter-occupied |
| 1 Room | 0 (0.0%) | 0 (0.0%) |
| 2 or 3 Rooms | 46 (6.9%) | 0 (0.0%) |
| 4 or 5 Rooms | 170 (25.3%) | 116 (100.0%) |
| 6 or 7 Rooms | 294 (43.8%) | 0 (0.0%) |
| 8 or more Rooms | 161 (24.0%) | 0 (0.0%) |
| Total | 671 (100.0%) | 116 (100.0%) |
Housing Structure by Heating Type in Bourg
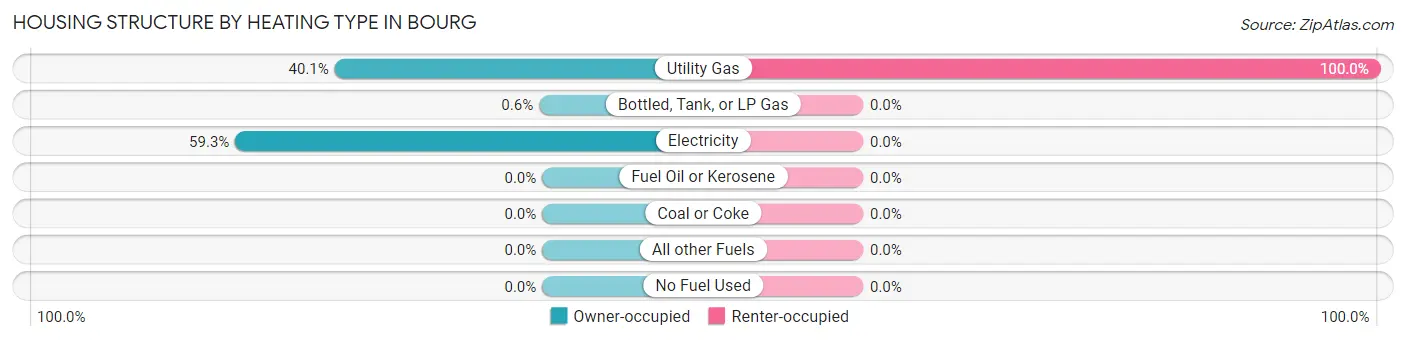
| Heating Type | Owner-occupied | Renter-occupied |
| Utility Gas | 269 (40.1%) | 116 (100.0%) |
| Bottled, Tank, or LP Gas | 4 (0.6%) | 0 (0.0%) |
| Electricity | 398 (59.3%) | 0 (0.0%) |
| Fuel Oil or Kerosene | 0 (0.0%) | 0 (0.0%) |
| Coal or Coke | 0 (0.0%) | 0 (0.0%) |
| All other Fuels | 0 (0.0%) | 0 (0.0%) |
| No Fuel Used | 0 (0.0%) | 0 (0.0%) |
| Total | 671 (100.0%) | 116 (100.0%) |
Household Vehicle Usage in Bourg
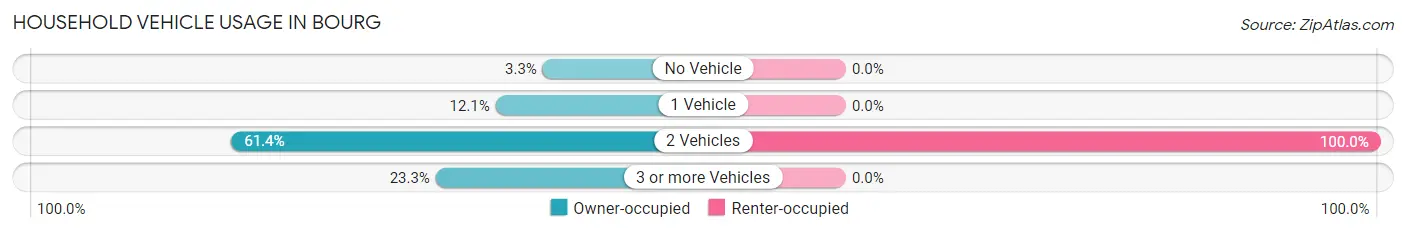
| Vehicles per Household | Owner-occupied | Renter-occupied |
| No Vehicle | 22 (3.3%) | 0 (0.0%) |
| 1 Vehicle | 81 (12.1%) | 0 (0.0%) |
| 2 Vehicles | 412 (61.4%) | 116 (100.0%) |
| 3 or more Vehicles | 156 (23.3%) | 0 (0.0%) |
| Total | 671 (100.0%) | 116 (100.0%) |
Real Estate & Mortgages in Bourg
Real Estate and Mortgage Overview in Bourg
| Characteristic | Without Mortgage | With Mortgage |
| Housing Units | 306 | 365 |
| Median Property Value | $157,300 | $221,300 |
| Median Household Income | $88,854 | $132 |
| Monthly Housing Costs | $381 | $27 |
| Real Estate Taxes | $817 | $75 |
Property Value by Mortgage Status in Bourg
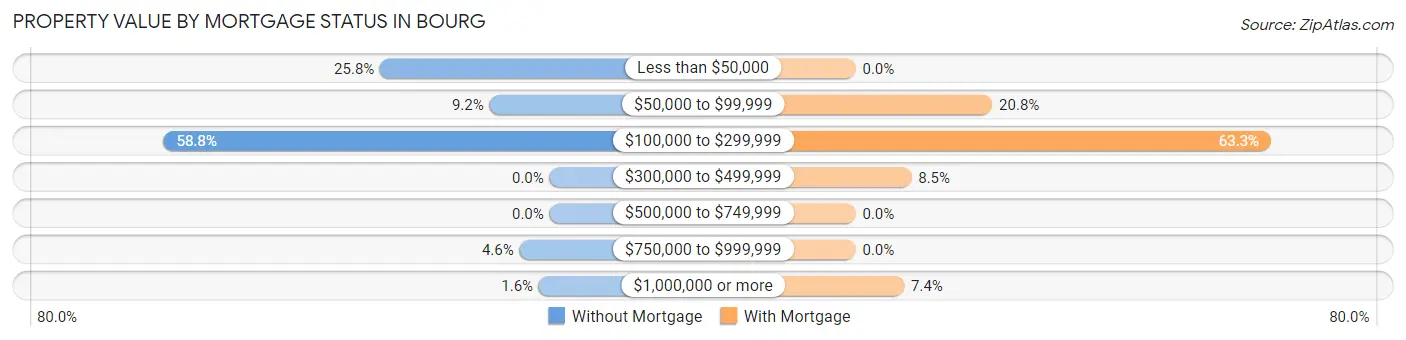
| Property Value | Without Mortgage | With Mortgage |
| Less than $50,000 | 79 (25.8%) | 0 (0.0%) |
| $50,000 to $99,999 | 28 (9.1%) | 76 (20.8%) |
| $100,000 to $299,999 | 180 (58.8%) | 231 (63.3%) |
| $300,000 to $499,999 | 0 (0.0%) | 31 (8.5%) |
| $500,000 to $749,999 | 0 (0.0%) | 0 (0.0%) |
| $750,000 to $999,999 | 14 (4.6%) | 0 (0.0%) |
| $1,000,000 or more | 5 (1.6%) | 27 (7.4%) |
| Total | 306 (100.0%) | 365 (100.0%) |
Household Income by Mortgage Status in Bourg
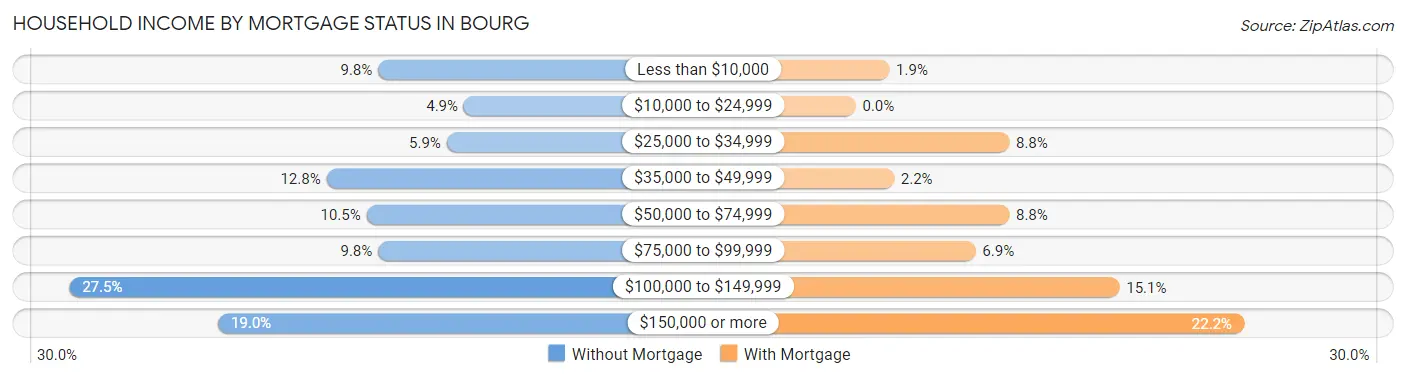
| Household Income | Without Mortgage | With Mortgage |
| Less than $10,000 | 30 (9.8%) | 7 (1.9%) |
| $10,000 to $24,999 | 15 (4.9%) | 0 (0.0%) |
| $25,000 to $34,999 | 18 (5.9%) | 32 (8.8%) |
| $35,000 to $49,999 | 39 (12.8%) | 8 (2.2%) |
| $50,000 to $74,999 | 32 (10.5%) | 32 (8.8%) |
| $75,000 to $99,999 | 30 (9.8%) | 25 (6.9%) |
| $100,000 to $149,999 | 84 (27.5%) | 55 (15.1%) |
| $150,000 or more | 58 (19.0%) | 81 (22.2%) |
| Total | 306 (100.0%) | 365 (100.0%) |
Property Value to Household Income Ratio in Bourg
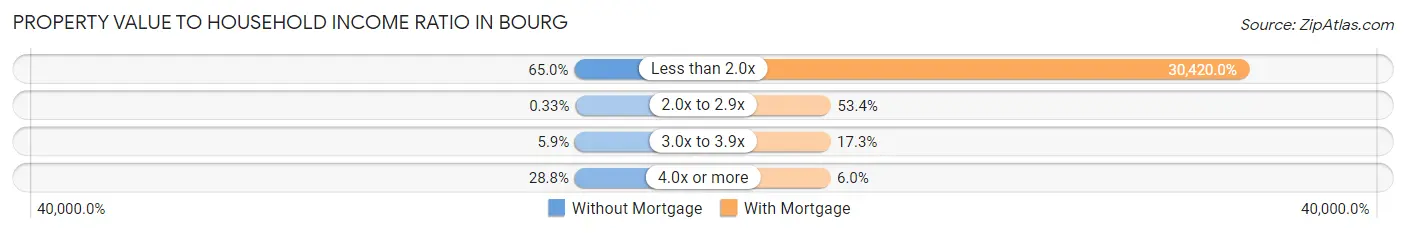
| Value-to-Income Ratio | Without Mortgage | With Mortgage |
| Less than 2.0x | 199 (65.0%) | 111,033 (30,420.0%) |
| 2.0x to 2.9x | 1 (0.3%) | 195 (53.4%) |
| 3.0x to 3.9x | 18 (5.9%) | 63 (17.3%) |
| 4.0x or more | 88 (28.8%) | 22 (6.0%) |
| Total | 306 (100.0%) | 365 (100.0%) |
Real Estate Taxes by Mortgage Status in Bourg
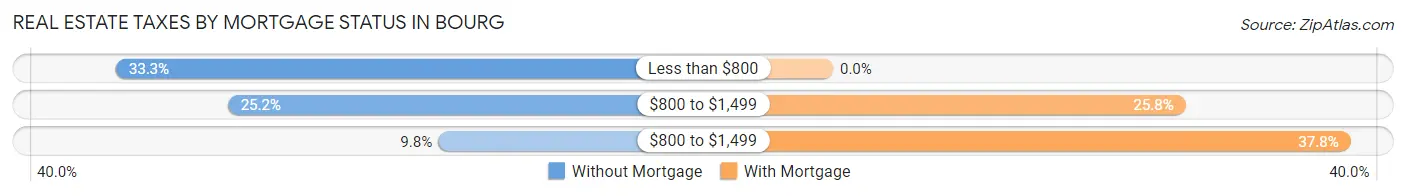
| Property Taxes | Without Mortgage | With Mortgage |
| Less than $800 | 102 (33.3%) | 0 (0.0%) |
| $800 to $1,499 | 77 (25.2%) | 94 (25.8%) |
| $800 to $1,499 | 30 (9.8%) | 138 (37.8%) |
| Total | 306 (100.0%) | 365 (100.0%) |
Health & Disability in Bourg
Health Insurance Coverage by Age in Bourg
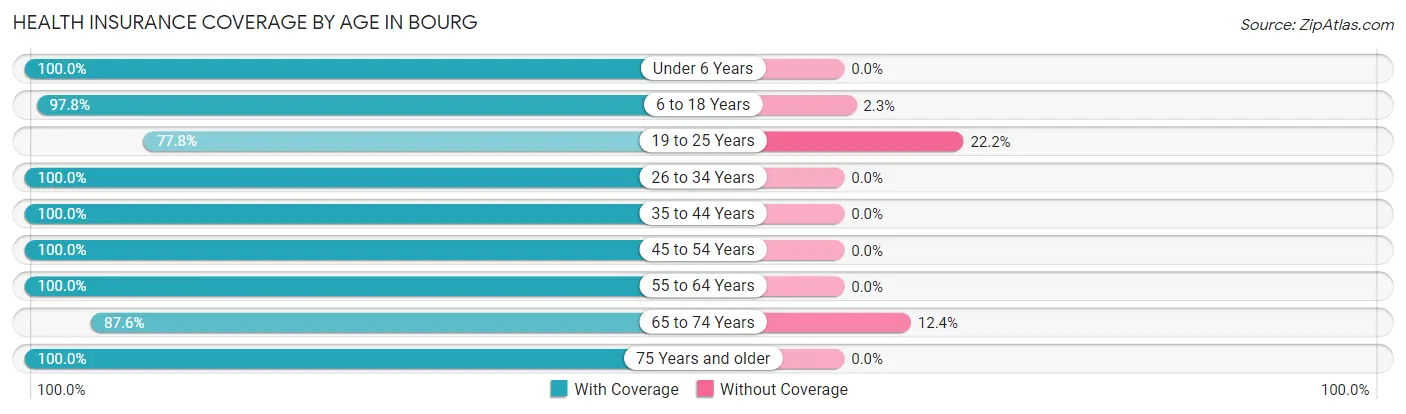
| Age Bracket | With Coverage | Without Coverage |
| Under 6 Years | 55 (100.0%) | 0 (0.0%) |
| 6 to 18 Years | 391 (97.8%) | 9 (2.2%) |
| 19 to 25 Years | 91 (77.8%) | 26 (22.2%) |
| 26 to 34 Years | 166 (100.0%) | 0 (0.0%) |
| 35 to 44 Years | 214 (100.0%) | 0 (0.0%) |
| 45 to 54 Years | 256 (100.0%) | 0 (0.0%) |
| 55 to 64 Years | 377 (100.0%) | 0 (0.0%) |
| 65 to 74 Years | 247 (87.6%) | 35 (12.4%) |
| 75 Years and older | 143 (100.0%) | 0 (0.0%) |
| Total | 1,940 (96.5%) | 70 (3.5%) |
Health Insurance Coverage by Citizenship Status in Bourg

| Citizenship Status | With Coverage | Without Coverage |
| Native Born | 55 (100.0%) | 0 (0.0%) |
| Foreign Born, Citizen | 391 (97.8%) | 9 (2.2%) |
| Foreign Born, not a Citizen | 91 (77.8%) | 26 (22.2%) |
Health Insurance Coverage by Household Income in Bourg
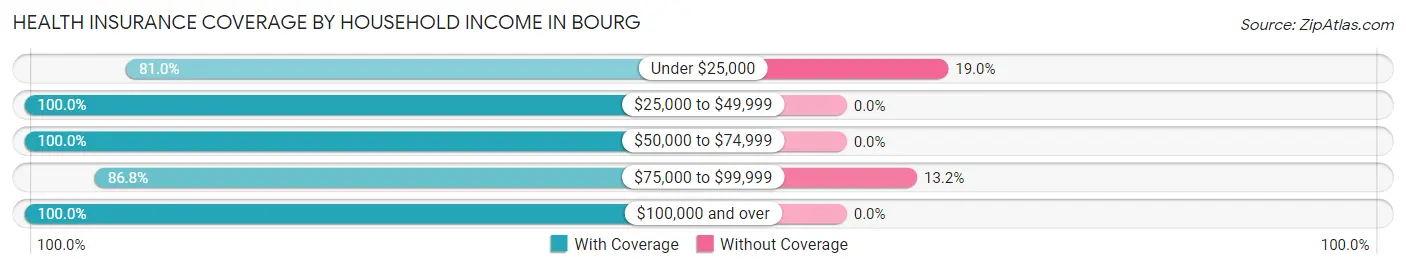
| Household Income | With Coverage | Without Coverage |
| Under $25,000 | 149 (81.0%) | 35 (19.0%) |
| $25,000 to $49,999 | 142 (100.0%) | 0 (0.0%) |
| $50,000 to $74,999 | 342 (100.0%) | 0 (0.0%) |
| $75,000 to $99,999 | 231 (86.8%) | 35 (13.2%) |
| $100,000 and over | 1,073 (100.0%) | 0 (0.0%) |
Public vs Private Health Insurance Coverage by Age in Bourg
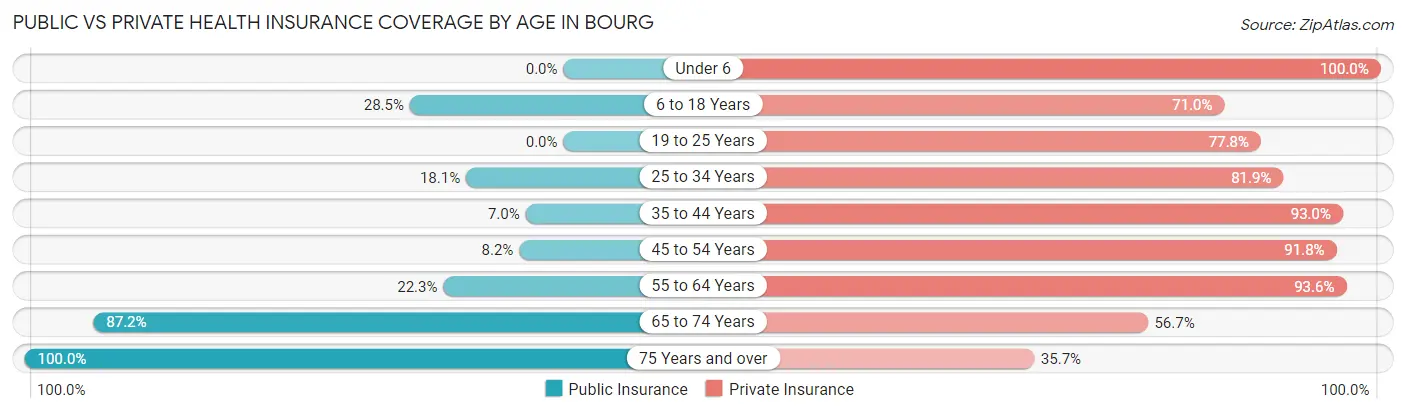
| Age Bracket | Public Insurance | Private Insurance |
| Under 6 | 0 (0.0%) | 55 (100.0%) |
| 6 to 18 Years | 114 (28.5%) | 284 (71.0%) |
| 19 to 25 Years | 0 (0.0%) | 91 (77.8%) |
| 25 to 34 Years | 30 (18.1%) | 136 (81.9%) |
| 35 to 44 Years | 15 (7.0%) | 199 (93.0%) |
| 45 to 54 Years | 21 (8.2%) | 235 (91.8%) |
| 55 to 64 Years | 84 (22.3%) | 353 (93.6%) |
| 65 to 74 Years | 246 (87.2%) | 160 (56.7%) |
| 75 Years and over | 143 (100.0%) | 51 (35.7%) |
| Total | 653 (32.5%) | 1,564 (77.8%) |
Disability Status by Sex by Age in Bourg
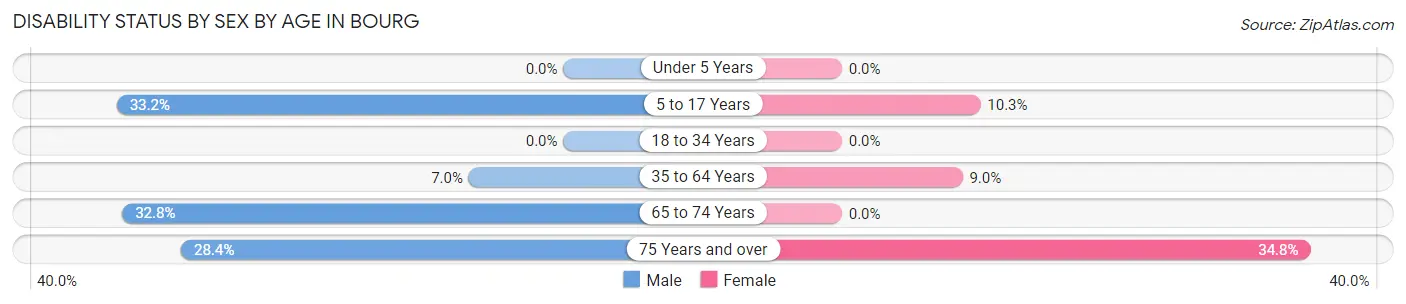
| Age Bracket | Male | Female |
| Under 5 Years | 0 (0.0%) | 0 (0.0%) |
| 5 to 17 Years | 65 (33.2%) | 21 (10.3%) |
| 18 to 34 Years | 0 (0.0%) | 0 (0.0%) |
| 35 to 64 Years | 25 (7.0%) | 44 (9.0%) |
| 65 to 74 Years | 56 (32.8%) | 0 (0.0%) |
| 75 Years and over | 21 (28.4%) | 24 (34.8%) |
Disability Class by Sex by Age in Bourg
Disability Class: Hearing Difficulty
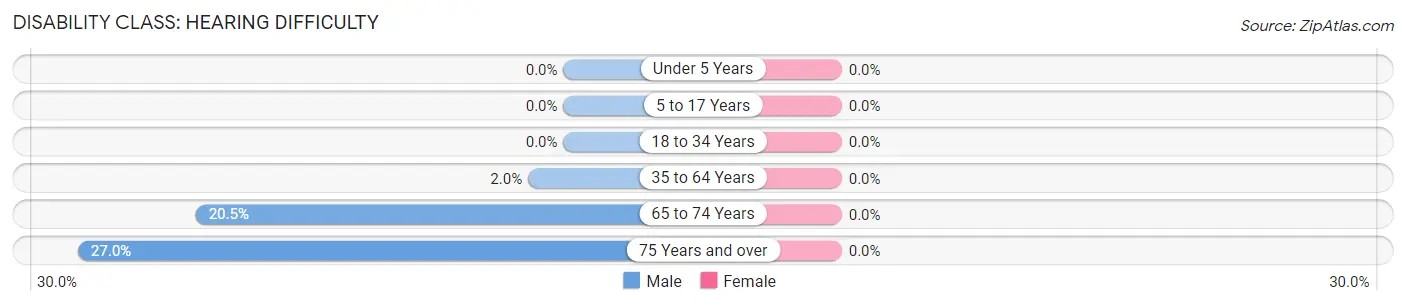
| Age Bracket | Male | Female |
| Under 5 Years | 0 (0.0%) | 0 (0.0%) |
| 5 to 17 Years | 0 (0.0%) | 0 (0.0%) |
| 18 to 34 Years | 0 (0.0%) | 0 (0.0%) |
| 35 to 64 Years | 7 (2.0%) | 0 (0.0%) |
| 65 to 74 Years | 35 (20.5%) | 0 (0.0%) |
| 75 Years and over | 20 (27.0%) | 0 (0.0%) |
Disability Class: Vision Difficulty
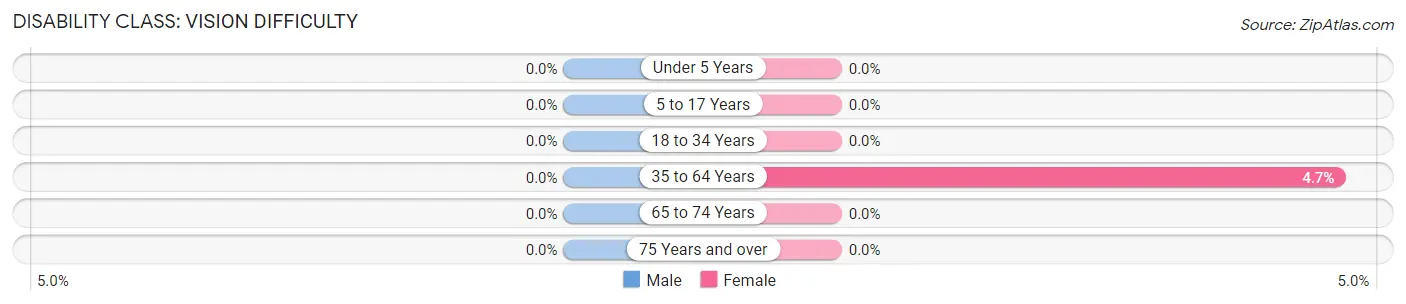
| Age Bracket | Male | Female |
| Under 5 Years | 0 (0.0%) | 0 (0.0%) |
| 5 to 17 Years | 0 (0.0%) | 0 (0.0%) |
| 18 to 34 Years | 0 (0.0%) | 0 (0.0%) |
| 35 to 64 Years | 0 (0.0%) | 23 (4.7%) |
| 65 to 74 Years | 0 (0.0%) | 0 (0.0%) |
| 75 Years and over | 0 (0.0%) | 0 (0.0%) |
Disability Class: Cognitive Difficulty
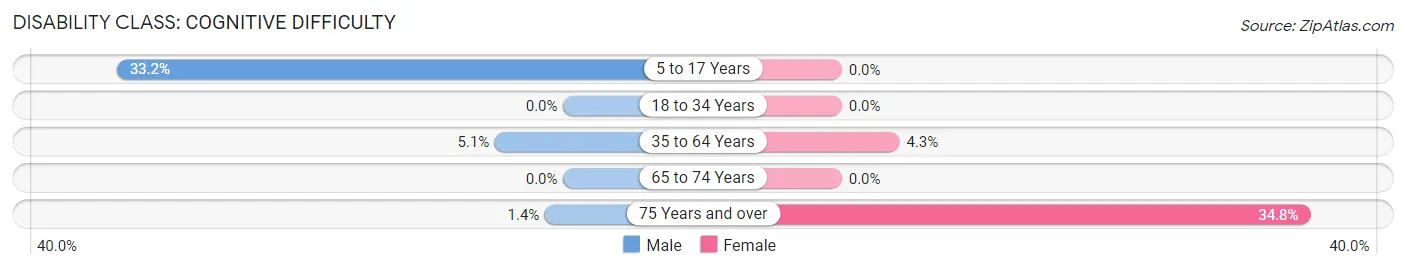
| Age Bracket | Male | Female |
| 5 to 17 Years | 65 (33.2%) | 0 (0.0%) |
| 18 to 34 Years | 0 (0.0%) | 0 (0.0%) |
| 35 to 64 Years | 18 (5.1%) | 21 (4.3%) |
| 65 to 74 Years | 0 (0.0%) | 0 (0.0%) |
| 75 Years and over | 1 (1.3%) | 24 (34.8%) |
Disability Class: Ambulatory Difficulty
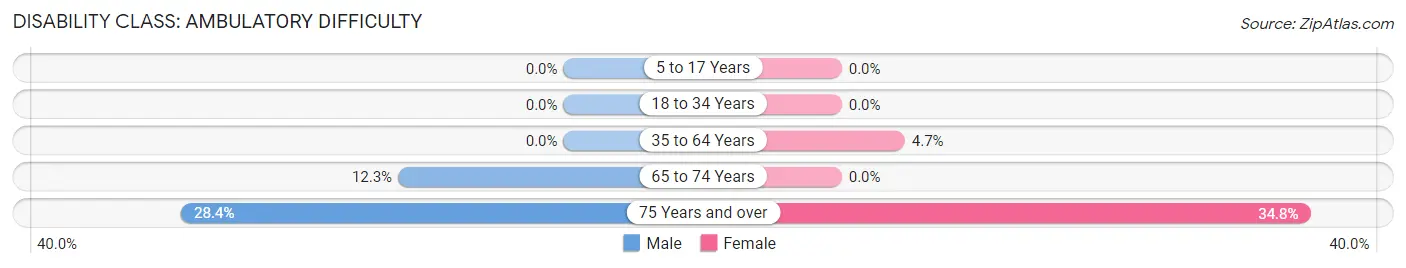
| Age Bracket | Male | Female |
| 5 to 17 Years | 0 (0.0%) | 0 (0.0%) |
| 18 to 34 Years | 0 (0.0%) | 0 (0.0%) |
| 35 to 64 Years | 0 (0.0%) | 23 (4.7%) |
| 65 to 74 Years | 21 (12.3%) | 0 (0.0%) |
| 75 Years and over | 21 (28.4%) | 24 (34.8%) |
Disability Class: Self-Care Difficulty
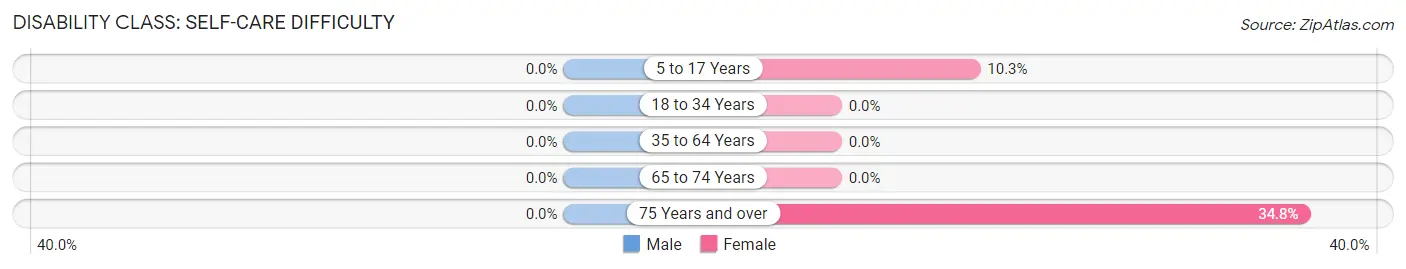
| Age Bracket | Male | Female |
| 5 to 17 Years | 0 (0.0%) | 21 (10.3%) |
| 18 to 34 Years | 0 (0.0%) | 0 (0.0%) |
| 35 to 64 Years | 0 (0.0%) | 0 (0.0%) |
| 65 to 74 Years | 0 (0.0%) | 0 (0.0%) |
| 75 Years and over | 0 (0.0%) | 24 (34.8%) |
Technology Access in Bourg
Computing Device Access in Bourg
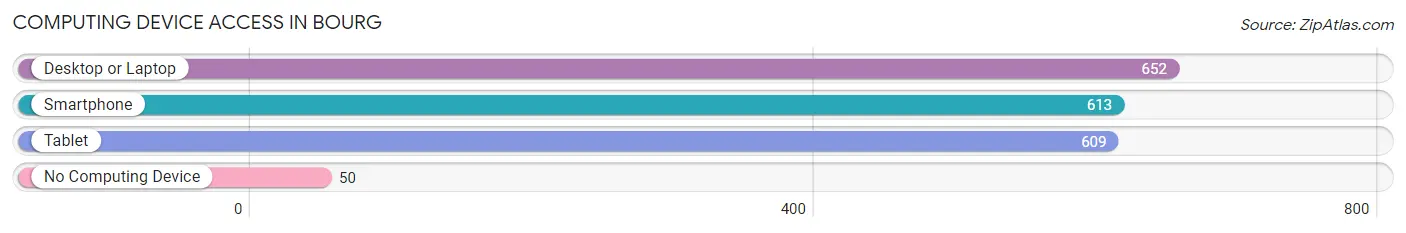
| Device Type | # Households | % Households |
| Desktop or Laptop | 652 | 82.9% |
| Smartphone | 613 | 77.9% |
| Tablet | 609 | 77.4% |
| No Computing Device | 50 | 6.4% |
| Total | 787 | 100.0% |
Internet Access in Bourg
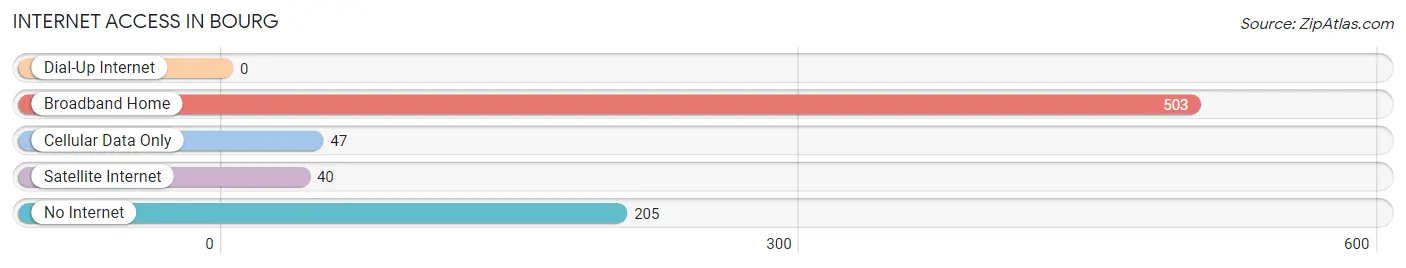
| Internet Type | # Households | % Households |
| Dial-Up Internet | 0 | 0.0% |
| Broadband Home | 503 | 63.9% |
| Cellular Data Only | 47 | 6.0% |
| Satellite Internet | 40 | 5.1% |
| No Internet | 205 | 26.1% |
| Total | 787 | 100.0% |
Bourg Summary
Bourg is a small unincorporated community located in Terrebonne Parish, Louisiana. It is situated on the banks of Bayou Terrebonne, approximately 15 miles south of Houma. The population of Bourg was estimated to be 2,845 in 2019.
History
Bourg was founded in the early 1800s by French settlers. The town was originally known as “La Bourg”, which translates to “the village”. The town was named after the French word for “village”. The town was originally a small fishing village, but it grew in size and importance over the years.
In the late 1800s, Bourg became a major port for the lumber industry. The town was also home to a number of sawmills and other businesses related to the lumber industry. The town was also home to a number of oyster canneries.
In the early 1900s, Bourg was a popular destination for tourists. The town was home to a number of resorts and hotels. The town was also home to a number of restaurants and bars.
In the late 1900s, Bourg experienced a decline in population due to the decline of the lumber industry. The town was also affected by the oil industry, which caused a decrease in the number of jobs available in the area.
Geography
Bourg is located in Terrebonne Parish, Louisiana. The town is situated on the banks of Bayou Terrebonne, approximately 15 miles south of Houma. The town is located in the Gulf Coast region of Louisiana.
The climate in Bourg is humid subtropical. The average temperature in the summer is around 80 degrees Fahrenheit, and the average temperature in the winter is around 60 degrees Fahrenheit. The town receives an average of 60 inches of rain per year.
Economy
The economy of Bourg is largely based on the oil and gas industry. The town is home to a number of oil and gas companies, including Chevron, Shell, and ExxonMobil. The town is also home to a number of seafood processing plants.
The town is also home to a number of small businesses, including restaurants, bars, and retail stores. The town is also home to a number of tourist attractions, including the Bayou Terrebonne Museum and the Bourg-Larose Marina.
Demographics
The population of Bourg was estimated to be 2,845 in 2019. The population is largely composed of white (77.3%) and African American (20.2%) residents. The median household income in Bourg is $41,945. The median age in Bourg is 38.7 years.
Common Questions
What is Per Capita Income in Bourg?
Per Capita income in Bourg is $40,015.
What is the Median Family Income in Bourg?
Median Family Income in Bourg is $98,875.
What is the Median Household income in Bourg?
Median Household Income in Bourg is $97,594.
What is Income or Wage Gap in Bourg?
Income or Wage Gap in Bourg is 31.7%.
Women in Bourg earn 68.3 cents for every dollar earned by a man.
What is Inequality or Gini Index in Bourg?
Inequality or Gini Index in Bourg is 0.37.
What is the Total Population of Bourg?
Total Population of Bourg is 2,010.
What is the Total Male Population of Bourg?
Total Male Population of Bourg is 956.
What is the Total Female Population of Bourg?
Total Female Population of Bourg is 1,054.
What is the Ratio of Males per 100 Females in Bourg?
There are 90.70 Males per 100 Females in Bourg.
What is the Ratio of Females per 100 Males in Bourg?
There are 110.25 Females per 100 Males in Bourg.
What is the Median Population Age in Bourg?
Median Population Age in Bourg is 46.4 Years.
What is the Average Family Size in Bourg
Average Family Size in Bourg is 2.6 People.
What is the Average Household Size in Bourg
Average Household Size in Bourg is 2.5 People.
How Large is the Labor Force in Bourg?
There are 1,062 People in the Labor Forcein in Bourg.
What is the Percentage of People in the Labor Force in Bourg?
66.6% of People are in the Labor Force in Bourg.
What is the Unemployment Rate in Bourg?
Unemployment Rate in Bourg is 0.8%.