Gray, LA Map & Demographics
Gray Map
Gray Overview
$26,453
PER CAPITA INCOME
$52,194
AVG FAMILY INCOME
$52,075
AVG HOUSEHOLD INCOME
41.3%
WAGE / INCOME GAP [ % ]
58.7¢/ $1
WAGE / INCOME GAP [ $ ]
0.50
INEQUALITY / GINI INDEX
5,951
TOTAL POPULATION
2,988
MALE POPULATION
2,963
FEMALE POPULATION
100.84
MALES / 100 FEMALES
99.16
FEMALES / 100 MALES
30.4
MEDIAN AGE
3.2
AVG FAMILY SIZE
2.9
AVG HOUSEHOLD SIZE
2,709
LABOR FORCE [ PEOPLE ]
62.4%
PERCENT IN LABOR FORCE
6.5%
UNEMPLOYMENT RATE
Gray Zip Codes
Gray Area Codes
Income in Gray
Income Overview in Gray
Per Capita Income in Gray is $26,453, while median incomes of families and households are $52,194 and $52,075 respectively.
| Characteristic | Number | Measure |
| Per Capita Income | 5,951 | $26,453 |
| Median Family Income | 1,574 | $52,194 |
| Mean Family Income | 1,574 | $85,571 |
| Median Household Income | 2,088 | $52,075 |
| Mean Household Income | 2,088 | $81,745 |
| Income Deficit | 1,574 | $0 |
| Wage / Income Gap (%) | 5,951 | 41.33% |
| Wage / Income Gap ($) | 5,951 | 58.67¢ per $1 |
| Gini / Inequality Index | 5,951 | 0.50 |
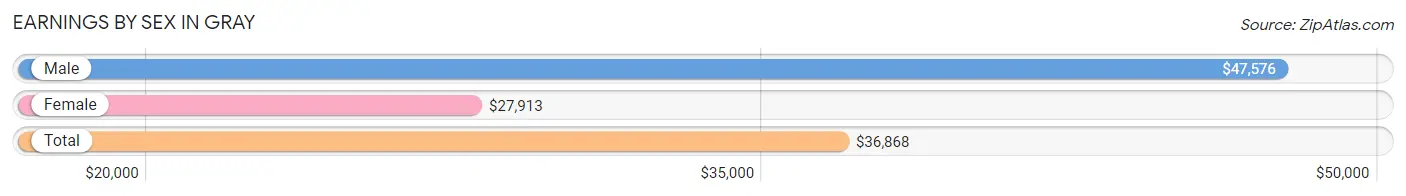
Earnings by Sex in Gray
Average Earnings in Gray are $36,868, $47,576 for men and $27,913 for women, a difference of 41.3%.
| Sex | Number | Average Earnings |
| Male | 1,374 (49.0%) | $47,576 |
| Female | 1,427 (50.9%) | $27,913 |
| Total | 2,801 (100.0%) | $36,868 |
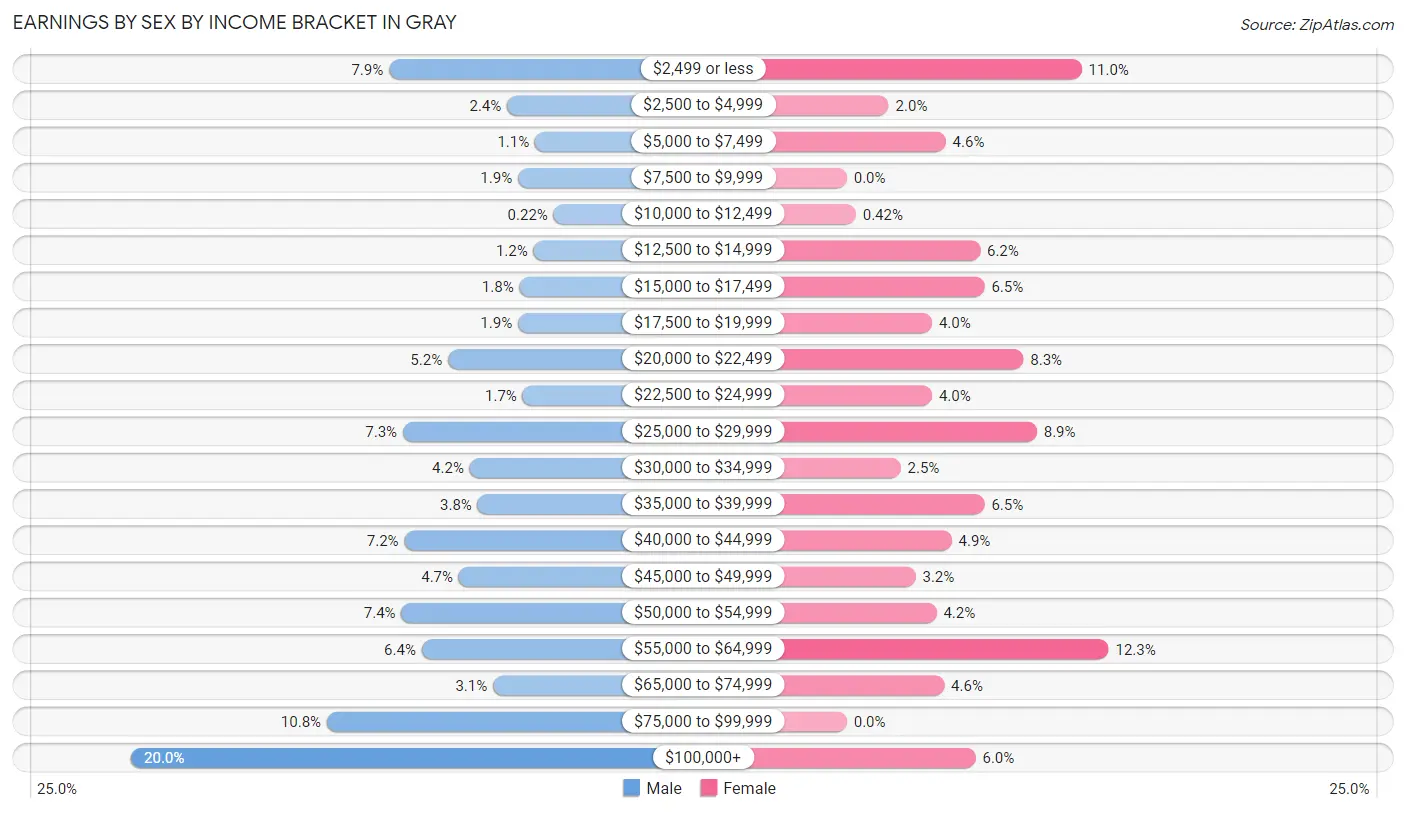
Earnings by Sex by Income Bracket in Gray
The most common earnings brackets in Gray are $100,000+ for men (275 | 20.0%) and $55,000 to $64,999 for women (175 | 12.3%).
| Income | Male | Female |
| $2,499 or less | 109 (7.9%) | 157 (11.0%) |
| $2,500 to $4,999 | 33 (2.4%) | 28 (2.0%) |
| $5,000 to $7,499 | 15 (1.1%) | 66 (4.6%) |
| $7,500 to $9,999 | 26 (1.9%) | 0 (0.0%) |
| $10,000 to $12,499 | 3 (0.2%) | 6 (0.4%) |
| $12,500 to $14,999 | 16 (1.2%) | 89 (6.2%) |
| $15,000 to $17,499 | 25 (1.8%) | 92 (6.5%) |
| $17,500 to $19,999 | 26 (1.9%) | 57 (4.0%) |
| $20,000 to $22,499 | 71 (5.2%) | 118 (8.3%) |
| $22,500 to $24,999 | 23 (1.7%) | 57 (4.0%) |
| $25,000 to $29,999 | 100 (7.3%) | 127 (8.9%) |
| $30,000 to $34,999 | 57 (4.2%) | 36 (2.5%) |
| $35,000 to $39,999 | 52 (3.8%) | 92 (6.5%) |
| $40,000 to $44,999 | 99 (7.2%) | 70 (4.9%) |
| $45,000 to $49,999 | 64 (4.7%) | 46 (3.2%) |
| $50,000 to $54,999 | 101 (7.3%) | 60 (4.2%) |
| $55,000 to $64,999 | 88 (6.4%) | 175 (12.3%) |
| $65,000 to $74,999 | 42 (3.1%) | 65 (4.6%) |
| $75,000 to $99,999 | 149 (10.8%) | 0 (0.0%) |
| $100,000+ | 275 (20.0%) | 86 (6.0%) |
| Total | 1,374 (100.0%) | 1,427 (100.0%) |
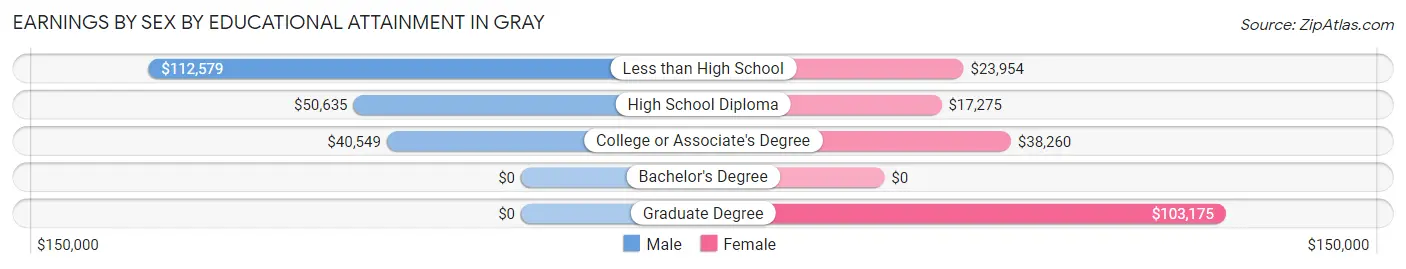
Earnings by Sex by Educational Attainment in Gray
Average earnings in Gray are $50,761 for men and $30,926 for women, a difference of 39.1%. Men with an educational attainment of less than high school enjoy the highest average annual earnings of $112,579, while those with college or associate's degree education earn the least with $40,549. Women with an educational attainment of graduate degree earn the most with the average annual earnings of $103,175, while those with high school diploma education have the smallest earnings of $17,275.
| Educational Attainment | Male Income | Female Income |
| Less than High School | $112,579 | $23,954 |
| High School Diploma | $50,635 | $17,275 |
| College or Associate's Degree | $40,549 | $38,260 |
| Bachelor's Degree | - | - |
| Graduate Degree | - | - |
| Total | $50,761 | $30,926 |
Family Income in Gray
Family Income Brackets in Gray
According to the Gray family income data, there are 411 families falling into the $50,000 to $74,999 income range, which is the most common income bracket and makes up 26.1% of all families. Conversely, the $10,000 to $14,999 income bracket is the least frequent group with only 27 families (1.7%) belonging to this category.
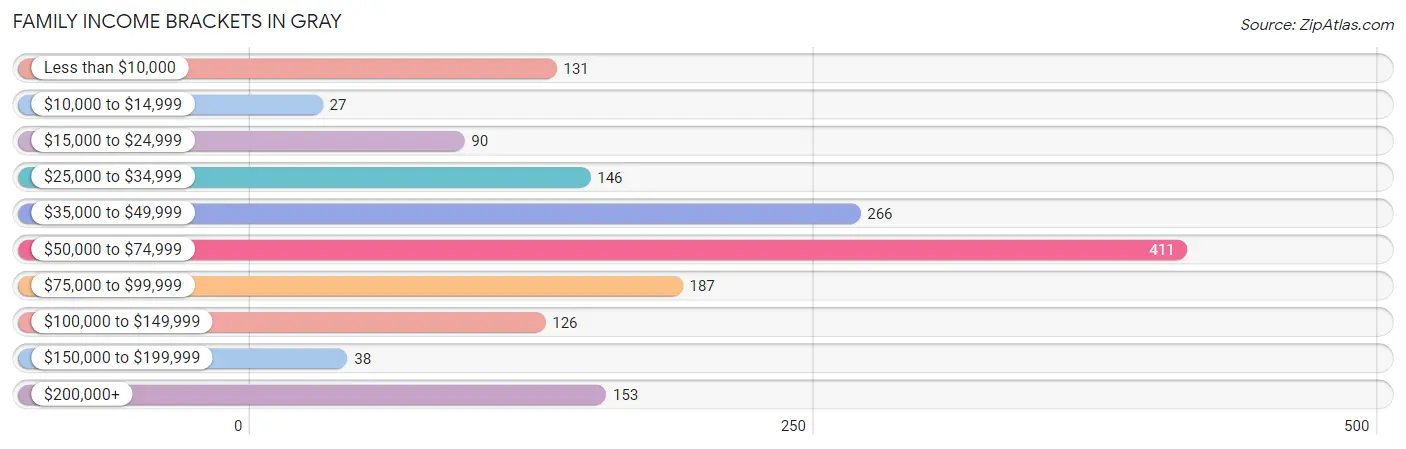
| Income Bracket | # Families | % Families |
| Less than $10,000 | 131 | 8.3% |
| $10,000 to $14,999 | 27 | 1.7% |
| $15,000 to $24,999 | 90 | 5.7% |
| $25,000 to $34,999 | 146 | 9.3% |
| $35,000 to $49,999 | 266 | 16.9% |
| $50,000 to $74,999 | 411 | 26.1% |
| $75,000 to $99,999 | 187 | 11.9% |
| $100,000 to $149,999 | 126 | 8.0% |
| $150,000 to $199,999 | 38 | 2.4% |
| $200,000+ | 153 | 9.7% |
Family Income by Famaliy Size in Gray
5-person families (161 | 10.2%) account for the highest median family income in Gray with $98,309 per family, while 2-person families (666 | 42.3%) have the highest median income of $24,192 per family member.
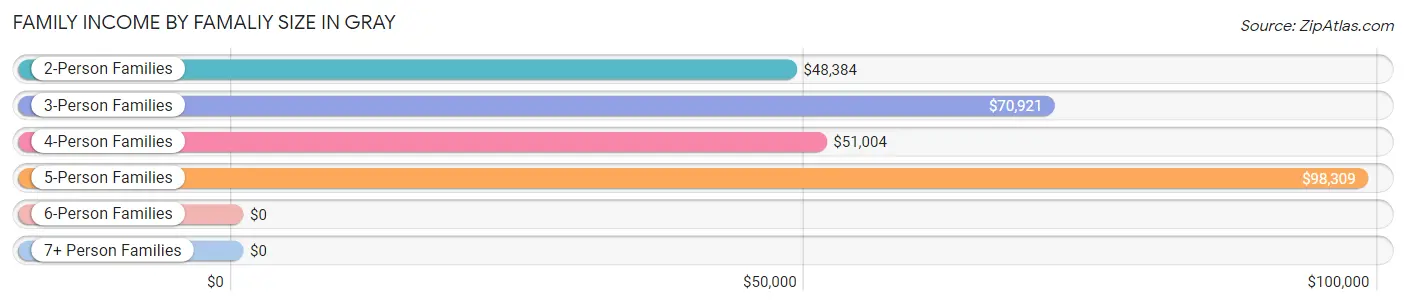
| Income Bracket | # Families | Median Income |
| 2-Person Families | 666 (42.3%) | $48,384 |
| 3-Person Families | 382 (24.3%) | $70,921 |
| 4-Person Families | 284 (18.0%) | $51,004 |
| 5-Person Families | 161 (10.2%) | $98,309 |
| 6-Person Families | 43 (2.7%) | $0 |
| 7+ Person Families | 38 (2.4%) | $0 |
| Total | 1,574 (100.0%) | $52,194 |
Family Income by Number of Earners in Gray
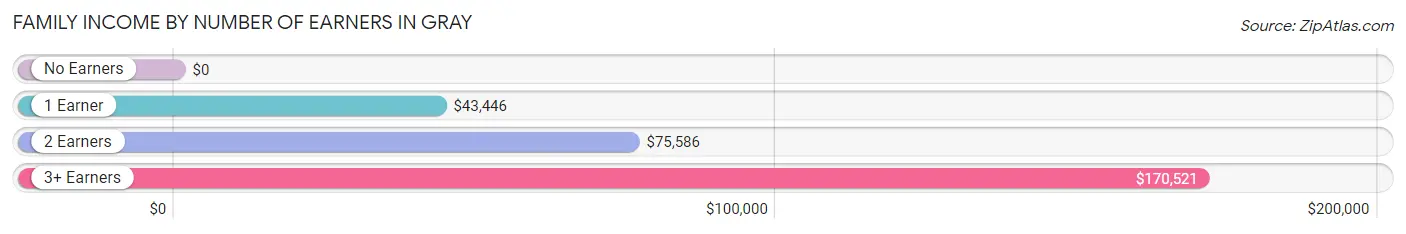
| Number of Earners | # Families | Median Income |
| No Earners | 175 (11.1%) | $0 |
| 1 Earner | 724 (46.0%) | $43,446 |
| 2 Earners | 555 (35.3%) | $75,586 |
| 3+ Earners | 120 (7.6%) | $170,521 |
| Total | 1,574 (100.0%) | $52,194 |
Household Income in Gray
Household Income Brackets in Gray
With 424 households falling in the category, the $50,000 to $74,999 income range is the most frequent in Gray, accounting for 20.3% of all households. In contrast, only 33 households (1.6%) fall into the $10,000 to $14,999 income bracket, making it the least populous group.
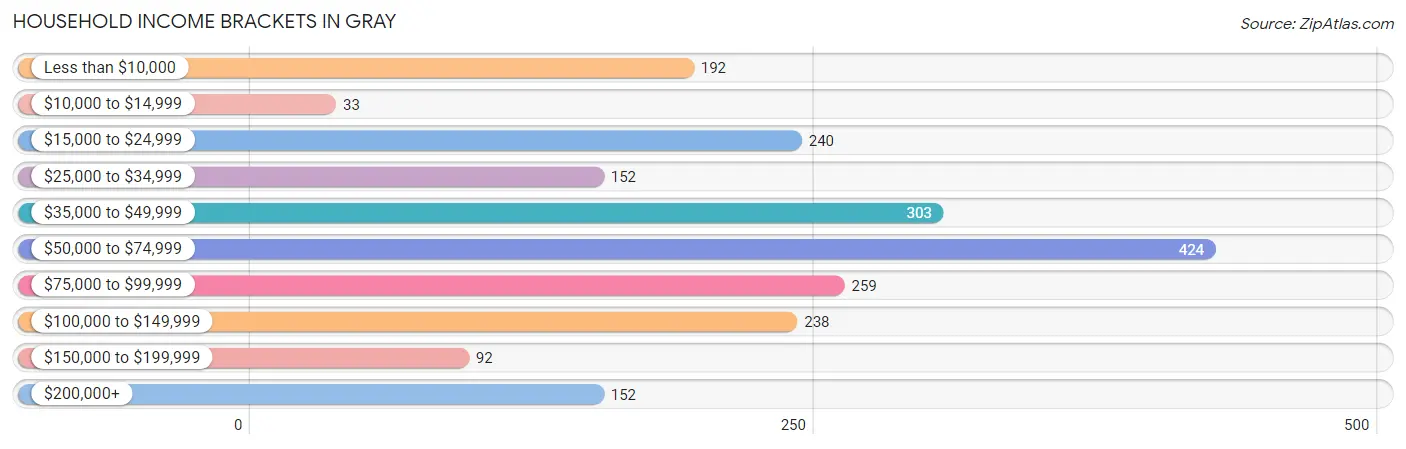
| Income Bracket | # Households | % Households |
| Less than $10,000 | 192 | 9.2% |
| $10,000 to $14,999 | 33 | 1.6% |
| $15,000 to $24,999 | 240 | 11.5% |
| $25,000 to $34,999 | 152 | 7.3% |
| $35,000 to $49,999 | 303 | 14.5% |
| $50,000 to $74,999 | 424 | 20.3% |
| $75,000 to $99,999 | 259 | 12.4% |
| $100,000 to $149,999 | 238 | 11.4% |
| $150,000 to $199,999 | 92 | 4.4% |
| $200,000+ | 152 | 7.3% |
Household Income by Householder Age in Gray
The median household income in Gray is $52,075, with the highest median household income of $69,390 found in the 45 to 64 years age bracket for the primary householder. A total of 849 households (40.7%) fall into this category. Meanwhile, the 15 to 24 years age bracket for the primary householder has the lowest median household income of $0, with 104 households (5.0%) in this group.
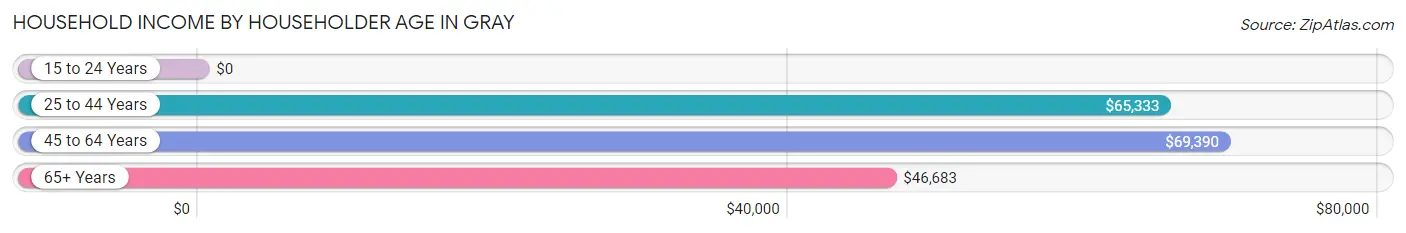
| Income Bracket | # Households | Median Income |
| 15 to 24 Years | 104 (5.0%) | $0 |
| 25 to 44 Years | 688 (33.0%) | $65,333 |
| 45 to 64 Years | 849 (40.7%) | $69,390 |
| 65+ Years | 447 (21.4%) | $46,683 |
| Total | 2,088 (100.0%) | $52,075 |
Poverty in Gray
Income Below Poverty by Sex and Age in Gray
With 19.0% poverty level for males and 14.7% for females among the residents of Gray, 12 to 14 year old males and 5 year old females are the most vulnerable to poverty, with 117 males (60.0%) and 12 females (60.0%) in their respective age groups living below the poverty level.
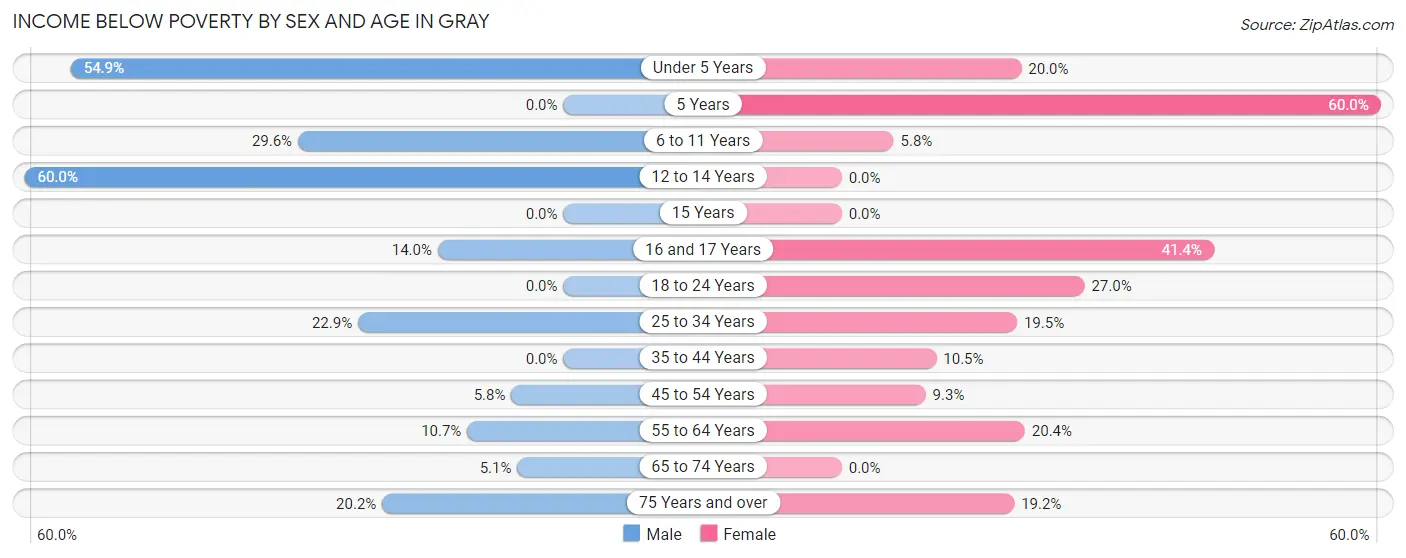
| Age Bracket | Male | Female |
| Under 5 Years | 113 (54.8%) | 38 (20.0%) |
| 5 Years | 0 (0.0%) | 12 (60.0%) |
| 6 to 11 Years | 94 (29.6%) | 12 (5.8%) |
| 12 to 14 Years | 117 (60.0%) | 0 (0.0%) |
| 15 Years | 0 (0.0%) | 0 (0.0%) |
| 16 and 17 Years | 13 (14.0%) | 29 (41.4%) |
| 18 to 24 Years | 0 (0.0%) | 93 (27.0%) |
| 25 to 34 Years | 134 (22.9%) | 88 (19.5%) |
| 35 to 44 Years | 0 (0.0%) | 30 (10.5%) |
| 45 to 54 Years | 24 (5.8%) | 34 (9.3%) |
| 55 to 64 Years | 36 (10.7%) | 74 (20.4%) |
| 65 to 74 Years | 10 (5.1%) | 0 (0.0%) |
| 75 Years and over | 22 (20.2%) | 24 (19.2%) |
| Total | 563 (19.0%) | 434 (14.7%) |
Income Above Poverty by Sex and Age in Gray
According to the poverty statistics in Gray, males aged 5 years and females aged 12 to 14 years are the age groups that are most secure financially, with 100.0% of males and 100.0% of females in these age groups living above the poverty line.
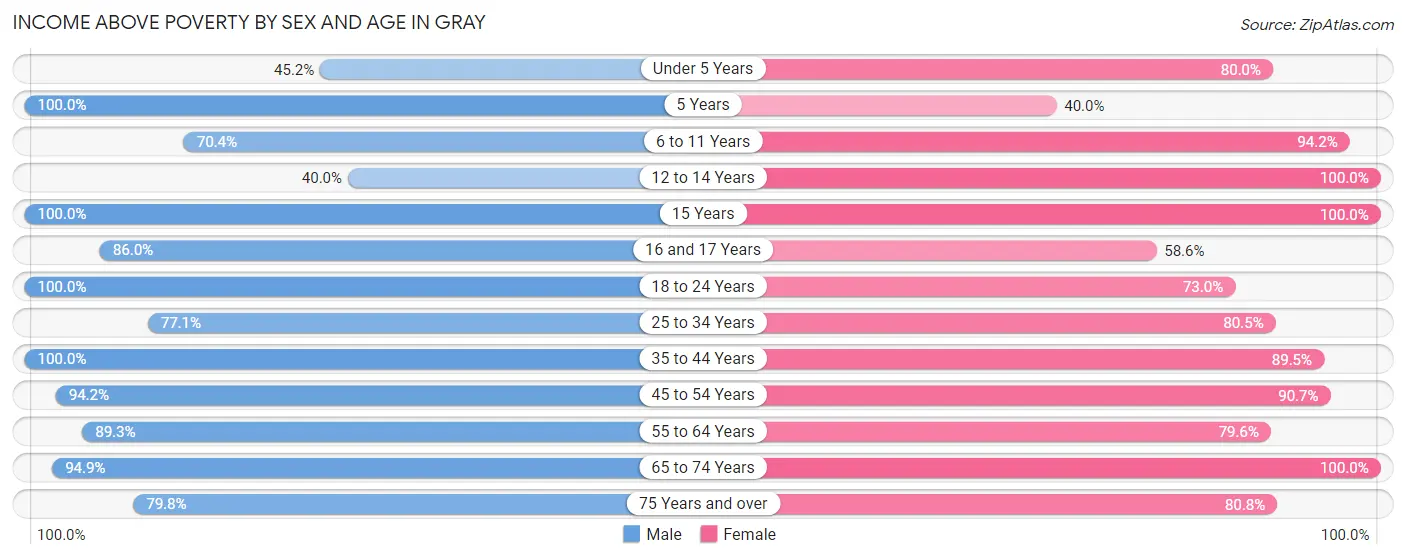
| Age Bracket | Male | Female |
| Under 5 Years | 93 (45.2%) | 152 (80.0%) |
| 5 Years | 59 (100.0%) | 8 (40.0%) |
| 6 to 11 Years | 224 (70.4%) | 196 (94.2%) |
| 12 to 14 Years | 78 (40.0%) | 201 (100.0%) |
| 15 Years | 68 (100.0%) | 100 (100.0%) |
| 16 and 17 Years | 80 (86.0%) | 41 (58.6%) |
| 18 to 24 Years | 196 (100.0%) | 251 (73.0%) |
| 25 to 34 Years | 452 (77.1%) | 363 (80.5%) |
| 35 to 44 Years | 185 (100.0%) | 255 (89.5%) |
| 45 to 54 Years | 390 (94.2%) | 330 (90.7%) |
| 55 to 64 Years | 300 (89.3%) | 289 (79.6%) |
| 65 to 74 Years | 185 (94.9%) | 224 (100.0%) |
| 75 Years and over | 87 (79.8%) | 101 (80.8%) |
| Total | 2,397 (81.0%) | 2,511 (85.3%) |
Income Below Poverty Among Married-Couple Families in Gray
The poverty statistics for married-couple families in Gray show that 7.1% or 67 of the total 947 families live below the poverty line. Families with 1 or 2 children have the highest poverty rate of 10.9%, comprising of 30 families. On the other hand, families with no children have the lowest poverty rate of 4.5%, which includes 24 families.
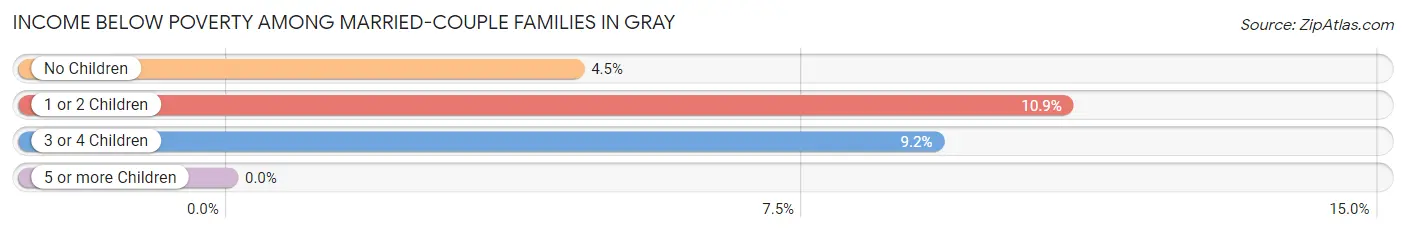
| Children | Above Poverty | Below Poverty |
| No Children | 507 (95.5%) | 24 (4.5%) |
| 1 or 2 Children | 245 (89.1%) | 30 (10.9%) |
| 3 or 4 Children | 128 (90.8%) | 13 (9.2%) |
| 5 or more Children | 0 (0.0%) | 0 (0.0%) |
| Total | 880 (92.9%) | 67 (7.1%) |
Income Below Poverty Among Single-Parent Households in Gray
According to the poverty data in Gray, 35.2% or 43 single-father households and 29.9% or 151 single-mother households are living below the poverty line. Among single-father households, those with 3 or 4 children have the highest poverty rate, with 43 households (100.0%) experiencing poverty. Likewise, among single-mother households, those with 1 or 2 children have the highest poverty rate, with 109 households (46.2%) falling below the poverty line.
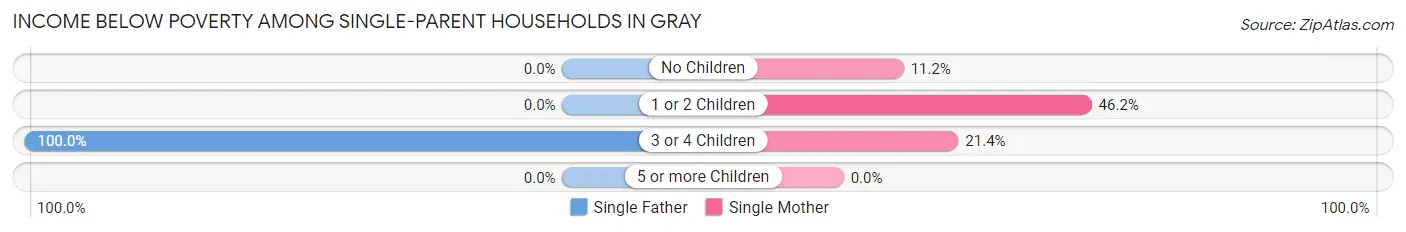
| Children | Single Father | Single Mother |
| No Children | 0 (0.0%) | 17 (11.2%) |
| 1 or 2 Children | 0 (0.0%) | 109 (46.2%) |
| 3 or 4 Children | 43 (100.0%) | 25 (21.4%) |
| 5 or more Children | 0 (0.0%) | 0 (0.0%) |
| Total | 43 (35.2%) | 151 (29.9%) |
Income Below Poverty Among Married-Couple vs Single-Parent Households in Gray
The poverty data for Gray shows that 67 of the married-couple family households (7.1%) and 194 of the single-parent households (30.9%) are living below the poverty level. Within the married-couple family households, those with 1 or 2 children have the highest poverty rate, with 30 households (10.9%) falling below the poverty line. Among the single-parent households, those with 1 or 2 children have the highest poverty rate, with 109 household (42.7%) living below poverty.
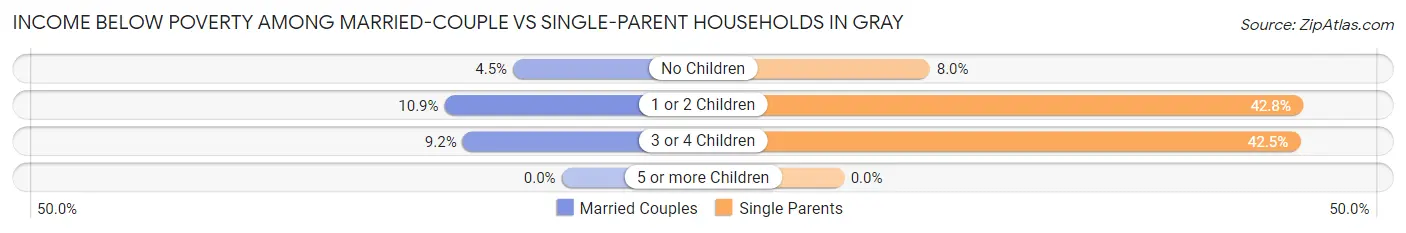
| Children | Married-Couple Families | Single-Parent Households |
| No Children | 24 (4.5%) | 17 (8.0%) |
| 1 or 2 Children | 30 (10.9%) | 109 (42.7%) |
| 3 or 4 Children | 13 (9.2%) | 68 (42.5%) |
| 5 or more Children | 0 (0.0%) | 0 (0.0%) |
| Total | 67 (7.1%) | 194 (30.9%) |
Race in Gray
The most populous races in Gray are White / Caucasian (2,840 | 47.7%), Black / African American (2,753 | 46.3%), and Native / Alaskan (186 | 3.1%).
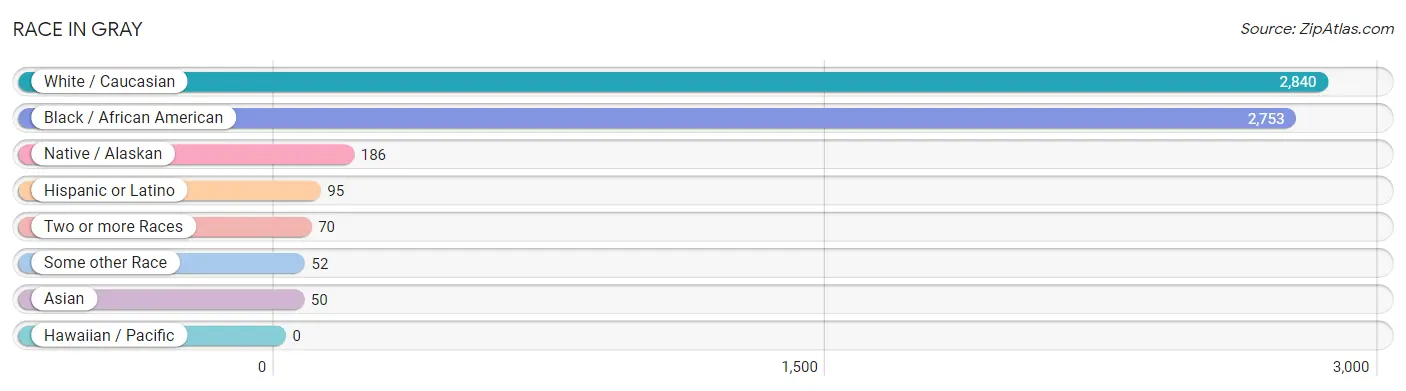
| Race | # Population | % Population |
| Asian | 50 | 0.8% |
| Black / African American | 2,753 | 46.3% |
| Hawaiian / Pacific | 0 | 0.0% |
| Hispanic or Latino | 95 | 1.6% |
| Native / Alaskan | 186 | 3.1% |
| White / Caucasian | 2,840 | 47.7% |
| Two or more Races | 70 | 1.2% |
| Some other Race | 52 | 0.9% |
| Total | 5,951 | 100.0% |
Ancestry in Gray
The most populous ancestries reported in Gray are French (936 | 15.7%), French Canadian (367 | 6.2%), Scotch-Irish (212 | 3.6%), American (198 | 3.3%), and Houma (161 | 2.7%), together accounting for 31.5% of all Gray residents.
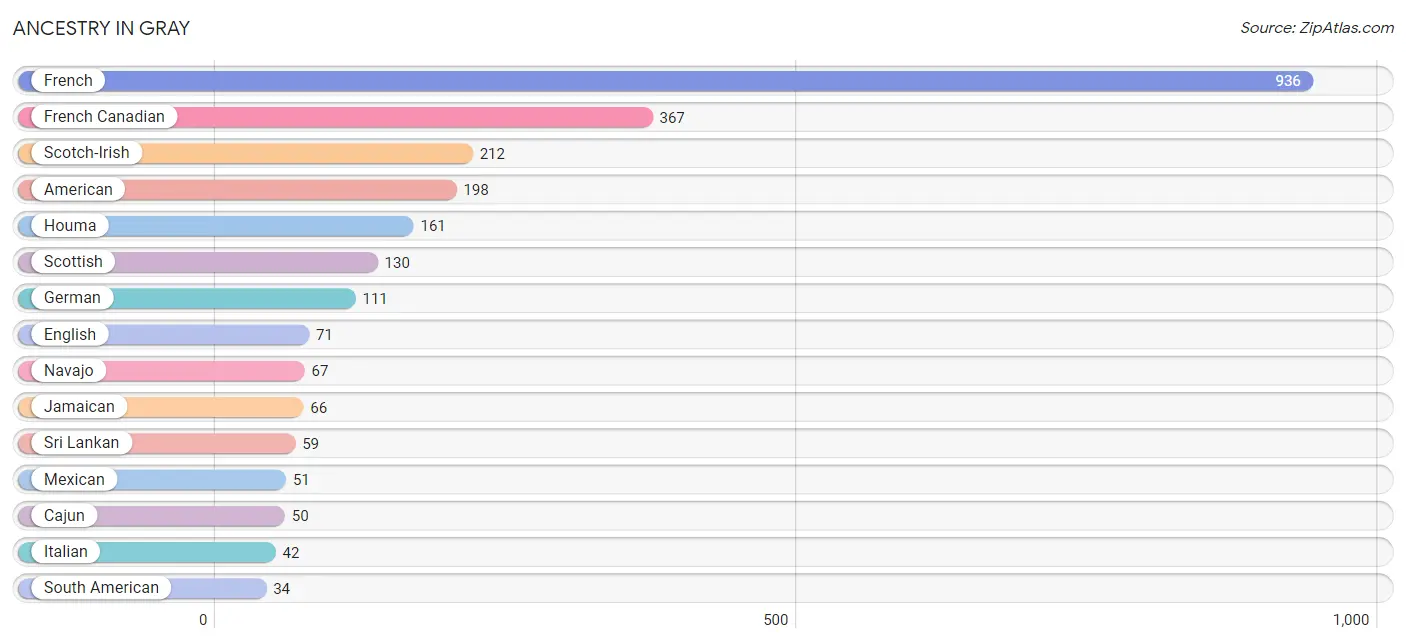
| Ancestry | # Population | % Population |
| American | 198 | 3.3% |
| Brazilian | 28 | 0.5% |
| British | 18 | 0.3% |
| Cajun | 50 | 0.8% |
| Cherokee | 5 | 0.1% |
| Colombian | 11 | 0.2% |
| English | 71 | 1.2% |
| European | 22 | 0.4% |
| French | 936 | 15.7% |
| French Canadian | 367 | 6.2% |
| German | 111 | 1.9% |
| Houma | 161 | 2.7% |
| Irish | 8 | 0.1% |
| Italian | 42 | 0.7% |
| Jamaican | 66 | 1.1% |
| Mexican | 51 | 0.9% |
| Navajo | 67 | 1.1% |
| Norwegian | 8 | 0.1% |
| Peruvian | 23 | 0.4% |
| Puerto Rican | 10 | 0.2% |
| Scotch-Irish | 212 | 3.6% |
| Scottish | 130 | 2.2% |
| South American | 34 | 0.6% |
| Sri Lankan | 59 | 1.0% |
| Swedish | 8 | 0.1% | View All 25 Rows |
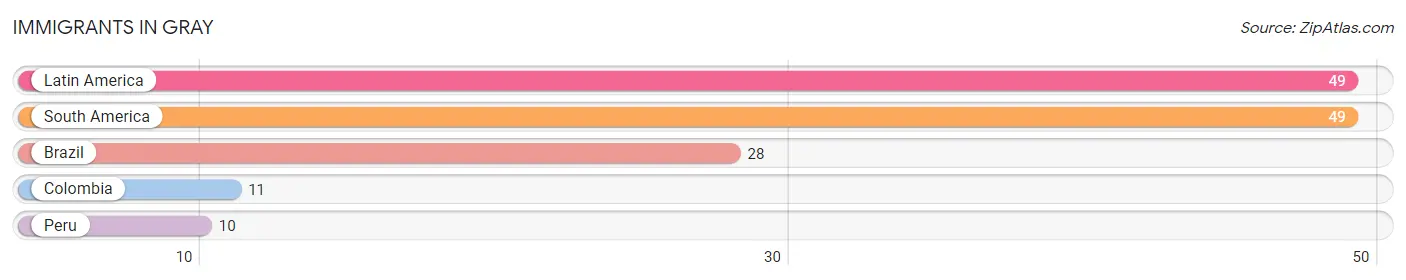
Immigrants in Gray
The most numerous immigrant groups reported in Gray came from Latin America (49 | 0.8%), South America (49 | 0.8%), Brazil (28 | 0.5%), Colombia (11 | 0.2%), and Peru (10 | 0.2%), together accounting for 2.5% of all Gray residents.
| Immigration Origin | # Population | % Population |
| Brazil | 28 | 0.5% |
| Colombia | 11 | 0.2% |
| Latin America | 49 | 0.8% |
| Peru | 10 | 0.2% |
| South America | 49 | 0.8% | View All 5 Rows |
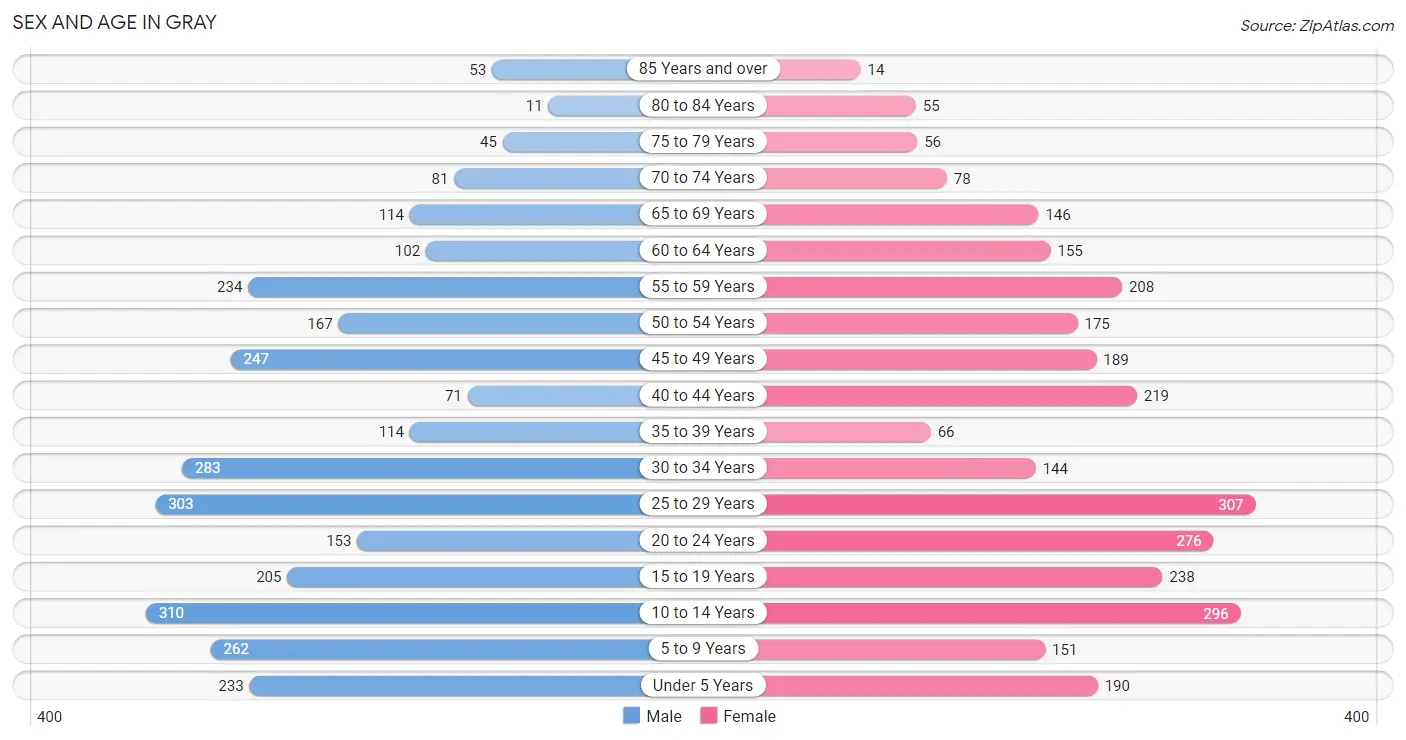
Sex and Age in Gray
Sex and Age in Gray
The most populous age groups in Gray are 10 to 14 Years (310 | 10.4%) for men and 25 to 29 Years (307 | 10.4%) for women.
| Age Bracket | Male | Female |
| Under 5 Years | 233 (7.8%) | 190 (6.4%) |
| 5 to 9 Years | 262 (8.8%) | 151 (5.1%) |
| 10 to 14 Years | 310 (10.4%) | 296 (10.0%) |
| 15 to 19 Years | 205 (6.9%) | 238 (8.0%) |
| 20 to 24 Years | 153 (5.1%) | 276 (9.3%) |
| 25 to 29 Years | 303 (10.1%) | 307 (10.4%) |
| 30 to 34 Years | 283 (9.5%) | 144 (4.9%) |
| 35 to 39 Years | 114 (3.8%) | 66 (2.2%) |
| 40 to 44 Years | 71 (2.4%) | 219 (7.4%) |
| 45 to 49 Years | 247 (8.3%) | 189 (6.4%) |
| 50 to 54 Years | 167 (5.6%) | 175 (5.9%) |
| 55 to 59 Years | 234 (7.8%) | 208 (7.0%) |
| 60 to 64 Years | 102 (3.4%) | 155 (5.2%) |
| 65 to 69 Years | 114 (3.8%) | 146 (4.9%) |
| 70 to 74 Years | 81 (2.7%) | 78 (2.6%) |
| 75 to 79 Years | 45 (1.5%) | 56 (1.9%) |
| 80 to 84 Years | 11 (0.4%) | 55 (1.9%) |
| 85 Years and over | 53 (1.8%) | 14 (0.5%) |
| Total | 2,988 (100.0%) | 2,963 (100.0%) |
Families and Households in Gray
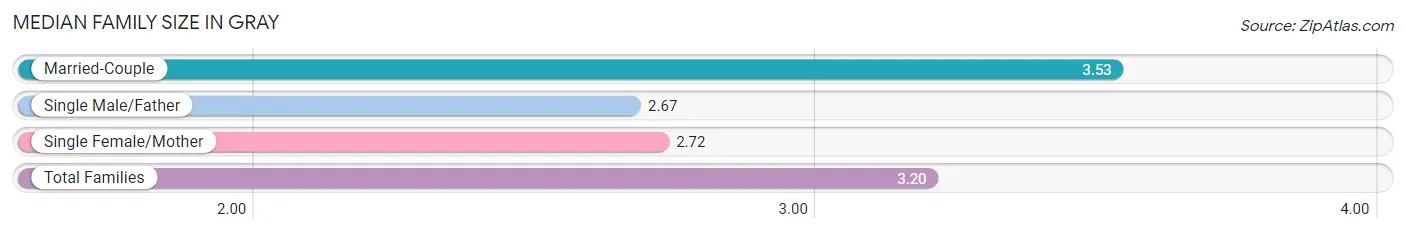
Median Family Size in Gray
The median family size in Gray is 3.20 persons per family, with married-couple families (947 | 60.2%) accounting for the largest median family size of 3.53 persons per family. On the other hand, single male/father families (122 | 7.7%) represent the smallest median family size with 2.67 persons per family.
| Family Type | # Families | Family Size |
| Married-Couple | 947 (60.2%) | 3.53 |
| Single Male/Father | 122 (7.7%) | 2.67 |
| Single Female/Mother | 505 (32.1%) | 2.72 |
| Total Families | 1,574 (100.0%) | 3.20 |
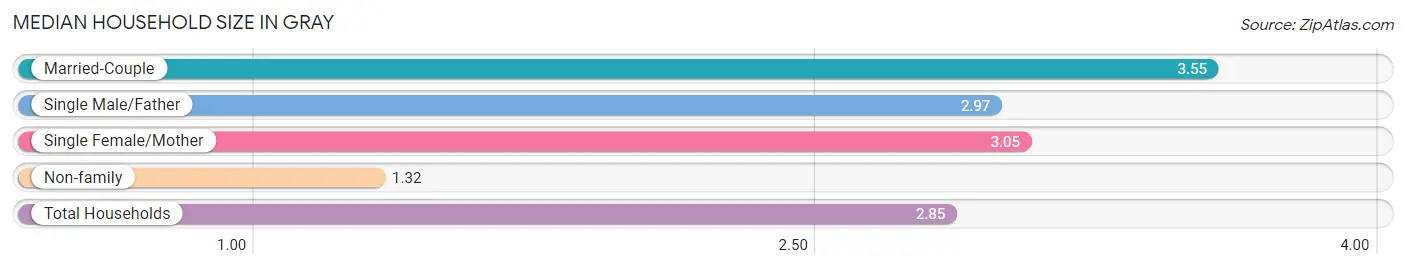
Median Household Size in Gray
The median household size in Gray is 2.85 persons per household, with married-couple households (947 | 45.4%) accounting for the largest median household size of 3.55 persons per household. non-family households (514 | 24.6%) represent the smallest median household size with 1.32 persons per household.
| Household Type | # Households | Household Size |
| Married-Couple | 947 (45.4%) | 3.55 |
| Single Male/Father | 122 (5.8%) | 2.97 |
| Single Female/Mother | 505 (24.2%) | 3.05 |
| Non-family | 514 (24.6%) | 1.32 |
| Total Households | 2,088 (100.0%) | 2.85 |
Household Size by Marriage Status in Gray
Out of a total of 2,088 households in Gray, 1,574 (75.4%) are family households, while 514 (24.6%) are nonfamily households. The most numerous type of family households are 2-person households, comprising 634, and the most common type of nonfamily households are 1-person households, comprising 388.
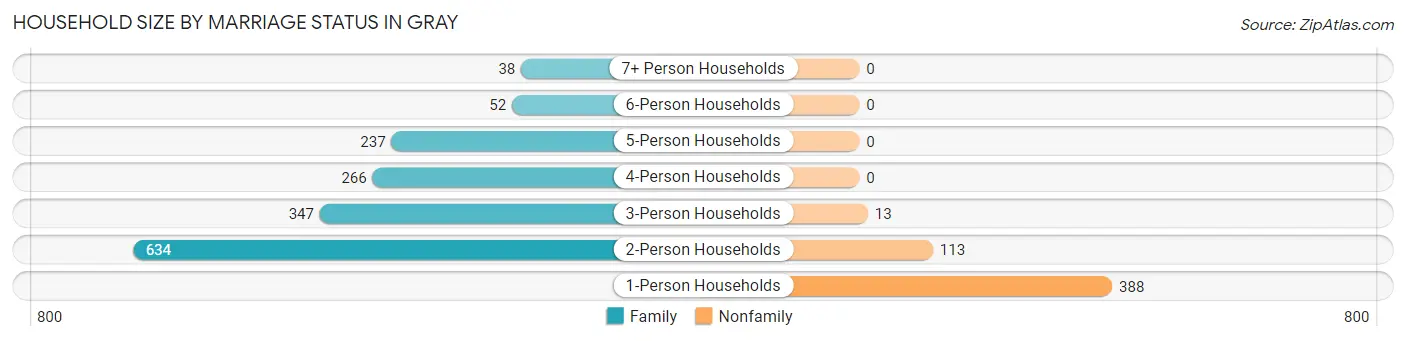
| Household Size | Family Households | Nonfamily Households |
| 1-Person Households | - | 388 (18.6%) |
| 2-Person Households | 634 (30.4%) | 113 (5.4%) |
| 3-Person Households | 347 (16.6%) | 13 (0.6%) |
| 4-Person Households | 266 (12.7%) | 0 (0.0%) |
| 5-Person Households | 237 (11.4%) | 0 (0.0%) |
| 6-Person Households | 52 (2.5%) | 0 (0.0%) |
| 7+ Person Households | 38 (1.8%) | 0 (0.0%) |
| Total | 1,574 (75.4%) | 514 (24.6%) |
Female Fertility in Gray
Fertility by Age in Gray
Average fertility rate in Gray is 57.0 births per 1,000 women. Women in the age bracket of 20 to 34 years have the highest fertility rate with 103.0 births per 1,000 women. Women in the age bracket of 20 to 34 years acount for 89.3% of all women with births.
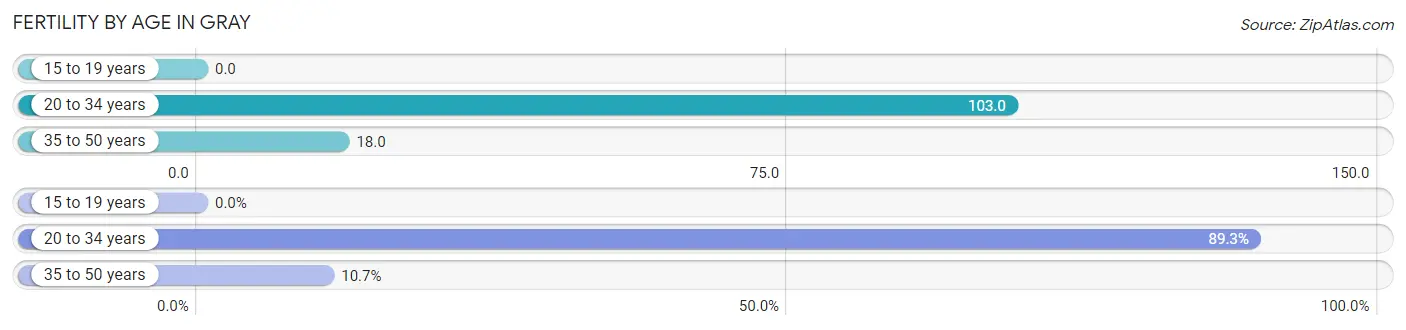
| Age Bracket | Women with Births | Births / 1,000 Women |
| 15 to 19 years | 0 (0.0%) | 0.0 |
| 20 to 34 years | 75 (89.3%) | 103.0 |
| 35 to 50 years | 9 (10.7%) | 18.0 |
| Total | 84 (100.0%) | 57.0 |
Fertility by Age by Marriage Status in Gray
89.3% of women with births (84) in Gray are married. The highest percentage of unmarried women with births falls into 20 to 34 years age bracket with 12.0% of them unmarried at the time of birth, while the lowest percentage of unmarried women with births belong to 35 to 50 years age bracket with 0.0% of them unmarried.
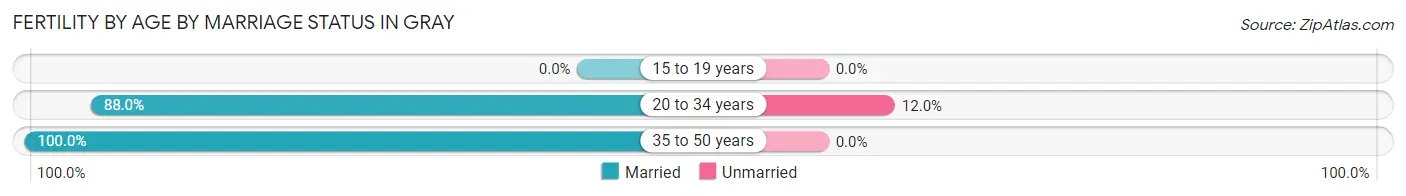
| Age Bracket | Married | Unmarried |
| 15 to 19 years | 0 (0.0%) | 0 (0.0%) |
| 20 to 34 years | 66 (88.0%) | 9 (12.0%) |
| 35 to 50 years | 9 (100.0%) | 0 (0.0%) |
| Total | 75 (89.3%) | 9 (10.7%) |
Fertility by Education in Gray
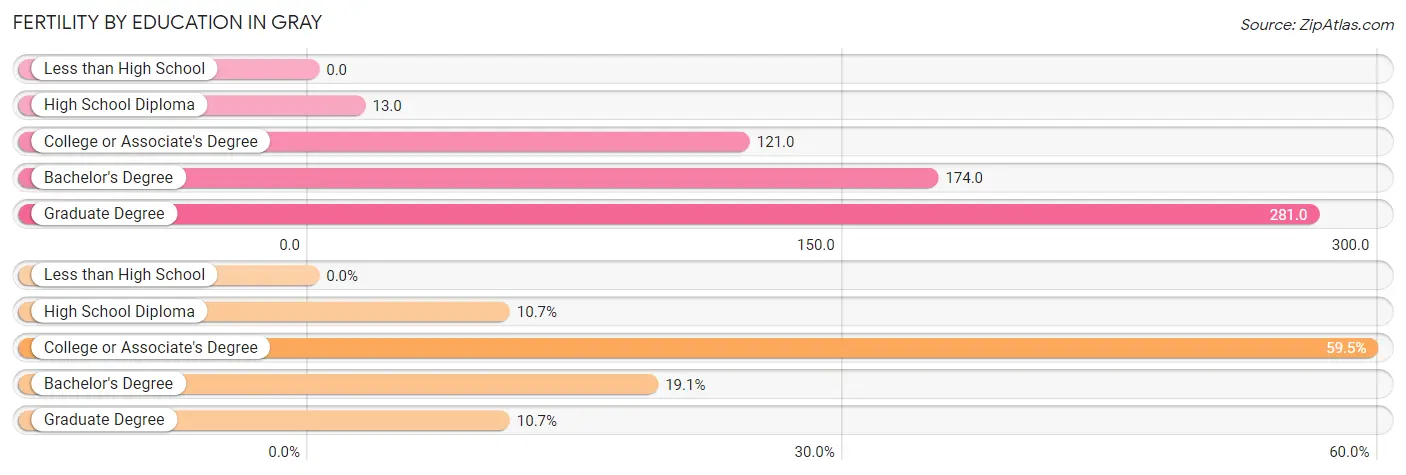
| Educational Attainment | Women with Births | Births / 1,000 Women |
| Less than High School | 0 (0.0%) | 0.0 |
| High School Diploma | 9 (10.7%) | 13.0 |
| College or Associate's Degree | 50 (59.5%) | 121.0 |
| Bachelor's Degree | 16 (19.1%) | 174.0 |
| Graduate Degree | 9 (10.7%) | 281.0 |
| Total | 84 (100.0%) | 57.0 |
Fertility by Education by Marriage Status in Gray
10.7% of women with births in Gray are unmarried. Women with the educational attainment of college or associate's degree are most likely to be married with 100.0% of them married at childbirth, while women with the educational attainment of high school diploma are least likely to be married with 100.0% of them unmarried at childbirth.
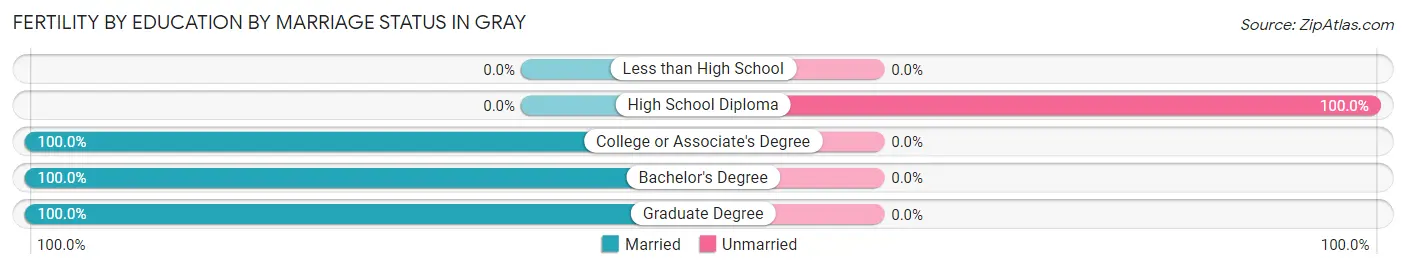
| Educational Attainment | Married | Unmarried |
| Less than High School | 0 (0.0%) | 0 (0.0%) |
| High School Diploma | 0 (0.0%) | 9 (100.0%) |
| College or Associate's Degree | 50 (100.0%) | 0 (0.0%) |
| Bachelor's Degree | 16 (100.0%) | 0 (0.0%) |
| Graduate Degree | 9 (100.0%) | 0 (0.0%) |
| Total | 75 (89.3%) | 9 (10.7%) |
Employment Characteristics in Gray
Employment by Class of Employer in Gray
Among the 2,501 employed individuals in Gray, private company employees (1,959 | 78.3%), not-for-profit organizations (148 | 5.9%), and self-employed (incorporated) (107 | 4.3%) make up the most common classes of employment.
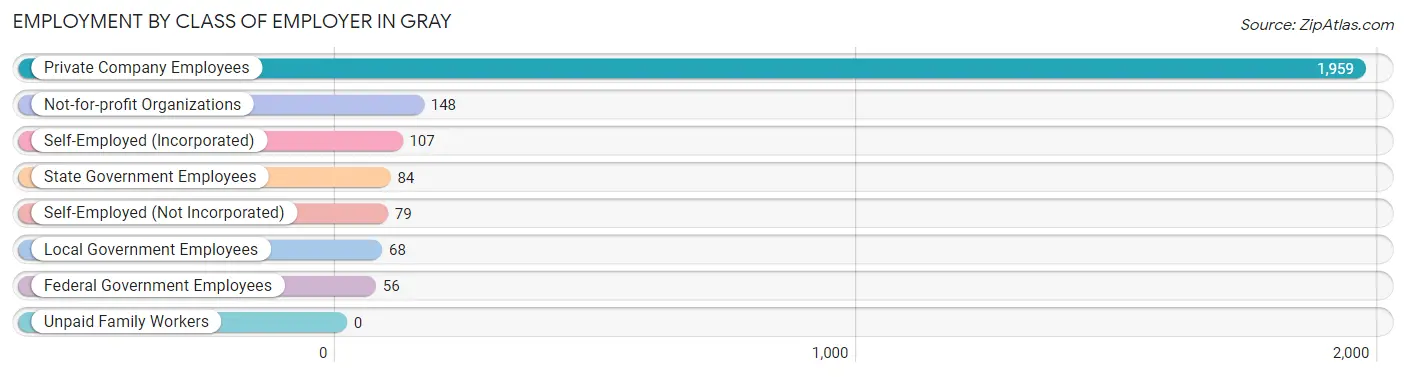
| Employer Class | # Employees | % Employees |
| Private Company Employees | 1,959 | 78.3% |
| Self-Employed (Incorporated) | 107 | 4.3% |
| Self-Employed (Not Incorporated) | 79 | 3.2% |
| Not-for-profit Organizations | 148 | 5.9% |
| Local Government Employees | 68 | 2.7% |
| State Government Employees | 84 | 3.4% |
| Federal Government Employees | 56 | 2.2% |
| Unpaid Family Workers | 0 | 0.0% |
| Total | 2,501 | 100.0% |
Employment Status by Age in Gray
According to the labor force statistics for Gray, out of the total population over 16 years of age (4,341), 62.4% or 2,709 individuals are in the labor force, with 6.5% or 176 of them unemployed. The age group with the highest labor force participation rate is 30 to 34 years, with 86.2% or 368 individuals in the labor force. Within the labor force, the 16 to 19 years age range has the highest percentage of unemployed individuals, with 14.7% or 15 of them being unemployed.
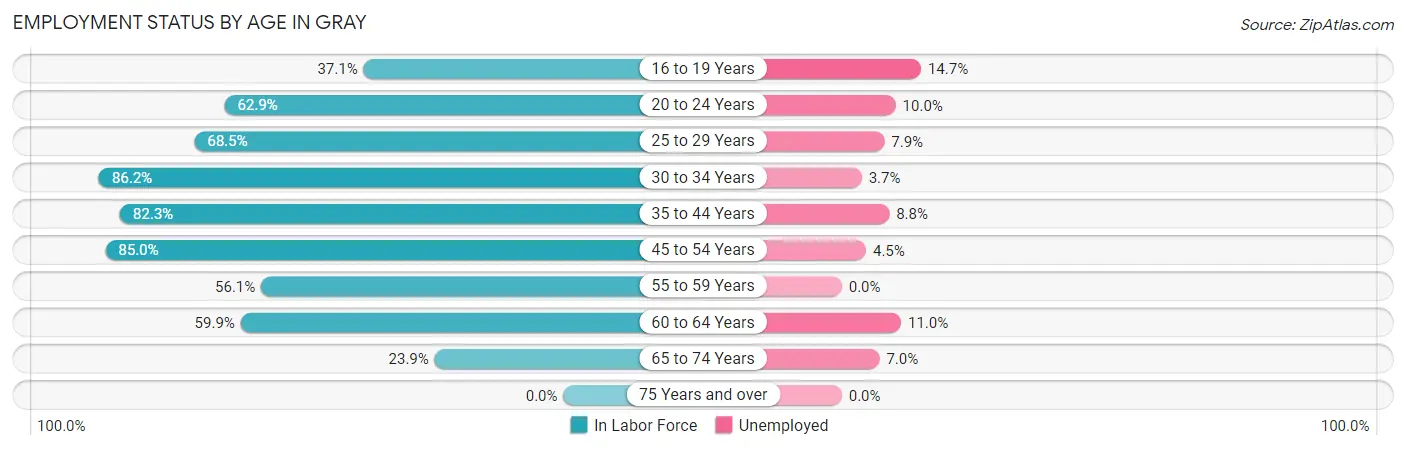
| Age Bracket | In Labor Force | Unemployed |
| 16 to 19 Years | 102 (37.1%) | 15 (14.7%) |
| 20 to 24 Years | 270 (62.9%) | 27 (10.0%) |
| 25 to 29 Years | 418 (68.5%) | 33 (7.9%) |
| 30 to 34 Years | 368 (86.2%) | 14 (3.7%) |
| 35 to 44 Years | 387 (82.3%) | 34 (8.8%) |
| 45 to 54 Years | 661 (85.0%) | 30 (4.5%) |
| 55 to 59 Years | 248 (56.1%) | 0 (0.0%) |
| 60 to 64 Years | 154 (59.9%) | 17 (11.0%) |
| 65 to 74 Years | 100 (23.9%) | 7 (7.0%) |
| 75 Years and over | 0 (0.0%) | 0 (0.0%) |
| Total | 2,709 (62.4%) | 176 (6.5%) |
Employment Status by Educational Attainment in Gray
According to labor force statistics for Gray, 74.9% of individuals (2,235) out of the total population between 25 and 64 years of age (2,984) are in the labor force, with 5.7% or 127 of them being unemployed. The group with the highest labor force participation rate are those with the educational attainment of bachelor's degree or higher, with 97.2% or 380 individuals in the labor force. Within the labor force, individuals with less than high school education have the highest percentage of unemployment, with 15.4% or 50 of them being unemployed.
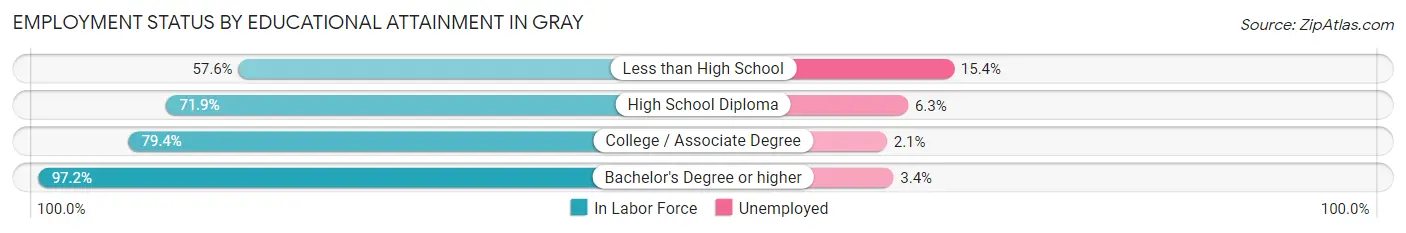
| Educational Attainment | In Labor Force | Unemployed |
| Less than High School | 325 (57.6%) | 87 (15.4%) |
| High School Diploma | 768 (71.9%) | 67 (6.3%) |
| College / Associate Degree | 763 (79.4%) | 20 (2.1%) |
| Bachelor's Degree or higher | 380 (97.2%) | 13 (3.4%) |
| Total | 2,235 (74.9%) | 170 (5.7%) |
Employment Occupations by Sex in Gray
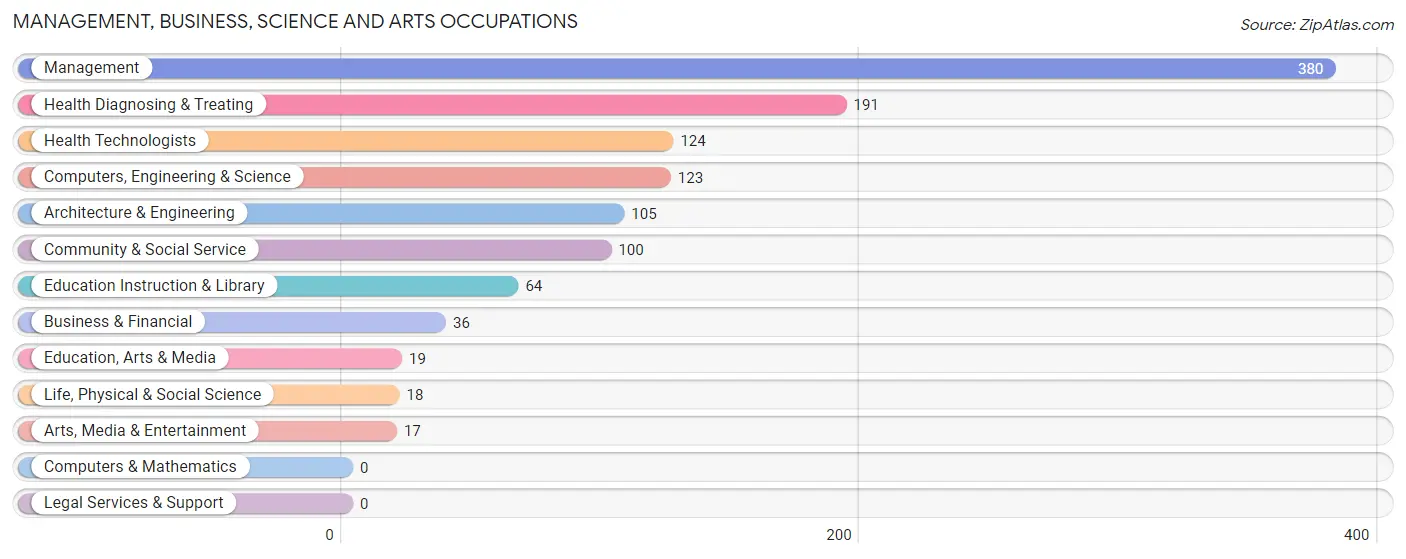
Management, Business, Science and Arts Occupations
The most common Management, Business, Science and Arts occupations in Gray are Management (380 | 15.1%), Health Diagnosing & Treating (191 | 7.6%), Health Technologists (124 | 4.9%), Computers, Engineering & Science (123 | 4.9%), and Architecture & Engineering (105 | 4.2%).
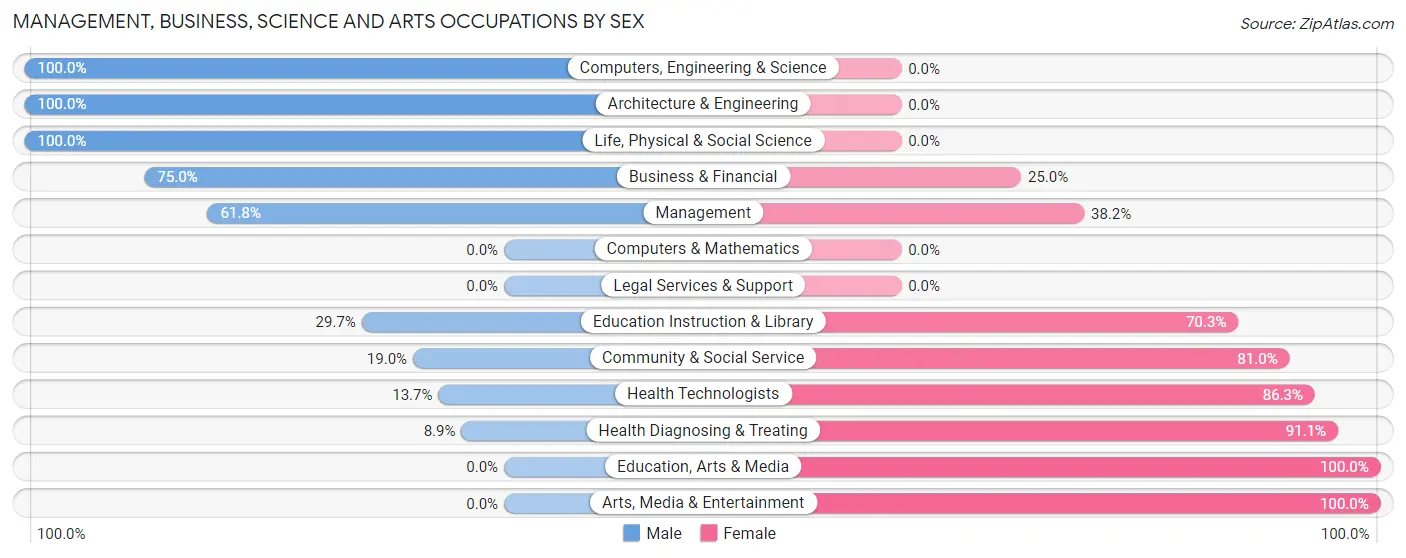
Management, Business, Science and Arts Occupations by Sex
Within the Management, Business, Science and Arts occupations in Gray, the most male-oriented occupations are Computers, Engineering & Science (100.0%), Architecture & Engineering (100.0%), and Life, Physical & Social Science (100.0%), while the most female-oriented occupations are Education, Arts & Media (100.0%), Arts, Media & Entertainment (100.0%), and Health Diagnosing & Treating (91.1%).
| Occupation | Male | Female |
| Management | 235 (61.8%) | 145 (38.2%) |
| Business & Financial | 27 (75.0%) | 9 (25.0%) |
| Computers, Engineering & Science | 123 (100.0%) | 0 (0.0%) |
| Computers & Mathematics | 0 (0.0%) | 0 (0.0%) |
| Architecture & Engineering | 105 (100.0%) | 0 (0.0%) |
| Life, Physical & Social Science | 18 (100.0%) | 0 (0.0%) |
| Community & Social Service | 19 (19.0%) | 81 (81.0%) |
| Education, Arts & Media | 0 (0.0%) | 19 (100.0%) |
| Legal Services & Support | 0 (0.0%) | 0 (0.0%) |
| Education Instruction & Library | 19 (29.7%) | 45 (70.3%) |
| Arts, Media & Entertainment | 0 (0.0%) | 17 (100.0%) |
| Health Diagnosing & Treating | 17 (8.9%) | 174 (91.1%) |
| Health Technologists | 17 (13.7%) | 107 (86.3%) |
| Total (Category) | 421 (50.7%) | 409 (49.3%) |
| Total (Overall) | 1,207 (48.0%) | 1,308 (52.0%) |
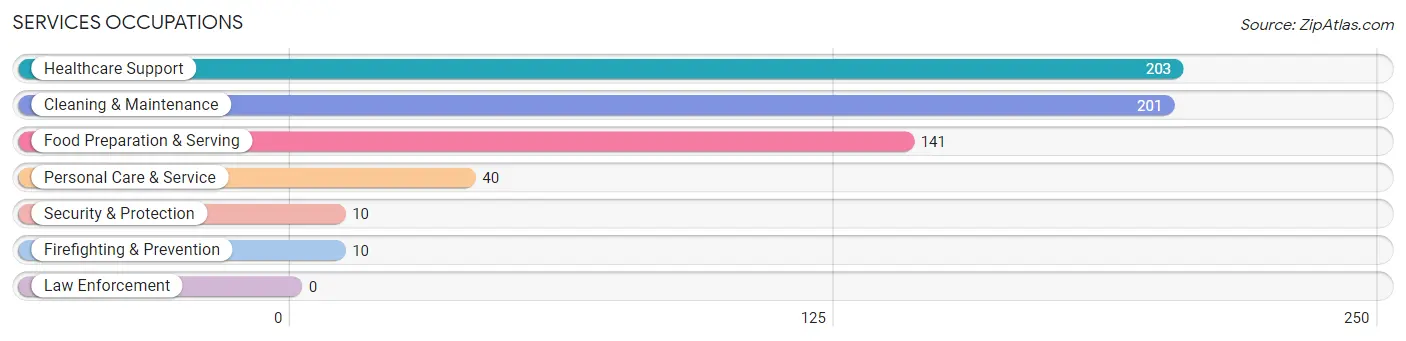
Services Occupations
The most common Services occupations in Gray are Healthcare Support (203 | 8.1%), Cleaning & Maintenance (201 | 8.0%), Food Preparation & Serving (141 | 5.6%), Personal Care & Service (40 | 1.6%), and Security & Protection (10 | 0.4%).
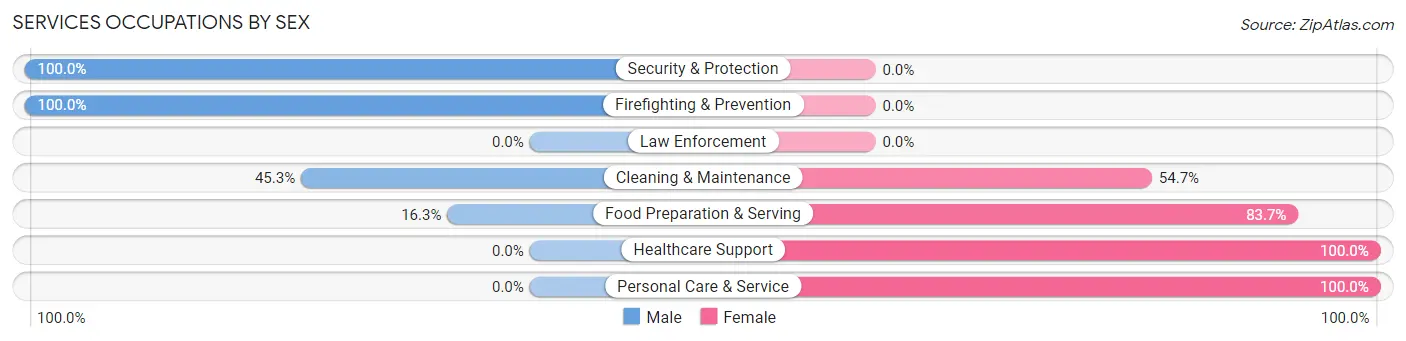
Services Occupations by Sex
Within the Services occupations in Gray, the most male-oriented occupations are Security & Protection (100.0%), Firefighting & Prevention (100.0%), and Cleaning & Maintenance (45.3%), while the most female-oriented occupations are Healthcare Support (100.0%), Personal Care & Service (100.0%), and Food Preparation & Serving (83.7%).
| Occupation | Male | Female |
| Healthcare Support | 0 (0.0%) | 203 (100.0%) |
| Security & Protection | 10 (100.0%) | 0 (0.0%) |
| Firefighting & Prevention | 10 (100.0%) | 0 (0.0%) |
| Law Enforcement | 0 (0.0%) | 0 (0.0%) |
| Food Preparation & Serving | 23 (16.3%) | 118 (83.7%) |
| Cleaning & Maintenance | 91 (45.3%) | 110 (54.7%) |
| Personal Care & Service | 0 (0.0%) | 40 (100.0%) |
| Total (Category) | 124 (20.8%) | 471 (79.2%) |
| Total (Overall) | 1,207 (48.0%) | 1,308 (52.0%) |
Sales and Office Occupations
The most common Sales and Office occupations in Gray are Sales & Related (358 | 14.2%), and Office & Administration (106 | 4.2%).

Sales and Office Occupations by Sex
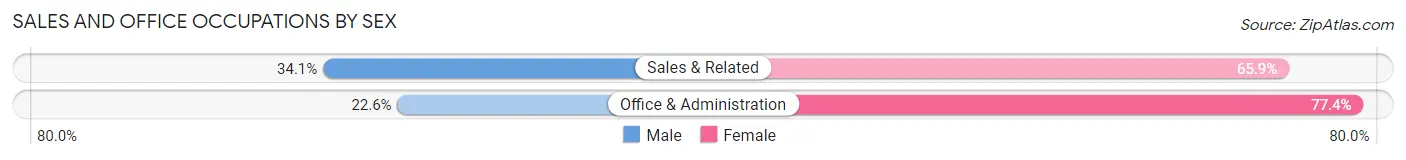
| Occupation | Male | Female |
| Sales & Related | 122 (34.1%) | 236 (65.9%) |
| Office & Administration | 24 (22.6%) | 82 (77.4%) |
| Total (Category) | 146 (31.5%) | 318 (68.5%) |
| Total (Overall) | 1,207 (48.0%) | 1,308 (52.0%) |
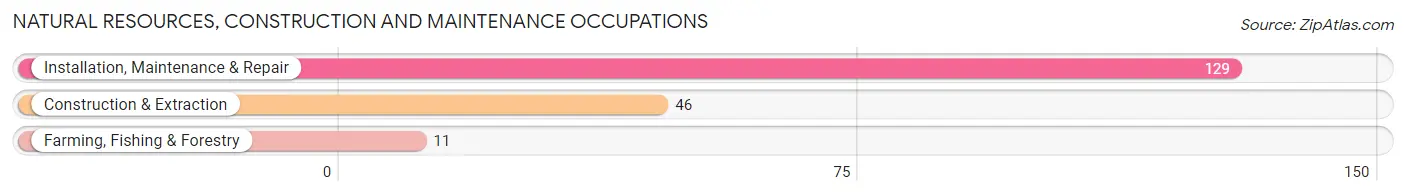
Natural Resources, Construction and Maintenance Occupations
The most common Natural Resources, Construction and Maintenance occupations in Gray are Installation, Maintenance & Repair (129 | 5.1%), Construction & Extraction (46 | 1.8%), and Farming, Fishing & Forestry (11 | 0.4%).
Natural Resources, Construction and Maintenance Occupations by Sex
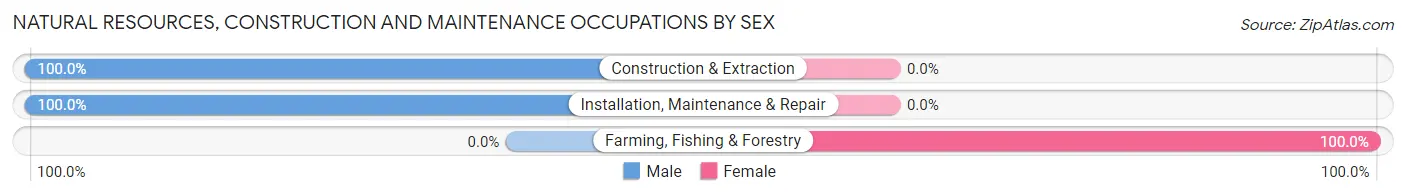
| Occupation | Male | Female |
| Farming, Fishing & Forestry | 0 (0.0%) | 11 (100.0%) |
| Construction & Extraction | 46 (100.0%) | 0 (0.0%) |
| Installation, Maintenance & Repair | 129 (100.0%) | 0 (0.0%) |
| Total (Category) | 175 (94.1%) | 11 (5.9%) |
| Total (Overall) | 1,207 (48.0%) | 1,308 (52.0%) |
Production, Transportation and Moving Occupations
The most common Production, Transportation and Moving occupations in Gray are Material Moving (205 | 8.2%), Transportation (129 | 5.1%), and Production (106 | 4.2%).
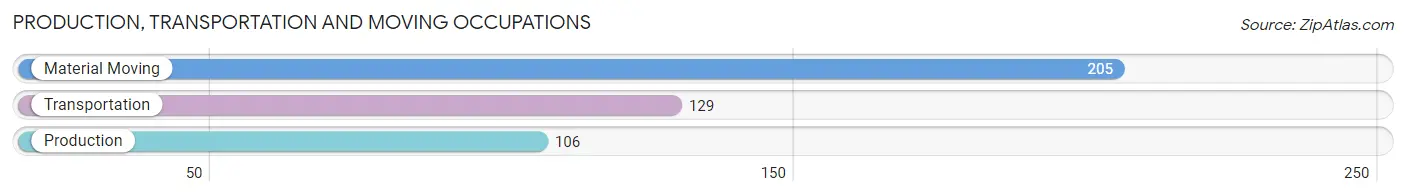
Production, Transportation and Moving Occupations by Sex
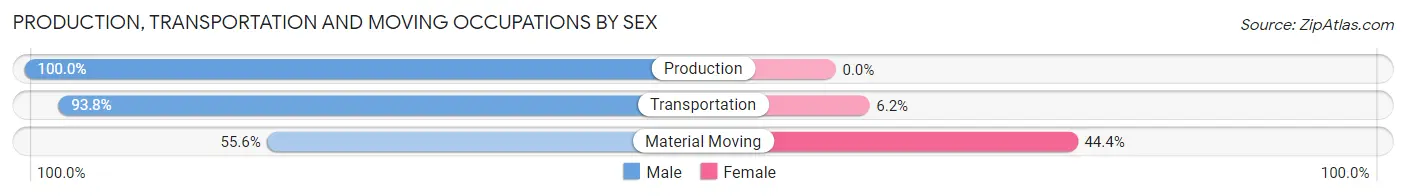
| Occupation | Male | Female |
| Production | 106 (100.0%) | 0 (0.0%) |
| Transportation | 121 (93.8%) | 8 (6.2%) |
| Material Moving | 114 (55.6%) | 91 (44.4%) |
| Total (Category) | 341 (77.5%) | 99 (22.5%) |
| Total (Overall) | 1,207 (48.0%) | 1,308 (52.0%) |
Employment Industries by Sex in Gray
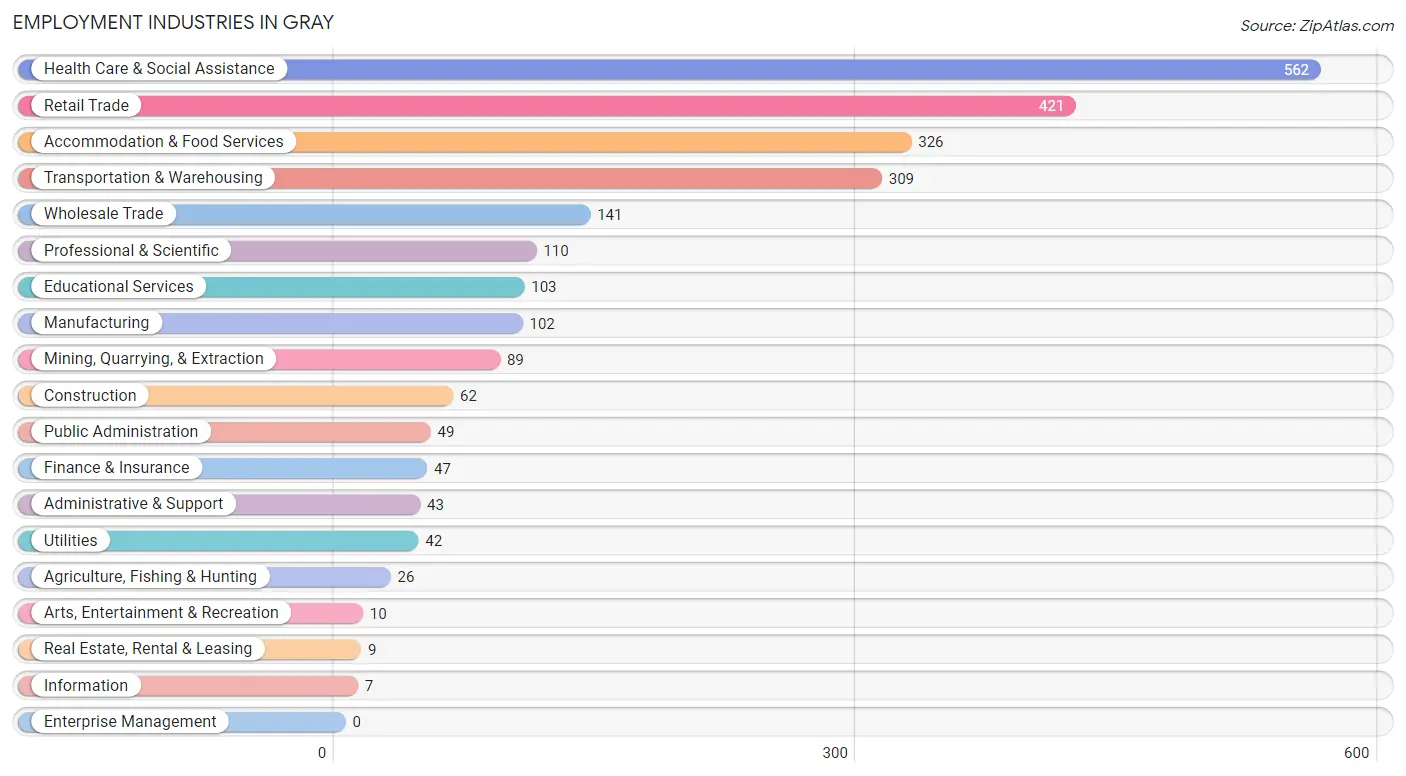
Employment Industries in Gray
The major employment industries in Gray include Health Care & Social Assistance (562 | 22.4%), Retail Trade (421 | 16.7%), Accommodation & Food Services (326 | 13.0%), Transportation & Warehousing (309 | 12.3%), and Wholesale Trade (141 | 5.6%).
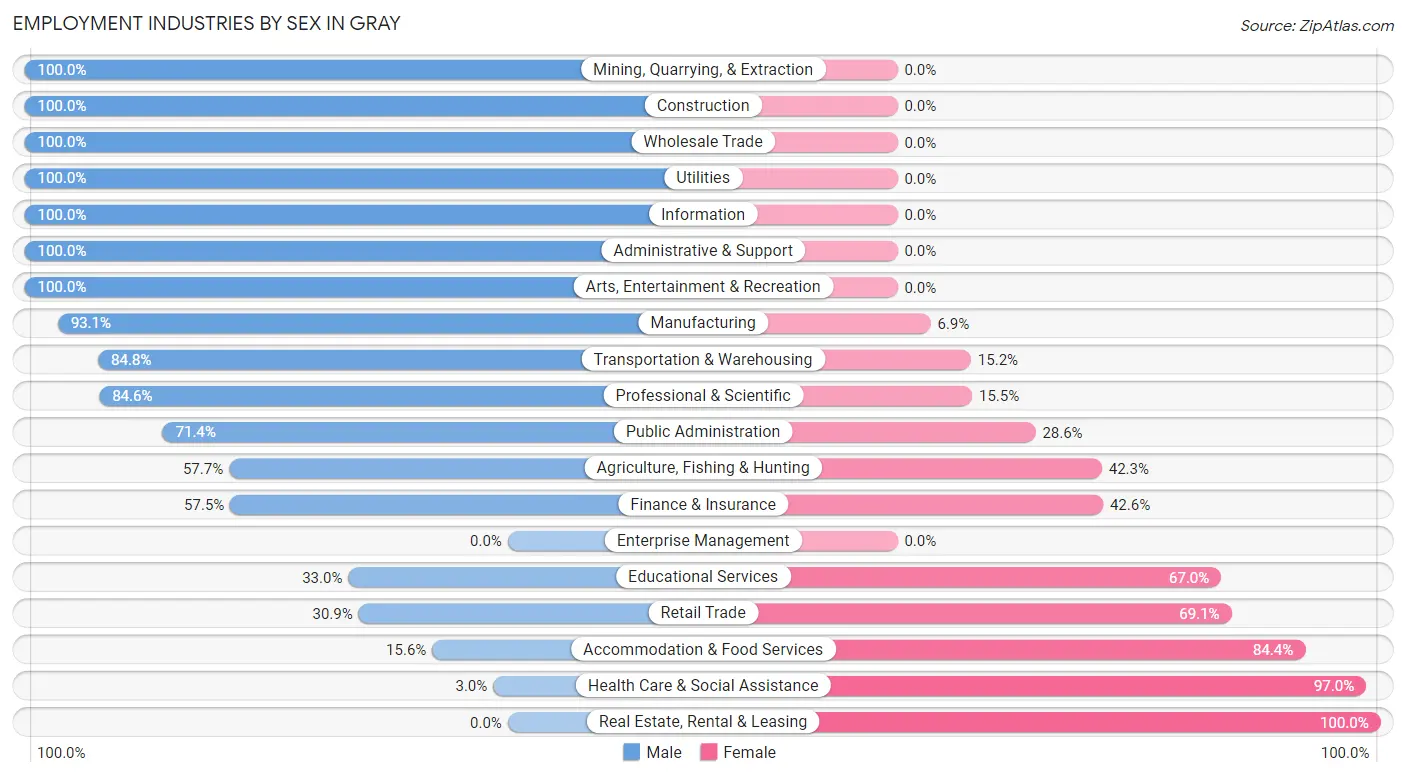
Employment Industries by Sex in Gray
The Gray industries that see more men than women are Mining, Quarrying, & Extraction (100.0%), Construction (100.0%), and Wholesale Trade (100.0%), whereas the industries that tend to have a higher number of women are Real Estate, Rental & Leasing (100.0%), Health Care & Social Assistance (97.0%), and Accommodation & Food Services (84.4%).
| Industry | Male | Female |
| Agriculture, Fishing & Hunting | 15 (57.7%) | 11 (42.3%) |
| Mining, Quarrying, & Extraction | 89 (100.0%) | 0 (0.0%) |
| Construction | 62 (100.0%) | 0 (0.0%) |
| Manufacturing | 95 (93.1%) | 7 (6.9%) |
| Wholesale Trade | 141 (100.0%) | 0 (0.0%) |
| Retail Trade | 130 (30.9%) | 291 (69.1%) |
| Transportation & Warehousing | 262 (84.8%) | 47 (15.2%) |
| Utilities | 42 (100.0%) | 0 (0.0%) |
| Information | 7 (100.0%) | 0 (0.0%) |
| Finance & Insurance | 27 (57.5%) | 20 (42.5%) |
| Real Estate, Rental & Leasing | 0 (0.0%) | 9 (100.0%) |
| Professional & Scientific | 93 (84.6%) | 17 (15.4%) |
| Enterprise Management | 0 (0.0%) | 0 (0.0%) |
| Administrative & Support | 43 (100.0%) | 0 (0.0%) |
| Educational Services | 34 (33.0%) | 69 (67.0%) |
| Health Care & Social Assistance | 17 (3.0%) | 545 (97.0%) |
| Arts, Entertainment & Recreation | 10 (100.0%) | 0 (0.0%) |
| Accommodation & Food Services | 51 (15.6%) | 275 (84.4%) |
| Public Administration | 35 (71.4%) | 14 (28.6%) |
| Total | 1,207 (48.0%) | 1,308 (52.0%) |
Education in Gray
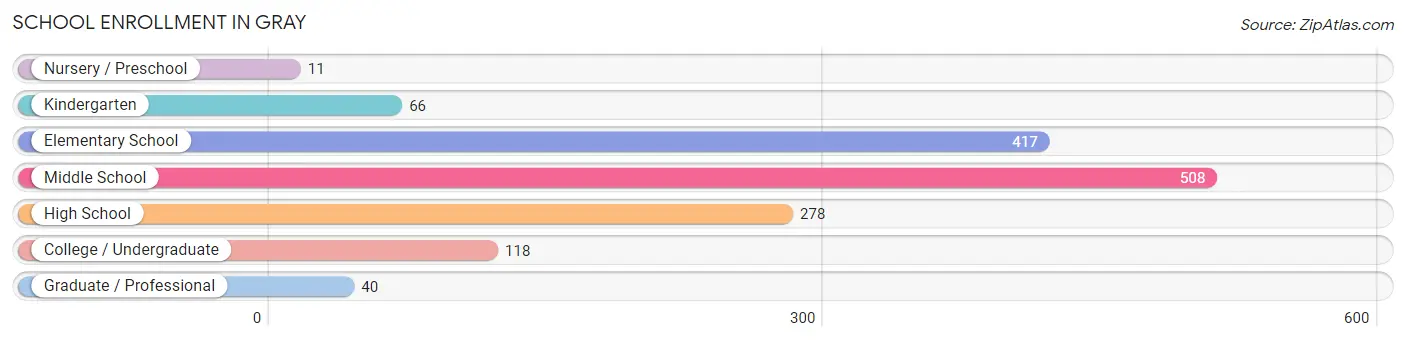
School Enrollment in Gray
The most common levels of schooling among the 1,438 students in Gray are middle school (508 | 35.3%), elementary school (417 | 29.0%), and high school (278 | 19.3%).
| School Level | # Students | % Students |
| Nursery / Preschool | 11 | 0.8% |
| Kindergarten | 66 | 4.6% |
| Elementary School | 417 | 29.0% |
| Middle School | 508 | 35.3% |
| High School | 278 | 19.3% |
| College / Undergraduate | 118 | 8.2% |
| Graduate / Professional | 40 | 2.8% |
| Total | 1,438 | 100.0% |
School Enrollment by Age by Funding Source in Gray
Out of a total of 1,438 students who are enrolled in schools in Gray, 262 (18.2%) attend a private institution, while the remaining 1,176 (81.8%) are enrolled in public schools. The age group of 25 to 34 year olds has the highest likelihood of being enrolled in private schools, with 29 (36.7% in the age bracket) enrolled. Conversely, the age group of 3 to 4 year olds has the lowest likelihood of being enrolled in a private school, with 38 (100.0% in the age bracket) attending a public institution.
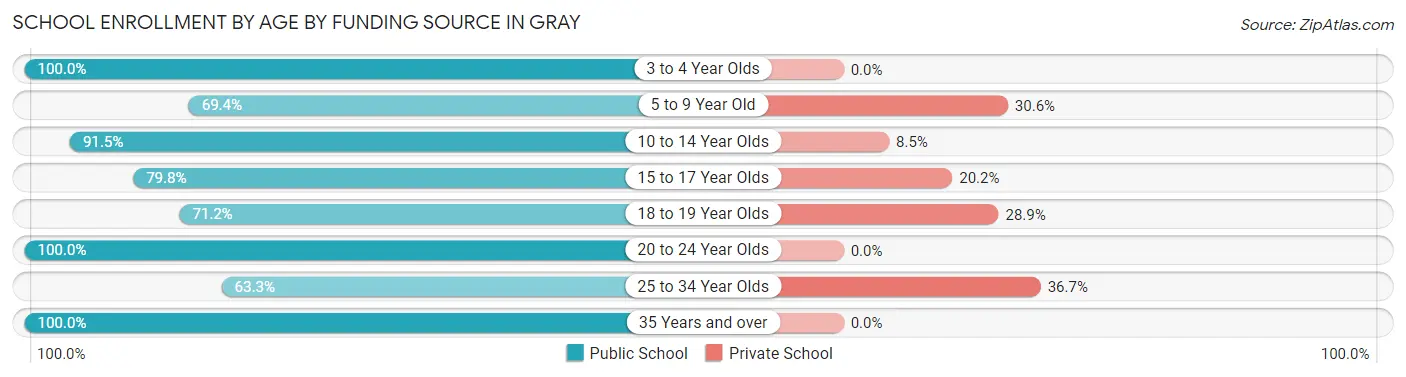
| Age Bracket | Public School | Private School |
| 3 to 4 Year Olds | 38 (100.0%) | 0 (0.0%) |
| 5 to 9 Year Old | 236 (69.4%) | 104 (30.6%) |
| 10 to 14 Year Olds | 498 (91.5%) | 46 (8.5%) |
| 15 to 17 Year Olds | 264 (79.8%) | 67 (20.2%) |
| 18 to 19 Year Olds | 37 (71.2%) | 15 (28.8%) |
| 20 to 24 Year Olds | 26 (100.0%) | 0 (0.0%) |
| 25 to 34 Year Olds | 50 (63.3%) | 29 (36.7%) |
| 35 Years and over | 28 (100.0%) | 0 (0.0%) |
| Total | 1,176 (81.8%) | 262 (18.2%) |
Educational Attainment by Field of Study in Gray
Business (90 | 19.7%), bio, nature & agricultural (89 | 19.4%), education (88 | 19.2%), science & technology (46 | 10.0%), and literature & languages (31 | 6.8%) are the most common fields of study among 458 individuals in Gray who have obtained a bachelor's degree or higher.
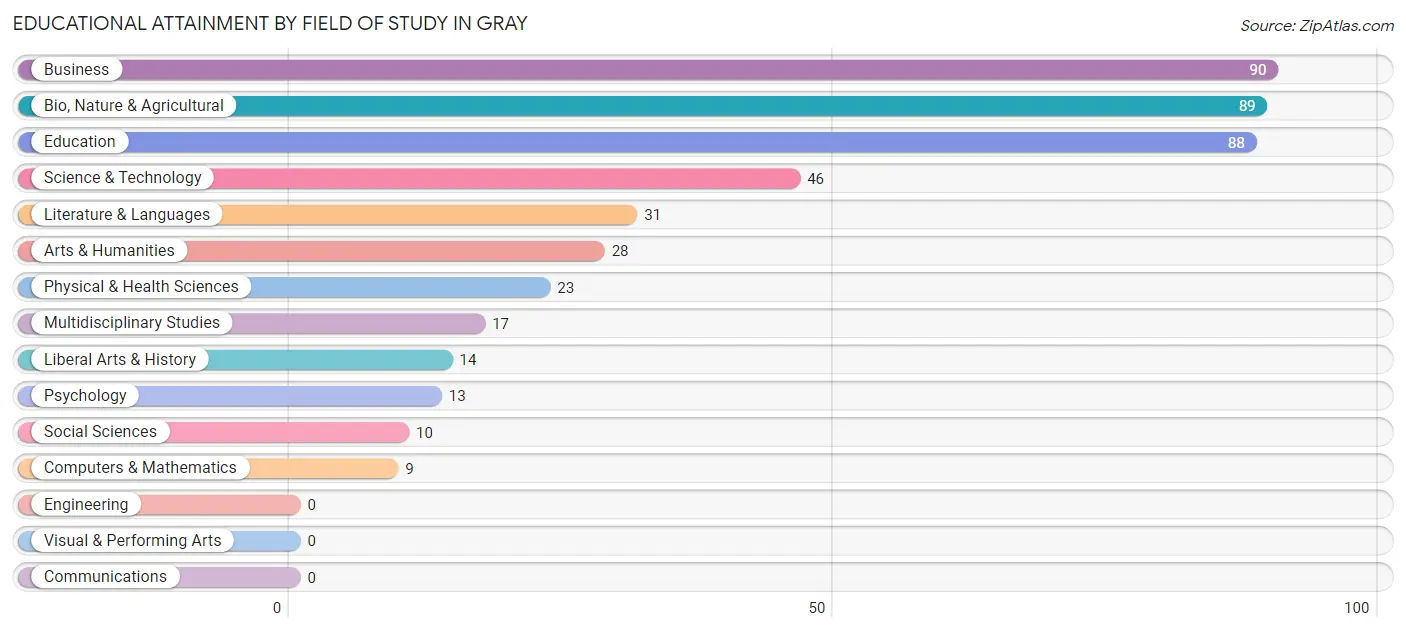
| Field of Study | # Graduates | % Graduates |
| Computers & Mathematics | 9 | 2.0% |
| Bio, Nature & Agricultural | 89 | 19.4% |
| Physical & Health Sciences | 23 | 5.0% |
| Psychology | 13 | 2.8% |
| Social Sciences | 10 | 2.2% |
| Engineering | 0 | 0.0% |
| Multidisciplinary Studies | 17 | 3.7% |
| Science & Technology | 46 | 10.0% |
| Business | 90 | 19.7% |
| Education | 88 | 19.2% |
| Literature & Languages | 31 | 6.8% |
| Liberal Arts & History | 14 | 3.1% |
| Visual & Performing Arts | 0 | 0.0% |
| Communications | 0 | 0.0% |
| Arts & Humanities | 28 | 6.1% |
| Total | 458 | 100.0% |
Transportation & Commute in Gray
Vehicle Availability by Sex in Gray
The most prevalent vehicle ownership categories in Gray are males with 2 vehicles (696, accounting for 56.9%) and females with 2 vehicles (642, making up 54.5%).
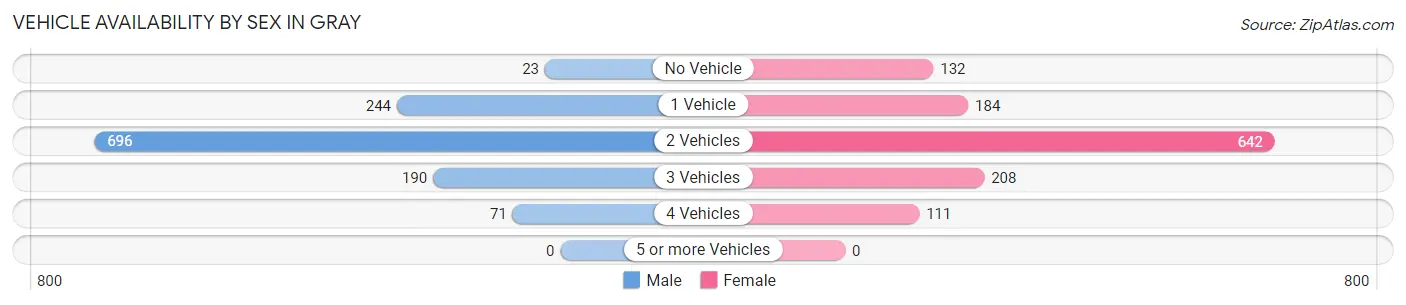
| Vehicles Available | Male | Female |
| No Vehicle | 23 (1.9%) | 132 (10.3%) |
| 1 Vehicle | 244 (19.9%) | 184 (14.4%) |
| 2 Vehicles | 696 (56.9%) | 642 (50.3%) |
| 3 Vehicles | 190 (15.5%) | 208 (16.3%) |
| 4 Vehicles | 71 (5.8%) | 111 (8.7%) |
| 5 or more Vehicles | 0 (0.0%) | 0 (0.0%) |
| Total | 1,224 (100.0%) | 1,277 (100.0%) |
Commute Time in Gray
The most frequently occuring commute durations in Gray are 20 to 24 minutes (770 commuters, 32.1%), 15 to 19 minutes (577 commuters, 24.0%), and 5 to 9 minutes (248 commuters, 10.3%).
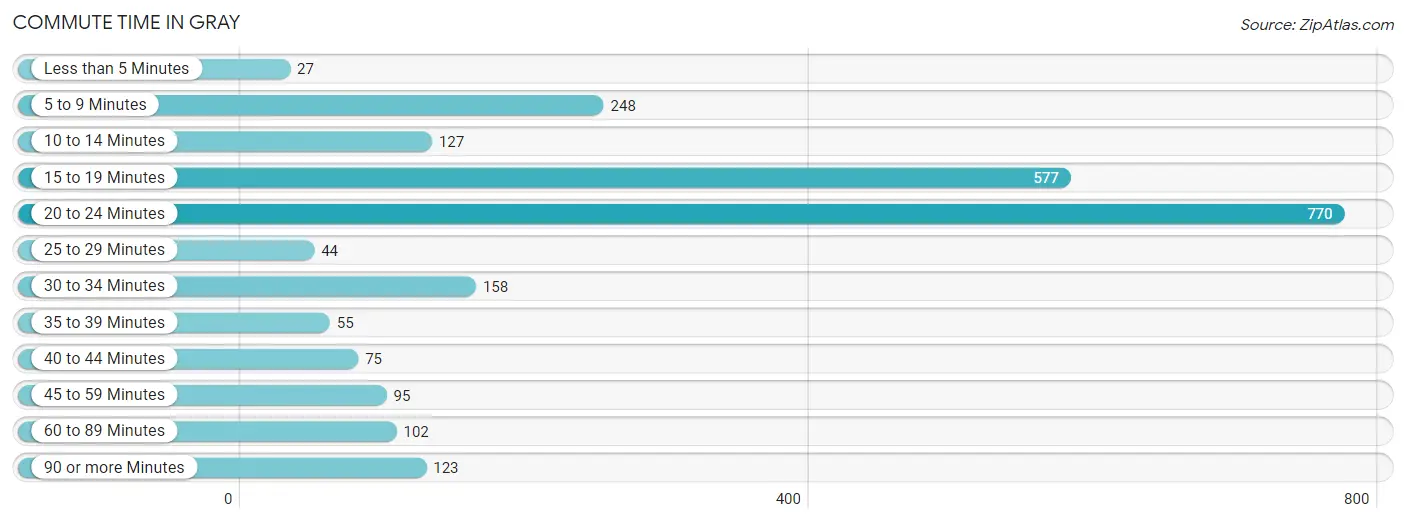
| Commute Time | # Commuters | % Commuters |
| Less than 5 Minutes | 27 | 1.1% |
| 5 to 9 Minutes | 248 | 10.3% |
| 10 to 14 Minutes | 127 | 5.3% |
| 15 to 19 Minutes | 577 | 24.0% |
| 20 to 24 Minutes | 770 | 32.1% |
| 25 to 29 Minutes | 44 | 1.8% |
| 30 to 34 Minutes | 158 | 6.6% |
| 35 to 39 Minutes | 55 | 2.3% |
| 40 to 44 Minutes | 75 | 3.1% |
| 45 to 59 Minutes | 95 | 4.0% |
| 60 to 89 Minutes | 102 | 4.3% |
| 90 or more Minutes | 123 | 5.1% |
Commute Time by Sex in Gray
The most common commute times in Gray are 15 to 19 minutes (329 commuters, 27.7%) for males and 20 to 24 minutes (481 commuters, 39.6%) for females.
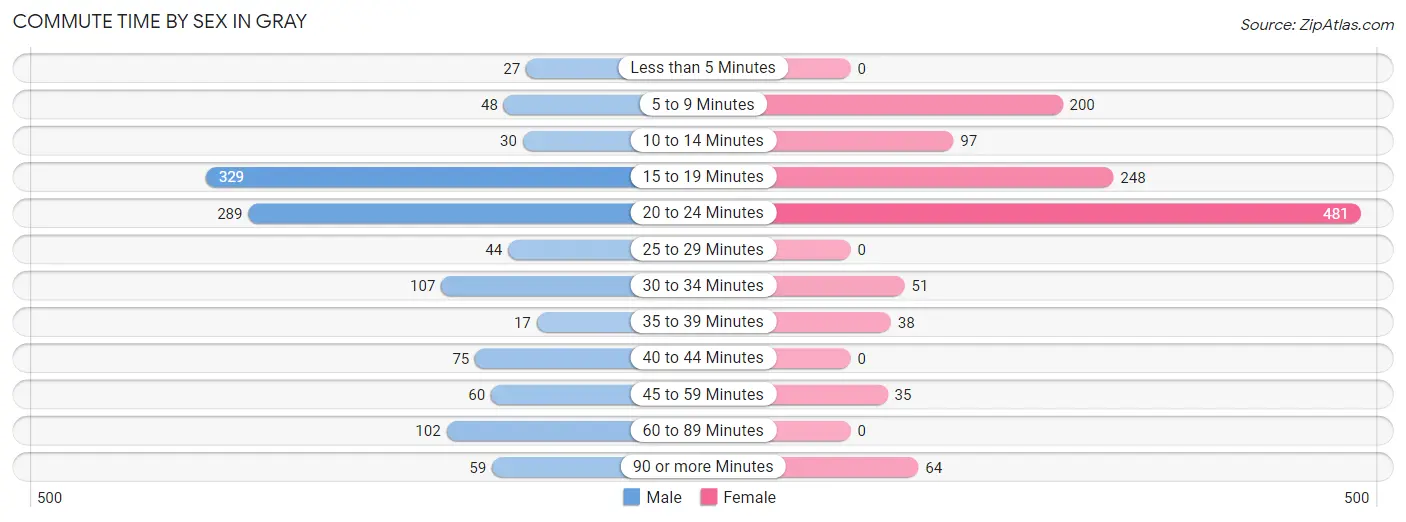
| Commute Time | Male | Female |
| Less than 5 Minutes | 27 (2.3%) | 0 (0.0%) |
| 5 to 9 Minutes | 48 (4.0%) | 200 (16.5%) |
| 10 to 14 Minutes | 30 (2.5%) | 97 (8.0%) |
| 15 to 19 Minutes | 329 (27.7%) | 248 (20.4%) |
| 20 to 24 Minutes | 289 (24.3%) | 481 (39.6%) |
| 25 to 29 Minutes | 44 (3.7%) | 0 (0.0%) |
| 30 to 34 Minutes | 107 (9.0%) | 51 (4.2%) |
| 35 to 39 Minutes | 17 (1.4%) | 38 (3.1%) |
| 40 to 44 Minutes | 75 (6.3%) | 0 (0.0%) |
| 45 to 59 Minutes | 60 (5.1%) | 35 (2.9%) |
| 60 to 89 Minutes | 102 (8.6%) | 0 (0.0%) |
| 90 or more Minutes | 59 (5.0%) | 64 (5.3%) |
Time of Departure to Work by Sex in Gray
The most frequent times of departure to work in Gray are 7:00 AM to 7:29 AM (216, 18.2%) for males and 7:00 AM to 7:29 AM (258, 21.2%) for females.
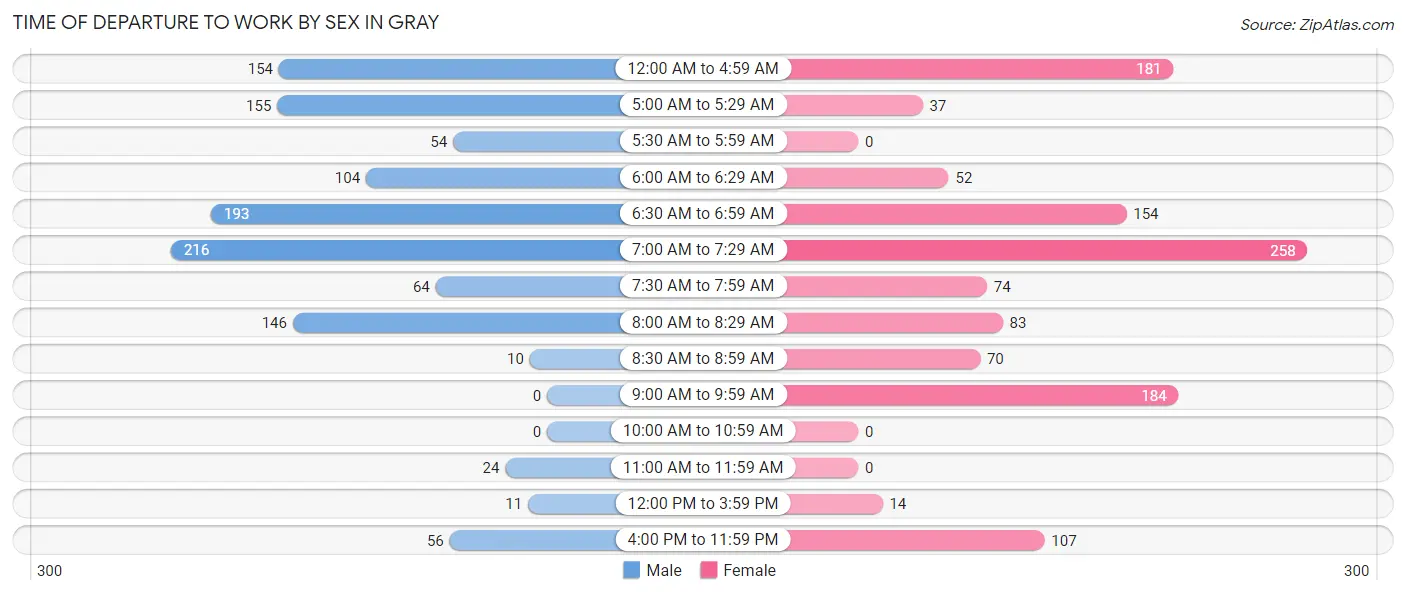
| Time of Departure | Male | Female |
| 12:00 AM to 4:59 AM | 154 (13.0%) | 181 (14.9%) |
| 5:00 AM to 5:29 AM | 155 (13.1%) | 37 (3.0%) |
| 5:30 AM to 5:59 AM | 54 (4.5%) | 0 (0.0%) |
| 6:00 AM to 6:29 AM | 104 (8.8%) | 52 (4.3%) |
| 6:30 AM to 6:59 AM | 193 (16.3%) | 154 (12.7%) |
| 7:00 AM to 7:29 AM | 216 (18.2%) | 258 (21.2%) |
| 7:30 AM to 7:59 AM | 64 (5.4%) | 74 (6.1%) |
| 8:00 AM to 8:29 AM | 146 (12.3%) | 83 (6.8%) |
| 8:30 AM to 8:59 AM | 10 (0.8%) | 70 (5.8%) |
| 9:00 AM to 9:59 AM | 0 (0.0%) | 184 (15.2%) |
| 10:00 AM to 10:59 AM | 0 (0.0%) | 0 (0.0%) |
| 11:00 AM to 11:59 AM | 24 (2.0%) | 0 (0.0%) |
| 12:00 PM to 3:59 PM | 11 (0.9%) | 14 (1.1%) |
| 4:00 PM to 11:59 PM | 56 (4.7%) | 107 (8.8%) |
| Total | 1,187 (100.0%) | 1,214 (100.0%) |
Housing Occupancy in Gray
Occupancy by Ownership in Gray
Of the total 2,088 dwellings in Gray, owner-occupied units account for 1,672 (80.1%), while renter-occupied units make up 416 (19.9%).
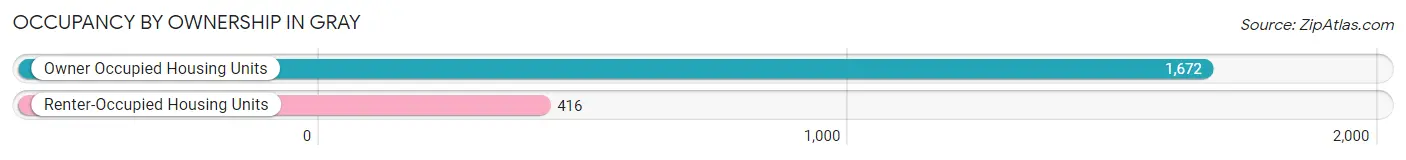
| Occupancy | # Housing Units | % Housing Units |
| Owner Occupied Housing Units | 1,672 | 80.1% |
| Renter-Occupied Housing Units | 416 | 19.9% |
| Total Occupied Housing Units | 2,088 | 100.0% |
Occupancy by Household Size in Gray
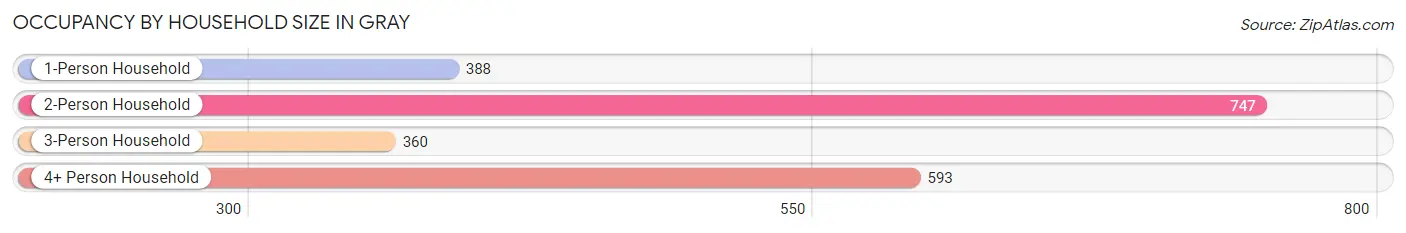
| Household Size | # Housing Units | % Housing Units |
| 1-Person Household | 388 | 18.6% |
| 2-Person Household | 747 | 35.8% |
| 3-Person Household | 360 | 17.2% |
| 4+ Person Household | 593 | 28.4% |
| Total Housing Units | 2,088 | 100.0% |
Occupancy by Ownership by Household Size in Gray
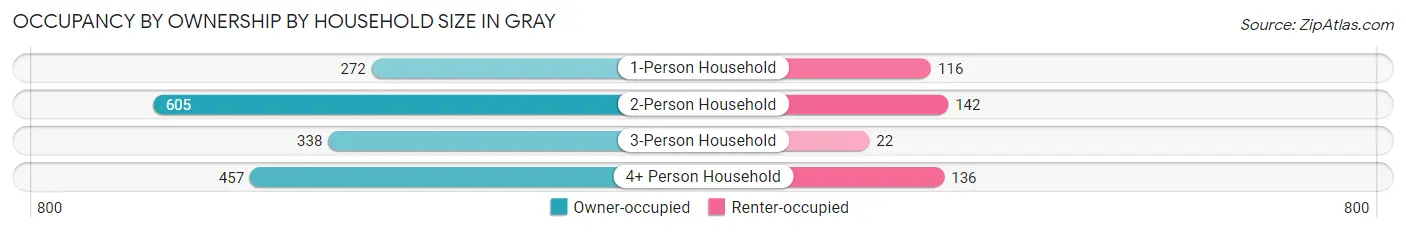
| Household Size | Owner-occupied | Renter-occupied |
| 1-Person Household | 272 (70.1%) | 116 (29.9%) |
| 2-Person Household | 605 (81.0%) | 142 (19.0%) |
| 3-Person Household | 338 (93.9%) | 22 (6.1%) |
| 4+ Person Household | 457 (77.1%) | 136 (22.9%) |
| Total Housing Units | 1,672 (80.1%) | 416 (19.9%) |
Occupancy by Educational Attainment in Gray
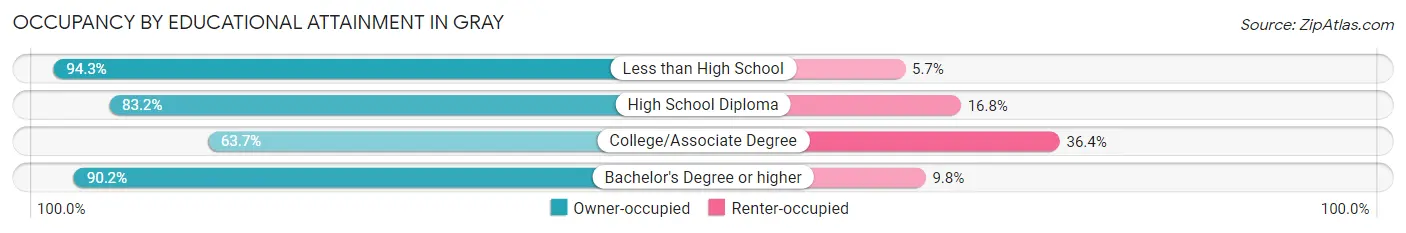
| Household Size | Owner-occupied | Renter-occupied |
| Less than High School | 313 (94.3%) | 19 (5.7%) |
| High School Diploma | 725 (83.2%) | 146 (16.8%) |
| College/Associate Degree | 394 (63.6%) | 225 (36.3%) |
| Bachelor's Degree or higher | 240 (90.2%) | 26 (9.8%) |
Occupancy by Age of Householder in Gray
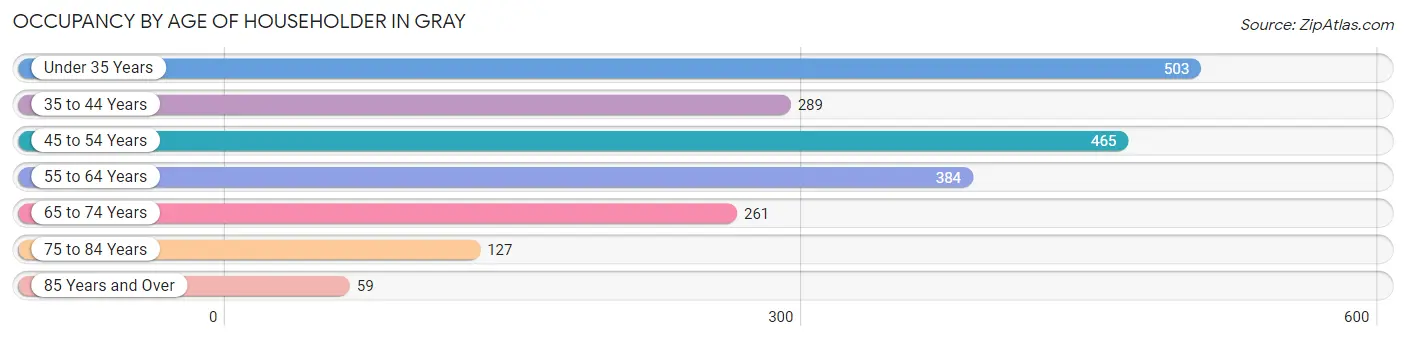
| Age Bracket | # Households | % Households |
| Under 35 Years | 503 | 24.1% |
| 35 to 44 Years | 289 | 13.8% |
| 45 to 54 Years | 465 | 22.3% |
| 55 to 64 Years | 384 | 18.4% |
| 65 to 74 Years | 261 | 12.5% |
| 75 to 84 Years | 127 | 6.1% |
| 85 Years and Over | 59 | 2.8% |
| Total | 2,088 | 100.0% |
Housing Finances in Gray
Median Income by Occupancy in Gray
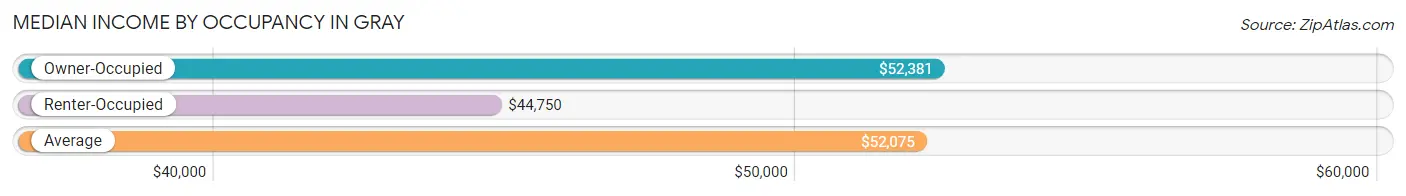
| Occupancy Type | # Households | Median Income |
| Owner-Occupied | 1,672 (80.1%) | $52,381 |
| Renter-Occupied | 416 (19.9%) | $44,750 |
| Average | 2,088 (100.0%) | $52,075 |
Occupancy by Householder Income Bracket in Gray
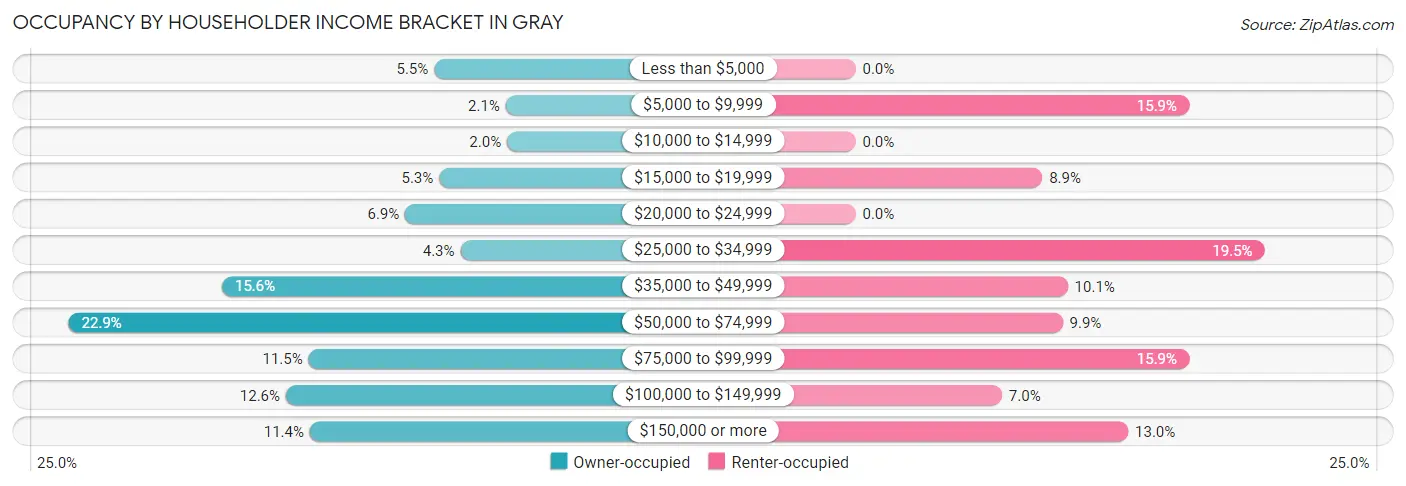
| Income Bracket | Owner-occupied | Renter-occupied |
| Less than $5,000 | 92 (5.5%) | 0 (0.0%) |
| $5,000 to $9,999 | 35 (2.1%) | 66 (15.9%) |
| $10,000 to $14,999 | 34 (2.0%) | 0 (0.0%) |
| $15,000 to $19,999 | 88 (5.3%) | 37 (8.9%) |
| $20,000 to $24,999 | 115 (6.9%) | 0 (0.0%) |
| $25,000 to $34,999 | 71 (4.3%) | 81 (19.5%) |
| $35,000 to $49,999 | 261 (15.6%) | 42 (10.1%) |
| $50,000 to $74,999 | 383 (22.9%) | 41 (9.9%) |
| $75,000 to $99,999 | 192 (11.5%) | 66 (15.9%) |
| $100,000 to $149,999 | 210 (12.6%) | 29 (7.0%) |
| $150,000 or more | 191 (11.4%) | 54 (13.0%) |
| Total | 1,672 (100.0%) | 416 (100.0%) |
Monthly Housing Cost Tiers in Gray
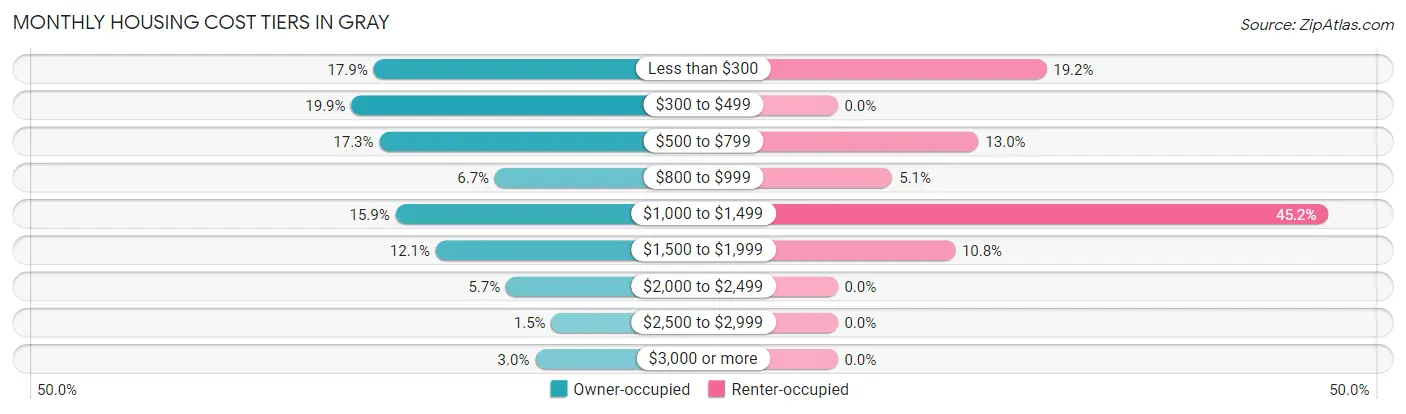
| Monthly Cost | Owner-occupied | Renter-occupied |
| Less than $300 | 299 (17.9%) | 80 (19.2%) |
| $300 to $499 | 333 (19.9%) | 0 (0.0%) |
| $500 to $799 | 290 (17.3%) | 54 (13.0%) |
| $800 to $999 | 112 (6.7%) | 21 (5.1%) |
| $1,000 to $1,499 | 265 (15.9%) | 188 (45.2%) |
| $1,500 to $1,999 | 203 (12.1%) | 45 (10.8%) |
| $2,000 to $2,499 | 95 (5.7%) | 0 (0.0%) |
| $2,500 to $2,999 | 25 (1.5%) | 0 (0.0%) |
| $3,000 or more | 50 (3.0%) | 0 (0.0%) |
| Total | 1,672 (100.0%) | 416 (100.0%) |
Physical Housing Characteristics in Gray
Housing Structures in Gray
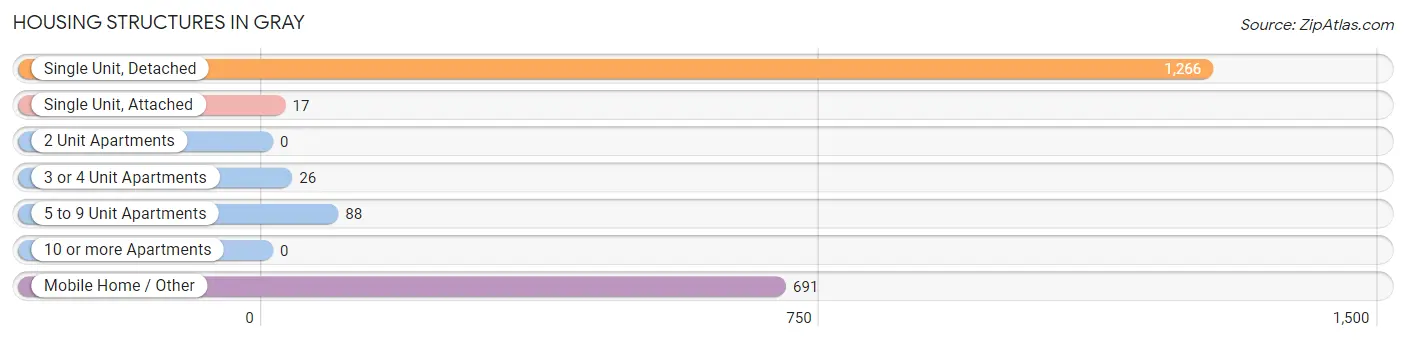
| Structure Type | # Housing Units | % Housing Units |
| Single Unit, Detached | 1,266 | 60.6% |
| Single Unit, Attached | 17 | 0.8% |
| 2 Unit Apartments | 0 | 0.0% |
| 3 or 4 Unit Apartments | 26 | 1.3% |
| 5 to 9 Unit Apartments | 88 | 4.2% |
| 10 or more Apartments | 0 | 0.0% |
| Mobile Home / Other | 691 | 33.1% |
| Total | 2,088 | 100.0% |
Housing Structures by Occupancy in Gray
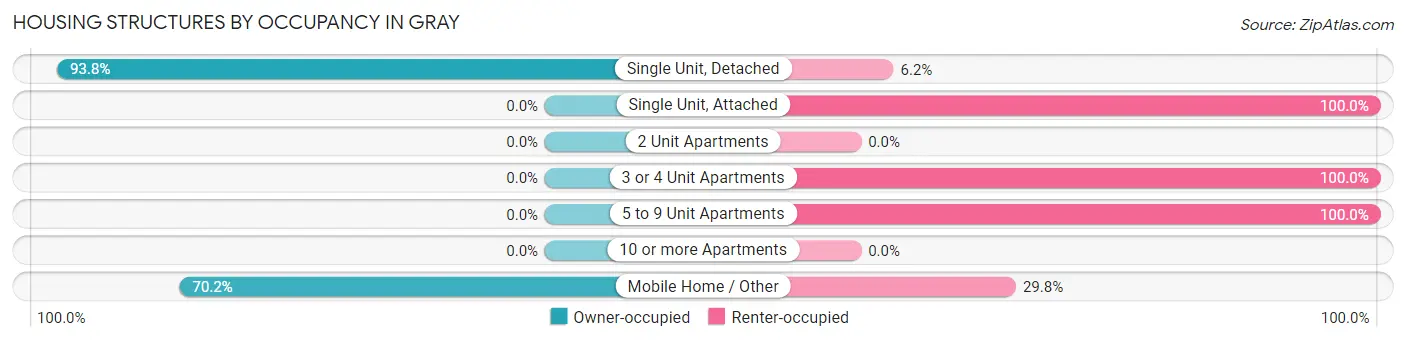
| Structure Type | Owner-occupied | Renter-occupied |
| Single Unit, Detached | 1,187 (93.8%) | 79 (6.2%) |
| Single Unit, Attached | 0 (0.0%) | 17 (100.0%) |
| 2 Unit Apartments | 0 (0.0%) | 0 (0.0%) |
| 3 or 4 Unit Apartments | 0 (0.0%) | 26 (100.0%) |
| 5 to 9 Unit Apartments | 0 (0.0%) | 88 (100.0%) |
| 10 or more Apartments | 0 (0.0%) | 0 (0.0%) |
| Mobile Home / Other | 485 (70.2%) | 206 (29.8%) |
| Total | 1,672 (80.1%) | 416 (19.9%) |
Housing Structures by Number of Rooms in Gray
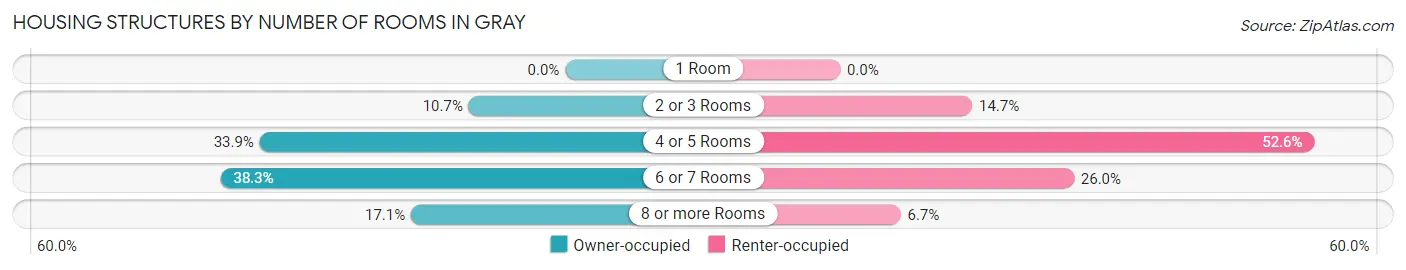
| Number of Rooms | Owner-occupied | Renter-occupied |
| 1 Room | 0 (0.0%) | 0 (0.0%) |
| 2 or 3 Rooms | 179 (10.7%) | 61 (14.7%) |
| 4 or 5 Rooms | 567 (33.9%) | 219 (52.6%) |
| 6 or 7 Rooms | 640 (38.3%) | 108 (26.0%) |
| 8 or more Rooms | 286 (17.1%) | 28 (6.7%) |
| Total | 1,672 (100.0%) | 416 (100.0%) |
Housing Structure by Heating Type in Gray
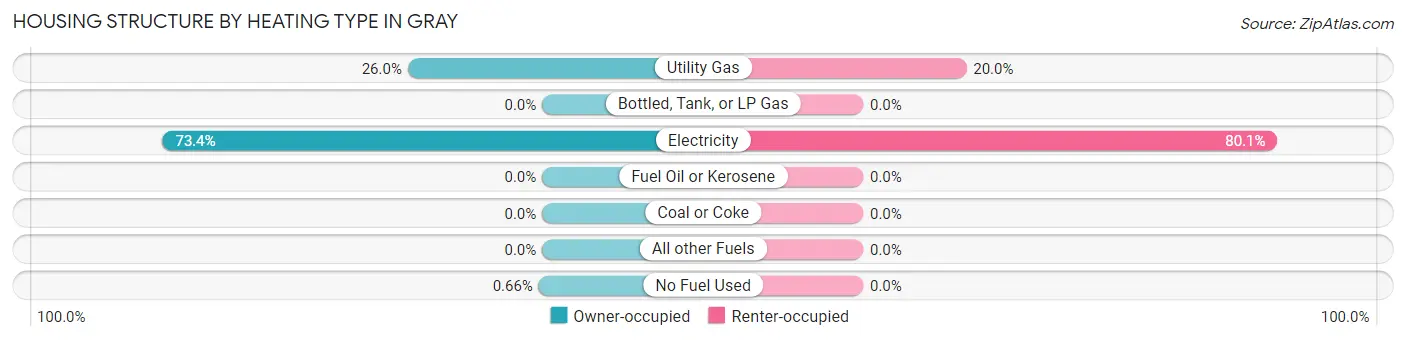
| Heating Type | Owner-occupied | Renter-occupied |
| Utility Gas | 434 (26.0%) | 83 (20.0%) |
| Bottled, Tank, or LP Gas | 0 (0.0%) | 0 (0.0%) |
| Electricity | 1,227 (73.4%) | 333 (80.0%) |
| Fuel Oil or Kerosene | 0 (0.0%) | 0 (0.0%) |
| Coal or Coke | 0 (0.0%) | 0 (0.0%) |
| All other Fuels | 0 (0.0%) | 0 (0.0%) |
| No Fuel Used | 11 (0.7%) | 0 (0.0%) |
| Total | 1,672 (100.0%) | 416 (100.0%) |
Household Vehicle Usage in Gray
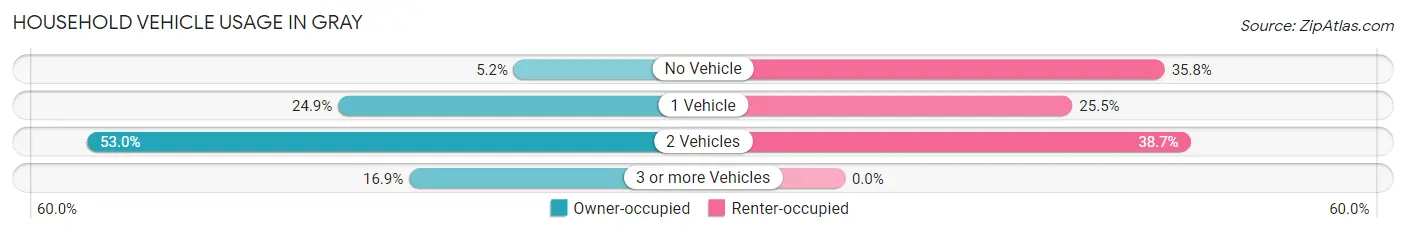
| Vehicles per Household | Owner-occupied | Renter-occupied |
| No Vehicle | 87 (5.2%) | 149 (35.8%) |
| 1 Vehicle | 416 (24.9%) | 106 (25.5%) |
| 2 Vehicles | 886 (53.0%) | 161 (38.7%) |
| 3 or more Vehicles | 283 (16.9%) | 0 (0.0%) |
| Total | 1,672 (100.0%) | 416 (100.0%) |
Real Estate & Mortgages in Gray
Real Estate and Mortgage Overview in Gray
| Characteristic | Without Mortgage | With Mortgage |
| Housing Units | 873 | 799 |
| Median Property Value | $94,700 | $148,700 |
| Median Household Income | $48,548 | $142 |
| Monthly Housing Costs | $386 | $50 |
| Real Estate Taxes | - | - |
Property Value by Mortgage Status in Gray
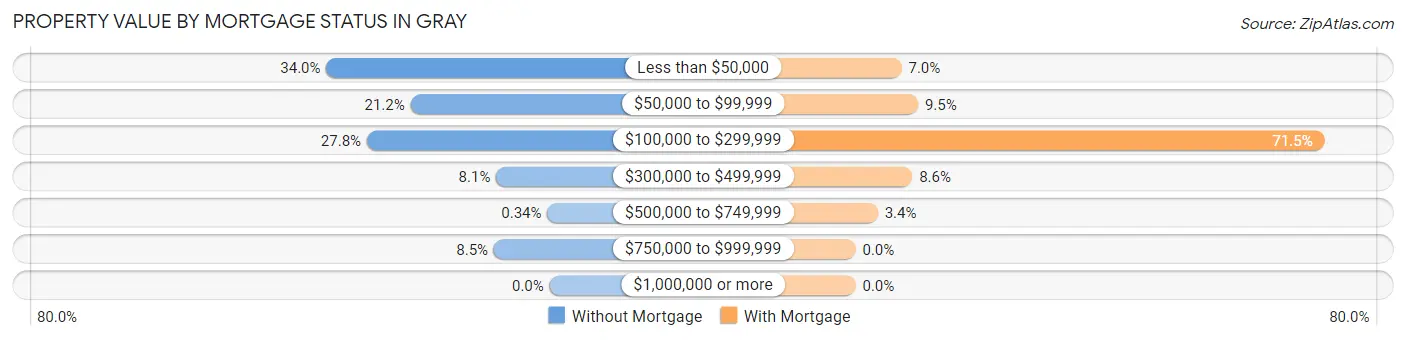
| Property Value | Without Mortgage | With Mortgage |
| Less than $50,000 | 297 (34.0%) | 56 (7.0%) |
| $50,000 to $99,999 | 185 (21.2%) | 76 (9.5%) |
| $100,000 to $299,999 | 243 (27.8%) | 571 (71.5%) |
| $300,000 to $499,999 | 71 (8.1%) | 69 (8.6%) |
| $500,000 to $749,999 | 3 (0.3%) | 27 (3.4%) |
| $750,000 to $999,999 | 74 (8.5%) | 0 (0.0%) |
| $1,000,000 or more | 0 (0.0%) | 0 (0.0%) |
| Total | 873 (100.0%) | 799 (100.0%) |
Household Income by Mortgage Status in Gray
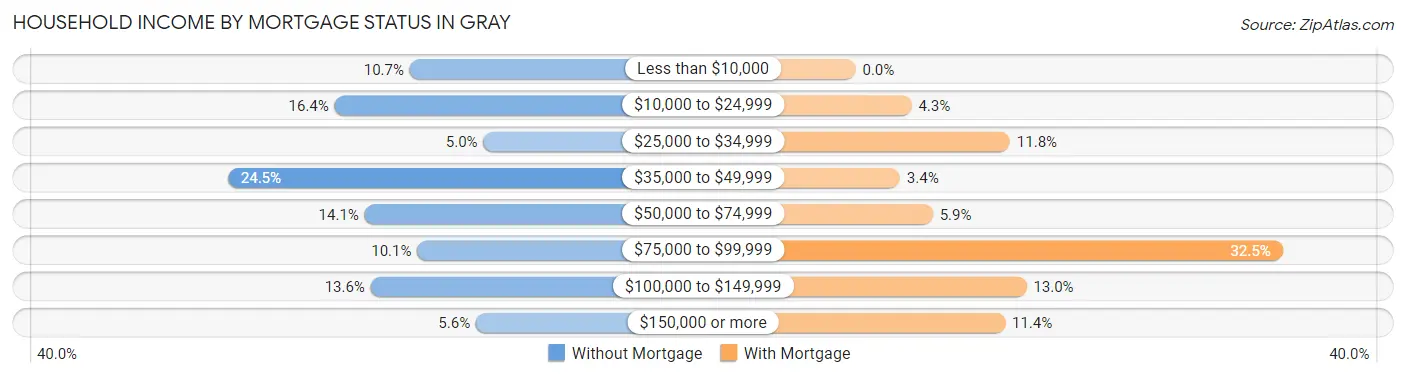
| Household Income | Without Mortgage | With Mortgage |
| Less than $10,000 | 93 (10.6%) | 0 (0.0%) |
| $10,000 to $24,999 | 143 (16.4%) | 34 (4.3%) |
| $25,000 to $34,999 | 44 (5.0%) | 94 (11.8%) |
| $35,000 to $49,999 | 214 (24.5%) | 27 (3.4%) |
| $50,000 to $74,999 | 123 (14.1%) | 47 (5.9%) |
| $75,000 to $99,999 | 88 (10.1%) | 260 (32.5%) |
| $100,000 to $149,999 | 119 (13.6%) | 104 (13.0%) |
| $150,000 or more | 49 (5.6%) | 91 (11.4%) |
| Total | 873 (100.0%) | 799 (100.0%) |
Property Value to Household Income Ratio in Gray
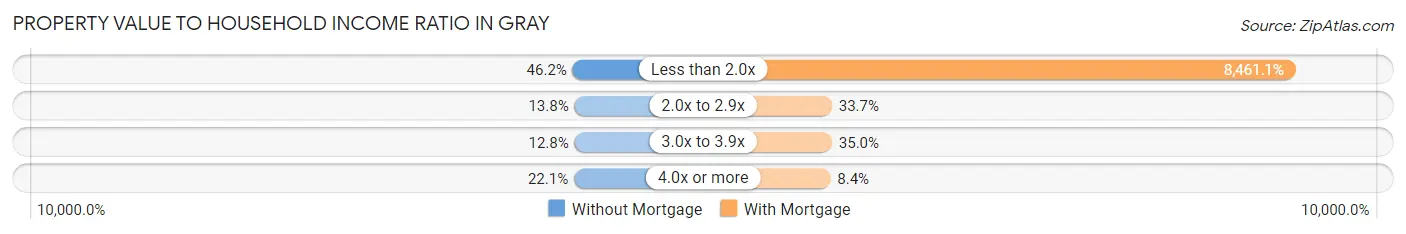
| Value-to-Income Ratio | Without Mortgage | With Mortgage |
| Less than 2.0x | 403 (46.2%) | 67,604 (8,461.1%) |
| 2.0x to 2.9x | 120 (13.8%) | 269 (33.7%) |
| 3.0x to 3.9x | 112 (12.8%) | 280 (35.0%) |
| 4.0x or more | 193 (22.1%) | 67 (8.4%) |
| Total | 873 (100.0%) | 799 (100.0%) |
Real Estate Taxes by Mortgage Status in Gray
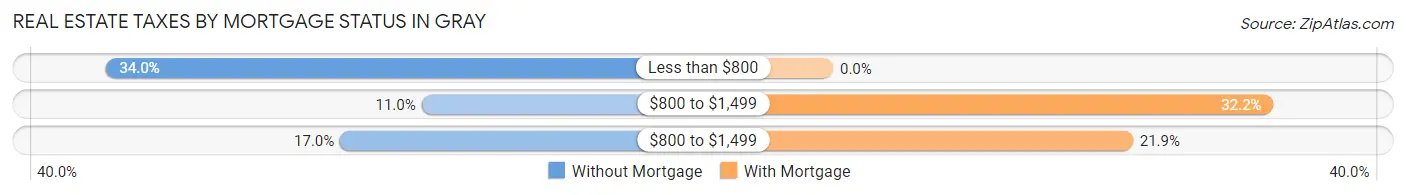
| Property Taxes | Without Mortgage | With Mortgage |
| Less than $800 | 297 (34.0%) | 0 (0.0%) |
| $800 to $1,499 | 96 (11.0%) | 257 (32.2%) |
| $800 to $1,499 | 148 (17.0%) | 175 (21.9%) |
| Total | 873 (100.0%) | 799 (100.0%) |
Health & Disability in Gray
Health Insurance Coverage by Age in Gray
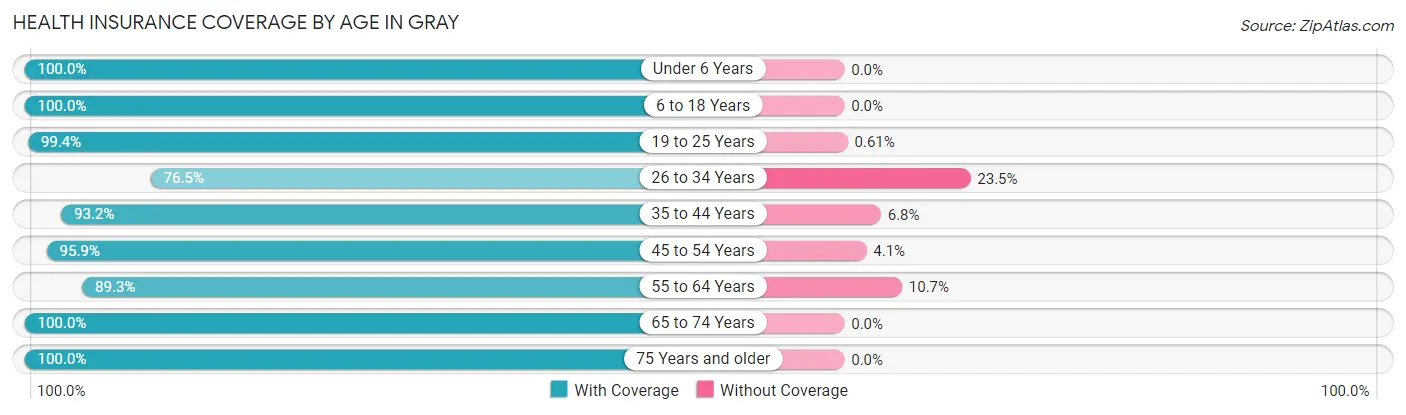
| Age Bracket | With Coverage | Without Coverage |
| Under 6 Years | 502 (100.0%) | 0 (0.0%) |
| 6 to 18 Years | 1,351 (100.0%) | 0 (0.0%) |
| 19 to 25 Years | 486 (99.4%) | 3 (0.6%) |
| 26 to 34 Years | 758 (76.5%) | 233 (23.5%) |
| 35 to 44 Years | 438 (93.2%) | 32 (6.8%) |
| 45 to 54 Years | 746 (95.9%) | 32 (4.1%) |
| 55 to 64 Years | 624 (89.3%) | 75 (10.7%) |
| 65 to 74 Years | 419 (100.0%) | 0 (0.0%) |
| 75 Years and older | 234 (100.0%) | 0 (0.0%) |
| Total | 5,558 (93.7%) | 375 (6.3%) |
Health Insurance Coverage by Citizenship Status in Gray
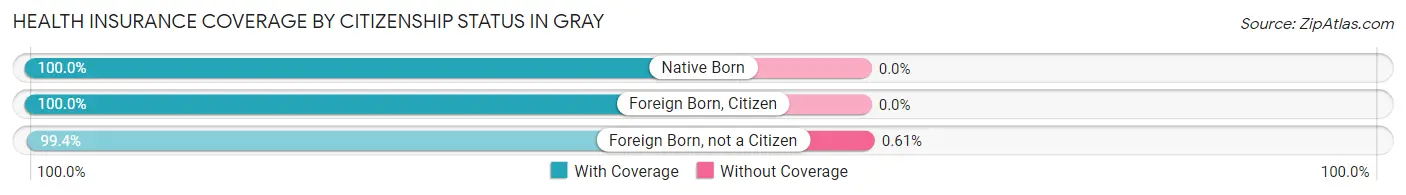
| Citizenship Status | With Coverage | Without Coverage |
| Native Born | 502 (100.0%) | 0 (0.0%) |
| Foreign Born, Citizen | 1,351 (100.0%) | 0 (0.0%) |
| Foreign Born, not a Citizen | 486 (99.4%) | 3 (0.6%) |
Health Insurance Coverage by Household Income in Gray
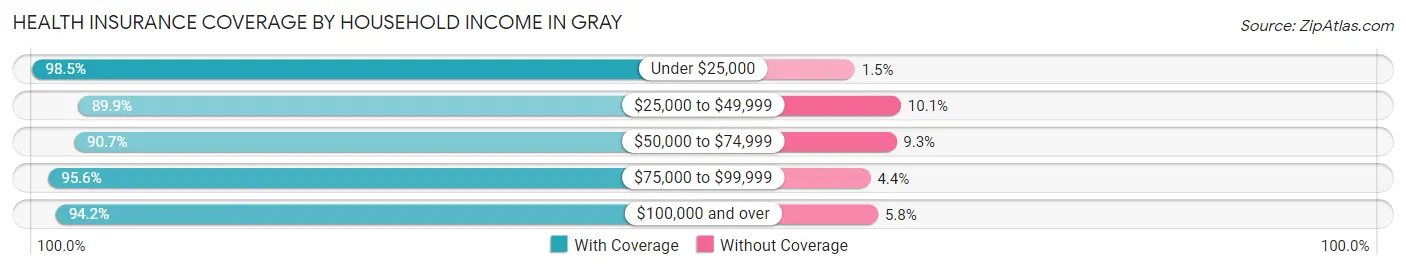
| Household Income | With Coverage | Without Coverage |
| Under $25,000 | 1,054 (98.5%) | 16 (1.5%) |
| $25,000 to $49,999 | 931 (89.9%) | 105 (10.1%) |
| $50,000 to $74,999 | 1,154 (90.7%) | 118 (9.3%) |
| $75,000 to $99,999 | 903 (95.6%) | 42 (4.4%) |
| $100,000 and over | 1,516 (94.2%) | 94 (5.8%) |
Public vs Private Health Insurance Coverage by Age in Gray
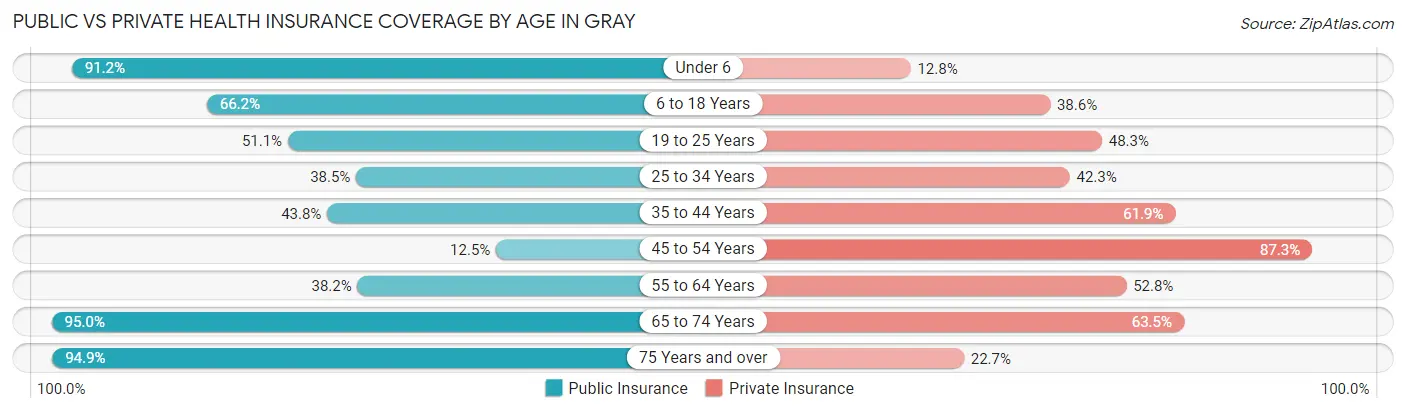
| Age Bracket | Public Insurance | Private Insurance |
| Under 6 | 458 (91.2%) | 64 (12.8%) |
| 6 to 18 Years | 894 (66.2%) | 522 (38.6%) |
| 19 to 25 Years | 250 (51.1%) | 236 (48.3%) |
| 25 to 34 Years | 381 (38.5%) | 419 (42.3%) |
| 35 to 44 Years | 206 (43.8%) | 291 (61.9%) |
| 45 to 54 Years | 97 (12.5%) | 679 (87.3%) |
| 55 to 64 Years | 267 (38.2%) | 369 (52.8%) |
| 65 to 74 Years | 398 (95.0%) | 266 (63.5%) |
| 75 Years and over | 222 (94.9%) | 53 (22.7%) |
| Total | 3,173 (53.5%) | 2,899 (48.9%) |
Disability Status by Sex by Age in Gray
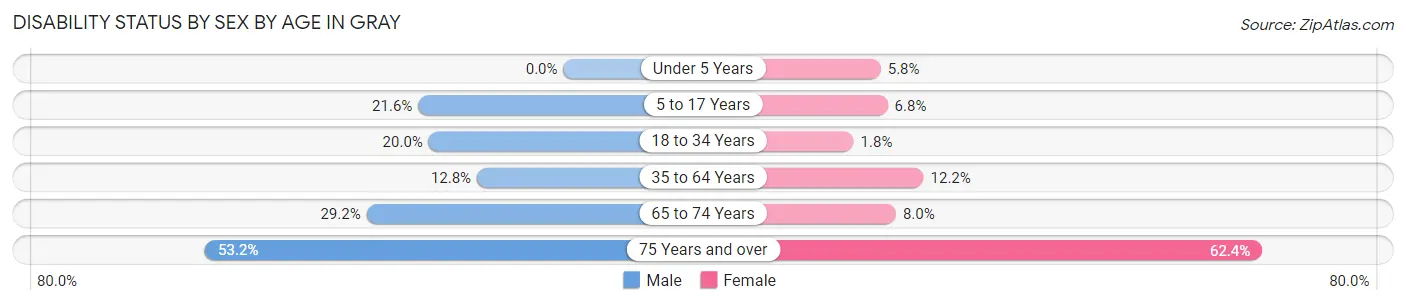
| Age Bracket | Male | Female |
| Under 5 Years | 0 (0.0%) | 11 (5.8%) |
| 5 to 17 Years | 158 (21.6%) | 42 (6.8%) |
| 18 to 34 Years | 153 (20.0%) | 14 (1.8%) |
| 35 to 64 Years | 120 (12.8%) | 123 (12.1%) |
| 65 to 74 Years | 57 (29.2%) | 18 (8.0%) |
| 75 Years and over | 58 (53.2%) | 78 (62.4%) |
Disability Class by Sex by Age in Gray
Disability Class: Hearing Difficulty
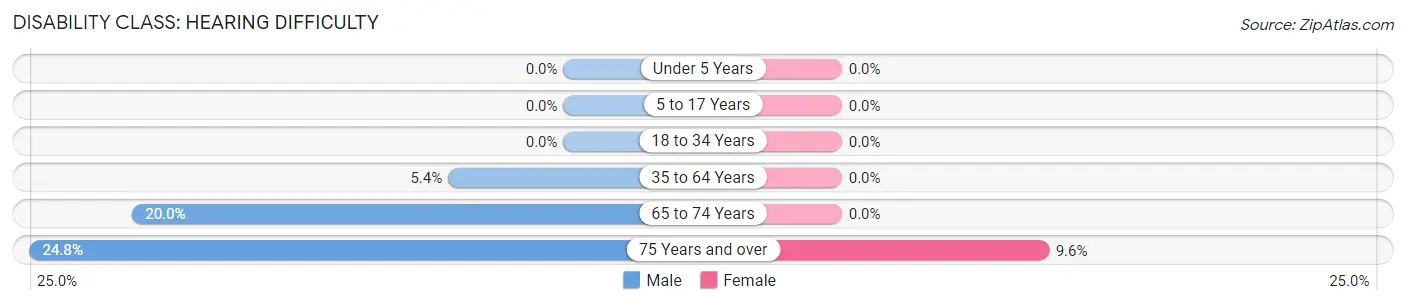
| Age Bracket | Male | Female |
| Under 5 Years | 0 (0.0%) | 0 (0.0%) |
| 5 to 17 Years | 0 (0.0%) | 0 (0.0%) |
| 18 to 34 Years | 0 (0.0%) | 0 (0.0%) |
| 35 to 64 Years | 50 (5.3%) | 0 (0.0%) |
| 65 to 74 Years | 39 (20.0%) | 0 (0.0%) |
| 75 Years and over | 27 (24.8%) | 12 (9.6%) |
Disability Class: Vision Difficulty
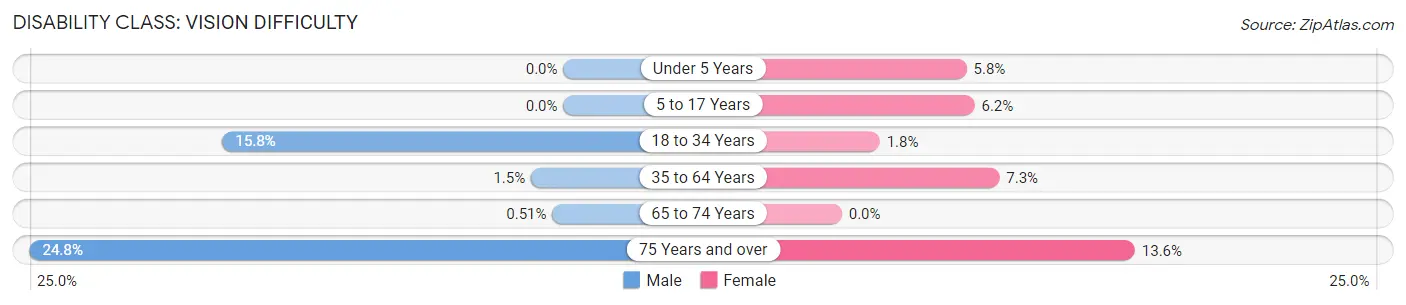
| Age Bracket | Male | Female |
| Under 5 Years | 0 (0.0%) | 11 (5.8%) |
| 5 to 17 Years | 0 (0.0%) | 38 (6.2%) |
| 18 to 34 Years | 121 (15.8%) | 14 (1.8%) |
| 35 to 64 Years | 14 (1.5%) | 74 (7.3%) |
| 65 to 74 Years | 1 (0.5%) | 0 (0.0%) |
| 75 Years and over | 27 (24.8%) | 17 (13.6%) |
Disability Class: Cognitive Difficulty
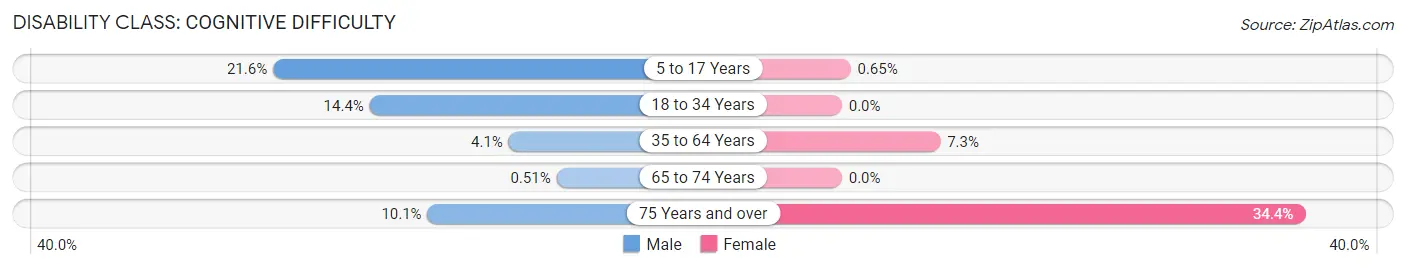
| Age Bracket | Male | Female |
| 5 to 17 Years | 158 (21.6%) | 4 (0.6%) |
| 18 to 34 Years | 110 (14.4%) | 0 (0.0%) |
| 35 to 64 Years | 38 (4.1%) | 74 (7.3%) |
| 65 to 74 Years | 1 (0.5%) | 0 (0.0%) |
| 75 Years and over | 11 (10.1%) | 43 (34.4%) |
Disability Class: Ambulatory Difficulty
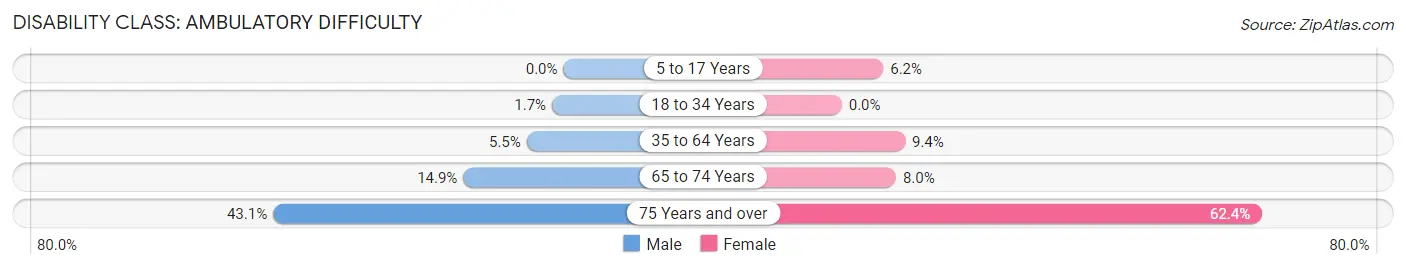
| Age Bracket | Male | Female |
| 5 to 17 Years | 0 (0.0%) | 38 (6.2%) |
| 18 to 34 Years | 13 (1.7%) | 0 (0.0%) |
| 35 to 64 Years | 51 (5.4%) | 95 (9.4%) |
| 65 to 74 Years | 29 (14.9%) | 18 (8.0%) |
| 75 Years and over | 47 (43.1%) | 78 (62.4%) |
Disability Class: Self-Care Difficulty
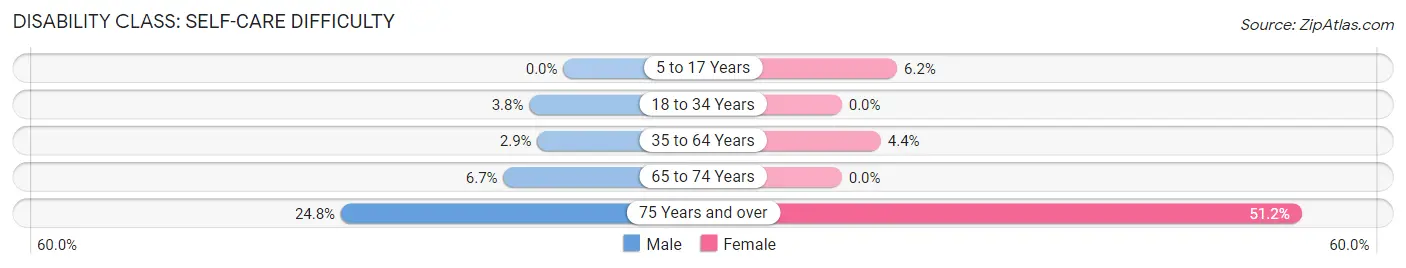
| Age Bracket | Male | Female |
| 5 to 17 Years | 0 (0.0%) | 38 (6.2%) |
| 18 to 34 Years | 29 (3.8%) | 0 (0.0%) |
| 35 to 64 Years | 27 (2.9%) | 44 (4.3%) |
| 65 to 74 Years | 13 (6.7%) | 0 (0.0%) |
| 75 Years and over | 27 (24.8%) | 64 (51.2%) |
Technology Access in Gray
Computing Device Access in Gray
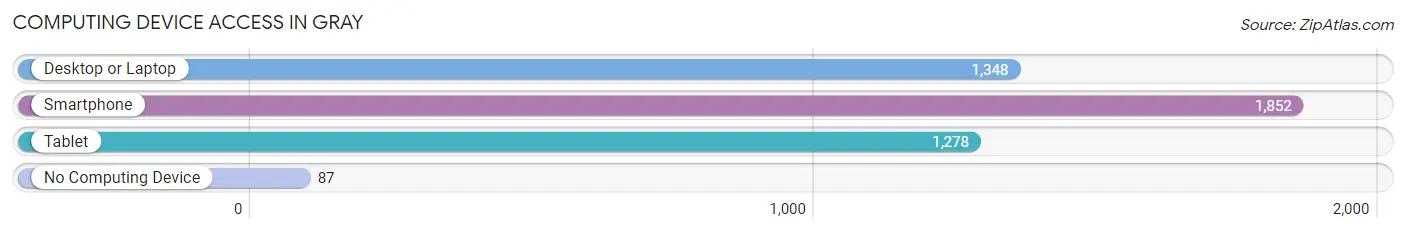
| Device Type | # Households | % Households |
| Desktop or Laptop | 1,348 | 64.6% |
| Smartphone | 1,852 | 88.7% |
| Tablet | 1,278 | 61.2% |
| No Computing Device | 87 | 4.2% |
| Total | 2,088 | 100.0% |
Internet Access in Gray
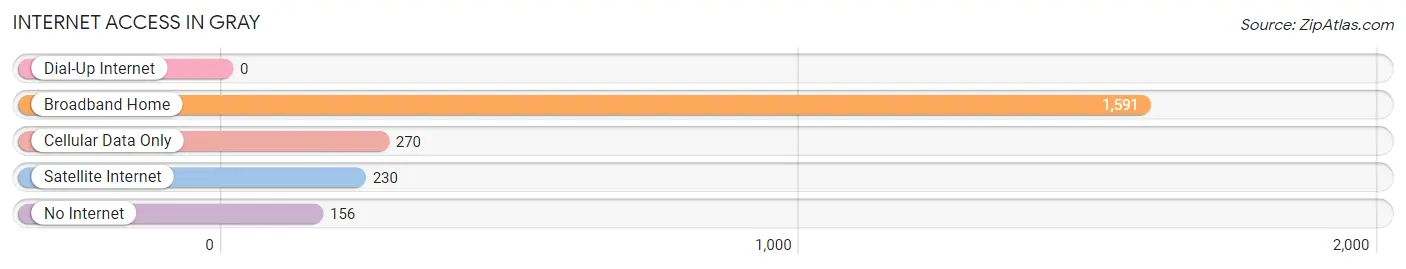
| Internet Type | # Households | % Households |
| Dial-Up Internet | 0 | 0.0% |
| Broadband Home | 1,591 | 76.2% |
| Cellular Data Only | 270 | 12.9% |
| Satellite Internet | 230 | 11.0% |
| No Internet | 156 | 7.5% |
| Total | 2,088 | 100.0% |
Gray Summary
Gray is a small town located in Terrebonne Parish, Louisiana. It is situated about 10 miles south of Houma and about 40 miles southwest of New Orleans. The town has a population of approximately 2,000 people and is part of the Houma-Thibodaux Metropolitan Statistical Area.
History
Gray was founded in 1883 by the Gray family, who were among the first settlers in the area. The town was named after the family’s patriarch, William Gray. The town was originally a farming community, but it soon developed into a small industrial center. In the early 1900s, Gray was home to several sawmills, a cotton gin, and a brickyard.
In the 1950s, Gray began to experience a population boom as people moved to the area for jobs in the oil and gas industry. This growth continued into the 1960s and 1970s, and by the 1980s, Gray had become a thriving community.
Geography
Gray is located in the southeastern part of Terrebonne Parish, about 10 miles south of Houma and 40 miles southwest of New Orleans. The town is situated on the banks of Bayou Terrebonne, which is part of the larger Bayou Lafourche system. The terrain in the area is mostly flat, with some low hills and ridges.
The climate in Gray is humid subtropical, with hot, humid summers and mild winters. The average annual temperature is around 70 degrees Fahrenheit, and the average annual precipitation is around 60 inches.
Economy
The economy of Gray is largely based on the oil and gas industry. The town is home to several oil and gas companies, as well as a number of related businesses. In addition, Gray is home to several small businesses, including restaurants, retail stores, and service providers.
The town is also home to a number of manufacturing companies, including a paper mill and a plastics plant. The town is also home to a number of agricultural businesses, including a sugar cane farm and a crawfish farm.
Demographics
As of the 2010 census, the population of Gray was 2,039. The racial makeup of the town was 79.3% White, 17.2% African American, 0.7% Native American, 0.3% Asian, 0.1% Pacific Islander, and 2.4% from other races. The median household income in Gray was $37,917, and the median family income was $45,938.
The town is served by the Terrebonne Parish School District, which includes two elementary schools, one middle school, and one high school. The town is also home to a number of churches, including Baptist, Methodist, and Catholic.
Common Questions
What is Per Capita Income in Gray?
Per Capita income in Gray is $26,453.
What is the Median Family Income in Gray?
Median Family Income in Gray is $52,194.
What is the Median Household income in Gray?
Median Household Income in Gray is $52,075.
What is Income or Wage Gap in Gray?
Income or Wage Gap in Gray is 41.3%.
Women in Gray earn 58.7 cents for every dollar earned by a man.
What is Inequality or Gini Index in Gray?
Inequality or Gini Index in Gray is 0.50.
What is the Total Population of Gray?
Total Population of Gray is 5,951.
What is the Total Male Population of Gray?
Total Male Population of Gray is 2,988.
What is the Total Female Population of Gray?
Total Female Population of Gray is 2,963.
What is the Ratio of Males per 100 Females in Gray?
There are 100.84 Males per 100 Females in Gray.
What is the Ratio of Females per 100 Males in Gray?
There are 99.16 Females per 100 Males in Gray.
What is the Median Population Age in Gray?
Median Population Age in Gray is 30.4 Years.
What is the Average Family Size in Gray
Average Family Size in Gray is 3.2 People.
What is the Average Household Size in Gray
Average Household Size in Gray is 2.9 People.
How Large is the Labor Force in Gray?
There are 2,709 People in the Labor Forcein in Gray.
What is the Percentage of People in the Labor Force in Gray?
62.4% of People are in the Labor Force in Gray.
What is the Unemployment Rate in Gray?
Unemployment Rate in Gray is 6.5%.