Morgan City, LA Map & Demographics
Morgan City Map
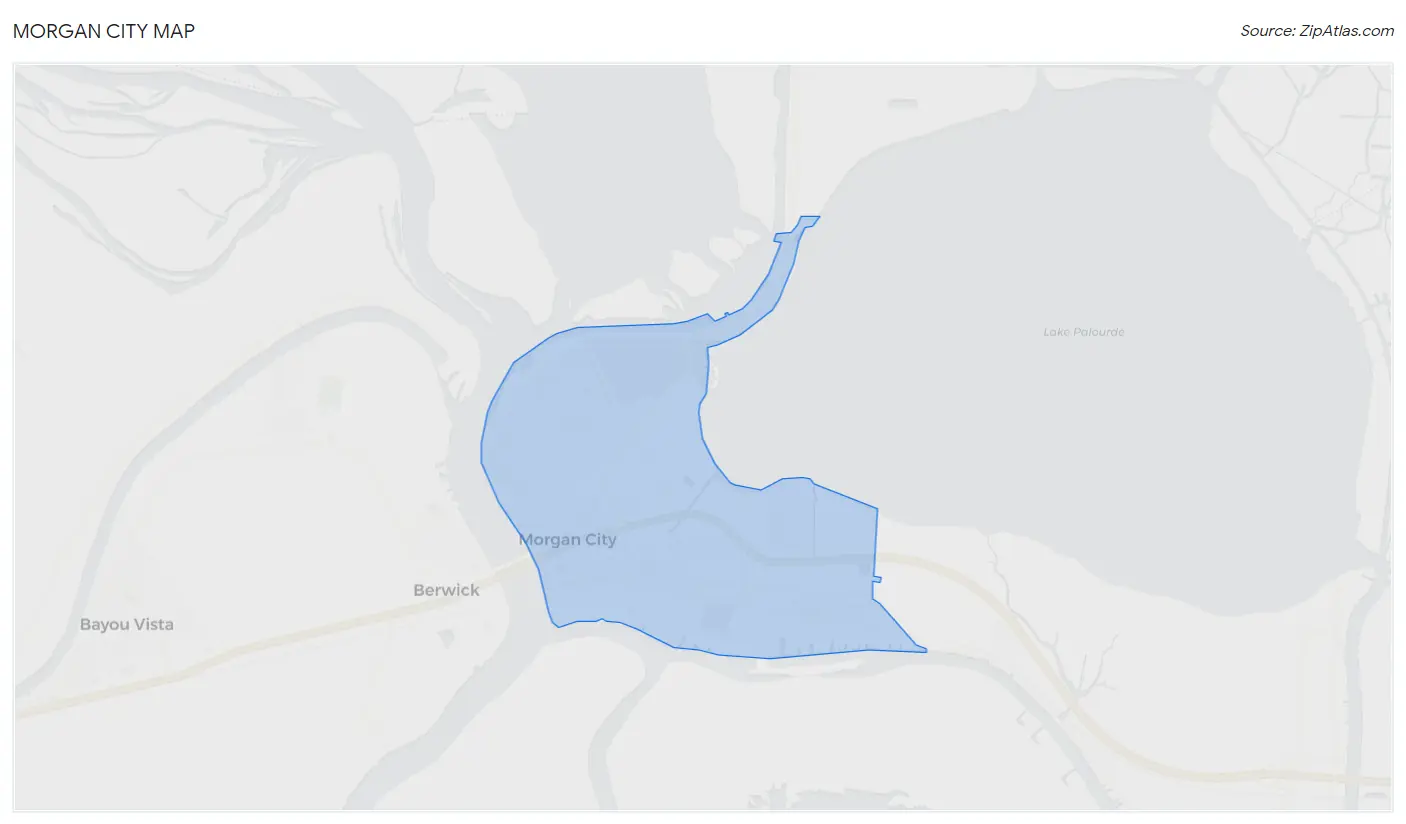
Morgan City Overview
$26,781
PER CAPITA INCOME
$68,505
AVG FAMILY INCOME
$48,857
AVG HOUSEHOLD INCOME
47.0%
WAGE / INCOME GAP [ % ]
53.0¢/ $1
WAGE / INCOME GAP [ $ ]
0.48
INEQUALITY / GINI INDEX
11,373
TOTAL POPULATION
5,821
MALE POPULATION
5,552
FEMALE POPULATION
104.85
MALES / 100 FEMALES
95.38
FEMALES / 100 MALES
43.3
MEDIAN AGE
3.3
AVG FAMILY SIZE
2.5
AVG HOUSEHOLD SIZE
5,045
LABOR FORCE [ PEOPLE ]
56.7%
PERCENT IN LABOR FORCE
8.3%
UNEMPLOYMENT RATE
Morgan City Zip Codes
Morgan City Area Codes
Income in Morgan City
Income Overview in Morgan City
Per Capita Income in Morgan City is $26,781, while median incomes of families and households are $68,505 and $48,857 respectively.
| Characteristic | Number | Measure |
| Per Capita Income | 11,373 | $26,781 |
| Median Family Income | 2,751 | $68,505 |
| Mean Family Income | 2,751 | $80,356 |
| Median Household Income | 4,486 | $48,857 |
| Mean Household Income | 4,486 | $64,147 |
| Income Deficit | 2,751 | $0 |
| Wage / Income Gap (%) | 11,373 | 46.99% |
| Wage / Income Gap ($) | 11,373 | 53.01¢ per $1 |
| Gini / Inequality Index | 11,373 | 0.48 |
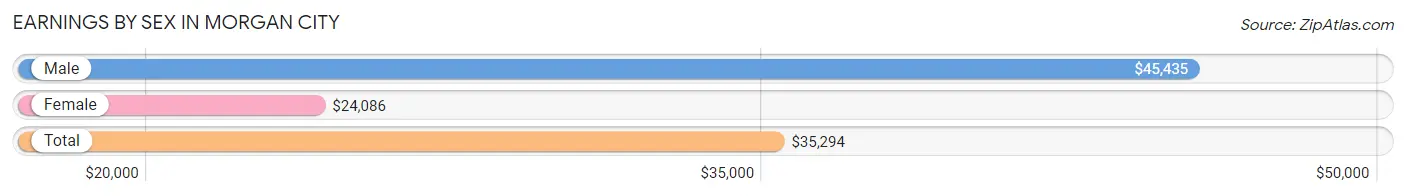
Earnings by Sex in Morgan City
Average Earnings in Morgan City are $35,294, $45,435 for men and $24,086 for women, a difference of 47.0%.
| Sex | Number | Average Earnings |
| Male | 2,639 (51.8%) | $45,435 |
| Female | 2,454 (48.2%) | $24,086 |
| Total | 5,093 (100.0%) | $35,294 |
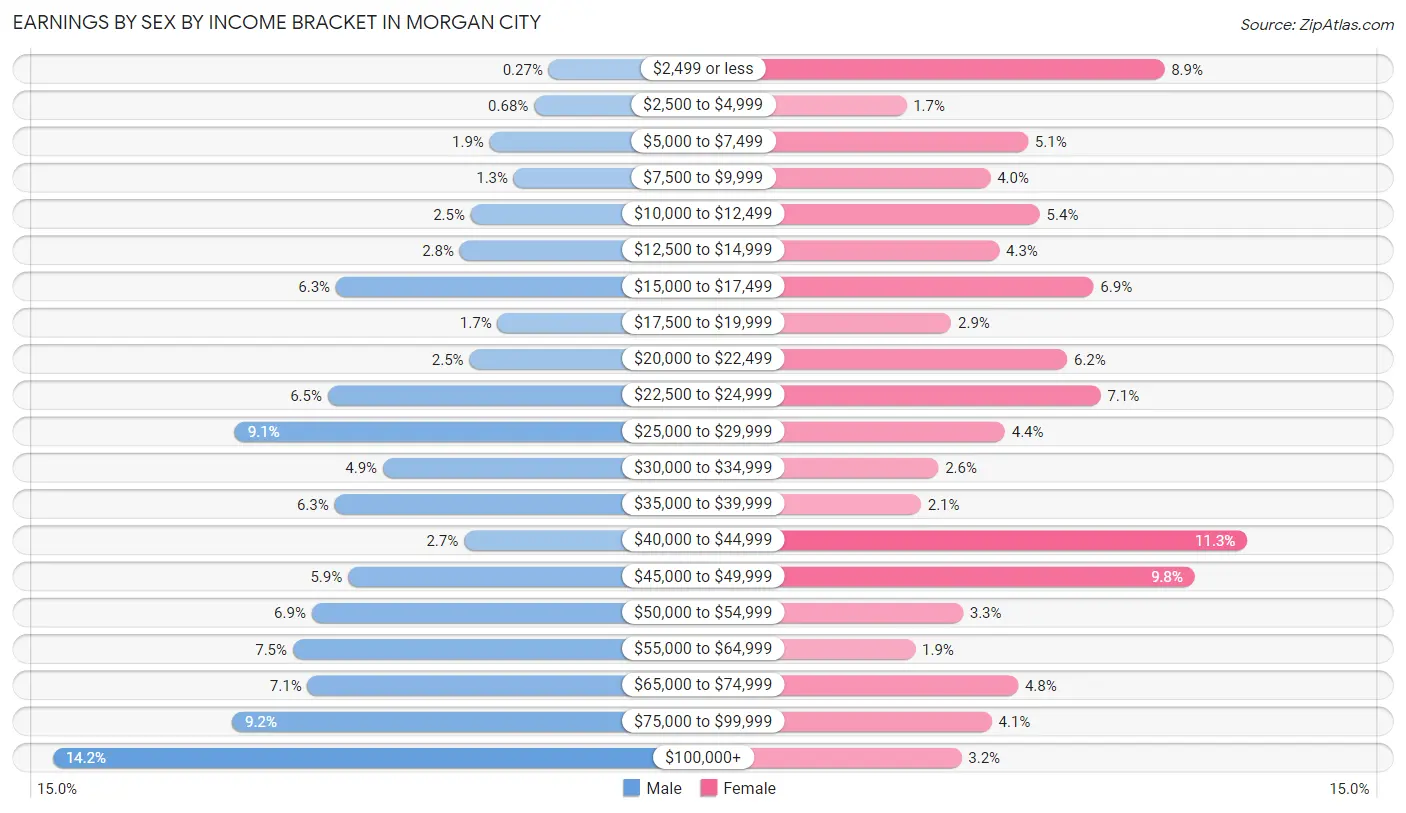
Earnings by Sex by Income Bracket in Morgan City
The most common earnings brackets in Morgan City are $100,000+ for men (375 | 14.2%) and $40,000 to $44,999 for women (276 | 11.3%).
| Income | Male | Female |
| $2,499 or less | 7 (0.3%) | 219 (8.9%) |
| $2,500 to $4,999 | 18 (0.7%) | 41 (1.7%) |
| $5,000 to $7,499 | 51 (1.9%) | 125 (5.1%) |
| $7,500 to $9,999 | 33 (1.3%) | 99 (4.0%) |
| $10,000 to $12,499 | 65 (2.5%) | 133 (5.4%) |
| $12,500 to $14,999 | 73 (2.8%) | 105 (4.3%) |
| $15,000 to $17,499 | 165 (6.2%) | 170 (6.9%) |
| $17,500 to $19,999 | 45 (1.7%) | 72 (2.9%) |
| $20,000 to $22,499 | 66 (2.5%) | 152 (6.2%) |
| $22,500 to $24,999 | 171 (6.5%) | 175 (7.1%) |
| $25,000 to $29,999 | 240 (9.1%) | 109 (4.4%) |
| $30,000 to $34,999 | 130 (4.9%) | 63 (2.6%) |
| $35,000 to $39,999 | 166 (6.3%) | 51 (2.1%) |
| $40,000 to $44,999 | 70 (2.6%) | 276 (11.3%) |
| $45,000 to $49,999 | 156 (5.9%) | 240 (9.8%) |
| $50,000 to $54,999 | 183 (6.9%) | 80 (3.3%) |
| $55,000 to $64,999 | 197 (7.5%) | 47 (1.9%) |
| $65,000 to $74,999 | 186 (7.0%) | 118 (4.8%) |
| $75,000 to $99,999 | 242 (9.2%) | 100 (4.1%) |
| $100,000+ | 375 (14.2%) | 79 (3.2%) |
| Total | 2,639 (100.0%) | 2,454 (100.0%) |
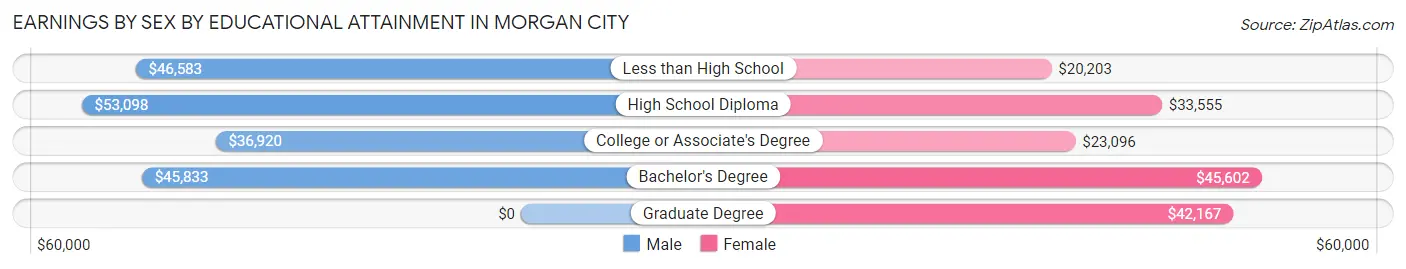
Earnings by Sex by Educational Attainment in Morgan City
Average earnings in Morgan City are $48,551 for men and $27,028 for women, a difference of 44.3%. Men with an educational attainment of high school diploma enjoy the highest average annual earnings of $53,098, while those with college or associate's degree education earn the least with $36,920. Women with an educational attainment of bachelor's degree earn the most with the average annual earnings of $45,602, while those with less than high school education have the smallest earnings of $20,203.
| Educational Attainment | Male Income | Female Income |
| Less than High School | $46,583 | $20,203 |
| High School Diploma | $53,098 | $33,555 |
| College or Associate's Degree | $36,920 | $23,096 |
| Bachelor's Degree | $45,833 | $45,602 |
| Graduate Degree | - | - |
| Total | $48,551 | $27,028 |
Family Income in Morgan City
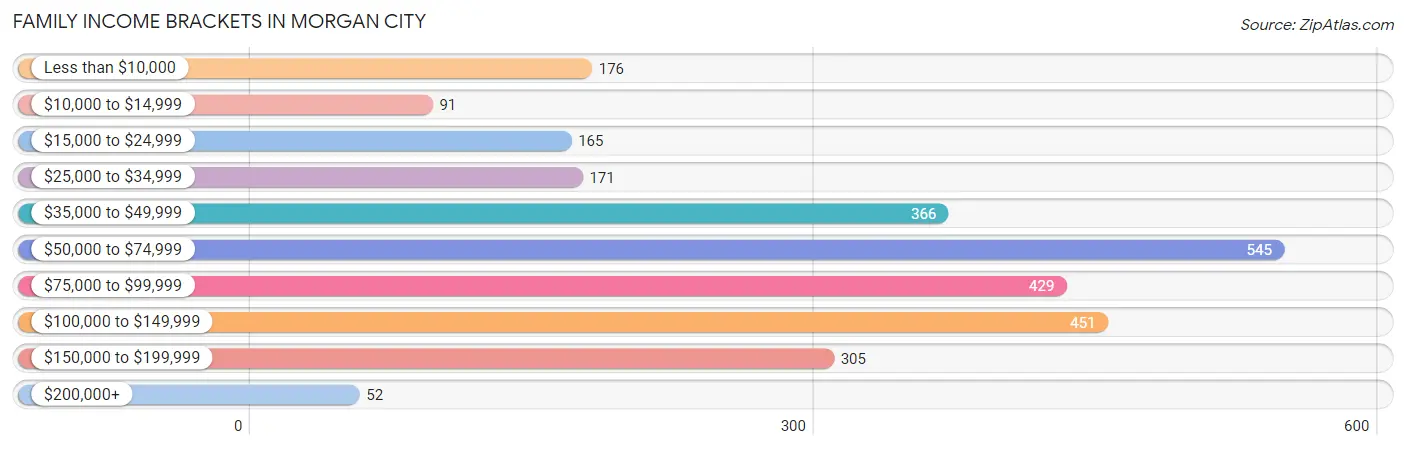
Family Income Brackets in Morgan City
According to the Morgan City family income data, there are 545 families falling into the $50,000 to $74,999 income range, which is the most common income bracket and makes up 19.8% of all families. Conversely, the $200,000+ income bracket is the least frequent group with only 52 families (1.9%) belonging to this category.
| Income Bracket | # Families | % Families |
| Less than $10,000 | 176 | 6.4% |
| $10,000 to $14,999 | 91 | 3.3% |
| $15,000 to $24,999 | 165 | 6.0% |
| $25,000 to $34,999 | 171 | 6.2% |
| $35,000 to $49,999 | 366 | 13.3% |
| $50,000 to $74,999 | 545 | 19.8% |
| $75,000 to $99,999 | 429 | 15.6% |
| $100,000 to $149,999 | 451 | 16.4% |
| $150,000 to $199,999 | 305 | 11.1% |
| $200,000+ | 52 | 1.9% |
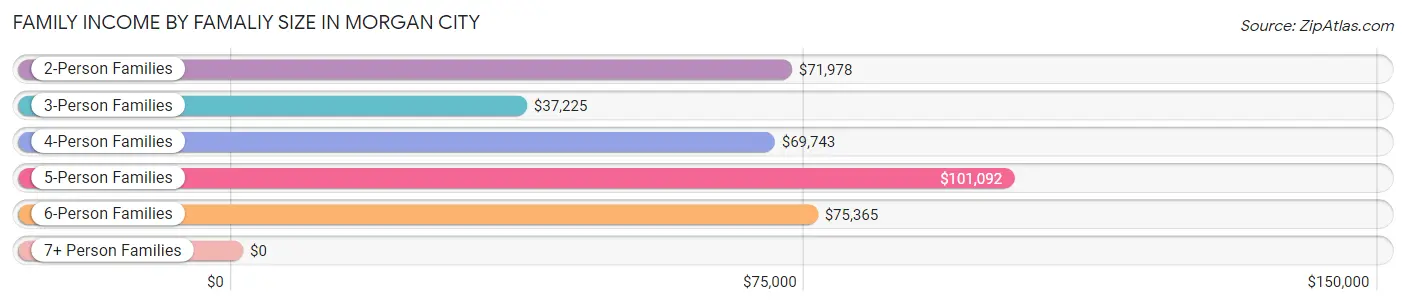
Family Income by Famaliy Size in Morgan City
5-person families (266 | 9.7%) account for the highest median family income in Morgan City with $101,092 per family, while 2-person families (1,267 | 46.1%) have the highest median income of $35,989 per family member.
| Income Bracket | # Families | Median Income |
| 2-Person Families | 1,267 (46.1%) | $71,978 |
| 3-Person Families | 632 (23.0%) | $37,225 |
| 4-Person Families | 511 (18.6%) | $69,743 |
| 5-Person Families | 266 (9.7%) | $101,092 |
| 6-Person Families | 69 (2.5%) | $75,365 |
| 7+ Person Families | 6 (0.2%) | $0 |
| Total | 2,751 (100.0%) | $68,505 |
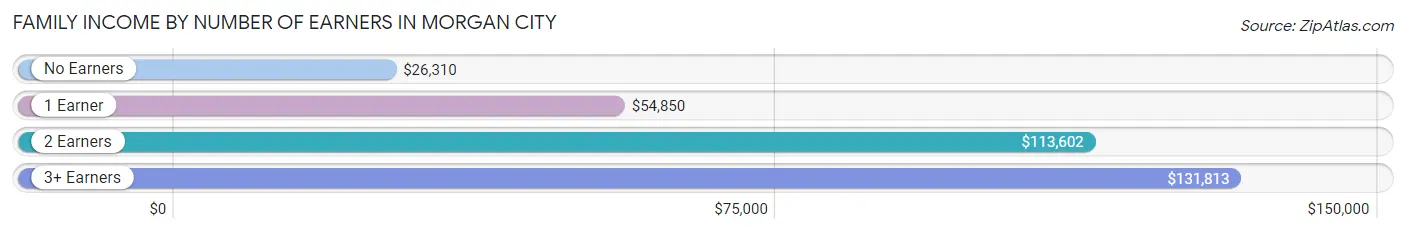
Family Income by Number of Earners in Morgan City
The median family income in Morgan City is $68,505, with families comprising 3+ earners (216) having the highest median family income of $131,813, while families with no earners (412) have the lowest median family income of $26,310, accounting for 7.9% and 15.0% of families, respectively.
| Number of Earners | # Families | Median Income |
| No Earners | 412 (15.0%) | $26,310 |
| 1 Earner | 1,299 (47.2%) | $54,850 |
| 2 Earners | 824 (29.9%) | $113,602 |
| 3+ Earners | 216 (7.9%) | $131,813 |
| Total | 2,751 (100.0%) | $68,505 |
Household Income in Morgan City
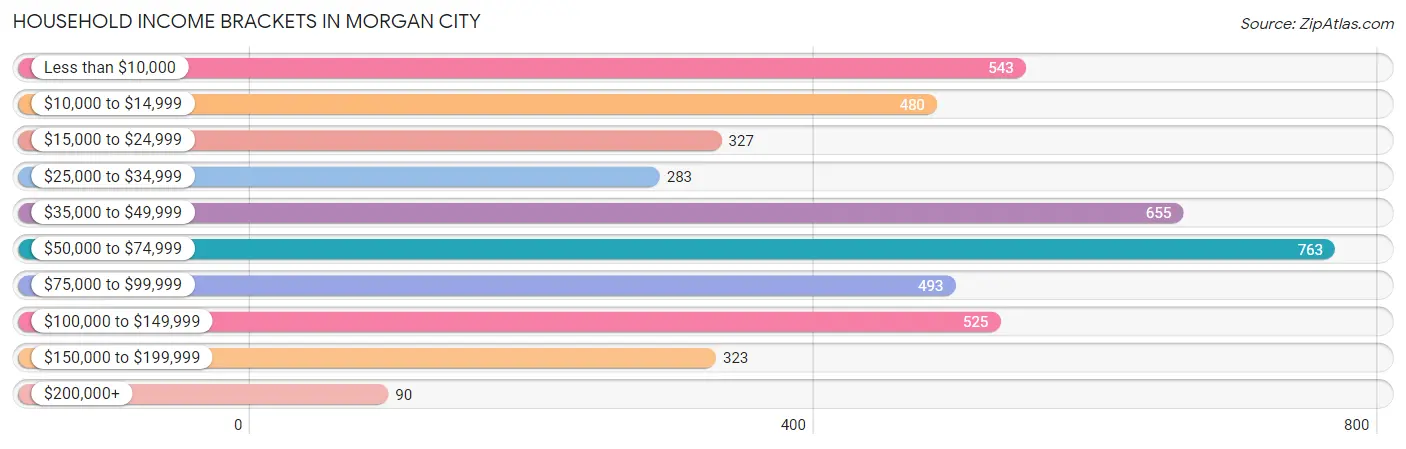
Household Income Brackets in Morgan City
With 763 households falling in the category, the $50,000 to $74,999 income range is the most frequent in Morgan City, accounting for 17.0% of all households. In contrast, only 90 households (2.0%) fall into the $200,000+ income bracket, making it the least populous group.
| Income Bracket | # Households | % Households |
| Less than $10,000 | 543 | 12.1% |
| $10,000 to $14,999 | 480 | 10.7% |
| $15,000 to $24,999 | 327 | 7.3% |
| $25,000 to $34,999 | 283 | 6.3% |
| $35,000 to $49,999 | 655 | 14.6% |
| $50,000 to $74,999 | 763 | 17.0% |
| $75,000 to $99,999 | 493 | 11.0% |
| $100,000 to $149,999 | 525 | 11.7% |
| $150,000 to $199,999 | 323 | 7.2% |
| $200,000+ | 90 | 2.0% |
Household Income by Householder Age in Morgan City
The median household income in Morgan City is $48,857, with the highest median household income of $55,147 found in the 65+ years age bracket for the primary householder. A total of 1,428 households (31.8%) fall into this category. Meanwhile, the 15 to 24 years age bracket for the primary householder has the lowest median household income of $0, with 132 households (2.9%) in this group.
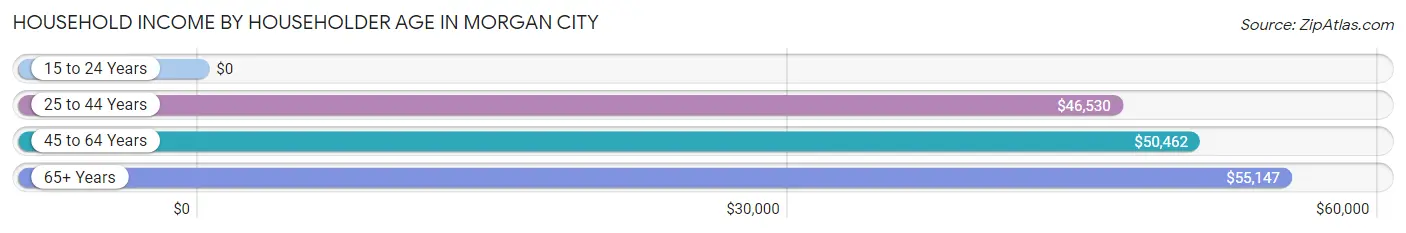
| Income Bracket | # Households | Median Income |
| 15 to 24 Years | 132 (2.9%) | $0 |
| 25 to 44 Years | 1,119 (24.9%) | $46,530 |
| 45 to 64 Years | 1,807 (40.3%) | $50,462 |
| 65+ Years | 1,428 (31.8%) | $55,147 |
| Total | 4,486 (100.0%) | $48,857 |
Poverty in Morgan City
Income Below Poverty by Sex and Age in Morgan City
With 21.7% poverty level for males and 21.3% for females among the residents of Morgan City, 5 year old males and 15 year old females are the most vulnerable to poverty, with 14 males (100.0%) and 24 females (100.0%) in their respective age groups living below the poverty level.
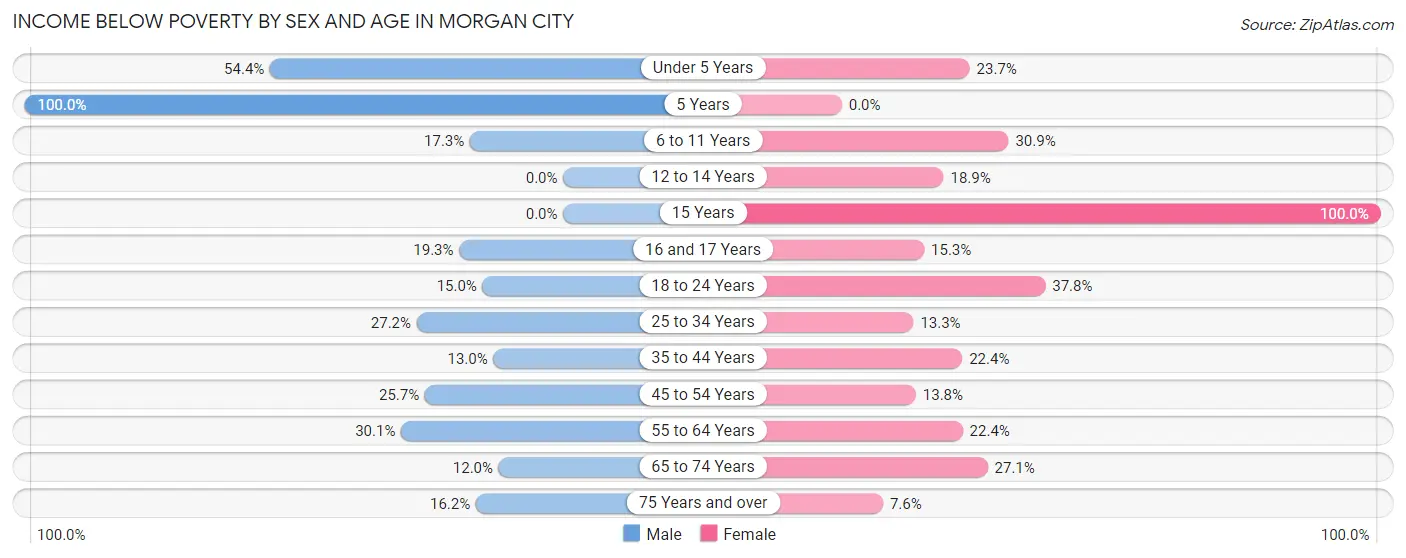
| Age Bracket | Male | Female |
| Under 5 Years | 154 (54.4%) | 121 (23.7%) |
| 5 Years | 14 (100.0%) | 0 (0.0%) |
| 6 to 11 Years | 103 (17.3%) | 138 (30.9%) |
| 12 to 14 Years | 0 (0.0%) | 41 (18.9%) |
| 15 Years | 0 (0.0%) | 24 (100.0%) |
| 16 and 17 Years | 22 (19.3%) | 11 (15.3%) |
| 18 to 24 Years | 44 (15.0%) | 122 (37.8%) |
| 25 to 34 Years | 180 (27.2%) | 93 (13.3%) |
| 35 to 44 Years | 83 (13.0%) | 131 (22.4%) |
| 45 to 54 Years | 250 (25.7%) | 92 (13.8%) |
| 55 to 64 Years | 272 (30.1%) | 192 (22.4%) |
| 65 to 74 Years | 76 (12.0%) | 174 (27.1%) |
| 75 Years and over | 46 (16.2%) | 31 (7.6%) |
| Total | 1,244 (21.7%) | 1,170 (21.3%) |
Income Above Poverty by Sex and Age in Morgan City
According to the poverty statistics in Morgan City, males aged 12 to 14 years and females aged 5 years are the age groups that are most secure financially, with 100.0% of males and 100.0% of females in these age groups living above the poverty line.
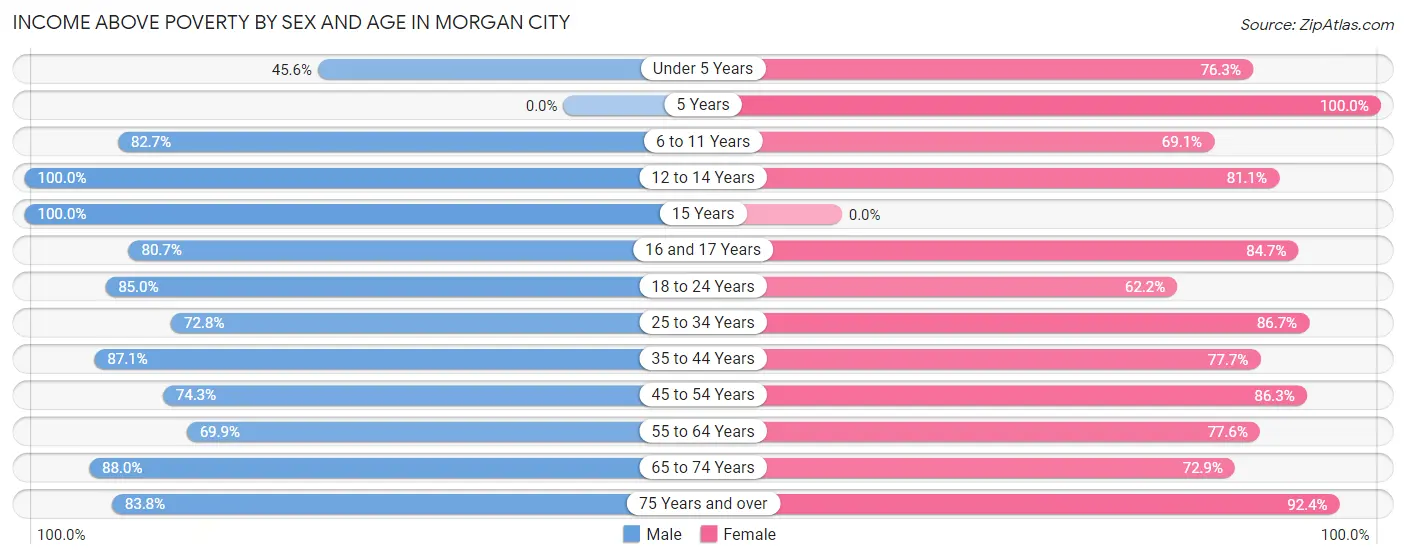
| Age Bracket | Male | Female |
| Under 5 Years | 129 (45.6%) | 389 (76.3%) |
| 5 Years | 0 (0.0%) | 50 (100.0%) |
| 6 to 11 Years | 492 (82.7%) | 308 (69.1%) |
| 12 to 14 Years | 208 (100.0%) | 176 (81.1%) |
| 15 Years | 128 (100.0%) | 0 (0.0%) |
| 16 and 17 Years | 92 (80.7%) | 61 (84.7%) |
| 18 to 24 Years | 250 (85.0%) | 201 (62.2%) |
| 25 to 34 Years | 482 (72.8%) | 606 (86.7%) |
| 35 to 44 Years | 558 (87.1%) | 455 (77.6%) |
| 45 to 54 Years | 724 (74.3%) | 577 (86.3%) |
| 55 to 64 Years | 632 (69.9%) | 664 (77.6%) |
| 65 to 74 Years | 559 (88.0%) | 469 (72.9%) |
| 75 Years and over | 238 (83.8%) | 375 (92.4%) |
| Total | 4,492 (78.3%) | 4,331 (78.7%) |
Income Below Poverty Among Married-Couple Families in Morgan City
The poverty statistics for married-couple families in Morgan City show that 5.0% or 98 of the total 1,974 families live below the poverty line. Families with no children have the highest poverty rate of 5.8%, comprising of 64 families. On the other hand, families with 3 or 4 children have the lowest poverty rate of 0.0%, which includes 0 families.
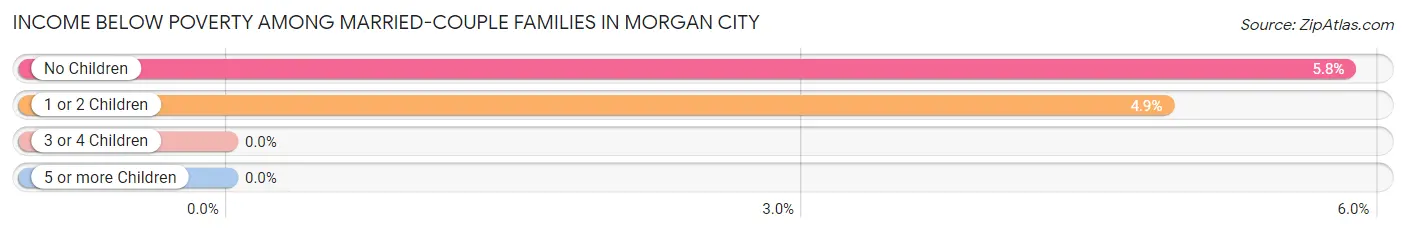
| Children | Above Poverty | Below Poverty |
| No Children | 1,032 (94.2%) | 64 (5.8%) |
| 1 or 2 Children | 662 (95.1%) | 34 (4.9%) |
| 3 or 4 Children | 182 (100.0%) | 0 (0.0%) |
| 5 or more Children | 0 (0.0%) | 0 (0.0%) |
| Total | 1,876 (95.0%) | 98 (5.0%) |
Income Below Poverty Among Single-Parent Households in Morgan City
According to the poverty data in Morgan City, 4.5% or 7 single-father households and 40.3% or 250 single-mother households are living below the poverty line. Among single-father households, those with 1 or 2 children have the highest poverty rate, with 7 households (8.5%) experiencing poverty. Likewise, among single-mother households, those with 3 or 4 children have the highest poverty rate, with 34 households (100.0%) falling below the poverty line.
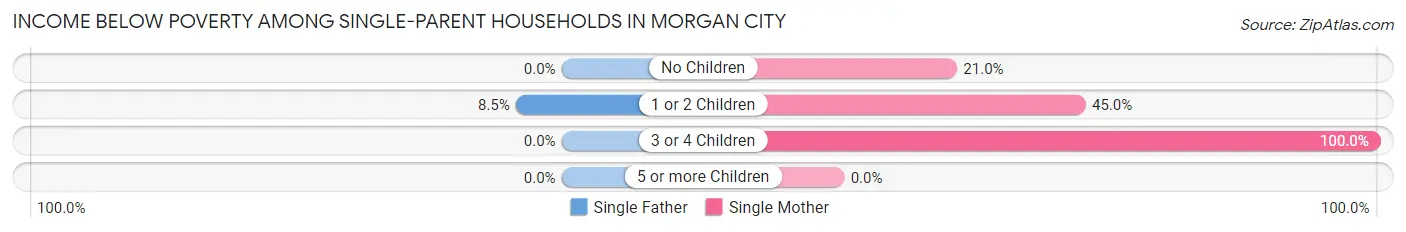
| Children | Single Father | Single Mother |
| No Children | 0 (0.0%) | 42 (21.0%) |
| 1 or 2 Children | 7 (8.5%) | 174 (45.0%) |
| 3 or 4 Children | 0 (0.0%) | 34 (100.0%) |
| 5 or more Children | 0 (0.0%) | 0 (0.0%) |
| Total | 7 (4.5%) | 250 (40.3%) |
Income Below Poverty Among Married-Couple vs Single-Parent Households in Morgan City
The poverty data for Morgan City shows that 98 of the married-couple family households (5.0%) and 257 of the single-parent households (33.1%) are living below the poverty level. Within the married-couple family households, those with no children have the highest poverty rate, with 64 households (5.8%) falling below the poverty line. Among the single-parent households, those with 3 or 4 children have the highest poverty rate, with 34 household (100.0%) living below poverty.
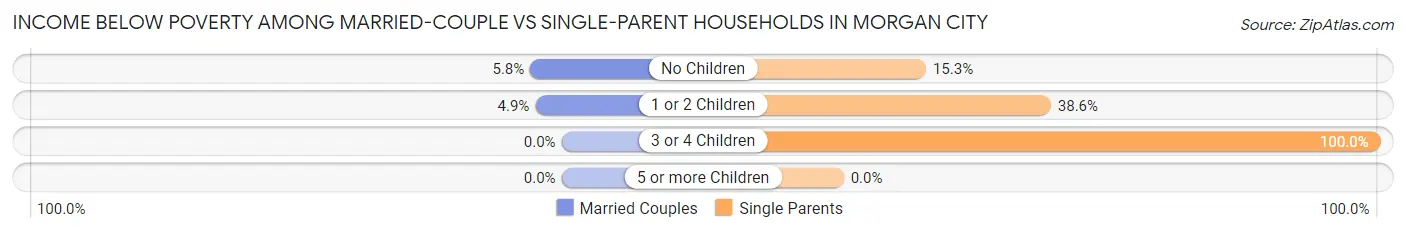
| Children | Married-Couple Families | Single-Parent Households |
| No Children | 64 (5.8%) | 42 (15.3%) |
| 1 or 2 Children | 34 (4.9%) | 181 (38.6%) |
| 3 or 4 Children | 0 (0.0%) | 34 (100.0%) |
| 5 or more Children | 0 (0.0%) | 0 (0.0%) |
| Total | 98 (5.0%) | 257 (33.1%) |
Race in Morgan City
The most populous races in Morgan City are White / Caucasian (7,669 | 67.4%), Black / African American (1,977 | 17.4%), and Hispanic or Latino (1,581 | 13.9%).
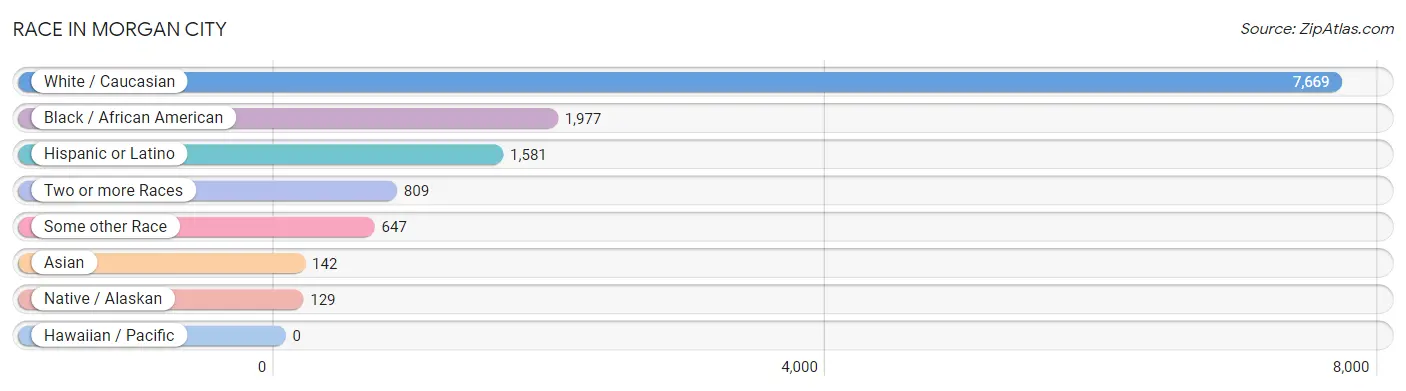
| Race | # Population | % Population |
| Asian | 142 | 1.3% |
| Black / African American | 1,977 | 17.4% |
| Hawaiian / Pacific | 0 | 0.0% |
| Hispanic or Latino | 1,581 | 13.9% |
| Native / Alaskan | 129 | 1.1% |
| White / Caucasian | 7,669 | 67.4% |
| Two or more Races | 809 | 7.1% |
| Some other Race | 647 | 5.7% |
| Total | 11,373 | 100.0% |
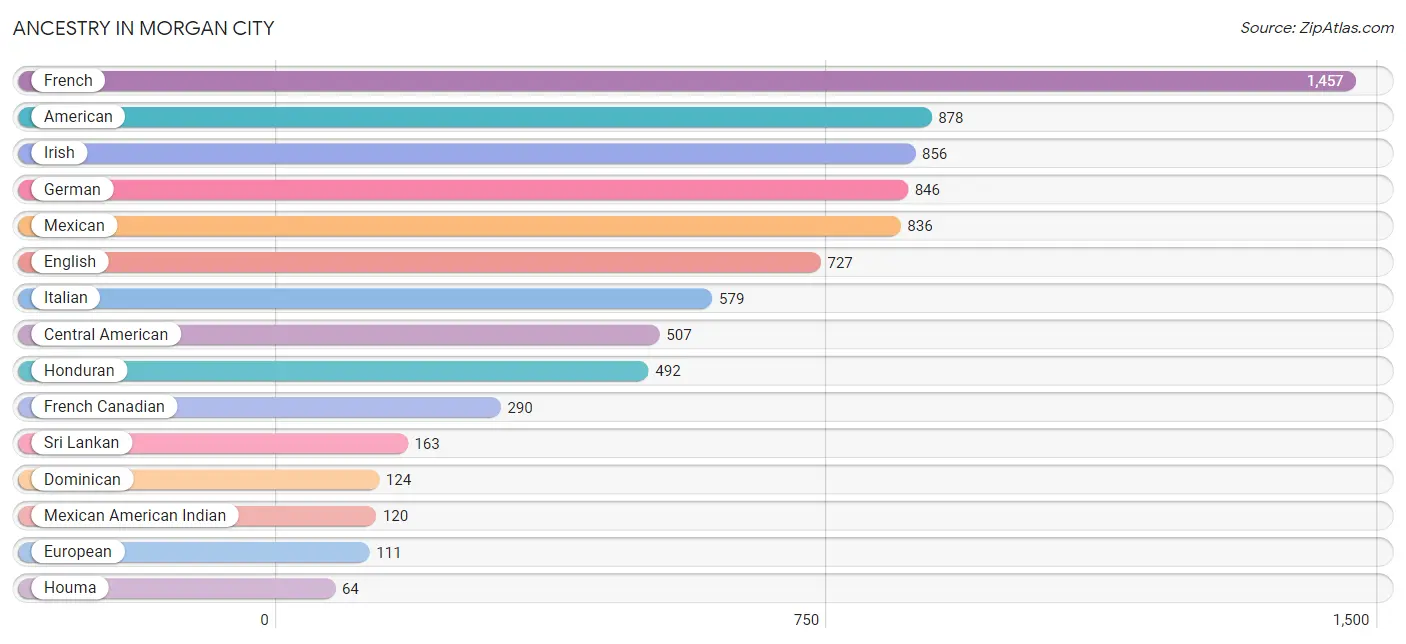
Ancestry in Morgan City
The most populous ancestries reported in Morgan City are French (1,457 | 12.8%), American (878 | 7.7%), Irish (856 | 7.5%), German (846 | 7.4%), and Mexican (836 | 7.3%), together accounting for 42.8% of all Morgan City residents.
| Ancestry | # Population | % Population |
| American | 878 | 7.7% |
| Austrian | 8 | 0.1% |
| British | 56 | 0.5% |
| Cajun | 48 | 0.4% |
| Central American | 507 | 4.5% |
| Colombian | 6 | 0.1% |
| Creek | 1 | 0.0% |
| Croatian | 8 | 0.1% |
| Cuban | 35 | 0.3% |
| Dominican | 124 | 1.1% |
| Dutch | 31 | 0.3% |
| English | 727 | 6.4% |
| European | 111 | 1.0% |
| French | 1,457 | 12.8% |
| French Canadian | 290 | 2.5% |
| German | 846 | 7.4% |
| Guatemalan | 15 | 0.1% |
| Honduran | 492 | 4.3% |
| Houma | 64 | 0.6% |
| Hungarian | 16 | 0.1% |
| Indian (Asian) | 21 | 0.2% |
| Irish | 856 | 7.5% |
| Italian | 579 | 5.1% |
| Korean | 57 | 0.5% |
| Mexican | 836 | 7.3% |
| Mexican American Indian | 120 | 1.1% |
| Native Hawaiian | 21 | 0.2% |
| Northern European | 9 | 0.1% |
| Polish | 18 | 0.2% |
| Scotch-Irish | 35 | 0.3% |
| Scottish | 21 | 0.2% |
| South American | 6 | 0.1% |
| Spaniard | 22 | 0.2% |
| Spanish | 4 | 0.0% |
| Sri Lankan | 163 | 1.4% |
| Thai | 21 | 0.2% |
| Welsh | 18 | 0.2% | View All 37 Rows |
Immigrants in Morgan City
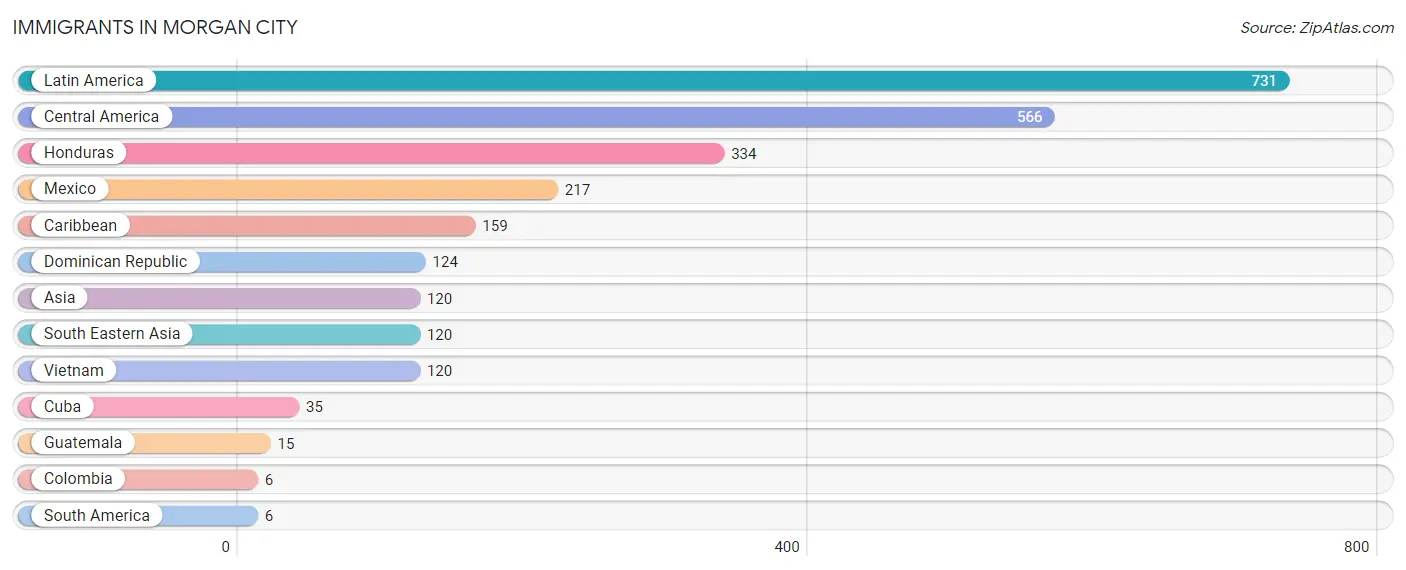
The most numerous immigrant groups reported in Morgan City came from Latin America (731 | 6.4%), Central America (566 | 5.0%), Honduras (334 | 2.9%), Mexico (217 | 1.9%), and Caribbean (159 | 1.4%), together accounting for 17.7% of all Morgan City residents.
| Immigration Origin | # Population | % Population |
| Asia | 120 | 1.1% |
| Caribbean | 159 | 1.4% |
| Central America | 566 | 5.0% |
| Colombia | 6 | 0.1% |
| Cuba | 35 | 0.3% |
| Dominican Republic | 124 | 1.1% |
| Guatemala | 15 | 0.1% |
| Honduras | 334 | 2.9% |
| Latin America | 731 | 6.4% |
| Mexico | 217 | 1.9% |
| South America | 6 | 0.1% |
| South Eastern Asia | 120 | 1.1% |
| Vietnam | 120 | 1.1% | View All 13 Rows |
Sex and Age in Morgan City
Sex and Age in Morgan City
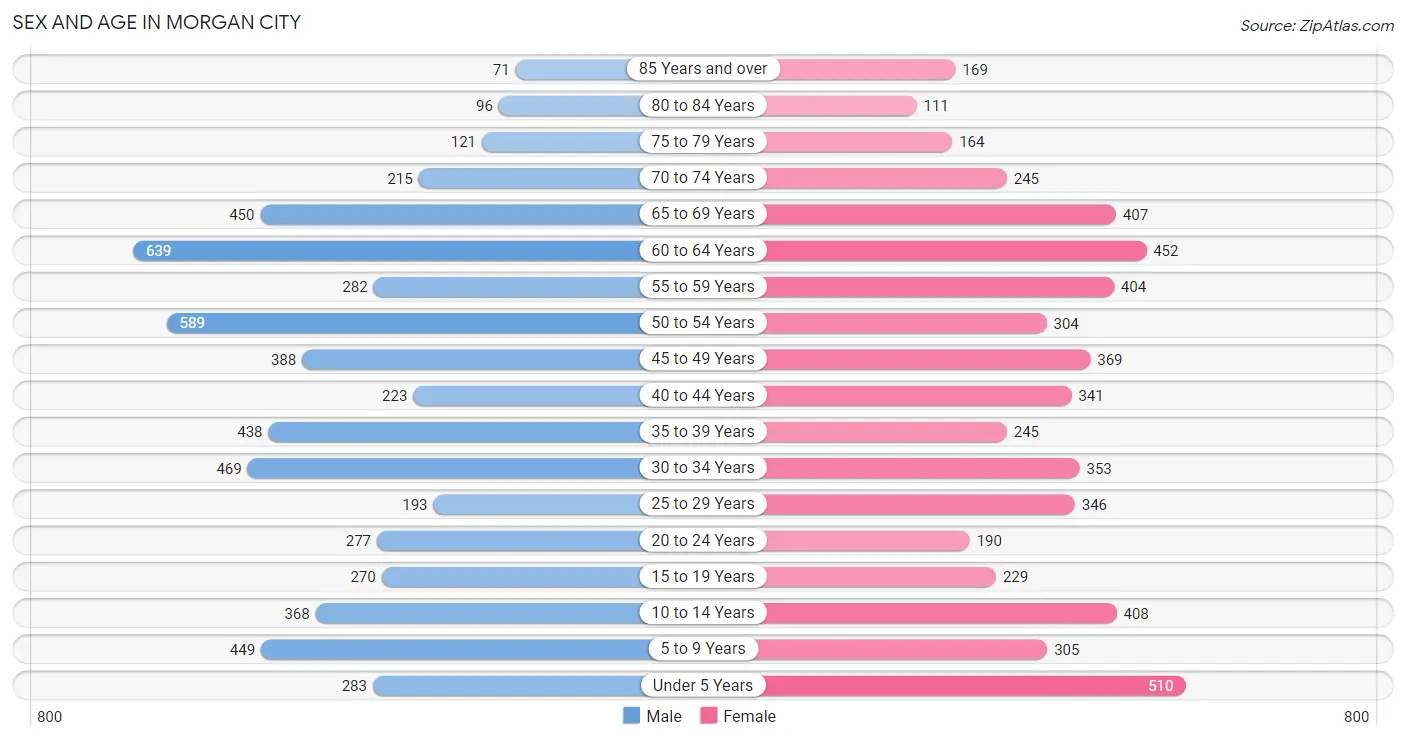
The most populous age groups in Morgan City are 60 to 64 Years (639 | 11.0%) for men and Under 5 Years (510 | 9.2%) for women.
| Age Bracket | Male | Female |
| Under 5 Years | 283 (4.9%) | 510 (9.2%) |
| 5 to 9 Years | 449 (7.7%) | 305 (5.5%) |
| 10 to 14 Years | 368 (6.3%) | 408 (7.3%) |
| 15 to 19 Years | 270 (4.6%) | 229 (4.1%) |
| 20 to 24 Years | 277 (4.8%) | 190 (3.4%) |
| 25 to 29 Years | 193 (3.3%) | 346 (6.2%) |
| 30 to 34 Years | 469 (8.1%) | 353 (6.4%) |
| 35 to 39 Years | 438 (7.5%) | 245 (4.4%) |
| 40 to 44 Years | 223 (3.8%) | 341 (6.1%) |
| 45 to 49 Years | 388 (6.7%) | 369 (6.7%) |
| 50 to 54 Years | 589 (10.1%) | 304 (5.5%) |
| 55 to 59 Years | 282 (4.8%) | 404 (7.3%) |
| 60 to 64 Years | 639 (11.0%) | 452 (8.1%) |
| 65 to 69 Years | 450 (7.7%) | 407 (7.3%) |
| 70 to 74 Years | 215 (3.7%) | 245 (4.4%) |
| 75 to 79 Years | 121 (2.1%) | 164 (2.9%) |
| 80 to 84 Years | 96 (1.7%) | 111 (2.0%) |
| 85 Years and over | 71 (1.2%) | 169 (3.0%) |
| Total | 5,821 (100.0%) | 5,552 (100.0%) |
Families and Households in Morgan City
Median Family Size in Morgan City
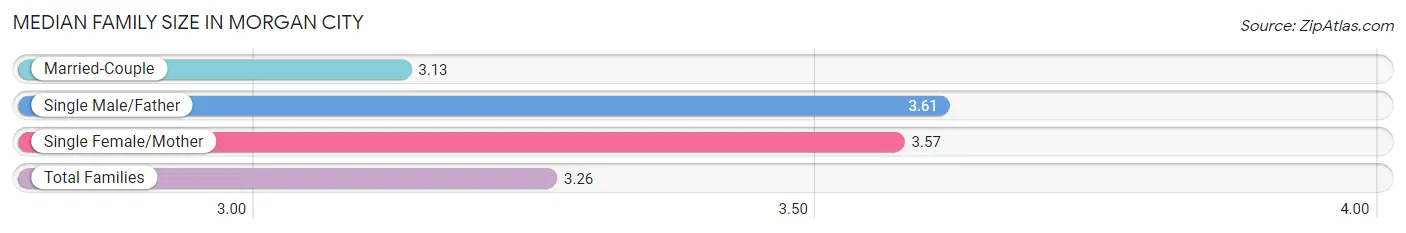
The median family size in Morgan City is 3.26 persons per family, with single male/father families (156 | 5.7%) accounting for the largest median family size of 3.61 persons per family. On the other hand, married-couple families (1,974 | 71.8%) represent the smallest median family size with 3.13 persons per family.
| Family Type | # Families | Family Size |
| Married-Couple | 1,974 (71.8%) | 3.13 |
| Single Male/Father | 156 (5.7%) | 3.61 |
| Single Female/Mother | 621 (22.6%) | 3.57 |
| Total Families | 2,751 (100.0%) | 3.26 |
Median Household Size in Morgan City
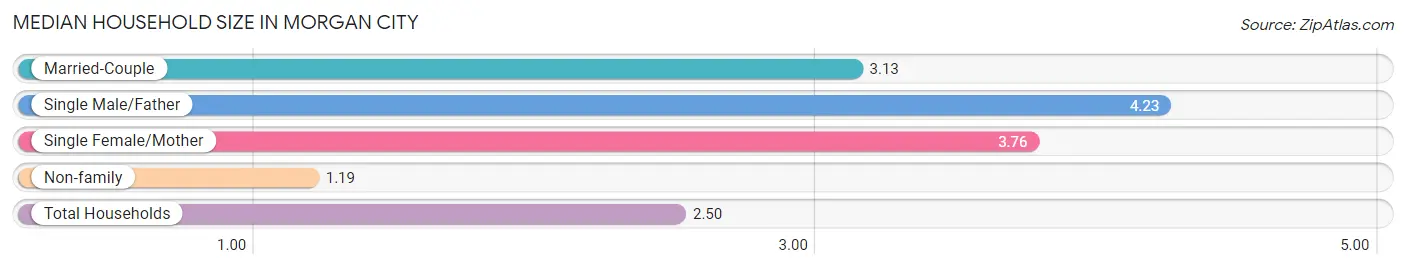
The median household size in Morgan City is 2.50 persons per household, with single male/father households (156 | 3.5%) accounting for the largest median household size of 4.23 persons per household. non-family households (1,735 | 38.7%) represent the smallest median household size with 1.19 persons per household.
| Household Type | # Households | Household Size |
| Married-Couple | 1,974 (44.0%) | 3.13 |
| Single Male/Father | 156 (3.5%) | 4.23 |
| Single Female/Mother | 621 (13.8%) | 3.76 |
| Non-family | 1,735 (38.7%) | 1.19 |
| Total Households | 4,486 (100.0%) | 2.50 |
Household Size by Marriage Status in Morgan City
Out of a total of 4,486 households in Morgan City, 2,751 (61.3%) are family households, while 1,735 (38.7%) are nonfamily households. The most numerous type of family households are 2-person households, comprising 1,215, and the most common type of nonfamily households are 1-person households, comprising 1,436.
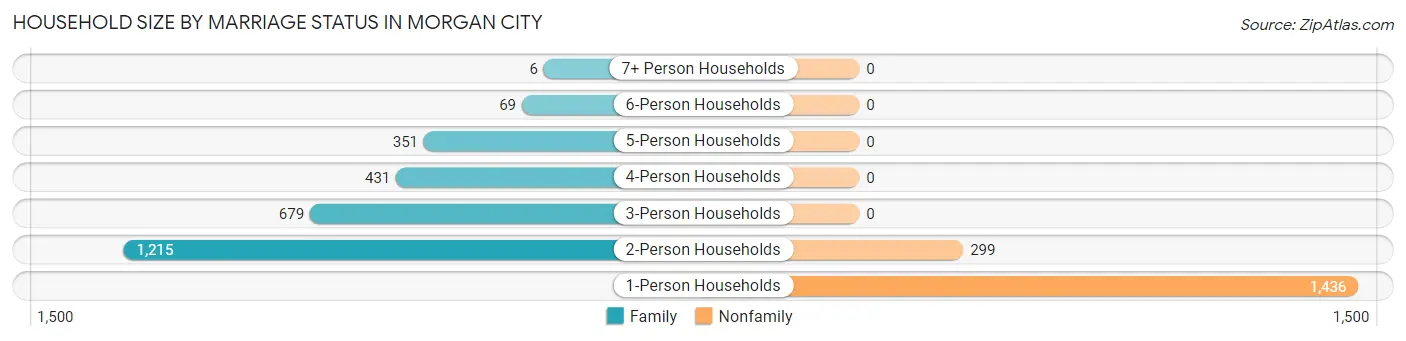
| Household Size | Family Households | Nonfamily Households |
| 1-Person Households | - | 1,436 (32.0%) |
| 2-Person Households | 1,215 (27.1%) | 299 (6.7%) |
| 3-Person Households | 679 (15.1%) | 0 (0.0%) |
| 4-Person Households | 431 (9.6%) | 0 (0.0%) |
| 5-Person Households | 351 (7.8%) | 0 (0.0%) |
| 6-Person Households | 69 (1.5%) | 0 (0.0%) |
| 7+ Person Households | 6 (0.1%) | 0 (0.0%) |
| Total | 2,751 (61.3%) | 1,735 (38.7%) |
Female Fertility in Morgan City
Fertility by Age in Morgan City
Average fertility rate in Morgan City is 30.0 births per 1,000 women. Women in the age bracket of 35 to 50 years have the highest fertility rate with 38.0 births per 1,000 women. Women in the age bracket of 35 to 50 years acount for 57.1% of all women with births.
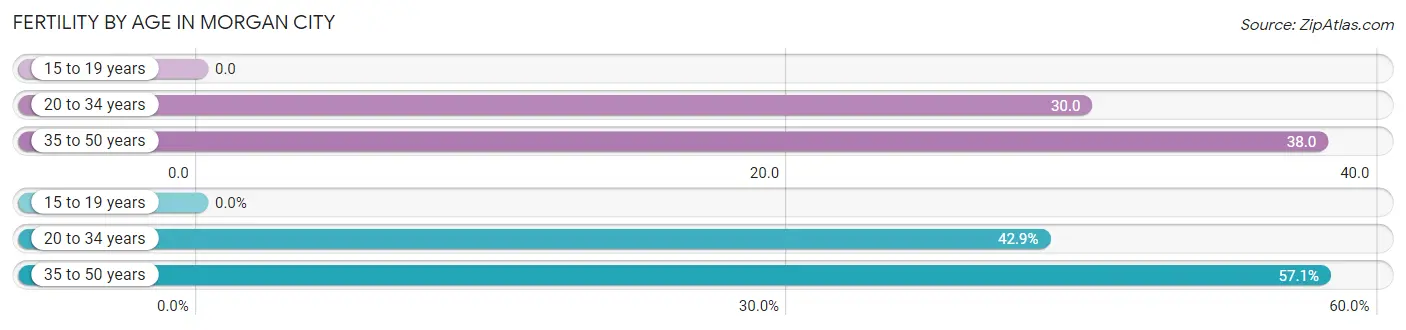
| Age Bracket | Women with Births | Births / 1,000 Women |
| 15 to 19 years | 0 (0.0%) | 0.0 |
| 20 to 34 years | 27 (42.9%) | 30.0 |
| 35 to 50 years | 36 (57.1%) | 38.0 |
| Total | 63 (100.0%) | 30.0 |
Fertility by Age by Marriage Status in Morgan City
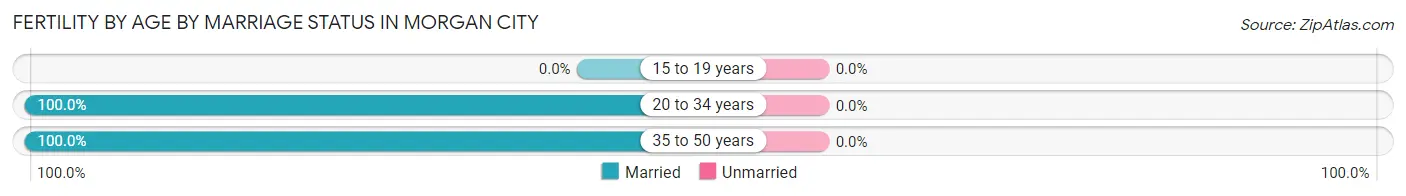
| Age Bracket | Married | Unmarried |
| 15 to 19 years | 0 (0.0%) | 0 (0.0%) |
| 20 to 34 years | 27 (100.0%) | 0 (0.0%) |
| 35 to 50 years | 36 (100.0%) | 0 (0.0%) |
| Total | 63 (100.0%) | 0 (0.0%) |
Fertility by Education in Morgan City
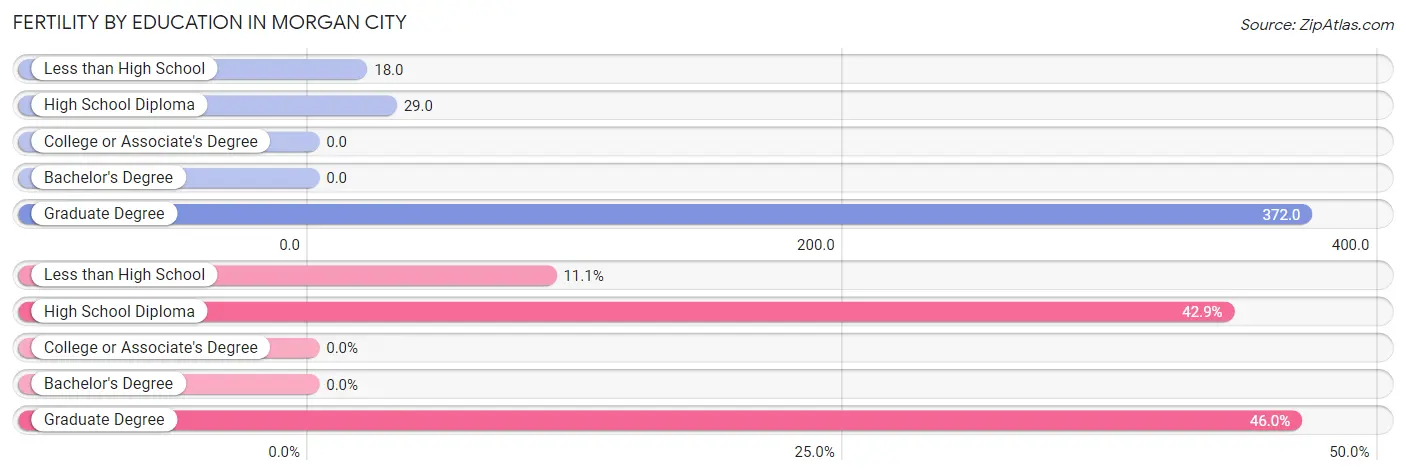
| Educational Attainment | Women with Births | Births / 1,000 Women |
| Less than High School | 7 (11.1%) | 18.0 |
| High School Diploma | 27 (42.9%) | 29.0 |
| College or Associate's Degree | 0 (0.0%) | 0.0 |
| Bachelor's Degree | 0 (0.0%) | 0.0 |
| Graduate Degree | 29 (46.0%) | 372.0 |
| Total | 63 (100.0%) | 30.0 |
Fertility by Education by Marriage Status in Morgan City
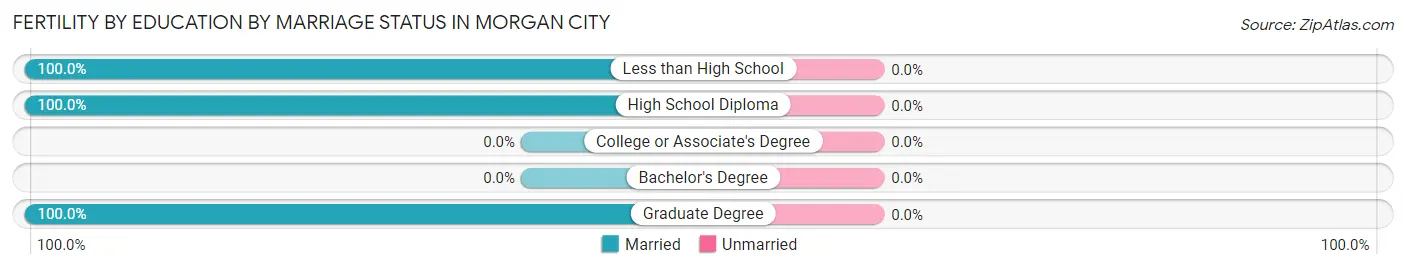
| Educational Attainment | Married | Unmarried |
| Less than High School | 7 (100.0%) | 0 (0.0%) |
| High School Diploma | 27 (100.0%) | 0 (0.0%) |
| College or Associate's Degree | 0 (0.0%) | 0 (0.0%) |
| Bachelor's Degree | 0 (0.0%) | 0 (0.0%) |
| Graduate Degree | 29 (100.0%) | 0 (0.0%) |
| Total | 63 (100.0%) | 0 (0.0%) |
Employment Characteristics in Morgan City
Employment by Class of Employer in Morgan City
Among the 4,568 employed individuals in Morgan City, private company employees (3,152 | 69.0%), local government employees (505 | 11.1%), and self-employed (incorporated) (321 | 7.0%) make up the most common classes of employment.
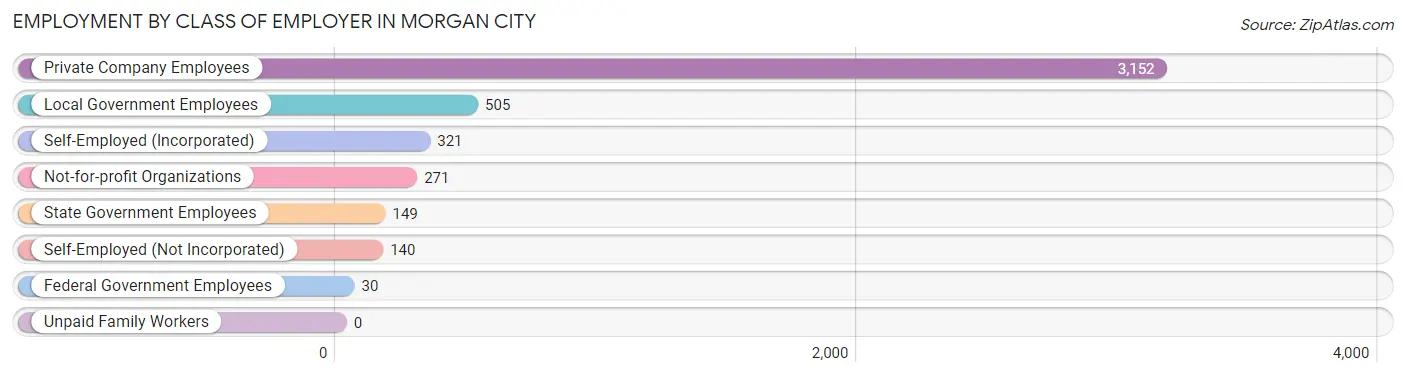
| Employer Class | # Employees | % Employees |
| Private Company Employees | 3,152 | 69.0% |
| Self-Employed (Incorporated) | 321 | 7.0% |
| Self-Employed (Not Incorporated) | 140 | 3.1% |
| Not-for-profit Organizations | 271 | 5.9% |
| Local Government Employees | 505 | 11.1% |
| State Government Employees | 149 | 3.3% |
| Federal Government Employees | 30 | 0.7% |
| Unpaid Family Workers | 0 | 0.0% |
| Total | 4,568 | 100.0% |
Employment Status by Age in Morgan City
According to the labor force statistics for Morgan City, out of the total population over 16 years of age (8,898), 56.7% or 5,045 individuals are in the labor force, with 8.3% or 419 of them unemployed. The age group with the highest labor force participation rate is 25 to 29 years, with 82.7% or 446 individuals in the labor force. Within the labor force, the 60 to 64 years age range has the highest percentage of unemployed individuals, with 30.0% or 151 of them being unemployed.
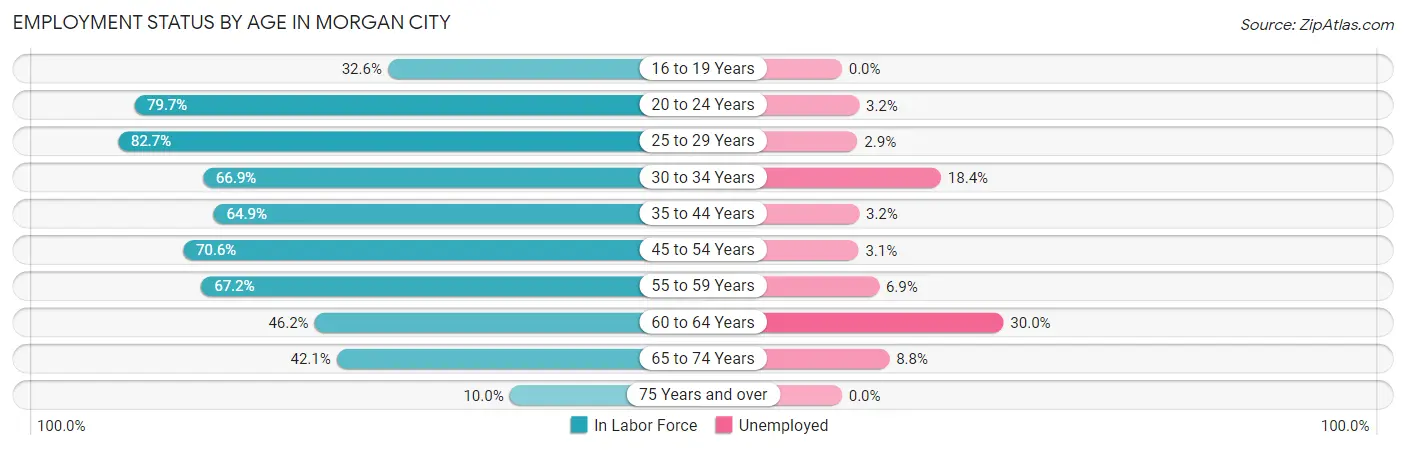
| Age Bracket | In Labor Force | Unemployed |
| 16 to 19 Years | 113 (32.6%) | 0 (0.0%) |
| 20 to 24 Years | 372 (79.7%) | 12 (3.2%) |
| 25 to 29 Years | 446 (82.7%) | 13 (2.9%) |
| 30 to 34 Years | 550 (66.9%) | 101 (18.4%) |
| 35 to 44 Years | 809 (64.9%) | 26 (3.2%) |
| 45 to 54 Years | 1,165 (70.6%) | 36 (3.1%) |
| 55 to 59 Years | 461 (67.2%) | 32 (6.9%) |
| 60 to 64 Years | 504 (46.2%) | 151 (30.0%) |
| 65 to 74 Years | 554 (42.1%) | 49 (8.8%) |
| 75 Years and over | 73 (10.0%) | 0 (0.0%) |
| Total | 5,045 (56.7%) | 419 (8.3%) |
Employment Status by Educational Attainment in Morgan City
According to labor force statistics for Morgan City, 65.2% of individuals (3,935) out of the total population between 25 and 64 years of age (6,035) are in the labor force, with 9.1% or 358 of them being unemployed. The group with the highest labor force participation rate are those with the educational attainment of bachelor's degree or higher, with 76.5% or 550 individuals in the labor force. Within the labor force, individuals with college / associate degree education have the highest percentage of unemployment, with 14.3% or 144 of them being unemployed.
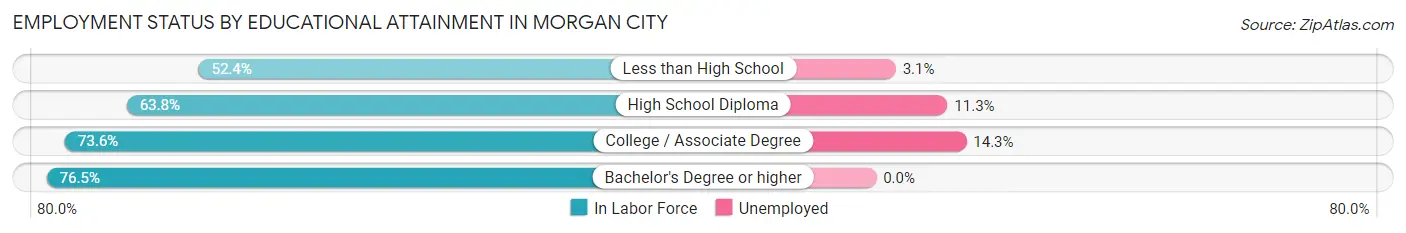
| Educational Attainment | In Labor Force | Unemployed |
| Less than High School | 646 (52.4%) | 38 (3.1%) |
| High School Diploma | 1,733 (63.8%) | 307 (11.3%) |
| College / Associate Degree | 1,006 (73.6%) | 195 (14.3%) |
| Bachelor's Degree or higher | 550 (76.5%) | 0 (0.0%) |
| Total | 3,935 (65.2%) | 549 (9.1%) |
Employment Occupations by Sex in Morgan City
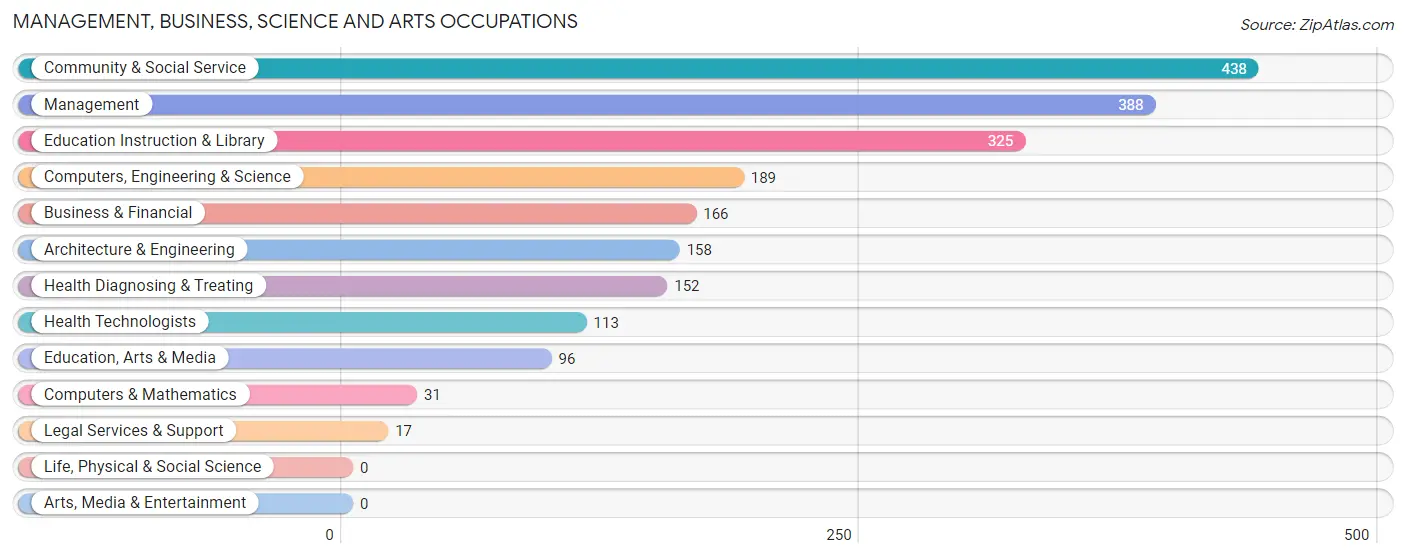
Management, Business, Science and Arts Occupations
The most common Management, Business, Science and Arts occupations in Morgan City are Community & Social Service (438 | 9.5%), Management (388 | 8.4%), Education Instruction & Library (325 | 7.0%), Computers, Engineering & Science (189 | 4.1%), and Business & Financial (166 | 3.6%).
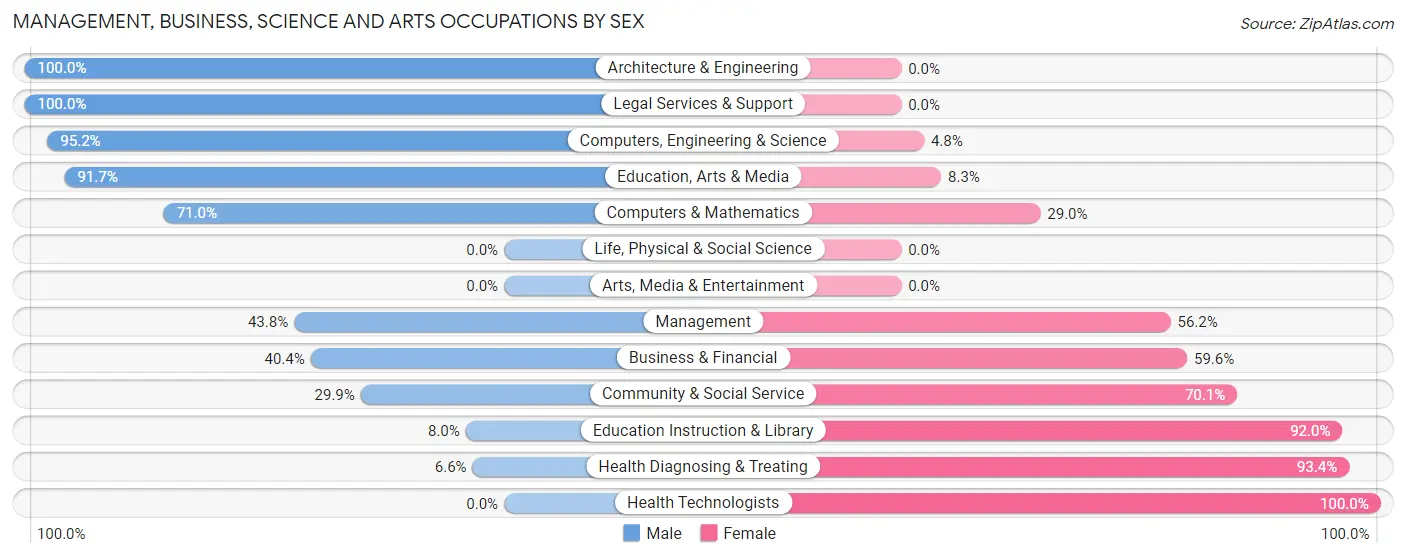
Management, Business, Science and Arts Occupations by Sex
Within the Management, Business, Science and Arts occupations in Morgan City, the most male-oriented occupations are Architecture & Engineering (100.0%), Legal Services & Support (100.0%), and Computers, Engineering & Science (95.2%), while the most female-oriented occupations are Health Technologists (100.0%), Health Diagnosing & Treating (93.4%), and Education Instruction & Library (92.0%).
| Occupation | Male | Female |
| Management | 170 (43.8%) | 218 (56.2%) |
| Business & Financial | 67 (40.4%) | 99 (59.6%) |
| Computers, Engineering & Science | 180 (95.2%) | 9 (4.8%) |
| Computers & Mathematics | 22 (71.0%) | 9 (29.0%) |
| Architecture & Engineering | 158 (100.0%) | 0 (0.0%) |
| Life, Physical & Social Science | 0 (0.0%) | 0 (0.0%) |
| Community & Social Service | 131 (29.9%) | 307 (70.1%) |
| Education, Arts & Media | 88 (91.7%) | 8 (8.3%) |
| Legal Services & Support | 17 (100.0%) | 0 (0.0%) |
| Education Instruction & Library | 26 (8.0%) | 299 (92.0%) |
| Arts, Media & Entertainment | 0 (0.0%) | 0 (0.0%) |
| Health Diagnosing & Treating | 10 (6.6%) | 142 (93.4%) |
| Health Technologists | 0 (0.0%) | 113 (100.0%) |
| Total (Category) | 558 (41.9%) | 775 (58.1%) |
| Total (Overall) | 2,419 (52.3%) | 2,209 (47.7%) |
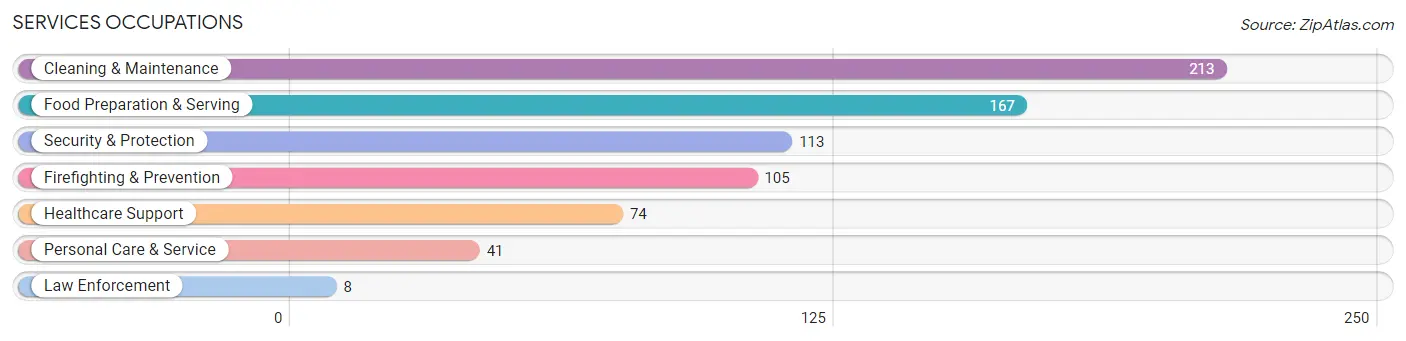
Services Occupations
The most common Services occupations in Morgan City are Cleaning & Maintenance (213 | 4.6%), Food Preparation & Serving (167 | 3.6%), Security & Protection (113 | 2.4%), Firefighting & Prevention (105 | 2.3%), and Healthcare Support (74 | 1.6%).
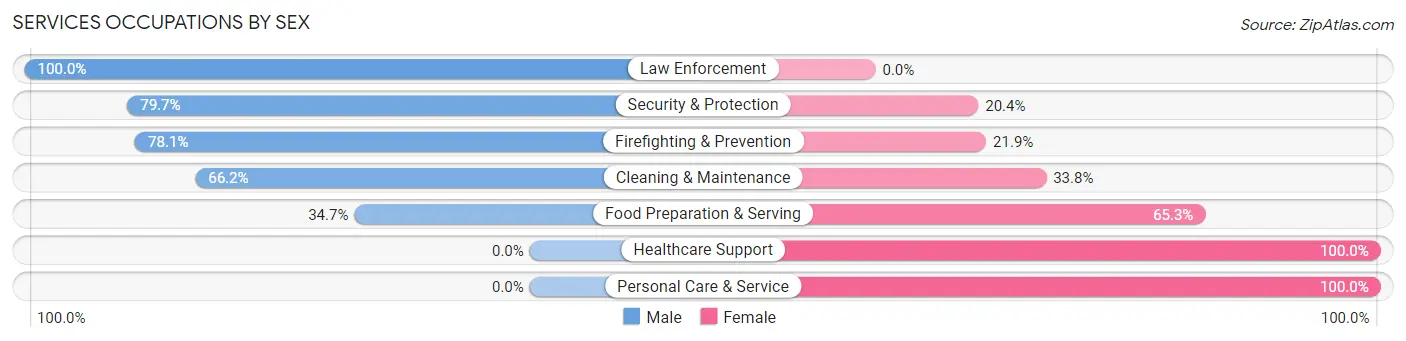
Services Occupations by Sex
Within the Services occupations in Morgan City, the most male-oriented occupations are Law Enforcement (100.0%), Security & Protection (79.6%), and Firefighting & Prevention (78.1%), while the most female-oriented occupations are Healthcare Support (100.0%), Personal Care & Service (100.0%), and Food Preparation & Serving (65.3%).
| Occupation | Male | Female |
| Healthcare Support | 0 (0.0%) | 74 (100.0%) |
| Security & Protection | 90 (79.6%) | 23 (20.3%) |
| Firefighting & Prevention | 82 (78.1%) | 23 (21.9%) |
| Law Enforcement | 8 (100.0%) | 0 (0.0%) |
| Food Preparation & Serving | 58 (34.7%) | 109 (65.3%) |
| Cleaning & Maintenance | 141 (66.2%) | 72 (33.8%) |
| Personal Care & Service | 0 (0.0%) | 41 (100.0%) |
| Total (Category) | 289 (47.5%) | 319 (52.5%) |
| Total (Overall) | 2,419 (52.3%) | 2,209 (47.7%) |
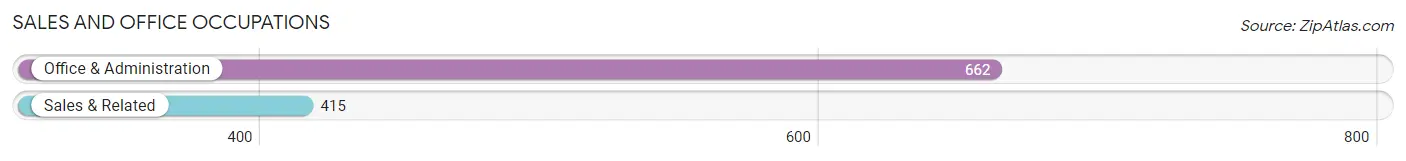
Sales and Office Occupations
The most common Sales and Office occupations in Morgan City are Office & Administration (662 | 14.3%), and Sales & Related (415 | 9.0%).
Sales and Office Occupations by Sex
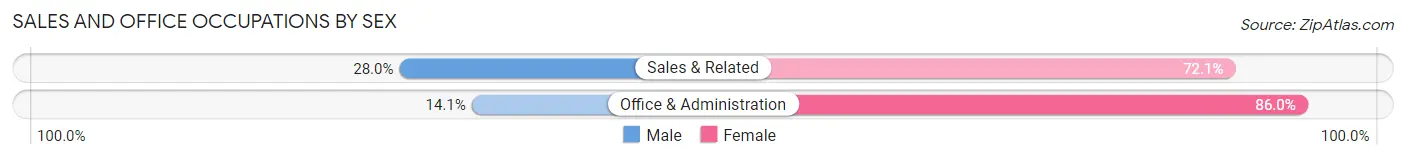
| Occupation | Male | Female |
| Sales & Related | 116 (28.0%) | 299 (72.1%) |
| Office & Administration | 93 (14.1%) | 569 (86.0%) |
| Total (Category) | 209 (19.4%) | 868 (80.6%) |
| Total (Overall) | 2,419 (52.3%) | 2,209 (47.7%) |
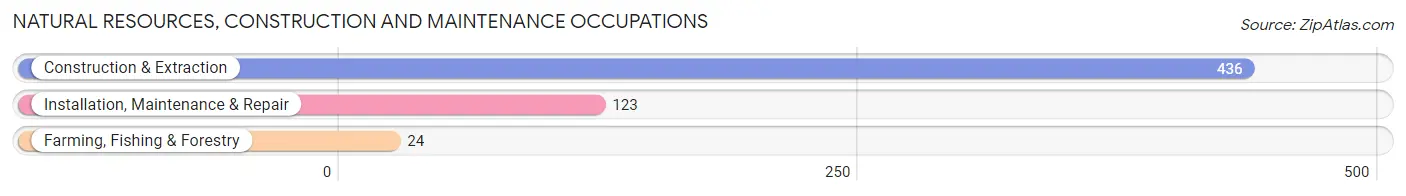
Natural Resources, Construction and Maintenance Occupations
The most common Natural Resources, Construction and Maintenance occupations in Morgan City are Construction & Extraction (436 | 9.4%), Installation, Maintenance & Repair (123 | 2.7%), and Farming, Fishing & Forestry (24 | 0.5%).
Natural Resources, Construction and Maintenance Occupations by Sex
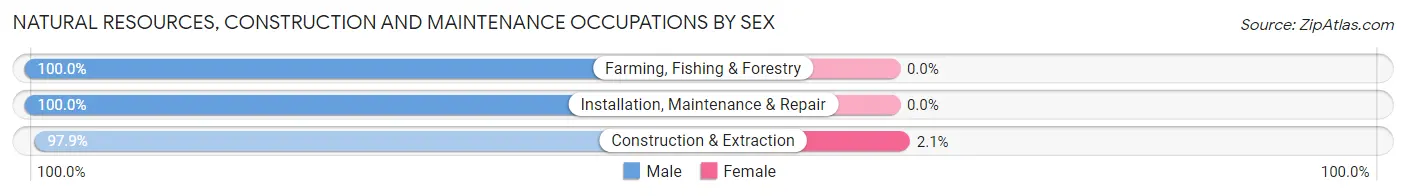
| Occupation | Male | Female |
| Farming, Fishing & Forestry | 24 (100.0%) | 0 (0.0%) |
| Construction & Extraction | 427 (97.9%) | 9 (2.1%) |
| Installation, Maintenance & Repair | 123 (100.0%) | 0 (0.0%) |
| Total (Category) | 574 (98.5%) | 9 (1.5%) |
| Total (Overall) | 2,419 (52.3%) | 2,209 (47.7%) |
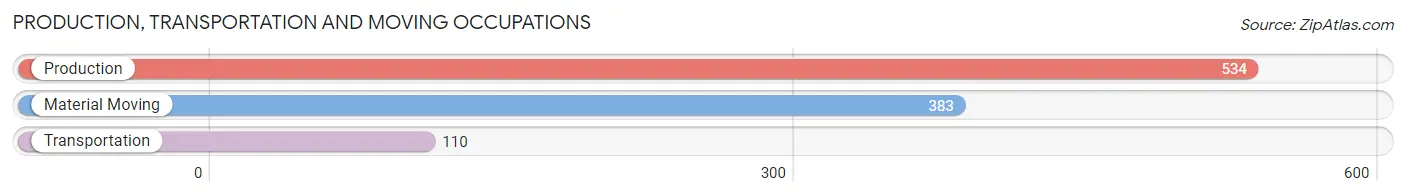
Production, Transportation and Moving Occupations
The most common Production, Transportation and Moving occupations in Morgan City are Production (534 | 11.5%), Material Moving (383 | 8.3%), and Transportation (110 | 2.4%).
Production, Transportation and Moving Occupations by Sex
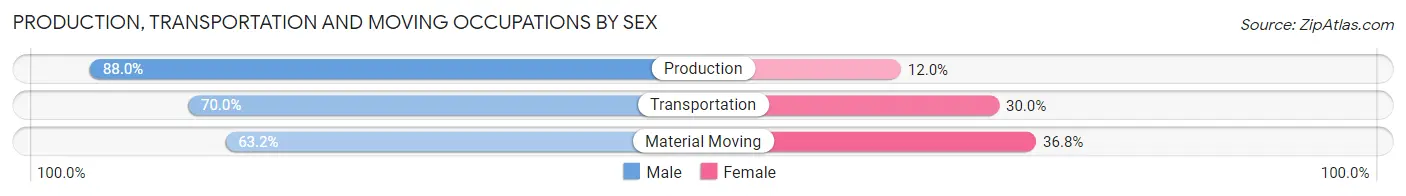
| Occupation | Male | Female |
| Production | 470 (88.0%) | 64 (12.0%) |
| Transportation | 77 (70.0%) | 33 (30.0%) |
| Material Moving | 242 (63.2%) | 141 (36.8%) |
| Total (Category) | 789 (76.8%) | 238 (23.2%) |
| Total (Overall) | 2,419 (52.3%) | 2,209 (47.7%) |
Employment Industries by Sex in Morgan City
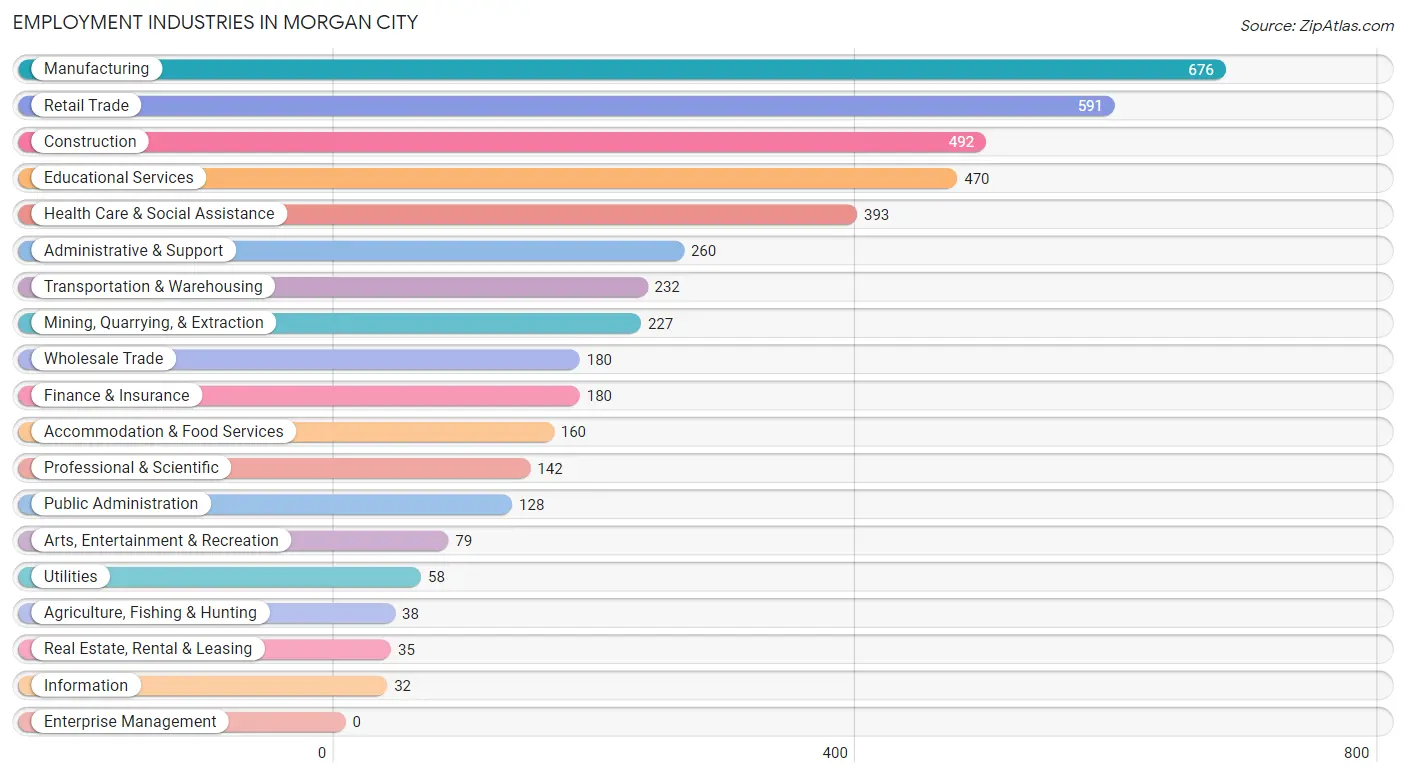
Employment Industries in Morgan City
The major employment industries in Morgan City include Manufacturing (676 | 14.6%), Retail Trade (591 | 12.8%), Construction (492 | 10.6%), Educational Services (470 | 10.2%), and Health Care & Social Assistance (393 | 8.5%).
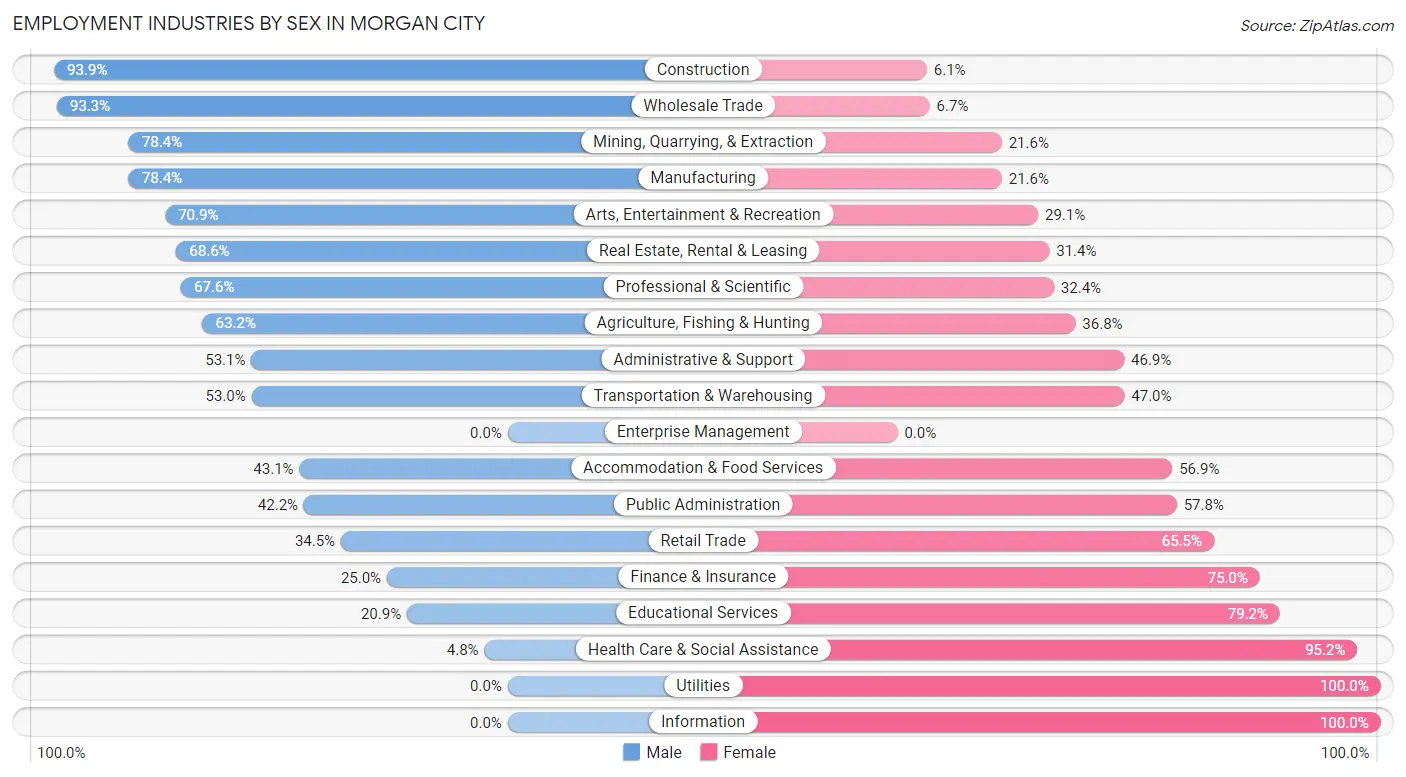
Employment Industries by Sex in Morgan City
The Morgan City industries that see more men than women are Construction (93.9%), Wholesale Trade (93.3%), and Mining, Quarrying, & Extraction (78.4%), whereas the industries that tend to have a higher number of women are Utilities (100.0%), Information (100.0%), and Health Care & Social Assistance (95.2%).
| Industry | Male | Female |
| Agriculture, Fishing & Hunting | 24 (63.2%) | 14 (36.8%) |
| Mining, Quarrying, & Extraction | 178 (78.4%) | 49 (21.6%) |
| Construction | 462 (93.9%) | 30 (6.1%) |
| Manufacturing | 530 (78.4%) | 146 (21.6%) |
| Wholesale Trade | 168 (93.3%) | 12 (6.7%) |
| Retail Trade | 204 (34.5%) | 387 (65.5%) |
| Transportation & Warehousing | 123 (53.0%) | 109 (47.0%) |
| Utilities | 0 (0.0%) | 58 (100.0%) |
| Information | 0 (0.0%) | 32 (100.0%) |
| Finance & Insurance | 45 (25.0%) | 135 (75.0%) |
| Real Estate, Rental & Leasing | 24 (68.6%) | 11 (31.4%) |
| Professional & Scientific | 96 (67.6%) | 46 (32.4%) |
| Enterprise Management | 0 (0.0%) | 0 (0.0%) |
| Administrative & Support | 138 (53.1%) | 122 (46.9%) |
| Educational Services | 98 (20.8%) | 372 (79.1%) |
| Health Care & Social Assistance | 19 (4.8%) | 374 (95.2%) |
| Arts, Entertainment & Recreation | 56 (70.9%) | 23 (29.1%) |
| Accommodation & Food Services | 69 (43.1%) | 91 (56.9%) |
| Public Administration | 54 (42.2%) | 74 (57.8%) |
| Total | 2,419 (52.3%) | 2,209 (47.7%) |
Education in Morgan City
School Enrollment in Morgan City
The most common levels of schooling among the 2,155 students in Morgan City are middle school (644 | 29.9%), elementary school (528 | 24.5%), and high school (503 | 23.3%).
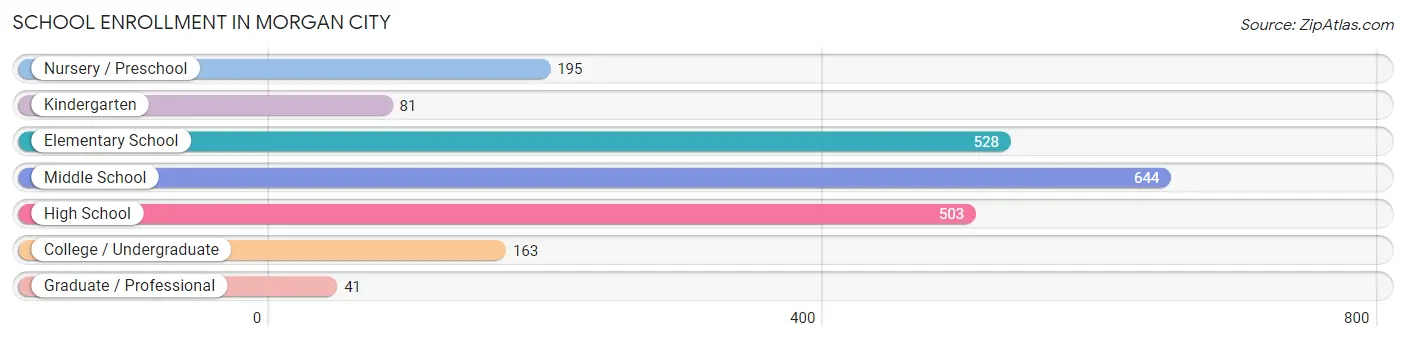
| School Level | # Students | % Students |
| Nursery / Preschool | 195 | 9.0% |
| Kindergarten | 81 | 3.8% |
| Elementary School | 528 | 24.5% |
| Middle School | 644 | 29.9% |
| High School | 503 | 23.3% |
| College / Undergraduate | 163 | 7.6% |
| Graduate / Professional | 41 | 1.9% |
| Total | 2,155 | 100.0% |
School Enrollment by Age by Funding Source in Morgan City
Out of a total of 2,155 students who are enrolled in schools in Morgan City, 394 (18.3%) attend a private institution, while the remaining 1,761 (81.7%) are enrolled in public schools. The age group of 3 to 4 year olds has the highest likelihood of being enrolled in private schools, with 107 (54.9% in the age bracket) enrolled. Conversely, the age group of 20 to 24 year olds has the lowest likelihood of being enrolled in a private school, with 79 (100.0% in the age bracket) attending a public institution.
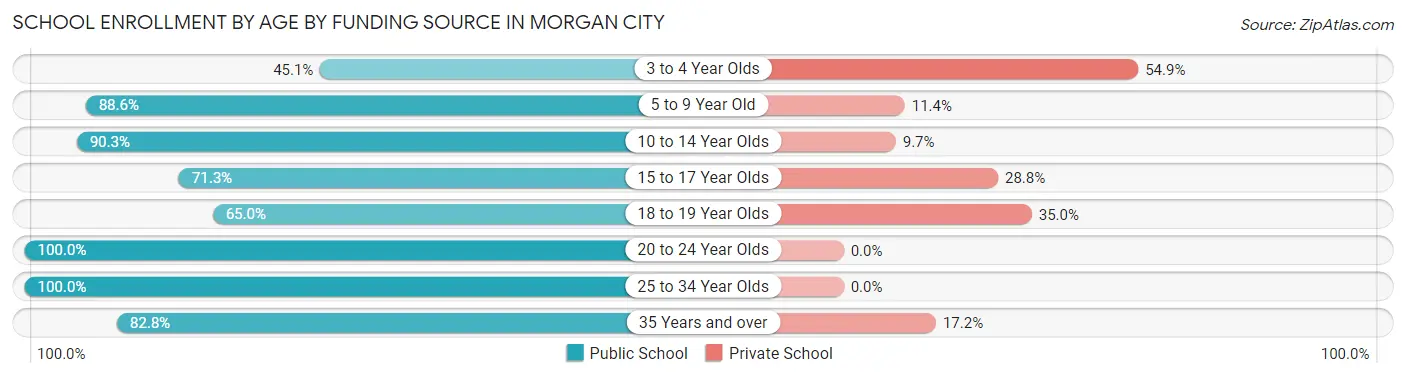
| Age Bracket | Public School | Private School |
| 3 to 4 Year Olds | 88 (45.1%) | 107 (54.9%) |
| 5 to 9 Year Old | 521 (88.6%) | 67 (11.4%) |
| 10 to 14 Year Olds | 679 (90.3%) | 73 (9.7%) |
| 15 to 17 Year Olds | 223 (71.3%) | 90 (28.7%) |
| 18 to 19 Year Olds | 76 (65.0%) | 41 (35.0%) |
| 20 to 24 Year Olds | 79 (100.0%) | 0 (0.0%) |
| 25 to 34 Year Olds | 18 (100.0%) | 0 (0.0%) |
| 35 Years and over | 77 (82.8%) | 16 (17.2%) |
| Total | 1,761 (81.7%) | 394 (18.3%) |
Educational Attainment by Field of Study in Morgan City
Education (281 | 26.5%), business (198 | 18.6%), liberal arts & history (170 | 16.0%), science & technology (111 | 10.4%), and psychology (79 | 7.4%) are the most common fields of study among 1,062 individuals in Morgan City who have obtained a bachelor's degree or higher.
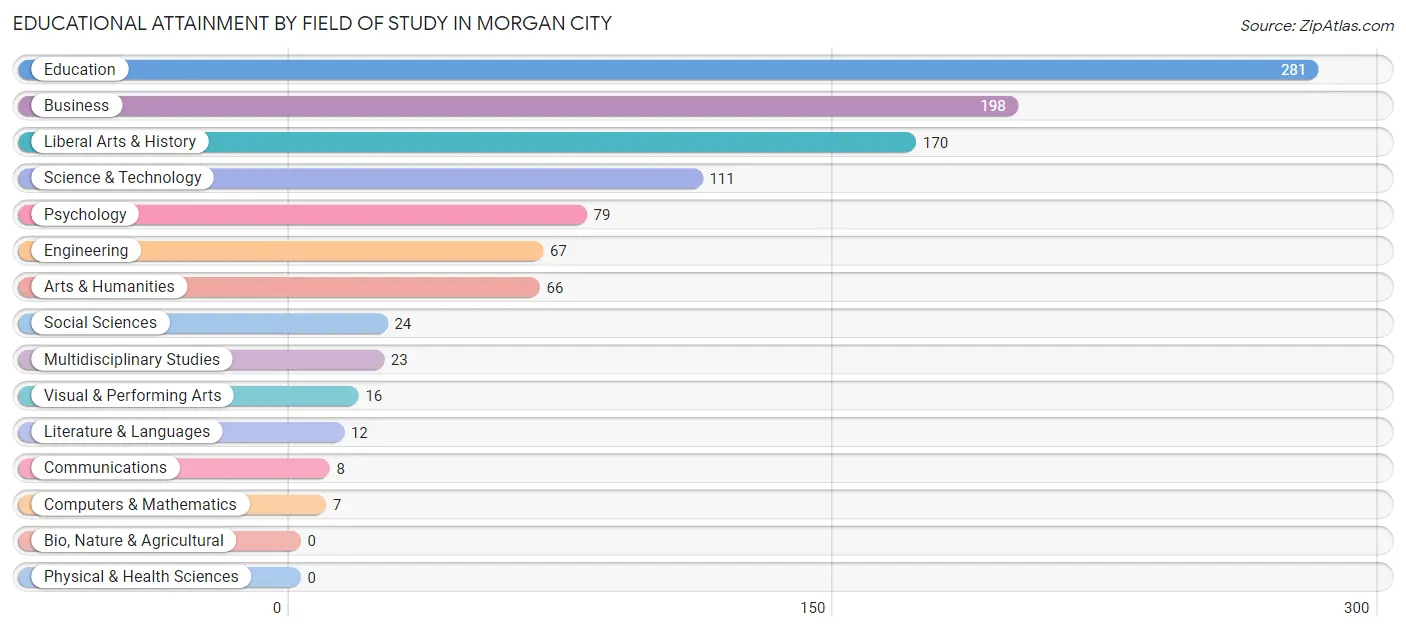
| Field of Study | # Graduates | % Graduates |
| Computers & Mathematics | 7 | 0.7% |
| Bio, Nature & Agricultural | 0 | 0.0% |
| Physical & Health Sciences | 0 | 0.0% |
| Psychology | 79 | 7.4% |
| Social Sciences | 24 | 2.3% |
| Engineering | 67 | 6.3% |
| Multidisciplinary Studies | 23 | 2.2% |
| Science & Technology | 111 | 10.4% |
| Business | 198 | 18.6% |
| Education | 281 | 26.5% |
| Literature & Languages | 12 | 1.1% |
| Liberal Arts & History | 170 | 16.0% |
| Visual & Performing Arts | 16 | 1.5% |
| Communications | 8 | 0.7% |
| Arts & Humanities | 66 | 6.2% |
| Total | 1,062 | 100.0% |
Transportation & Commute in Morgan City
Vehicle Availability by Sex in Morgan City
The most prevalent vehicle ownership categories in Morgan City are males with 2 vehicles (1,116, accounting for 46.6%) and females with 2 vehicles (842, making up 51.4%).
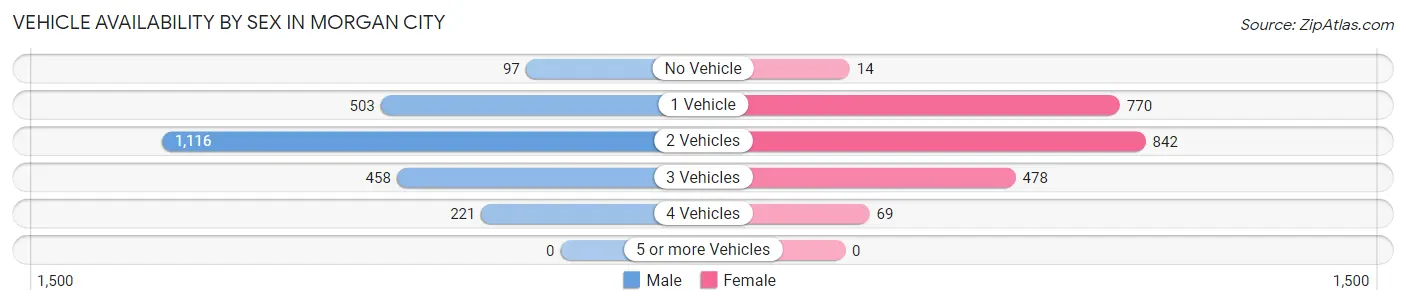
| Vehicles Available | Male | Female |
| No Vehicle | 97 (4.1%) | 14 (0.6%) |
| 1 Vehicle | 503 (21.0%) | 770 (35.4%) |
| 2 Vehicles | 1,116 (46.6%) | 842 (38.8%) |
| 3 Vehicles | 458 (19.1%) | 478 (22.0%) |
| 4 Vehicles | 221 (9.2%) | 69 (3.2%) |
| 5 or more Vehicles | 0 (0.0%) | 0 (0.0%) |
| Total | 2,395 (100.0%) | 2,173 (100.0%) |
Commute Time in Morgan City
The most frequently occuring commute durations in Morgan City are 5 to 9 minutes (1,210 commuters, 26.9%), 10 to 14 minutes (927 commuters, 20.6%), and 15 to 19 minutes (810 commuters, 18.0%).
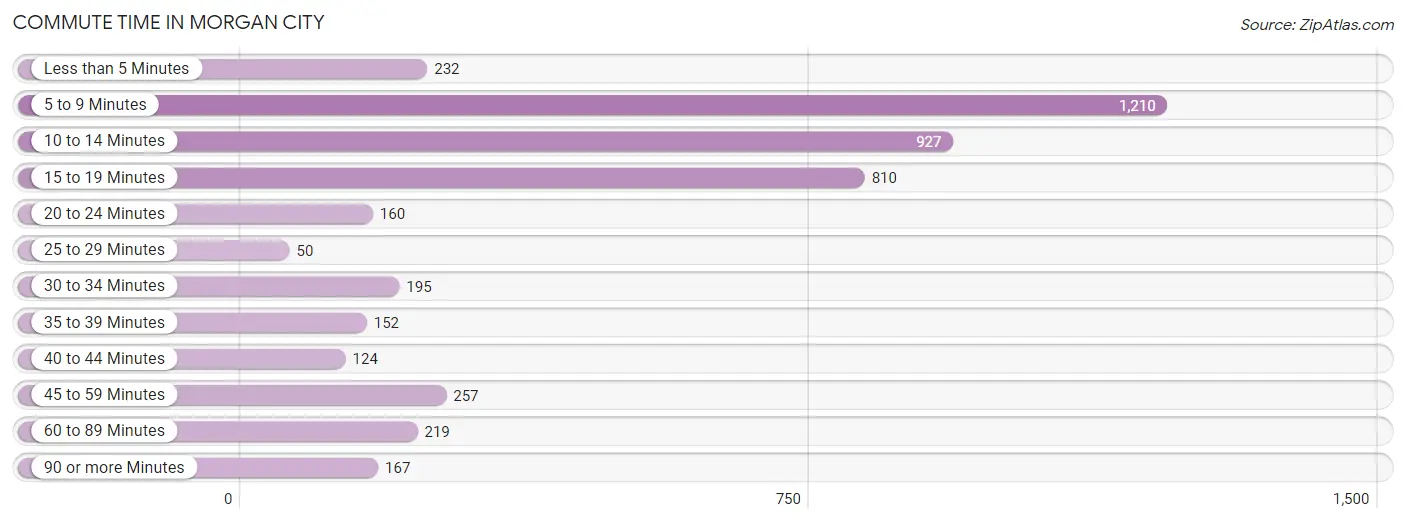
| Commute Time | # Commuters | % Commuters |
| Less than 5 Minutes | 232 | 5.1% |
| 5 to 9 Minutes | 1,210 | 26.9% |
| 10 to 14 Minutes | 927 | 20.6% |
| 15 to 19 Minutes | 810 | 18.0% |
| 20 to 24 Minutes | 160 | 3.5% |
| 25 to 29 Minutes | 50 | 1.1% |
| 30 to 34 Minutes | 195 | 4.3% |
| 35 to 39 Minutes | 152 | 3.4% |
| 40 to 44 Minutes | 124 | 2.8% |
| 45 to 59 Minutes | 257 | 5.7% |
| 60 to 89 Minutes | 219 | 4.9% |
| 90 or more Minutes | 167 | 3.7% |
Commute Time by Sex in Morgan City
The most common commute times in Morgan City are 15 to 19 minutes (485 commuters, 20.6%) for males and 5 to 9 minutes (790 commuters, 36.7%) for females.
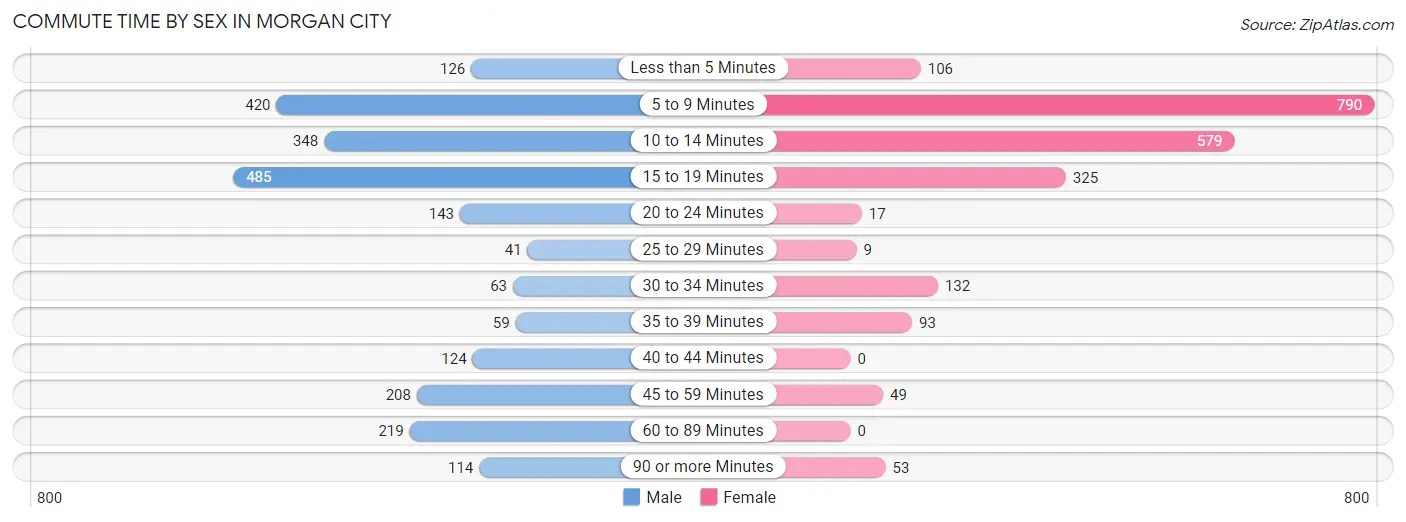
| Commute Time | Male | Female |
| Less than 5 Minutes | 126 (5.4%) | 106 (4.9%) |
| 5 to 9 Minutes | 420 (17.9%) | 790 (36.7%) |
| 10 to 14 Minutes | 348 (14.8%) | 579 (26.9%) |
| 15 to 19 Minutes | 485 (20.6%) | 325 (15.1%) |
| 20 to 24 Minutes | 143 (6.1%) | 17 (0.8%) |
| 25 to 29 Minutes | 41 (1.7%) | 9 (0.4%) |
| 30 to 34 Minutes | 63 (2.7%) | 132 (6.1%) |
| 35 to 39 Minutes | 59 (2.5%) | 93 (4.3%) |
| 40 to 44 Minutes | 124 (5.3%) | 0 (0.0%) |
| 45 to 59 Minutes | 208 (8.8%) | 49 (2.3%) |
| 60 to 89 Minutes | 219 (9.3%) | 0 (0.0%) |
| 90 or more Minutes | 114 (4.9%) | 53 (2.5%) |
Time of Departure to Work by Sex in Morgan City
The most frequent times of departure to work in Morgan City are 7:00 AM to 7:29 AM (624, 26.6%) for males and 7:00 AM to 7:29 AM (494, 22.9%) for females.
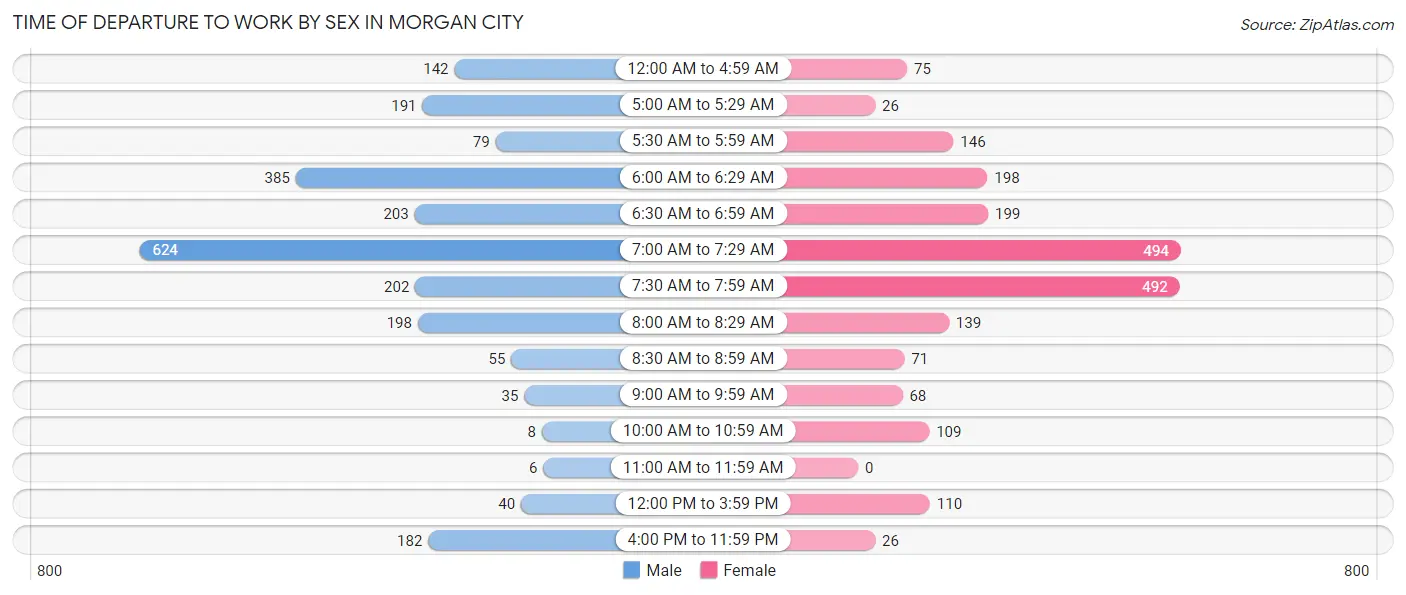
| Time of Departure | Male | Female |
| 12:00 AM to 4:59 AM | 142 (6.0%) | 75 (3.5%) |
| 5:00 AM to 5:29 AM | 191 (8.1%) | 26 (1.2%) |
| 5:30 AM to 5:59 AM | 79 (3.4%) | 146 (6.8%) |
| 6:00 AM to 6:29 AM | 385 (16.4%) | 198 (9.2%) |
| 6:30 AM to 6:59 AM | 203 (8.6%) | 199 (9.2%) |
| 7:00 AM to 7:29 AM | 624 (26.6%) | 494 (22.9%) |
| 7:30 AM to 7:59 AM | 202 (8.6%) | 492 (22.9%) |
| 8:00 AM to 8:29 AM | 198 (8.4%) | 139 (6.5%) |
| 8:30 AM to 8:59 AM | 55 (2.3%) | 71 (3.3%) |
| 9:00 AM to 9:59 AM | 35 (1.5%) | 68 (3.2%) |
| 10:00 AM to 10:59 AM | 8 (0.3%) | 109 (5.1%) |
| 11:00 AM to 11:59 AM | 6 (0.3%) | 0 (0.0%) |
| 12:00 PM to 3:59 PM | 40 (1.7%) | 110 (5.1%) |
| 4:00 PM to 11:59 PM | 182 (7.7%) | 26 (1.2%) |
| Total | 2,350 (100.0%) | 2,153 (100.0%) |
Housing Occupancy in Morgan City
Occupancy by Ownership in Morgan City
Of the total 4,486 dwellings in Morgan City, owner-occupied units account for 2,702 (60.2%), while renter-occupied units make up 1,784 (39.8%).
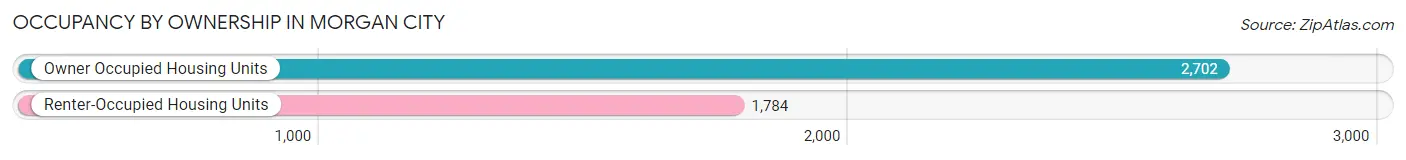
| Occupancy | # Housing Units | % Housing Units |
| Owner Occupied Housing Units | 2,702 | 60.2% |
| Renter-Occupied Housing Units | 1,784 | 39.8% |
| Total Occupied Housing Units | 4,486 | 100.0% |
Occupancy by Household Size in Morgan City
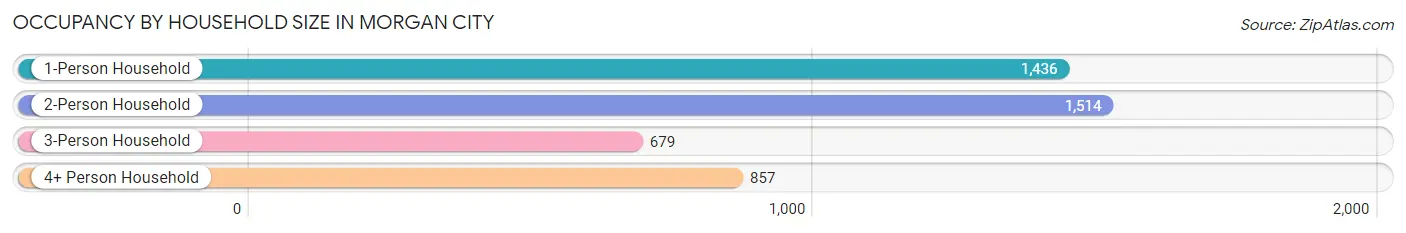
| Household Size | # Housing Units | % Housing Units |
| 1-Person Household | 1,436 | 32.0% |
| 2-Person Household | 1,514 | 33.8% |
| 3-Person Household | 679 | 15.1% |
| 4+ Person Household | 857 | 19.1% |
| Total Housing Units | 4,486 | 100.0% |
Occupancy by Ownership by Household Size in Morgan City
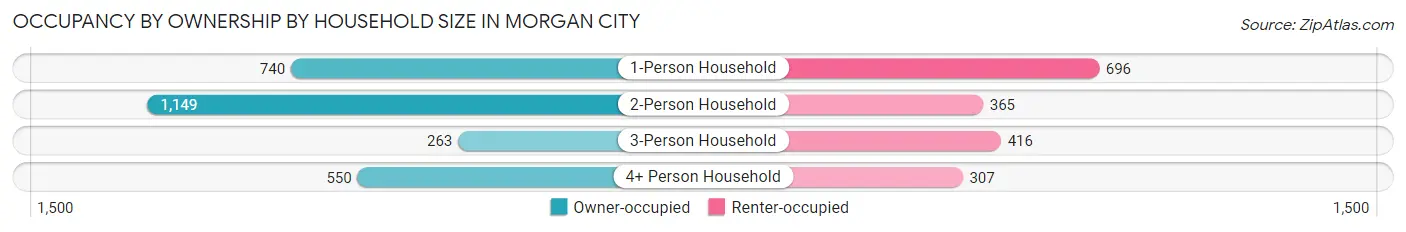
| Household Size | Owner-occupied | Renter-occupied |
| 1-Person Household | 740 (51.5%) | 696 (48.5%) |
| 2-Person Household | 1,149 (75.9%) | 365 (24.1%) |
| 3-Person Household | 263 (38.7%) | 416 (61.3%) |
| 4+ Person Household | 550 (64.2%) | 307 (35.8%) |
| Total Housing Units | 2,702 (60.2%) | 1,784 (39.8%) |
Occupancy by Educational Attainment in Morgan City
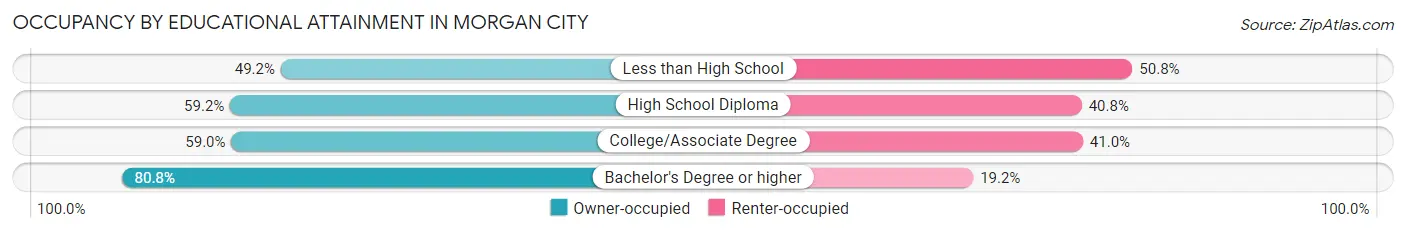
| Household Size | Owner-occupied | Renter-occupied |
| Less than High School | 462 (49.2%) | 477 (50.8%) |
| High School Diploma | 1,138 (59.2%) | 783 (40.8%) |
| College/Associate Degree | 573 (59.0%) | 398 (41.0%) |
| Bachelor's Degree or higher | 529 (80.8%) | 126 (19.2%) |
Occupancy by Age of Householder in Morgan City
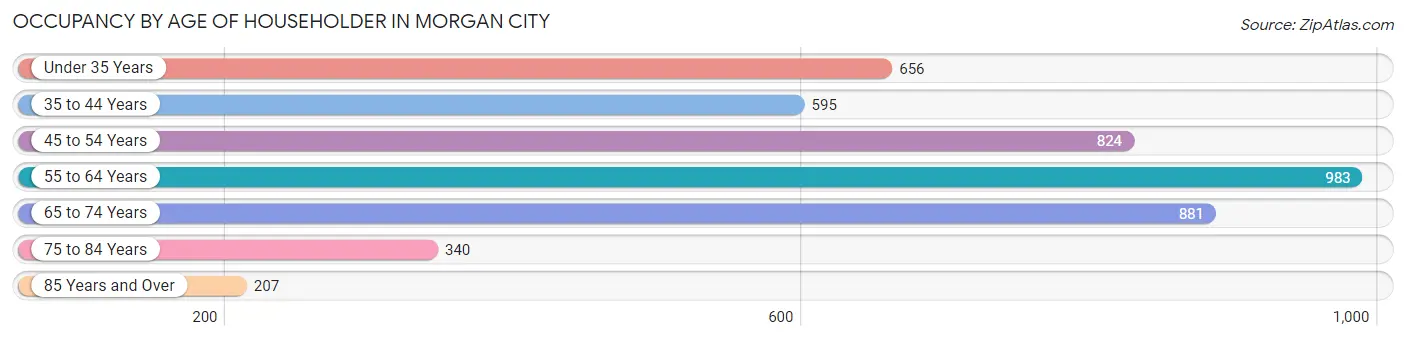
| Age Bracket | # Households | % Households |
| Under 35 Years | 656 | 14.6% |
| 35 to 44 Years | 595 | 13.3% |
| 45 to 54 Years | 824 | 18.4% |
| 55 to 64 Years | 983 | 21.9% |
| 65 to 74 Years | 881 | 19.6% |
| 75 to 84 Years | 340 | 7.6% |
| 85 Years and Over | 207 | 4.6% |
| Total | 4,486 | 100.0% |
Housing Finances in Morgan City
Median Income by Occupancy in Morgan City
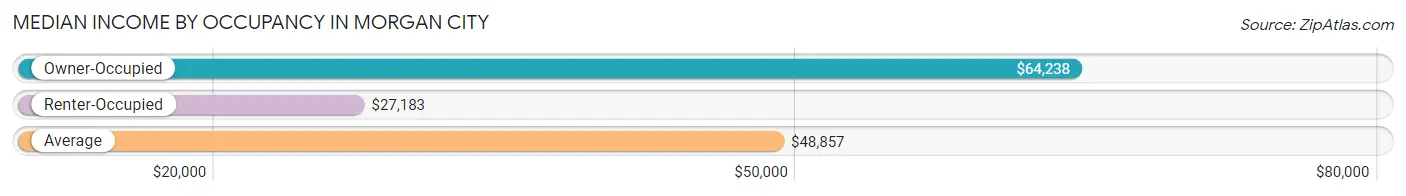
| Occupancy Type | # Households | Median Income |
| Owner-Occupied | 2,702 (60.2%) | $64,238 |
| Renter-Occupied | 1,784 (39.8%) | $27,183 |
| Average | 4,486 (100.0%) | $48,857 |
Occupancy by Householder Income Bracket in Morgan City
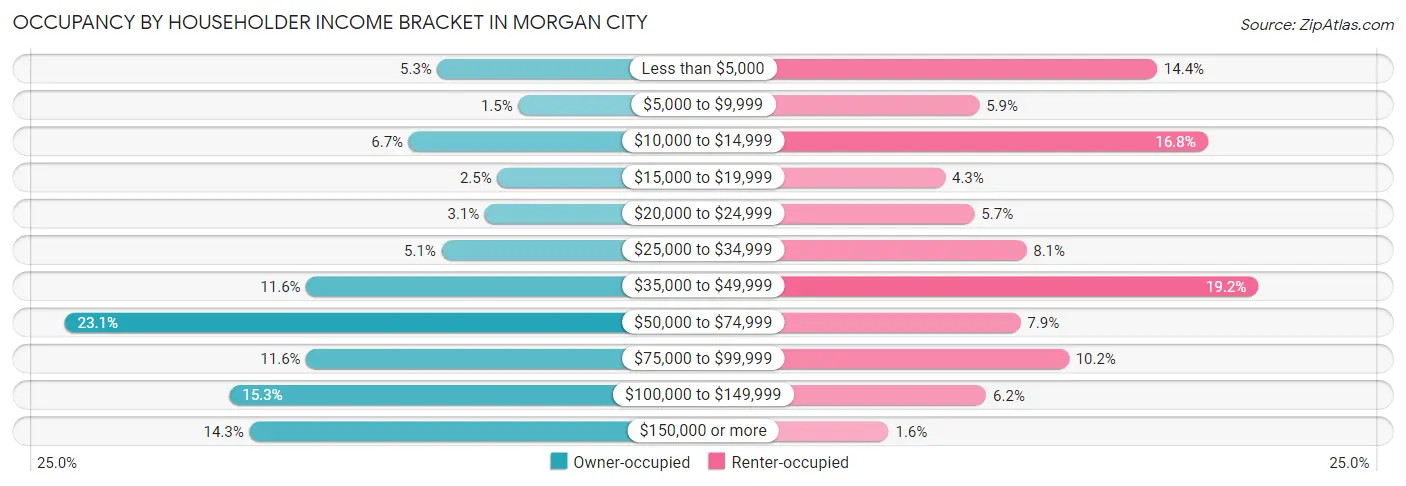
| Income Bracket | Owner-occupied | Renter-occupied |
| Less than $5,000 | 144 (5.3%) | 256 (14.3%) |
| $5,000 to $9,999 | 40 (1.5%) | 105 (5.9%) |
| $10,000 to $14,999 | 181 (6.7%) | 299 (16.8%) |
| $15,000 to $19,999 | 67 (2.5%) | 76 (4.3%) |
| $20,000 to $24,999 | 83 (3.1%) | 101 (5.7%) |
| $25,000 to $34,999 | 139 (5.1%) | 145 (8.1%) |
| $35,000 to $49,999 | 313 (11.6%) | 342 (19.2%) |
| $50,000 to $74,999 | 624 (23.1%) | 140 (7.9%) |
| $75,000 to $99,999 | 313 (11.6%) | 181 (10.2%) |
| $100,000 to $149,999 | 412 (15.2%) | 111 (6.2%) |
| $150,000 or more | 386 (14.3%) | 28 (1.6%) |
| Total | 2,702 (100.0%) | 1,784 (100.0%) |
Monthly Housing Cost Tiers in Morgan City
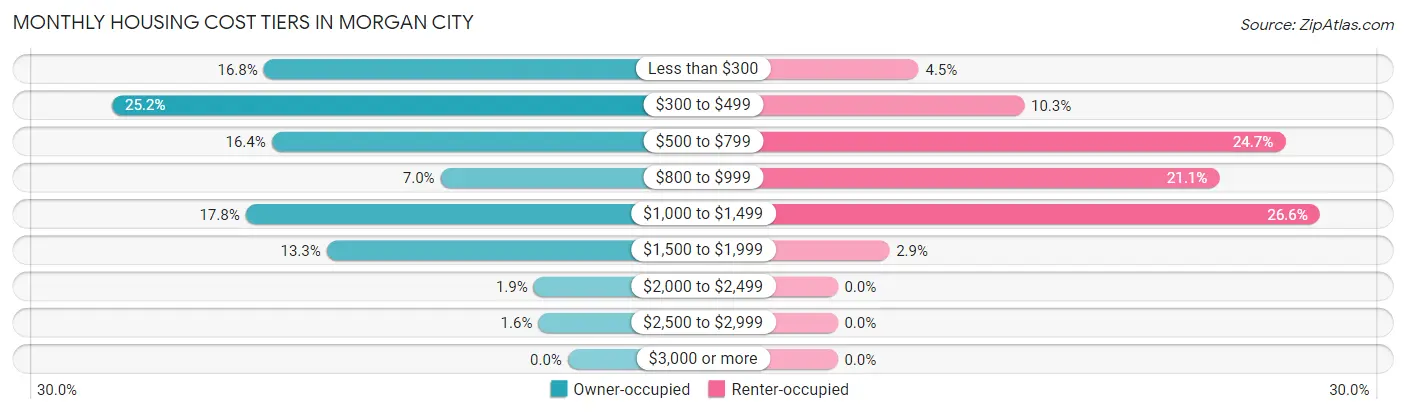
| Monthly Cost | Owner-occupied | Renter-occupied |
| Less than $300 | 454 (16.8%) | 80 (4.5%) |
| $300 to $499 | 680 (25.2%) | 184 (10.3%) |
| $500 to $799 | 442 (16.4%) | 441 (24.7%) |
| $800 to $999 | 190 (7.0%) | 376 (21.1%) |
| $1,000 to $1,499 | 481 (17.8%) | 475 (26.6%) |
| $1,500 to $1,999 | 360 (13.3%) | 51 (2.9%) |
| $2,000 to $2,499 | 51 (1.9%) | 0 (0.0%) |
| $2,500 to $2,999 | 44 (1.6%) | 0 (0.0%) |
| $3,000 or more | 0 (0.0%) | 0 (0.0%) |
| Total | 2,702 (100.0%) | 1,784 (100.0%) |
Physical Housing Characteristics in Morgan City
Housing Structures in Morgan City
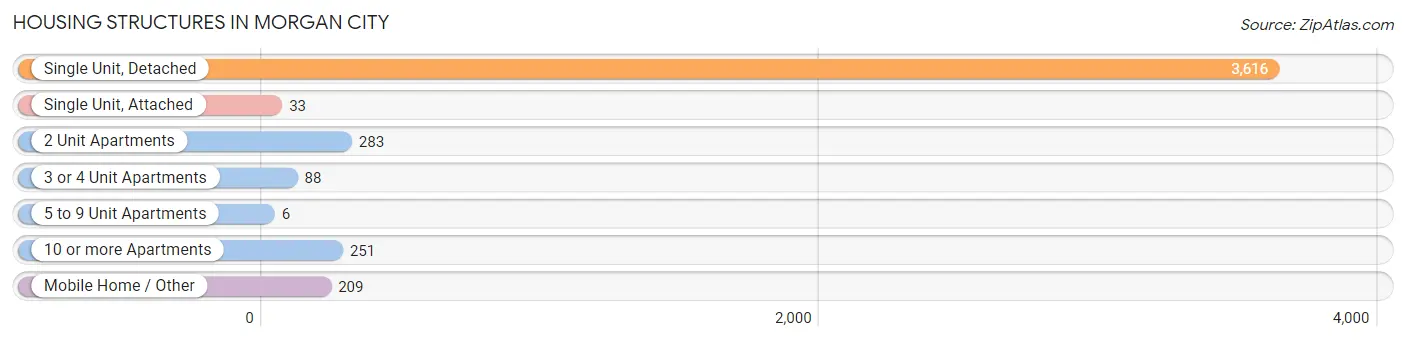
| Structure Type | # Housing Units | % Housing Units |
| Single Unit, Detached | 3,616 | 80.6% |
| Single Unit, Attached | 33 | 0.7% |
| 2 Unit Apartments | 283 | 6.3% |
| 3 or 4 Unit Apartments | 88 | 2.0% |
| 5 to 9 Unit Apartments | 6 | 0.1% |
| 10 or more Apartments | 251 | 5.6% |
| Mobile Home / Other | 209 | 4.7% |
| Total | 4,486 | 100.0% |
Housing Structures by Occupancy in Morgan City
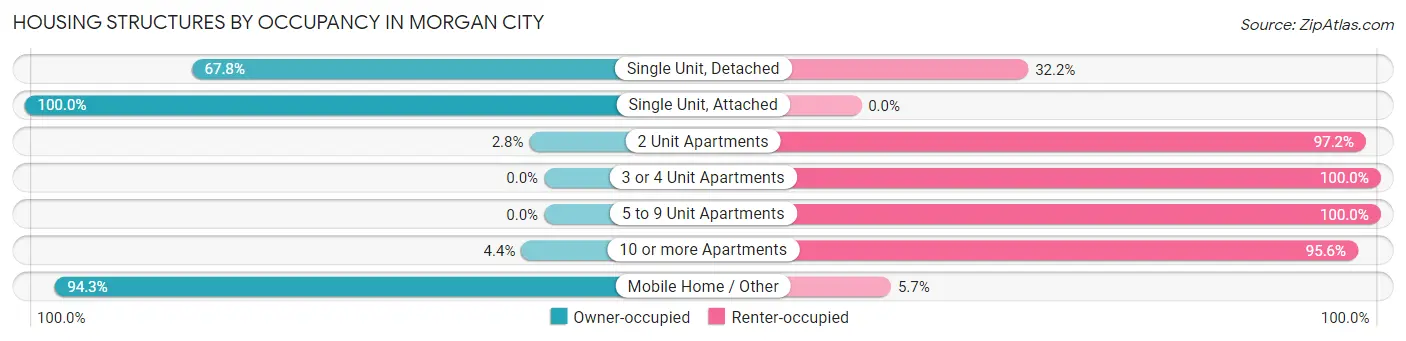
| Structure Type | Owner-occupied | Renter-occupied |
| Single Unit, Detached | 2,453 (67.8%) | 1,163 (32.2%) |
| Single Unit, Attached | 33 (100.0%) | 0 (0.0%) |
| 2 Unit Apartments | 8 (2.8%) | 275 (97.2%) |
| 3 or 4 Unit Apartments | 0 (0.0%) | 88 (100.0%) |
| 5 to 9 Unit Apartments | 0 (0.0%) | 6 (100.0%) |
| 10 or more Apartments | 11 (4.4%) | 240 (95.6%) |
| Mobile Home / Other | 197 (94.3%) | 12 (5.7%) |
| Total | 2,702 (60.2%) | 1,784 (39.8%) |
Housing Structures by Number of Rooms in Morgan City
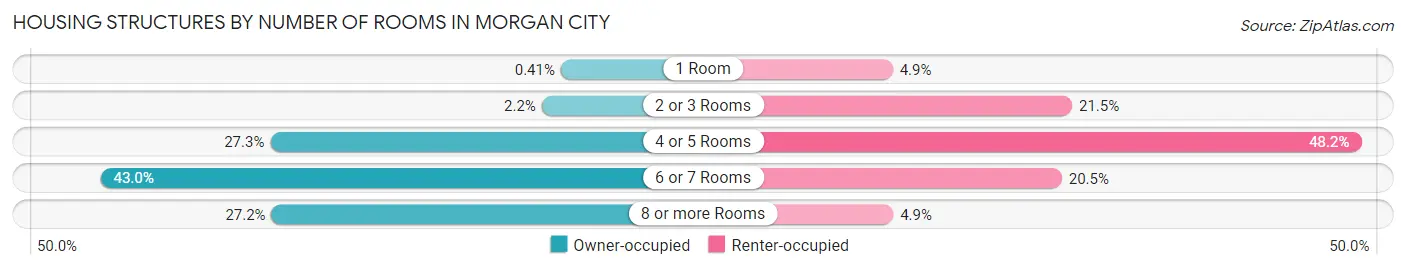
| Number of Rooms | Owner-occupied | Renter-occupied |
| 1 Room | 11 (0.4%) | 87 (4.9%) |
| 2 or 3 Rooms | 59 (2.2%) | 383 (21.5%) |
| 4 or 5 Rooms | 737 (27.3%) | 860 (48.2%) |
| 6 or 7 Rooms | 1,161 (43.0%) | 366 (20.5%) |
| 8 or more Rooms | 734 (27.2%) | 88 (4.9%) |
| Total | 2,702 (100.0%) | 1,784 (100.0%) |
Housing Structure by Heating Type in Morgan City
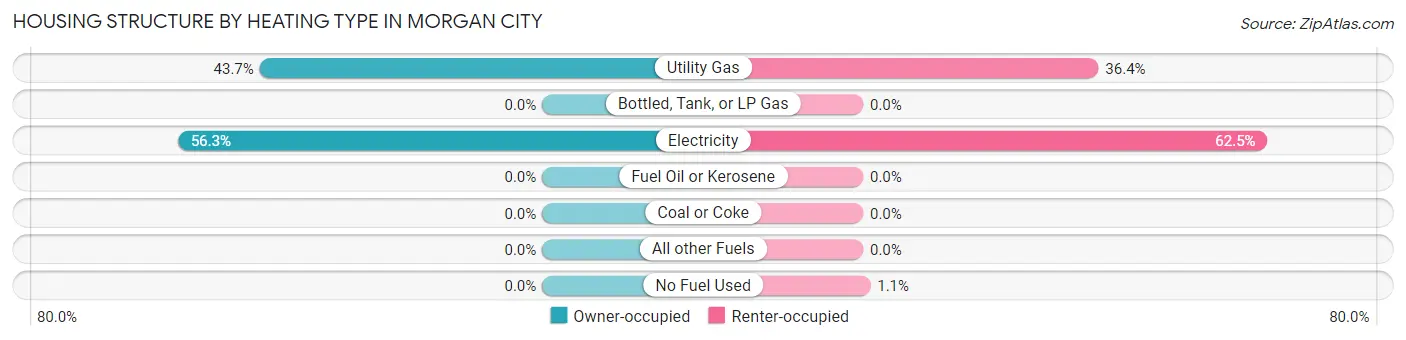
| Heating Type | Owner-occupied | Renter-occupied |
| Utility Gas | 1,180 (43.7%) | 649 (36.4%) |
| Bottled, Tank, or LP Gas | 0 (0.0%) | 0 (0.0%) |
| Electricity | 1,522 (56.3%) | 1,115 (62.5%) |
| Fuel Oil or Kerosene | 0 (0.0%) | 0 (0.0%) |
| Coal or Coke | 0 (0.0%) | 0 (0.0%) |
| All other Fuels | 0 (0.0%) | 0 (0.0%) |
| No Fuel Used | 0 (0.0%) | 20 (1.1%) |
| Total | 2,702 (100.0%) | 1,784 (100.0%) |
Household Vehicle Usage in Morgan City
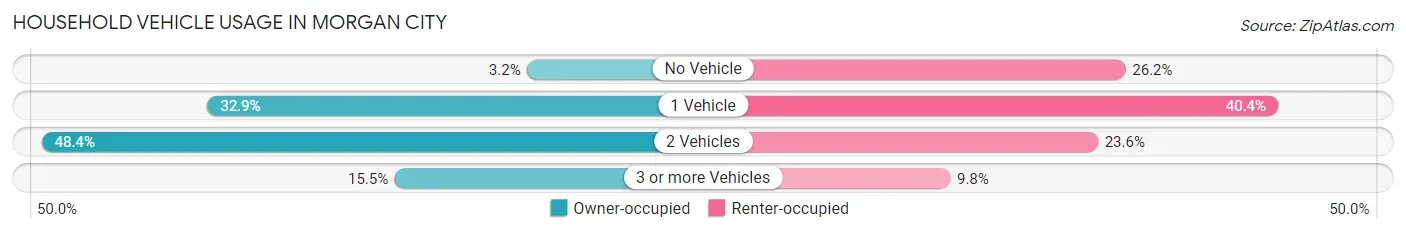
| Vehicles per Household | Owner-occupied | Renter-occupied |
| No Vehicle | 85 (3.2%) | 467 (26.2%) |
| 1 Vehicle | 890 (32.9%) | 721 (40.4%) |
| 2 Vehicles | 1,308 (48.4%) | 421 (23.6%) |
| 3 or more Vehicles | 419 (15.5%) | 175 (9.8%) |
| Total | 2,702 (100.0%) | 1,784 (100.0%) |
Real Estate & Mortgages in Morgan City
Real Estate and Mortgage Overview in Morgan City
| Characteristic | Without Mortgage | With Mortgage |
| Housing Units | 1,688 | 1,014 |
| Median Property Value | $126,800 | $168,300 |
| Median Household Income | $57,604 | $238 |
| Monthly Housing Costs | $387 | $0 |
| Real Estate Taxes | $380 | $87 |
Property Value by Mortgage Status in Morgan City
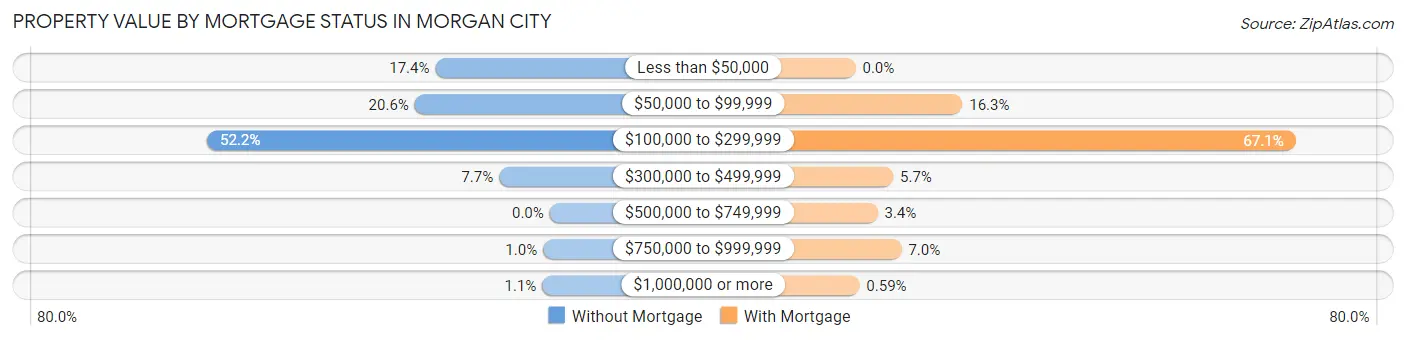
| Property Value | Without Mortgage | With Mortgage |
| Less than $50,000 | 294 (17.4%) | 0 (0.0%) |
| $50,000 to $99,999 | 347 (20.6%) | 165 (16.3%) |
| $100,000 to $299,999 | 881 (52.2%) | 680 (67.1%) |
| $300,000 to $499,999 | 130 (7.7%) | 58 (5.7%) |
| $500,000 to $749,999 | 0 (0.0%) | 34 (3.4%) |
| $750,000 to $999,999 | 17 (1.0%) | 71 (7.0%) |
| $1,000,000 or more | 19 (1.1%) | 6 (0.6%) |
| Total | 1,688 (100.0%) | 1,014 (100.0%) |
Household Income by Mortgage Status in Morgan City
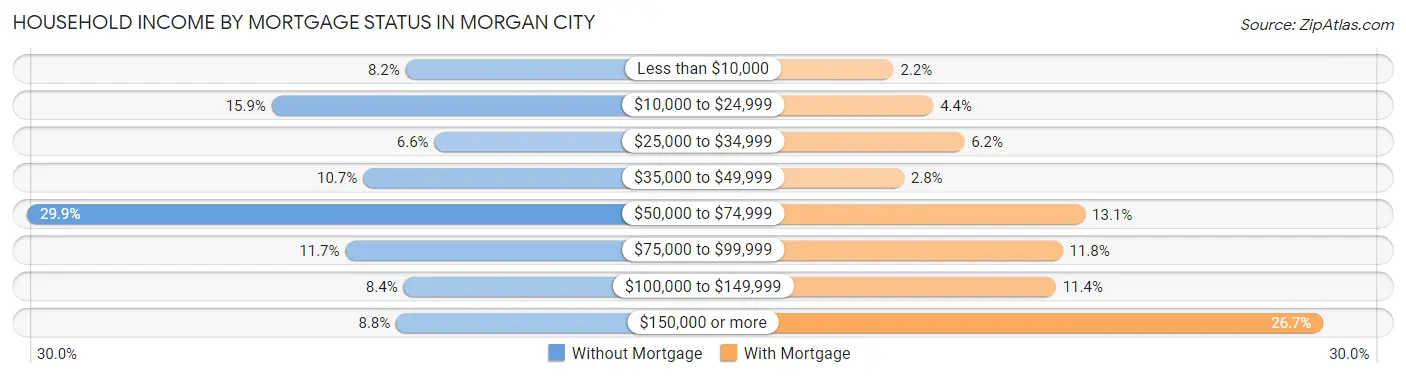
| Household Income | Without Mortgage | With Mortgage |
| Less than $10,000 | 139 (8.2%) | 22 (2.2%) |
| $10,000 to $24,999 | 268 (15.9%) | 45 (4.4%) |
| $25,000 to $34,999 | 111 (6.6%) | 63 (6.2%) |
| $35,000 to $49,999 | 180 (10.7%) | 28 (2.8%) |
| $50,000 to $74,999 | 504 (29.9%) | 133 (13.1%) |
| $75,000 to $99,999 | 197 (11.7%) | 120 (11.8%) |
| $100,000 to $149,999 | 141 (8.4%) | 116 (11.4%) |
| $150,000 or more | 148 (8.8%) | 271 (26.7%) |
| Total | 1,688 (100.0%) | 1,014 (100.0%) |
Property Value to Household Income Ratio in Morgan City
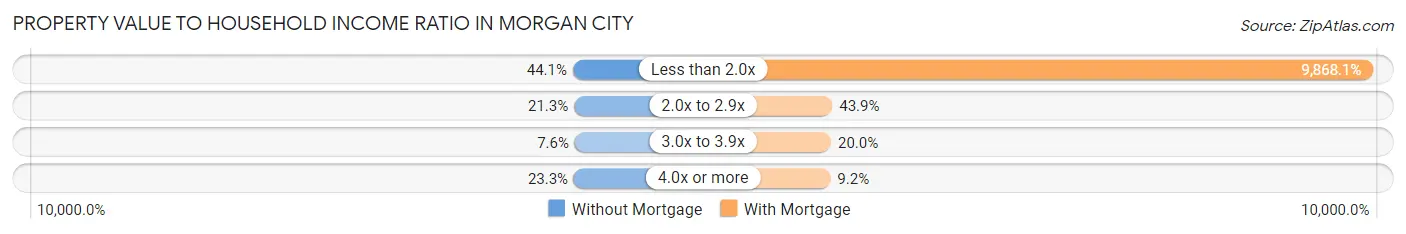
| Value-to-Income Ratio | Without Mortgage | With Mortgage |
| Less than 2.0x | 744 (44.1%) | 100,062 (9,868.0%) |
| 2.0x to 2.9x | 360 (21.3%) | 445 (43.9%) |
| 3.0x to 3.9x | 129 (7.6%) | 203 (20.0%) |
| 4.0x or more | 394 (23.3%) | 93 (9.2%) |
| Total | 1,688 (100.0%) | 1,014 (100.0%) |
Real Estate Taxes by Mortgage Status in Morgan City
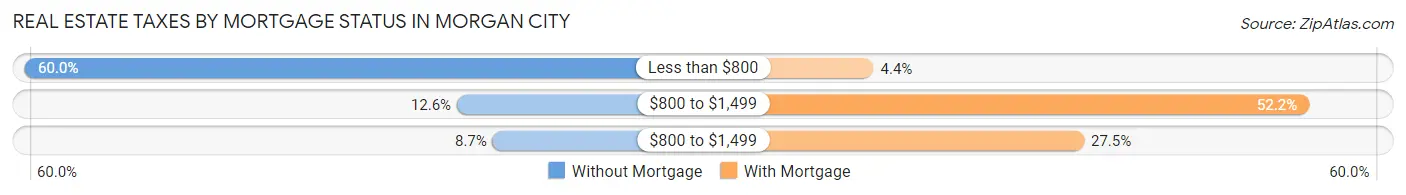
| Property Taxes | Without Mortgage | With Mortgage |
| Less than $800 | 1,012 (60.0%) | 45 (4.4%) |
| $800 to $1,499 | 213 (12.6%) | 529 (52.2%) |
| $800 to $1,499 | 147 (8.7%) | 279 (27.5%) |
| Total | 1,688 (100.0%) | 1,014 (100.0%) |
Health & Disability in Morgan City
Health Insurance Coverage by Age in Morgan City
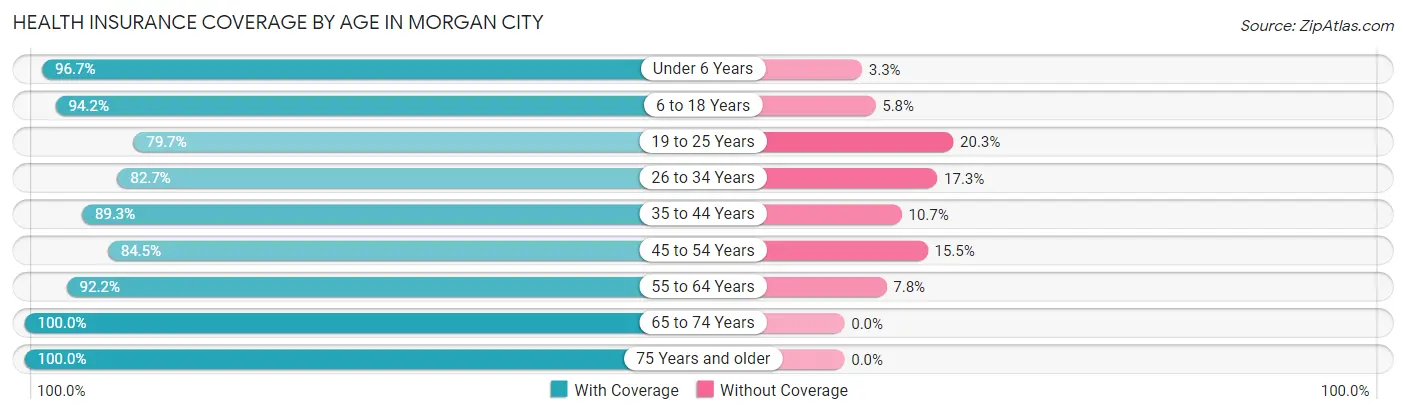
| Age Bracket | With Coverage | Without Coverage |
| Under 6 Years | 829 (96.7%) | 28 (3.3%) |
| 6 to 18 Years | 1,825 (94.2%) | 112 (5.8%) |
| 19 to 25 Years | 499 (79.7%) | 127 (20.3%) |
| 26 to 34 Years | 1,008 (82.7%) | 211 (17.3%) |
| 35 to 44 Years | 1,096 (89.3%) | 131 (10.7%) |
| 45 to 54 Years | 1,388 (84.5%) | 255 (15.5%) |
| 55 to 64 Years | 1,622 (92.2%) | 138 (7.8%) |
| 65 to 74 Years | 1,278 (100.0%) | 0 (0.0%) |
| 75 Years and older | 690 (100.0%) | 0 (0.0%) |
| Total | 10,235 (91.1%) | 1,002 (8.9%) |
Health Insurance Coverage by Citizenship Status in Morgan City
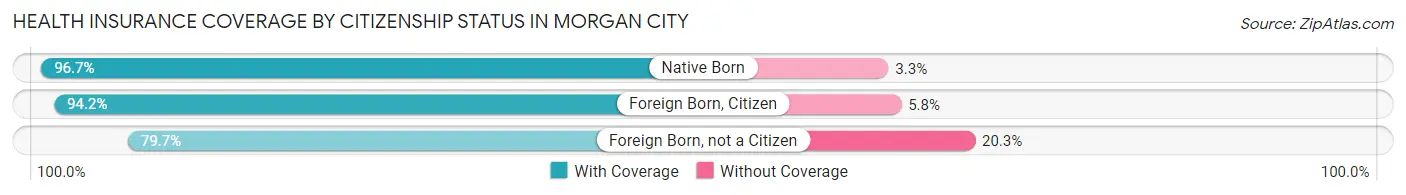
| Citizenship Status | With Coverage | Without Coverage |
| Native Born | 829 (96.7%) | 28 (3.3%) |
| Foreign Born, Citizen | 1,825 (94.2%) | 112 (5.8%) |
| Foreign Born, not a Citizen | 499 (79.7%) | 127 (20.3%) |
Health Insurance Coverage by Household Income in Morgan City
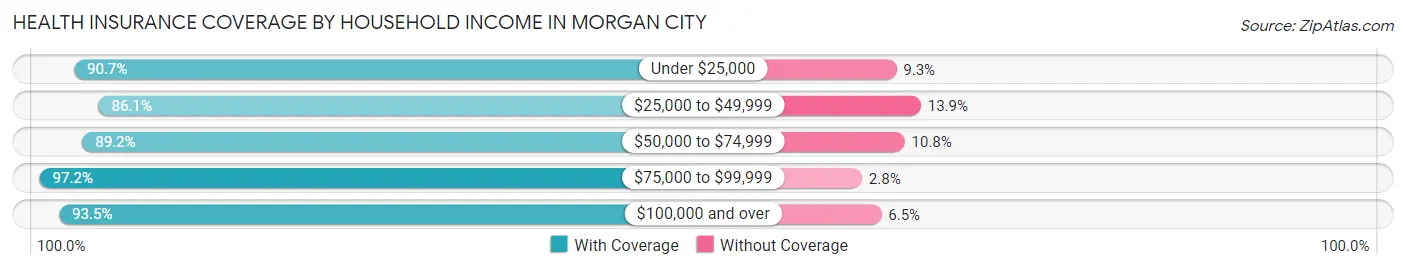
| Household Income | With Coverage | Without Coverage |
| Under $25,000 | 2,042 (90.7%) | 209 (9.3%) |
| $25,000 to $49,999 | 2,144 (86.1%) | 345 (13.9%) |
| $50,000 to $74,999 | 1,713 (89.2%) | 208 (10.8%) |
| $75,000 to $99,999 | 1,509 (97.2%) | 44 (2.8%) |
| $100,000 and over | 2,827 (93.5%) | 196 (6.5%) |
Public vs Private Health Insurance Coverage by Age in Morgan City
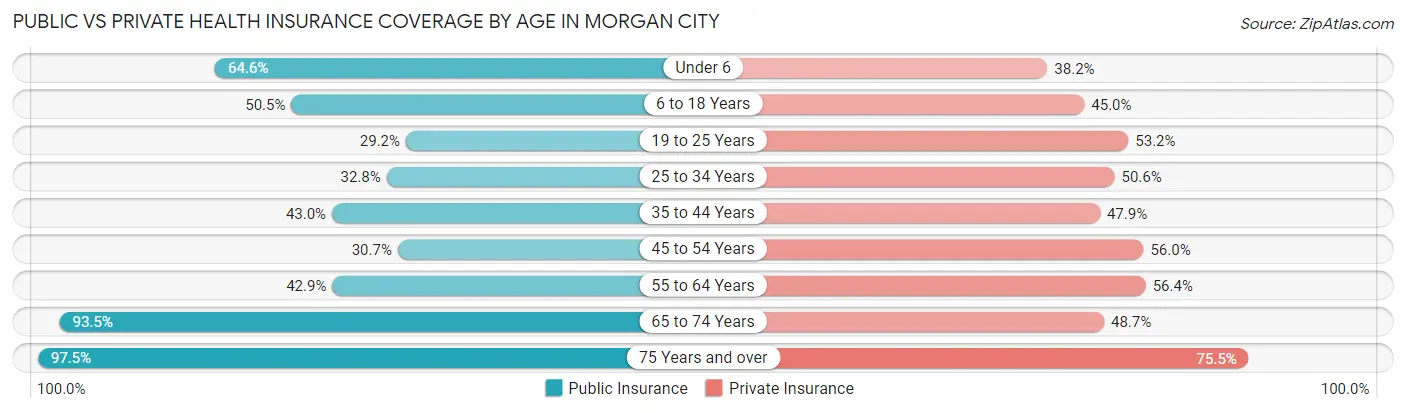
| Age Bracket | Public Insurance | Private Insurance |
| Under 6 | 554 (64.6%) | 327 (38.2%) |
| 6 to 18 Years | 978 (50.5%) | 872 (45.0%) |
| 19 to 25 Years | 183 (29.2%) | 333 (53.2%) |
| 25 to 34 Years | 400 (32.8%) | 617 (50.6%) |
| 35 to 44 Years | 527 (42.9%) | 588 (47.9%) |
| 45 to 54 Years | 505 (30.7%) | 920 (56.0%) |
| 55 to 64 Years | 755 (42.9%) | 993 (56.4%) |
| 65 to 74 Years | 1,195 (93.5%) | 622 (48.7%) |
| 75 Years and over | 673 (97.5%) | 521 (75.5%) |
| Total | 5,770 (51.3%) | 5,793 (51.5%) |
Disability Status by Sex by Age in Morgan City

| Age Bracket | Male | Female |
| Under 5 Years | 0 (0.0%) | 0 (0.0%) |
| 5 to 17 Years | 159 (15.0%) | 51 (6.3%) |
| 18 to 34 Years | 110 (11.5%) | 76 (7.4%) |
| 35 to 64 Years | 572 (22.7%) | 346 (16.4%) |
| 65 to 74 Years | 133 (20.9%) | 237 (36.9%) |
| 75 Years and over | 146 (51.4%) | 164 (40.4%) |
Disability Class by Sex by Age in Morgan City
Disability Class: Hearing Difficulty
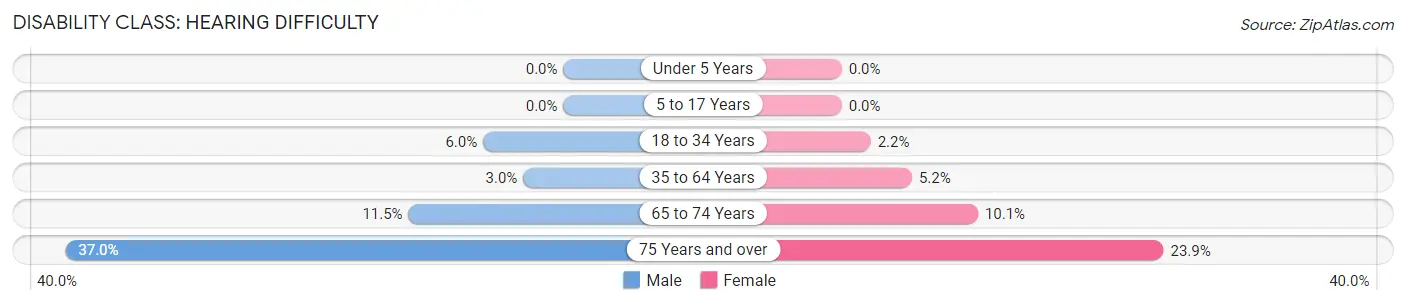
| Age Bracket | Male | Female |
| Under 5 Years | 0 (0.0%) | 0 (0.0%) |
| 5 to 17 Years | 0 (0.0%) | 0 (0.0%) |
| 18 to 34 Years | 57 (6.0%) | 22 (2.1%) |
| 35 to 64 Years | 75 (3.0%) | 110 (5.2%) |
| 65 to 74 Years | 73 (11.5%) | 65 (10.1%) |
| 75 Years and over | 105 (37.0%) | 97 (23.9%) |
Disability Class: Vision Difficulty
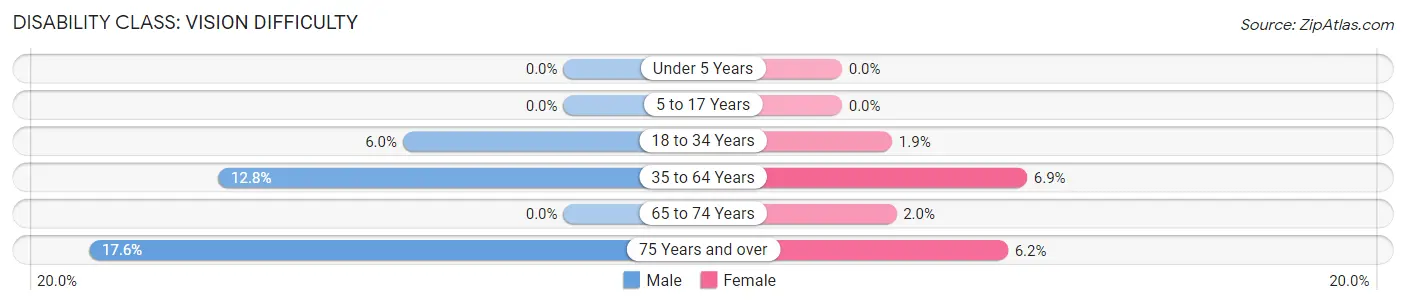
| Age Bracket | Male | Female |
| Under 5 Years | 0 (0.0%) | 0 (0.0%) |
| 5 to 17 Years | 0 (0.0%) | 0 (0.0%) |
| 18 to 34 Years | 57 (6.0%) | 19 (1.9%) |
| 35 to 64 Years | 323 (12.8%) | 145 (6.9%) |
| 65 to 74 Years | 0 (0.0%) | 13 (2.0%) |
| 75 Years and over | 50 (17.6%) | 25 (6.2%) |
Disability Class: Cognitive Difficulty
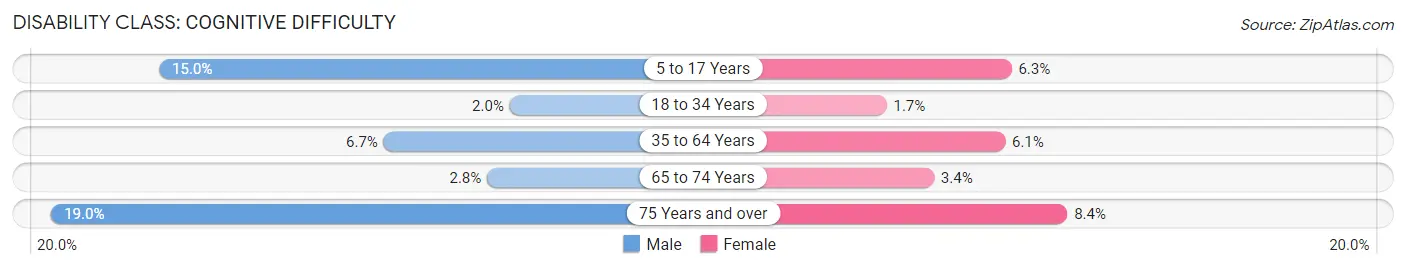
| Age Bracket | Male | Female |
| 5 to 17 Years | 159 (15.0%) | 51 (6.3%) |
| 18 to 34 Years | 19 (2.0%) | 17 (1.7%) |
| 35 to 64 Years | 168 (6.7%) | 128 (6.1%) |
| 65 to 74 Years | 18 (2.8%) | 22 (3.4%) |
| 75 Years and over | 54 (19.0%) | 34 (8.4%) |
Disability Class: Ambulatory Difficulty
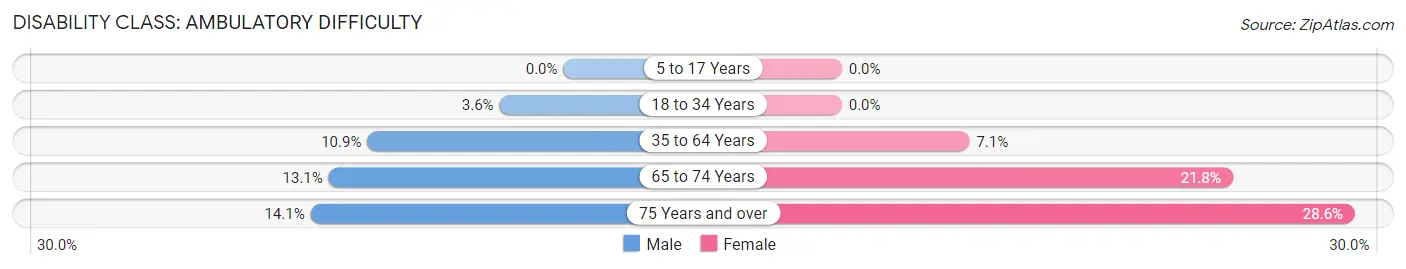
| Age Bracket | Male | Female |
| 5 to 17 Years | 0 (0.0%) | 0 (0.0%) |
| 18 to 34 Years | 34 (3.6%) | 0 (0.0%) |
| 35 to 64 Years | 275 (10.9%) | 150 (7.1%) |
| 65 to 74 Years | 83 (13.1%) | 140 (21.8%) |
| 75 Years and over | 40 (14.1%) | 116 (28.6%) |
Disability Class: Self-Care Difficulty
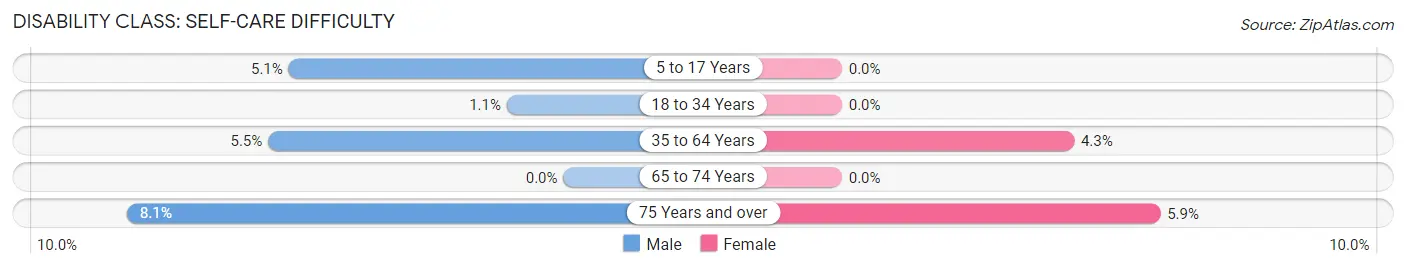
| Age Bracket | Male | Female |
| 5 to 17 Years | 54 (5.1%) | 0 (0.0%) |
| 18 to 34 Years | 10 (1.1%) | 0 (0.0%) |
| 35 to 64 Years | 138 (5.5%) | 91 (4.3%) |
| 65 to 74 Years | 0 (0.0%) | 0 (0.0%) |
| 75 Years and over | 23 (8.1%) | 24 (5.9%) |
Technology Access in Morgan City
Computing Device Access in Morgan City
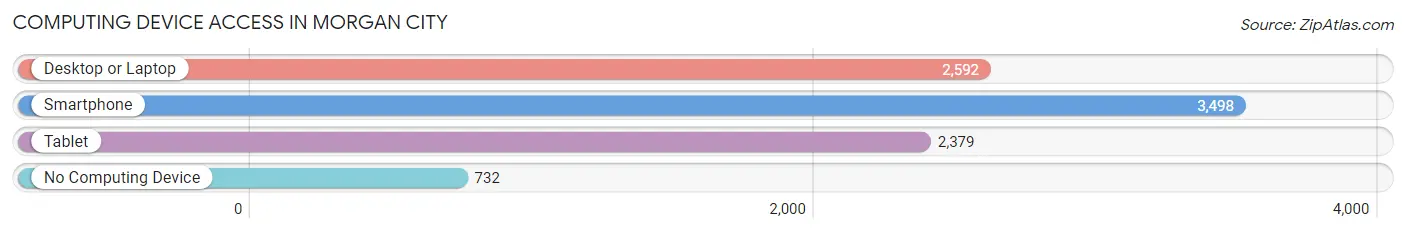
| Device Type | # Households | % Households |
| Desktop or Laptop | 2,592 | 57.8% |
| Smartphone | 3,498 | 78.0% |
| Tablet | 2,379 | 53.0% |
| No Computing Device | 732 | 16.3% |
| Total | 4,486 | 100.0% |
Internet Access in Morgan City
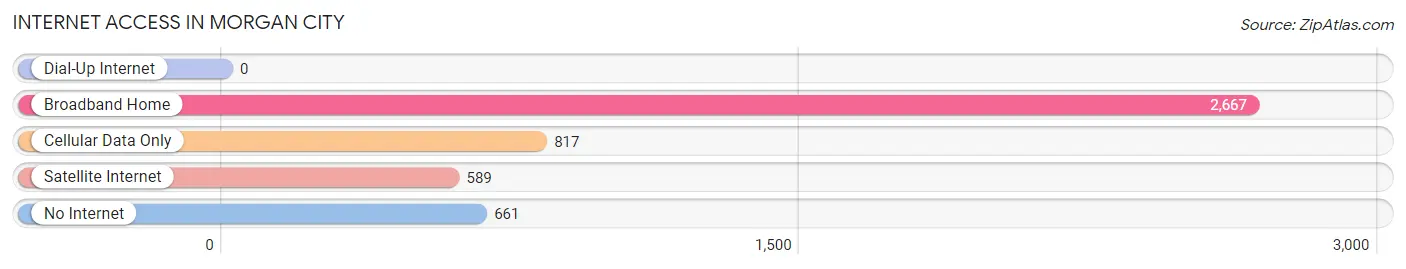
| Internet Type | # Households | % Households |
| Dial-Up Internet | 0 | 0.0% |
| Broadband Home | 2,667 | 59.5% |
| Cellular Data Only | 817 | 18.2% |
| Satellite Internet | 589 | 13.1% |
| No Internet | 661 | 14.7% |
| Total | 4,486 | 100.0% |
Morgan City Summary
History
The city of Morgan City, Louisiana is located in St. Mary Parish, in the southeastern part of the state. It is situated on the banks of the Atchafalaya River, about 30 miles from the Gulf of Mexico. The city was founded in 1876 by Charles Morgan, a railroad entrepreneur, and was named after him. It was originally a small fishing village, but it quickly grew into a major port city.
The city was an important port during the Civil War, and it was the site of several battles. After the war, the city continued to grow and prosper, and it became a major center for the oil and gas industry. In the early 1900s, the city was home to several large oil refineries, and it was also a major shipping port.
In the 1950s, the city began to experience a decline in its economy, as the oil and gas industry moved away from the area. However, the city was able to rebound in the 1960s, when it became a major center for the offshore oil and gas industry. The city has since become a major hub for the offshore oil and gas industry, and it is home to several large oil and gas companies.
Geography
Morgan City is located in St. Mary Parish, in the southeastern part of Louisiana. It is situated on the banks of the Atchafalaya River, about 30 miles from the Gulf of Mexico. The city is surrounded by marshland and swamps, and it is located near the Atchafalaya Basin, the largest wetland in the United States.
The city has a humid subtropical climate, with hot, humid summers and mild winters. The average annual temperature is around 70 degrees Fahrenheit, and the average annual precipitation is around 60 inches.
Economy
The economy of Morgan City is largely based on the oil and gas industry. The city is home to several large oil and gas companies, and it is a major hub for the offshore oil and gas industry. The city is also home to several shipbuilding and repair companies, as well as a number of seafood processing plants.
The city is also home to several large retail stores, including Walmart, Target, and Home Depot. The city also has a number of restaurants, bars, and other entertainment venues.
Demographics
As of the 2010 census, the population of Morgan City was 12,703. The racial makeup of the city was 73.3% White, 22.2% African American, 0.4% Native American, 0.7% Asian, 0.1% Pacific Islander, and 2.3% from other races. Hispanic or Latino of any race were 4.2% of the population.
The median household income in Morgan City was $37,945, and the median family income was $45,945. The per capita income was $20,945. About 17.3% of the population was below the poverty line.
Common Questions
What is Per Capita Income in Morgan City?
Per Capita income in Morgan City is $26,781.
What is the Median Family Income in Morgan City?
Median Family Income in Morgan City is $68,505.
What is the Median Household income in Morgan City?
Median Household Income in Morgan City is $48,857.
What is Income or Wage Gap in Morgan City?
Income or Wage Gap in Morgan City is 47.0%.
Women in Morgan City earn 53.0 cents for every dollar earned by a man.
What is Inequality or Gini Index in Morgan City?
Inequality or Gini Index in Morgan City is 0.48.
What is the Total Population of Morgan City?
Total Population of Morgan City is 11,373.
What is the Total Male Population of Morgan City?
Total Male Population of Morgan City is 5,821.
What is the Total Female Population of Morgan City?
Total Female Population of Morgan City is 5,552.
What is the Ratio of Males per 100 Females in Morgan City?
There are 104.85 Males per 100 Females in Morgan City.
What is the Ratio of Females per 100 Males in Morgan City?
There are 95.38 Females per 100 Males in Morgan City.
What is the Median Population Age in Morgan City?
Median Population Age in Morgan City is 43.3 Years.
What is the Average Family Size in Morgan City
Average Family Size in Morgan City is 3.3 People.
What is the Average Household Size in Morgan City
Average Household Size in Morgan City is 2.5 People.
How Large is the Labor Force in Morgan City?
There are 5,045 People in the Labor Forcein in Morgan City.
What is the Percentage of People in the Labor Force in Morgan City?
56.7% of People are in the Labor Force in Morgan City.
What is the Unemployment Rate in Morgan City?
Unemployment Rate in Morgan City is 8.3%.