Grand Point, LA Map & Demographics
Grand Point Map
Grand Point Overview
$37,962
PER CAPITA INCOME
$110,337
AVG FAMILY INCOME
$104,034
AVG HOUSEHOLD INCOME
40.4%
WAGE / INCOME GAP [ % ]
59.7¢/ $1
WAGE / INCOME GAP [ $ ]
0.34
INEQUALITY / GINI INDEX
2,533
TOTAL POPULATION
1,097
MALE POPULATION
1,436
FEMALE POPULATION
76.39
MALES / 100 FEMALES
130.90
FEMALES / 100 MALES
41.8
MEDIAN AGE
3.1
AVG FAMILY SIZE
3.0
AVG HOUSEHOLD SIZE
1,536
LABOR FORCE [ PEOPLE ]
71.9%
PERCENT IN LABOR FORCE
3.8%
UNEMPLOYMENT RATE
Income in Grand Point
Income Overview in Grand Point
Per Capita Income in Grand Point is $37,962, while median incomes of families and households are $110,337 and $104,034 respectively.
| Characteristic | Number | Measure |
| Per Capita Income | 2,533 | $37,962 |
| Median Family Income | 773 | $110,337 |
| Mean Family Income | 773 | $116,074 |
| Median Household Income | 838 | $104,034 |
| Mean Household Income | 838 | $110,605 |
| Income Deficit | 773 | $0 |
| Wage / Income Gap (%) | 2,533 | 40.35% |
| Wage / Income Gap ($) | 2,533 | 59.65¢ per $1 |
| Gini / Inequality Index | 2,533 | 0.34 |
Earnings by Sex in Grand Point
Average Earnings in Grand Point are $41,931, $62,000 for men and $36,983 for women, a difference of 40.4%.
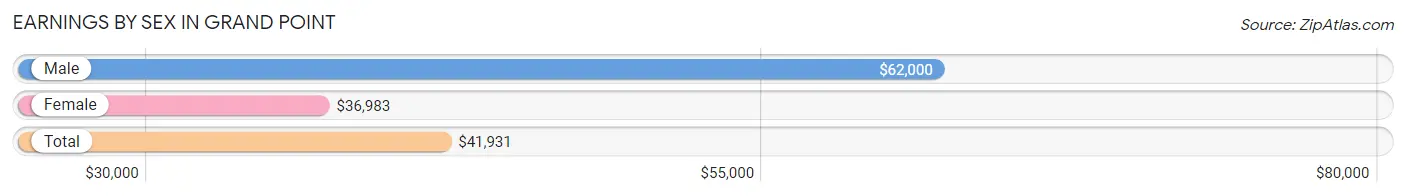
| Sex | Number | Average Earnings |
| Male | 664 (42.7%) | $62,000 |
| Female | 890 (57.3%) | $36,983 |
| Total | 1,554 (100.0%) | $41,931 |
Earnings by Sex by Income Bracket in Grand Point
The most common earnings brackets in Grand Point are $100,000+ for men (178 | 26.8%) and $15,000 to $17,499 for women (108 | 12.1%).
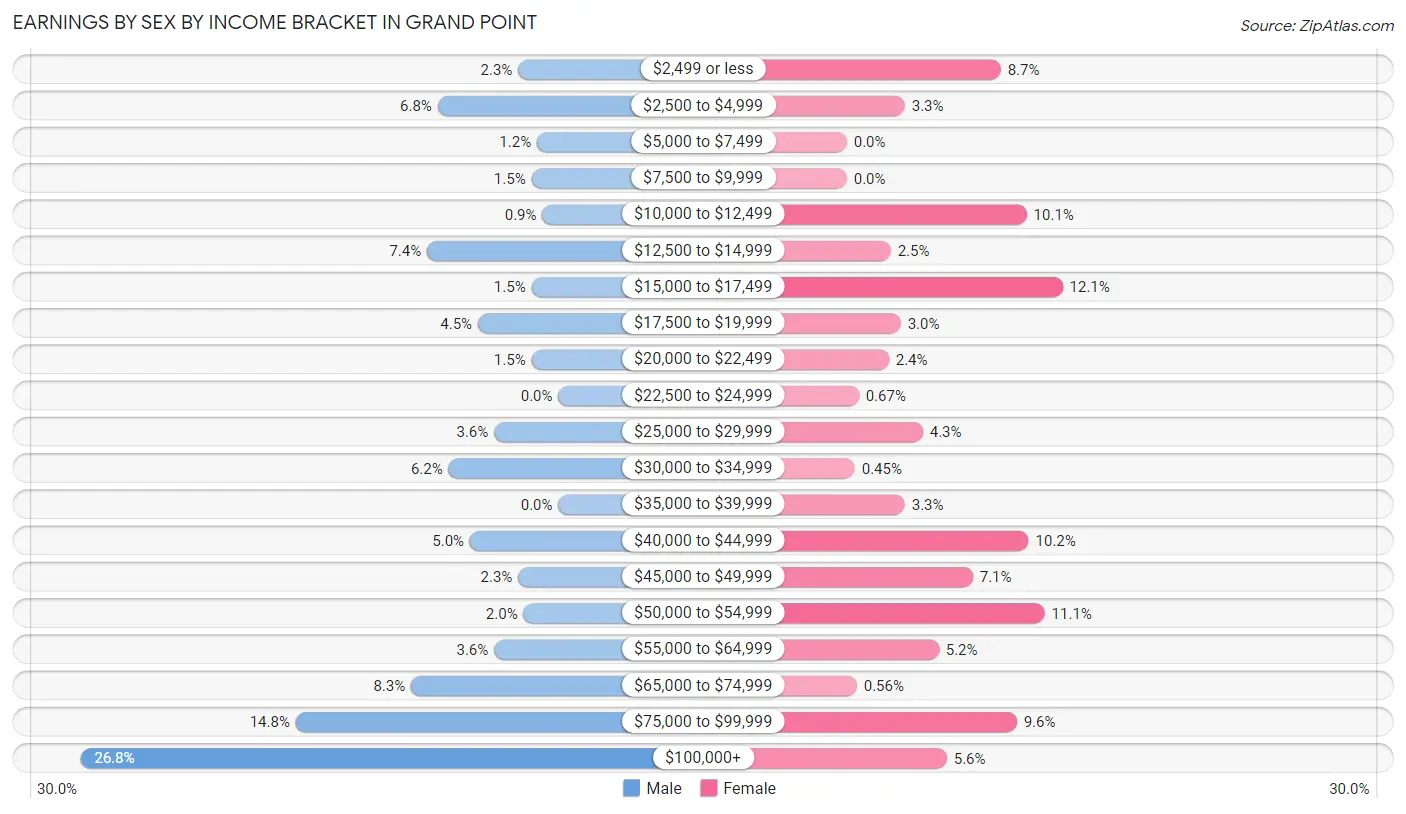
| Income | Male | Female |
| $2,499 or less | 15 (2.3%) | 77 (8.6%) |
| $2,500 to $4,999 | 45 (6.8%) | 29 (3.3%) |
| $5,000 to $7,499 | 8 (1.2%) | 0 (0.0%) |
| $7,500 to $9,999 | 10 (1.5%) | 0 (0.0%) |
| $10,000 to $12,499 | 6 (0.9%) | 90 (10.1%) |
| $12,500 to $14,999 | 49 (7.4%) | 22 (2.5%) |
| $15,000 to $17,499 | 10 (1.5%) | 108 (12.1%) |
| $17,500 to $19,999 | 30 (4.5%) | 27 (3.0%) |
| $20,000 to $22,499 | 10 (1.5%) | 21 (2.4%) |
| $22,500 to $24,999 | 0 (0.0%) | 6 (0.7%) |
| $25,000 to $29,999 | 24 (3.6%) | 38 (4.3%) |
| $30,000 to $34,999 | 41 (6.2%) | 4 (0.4%) |
| $35,000 to $39,999 | 0 (0.0%) | 29 (3.3%) |
| $40,000 to $44,999 | 33 (5.0%) | 91 (10.2%) |
| $45,000 to $49,999 | 15 (2.3%) | 63 (7.1%) |
| $50,000 to $54,999 | 13 (2.0%) | 99 (11.1%) |
| $55,000 to $64,999 | 24 (3.6%) | 46 (5.2%) |
| $65,000 to $74,999 | 55 (8.3%) | 5 (0.6%) |
| $75,000 to $99,999 | 98 (14.8%) | 85 (9.6%) |
| $100,000+ | 178 (26.8%) | 50 (5.6%) |
| Total | 664 (100.0%) | 890 (100.0%) |
Earnings by Sex by Educational Attainment in Grand Point
Average earnings in Grand Point are $75,417 for men and $42,058 for women, a difference of 44.2%. Men with an educational attainment of bachelor's degree enjoy the highest average annual earnings of $105,625, while those with less than high school education earn the least with $31,528. Women with an educational attainment of graduate degree earn the most with the average annual earnings of $92,162, while those with high school diploma education have the smallest earnings of $52,567.
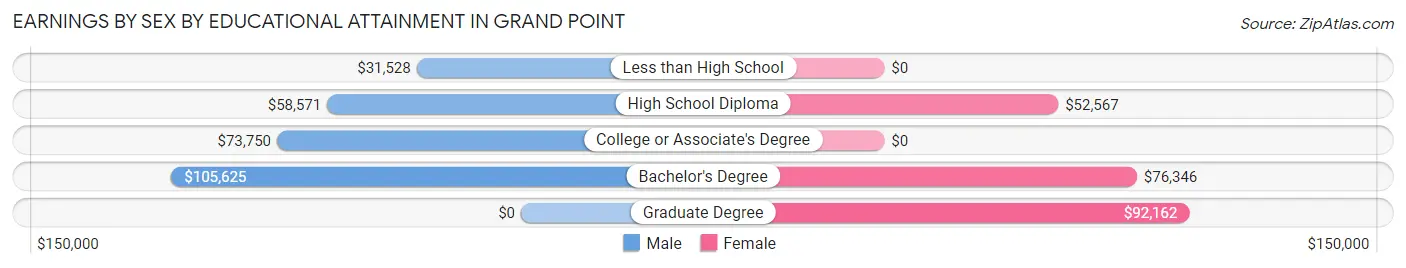
| Educational Attainment | Male Income | Female Income |
| Less than High School | $31,528 | $0 |
| High School Diploma | $58,571 | $52,567 |
| College or Associate's Degree | $73,750 | $0 |
| Bachelor's Degree | $105,625 | $76,346 |
| Graduate Degree | - | - |
| Total | $75,417 | $42,058 |
Family Income in Grand Point
Family Income Brackets in Grand Point
According to the Grand Point family income data, there are 205 families falling into the $100,000 to $149,999 income range, which is the most common income bracket and makes up 26.5% of all families.
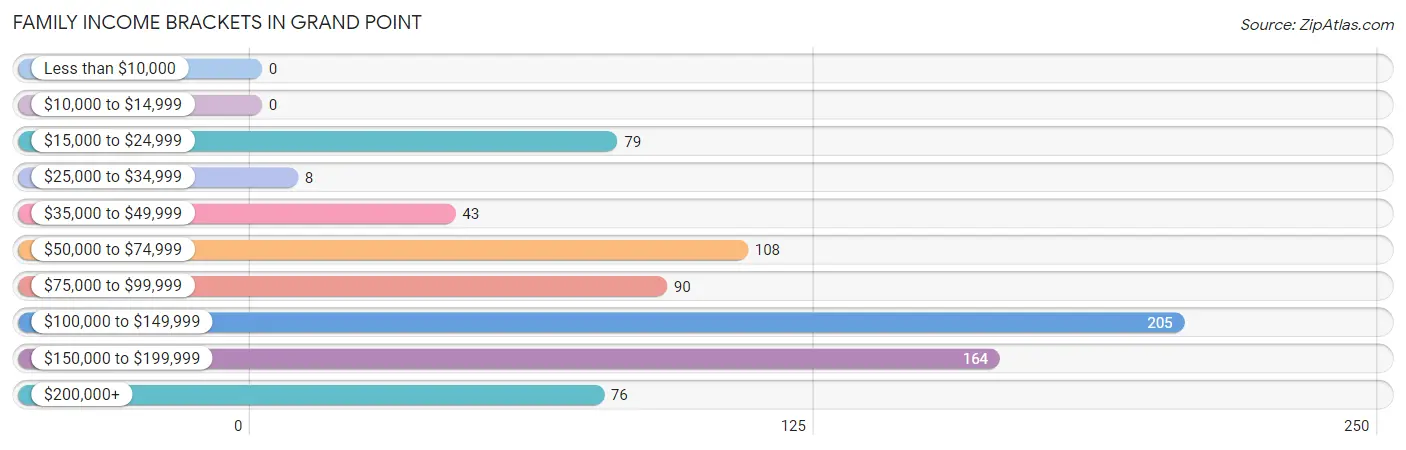
| Income Bracket | # Families | % Families |
| Less than $10,000 | 0 | 0.0% |
| $10,000 to $14,999 | 0 | 0.0% |
| $15,000 to $24,999 | 79 | 10.2% |
| $25,000 to $34,999 | 8 | 1.0% |
| $35,000 to $49,999 | 43 | 5.6% |
| $50,000 to $74,999 | 108 | 14.0% |
| $75,000 to $99,999 | 90 | 11.6% |
| $100,000 to $149,999 | 205 | 26.5% |
| $150,000 to $199,999 | 164 | 21.2% |
| $200,000+ | 76 | 9.8% |
Family Income by Famaliy Size in Grand Point
5-person families (63 | 8.2%) account for the highest median family income in Grand Point with $175,428 per family, while 2-person families (412 | 53.3%) have the highest median income of $51,797 per family member.
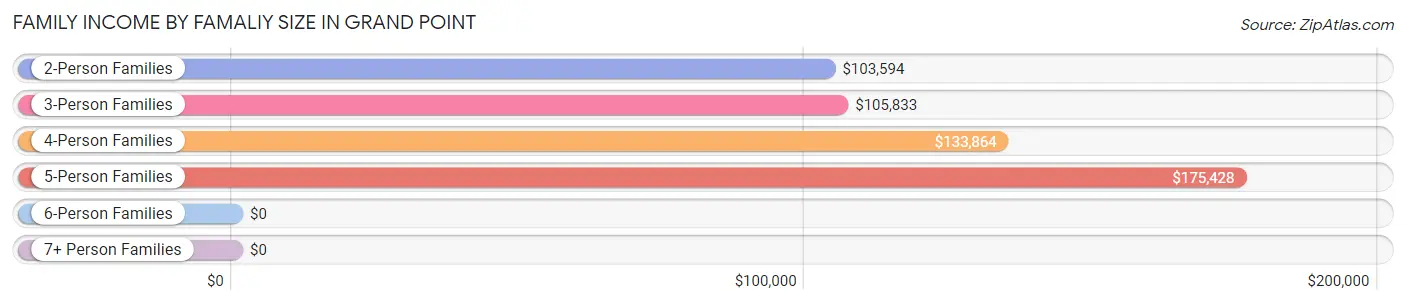
| Income Bracket | # Families | Median Income |
| 2-Person Families | 412 (53.3%) | $103,594 |
| 3-Person Families | 134 (17.3%) | $105,833 |
| 4-Person Families | 164 (21.2%) | $133,864 |
| 5-Person Families | 63 (8.2%) | $175,428 |
| 6-Person Families | 0 (0.0%) | $0 |
| 7+ Person Families | 0 (0.0%) | $0 |
| Total | 773 (100.0%) | $110,337 |
Family Income by Number of Earners in Grand Point
The median family income in Grand Point is $110,337, with families comprising 3+ earners (170) having the highest median family income of $175,263, while families with no earners (104) have the lowest median family income of $61,923, accounting for 22.0% and 13.5% of families, respectively.
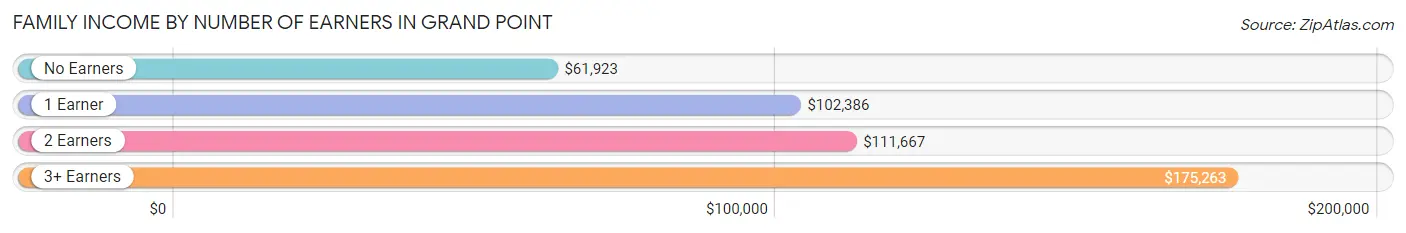
| Number of Earners | # Families | Median Income |
| No Earners | 104 (13.5%) | $61,923 |
| 1 Earner | 249 (32.2%) | $102,386 |
| 2 Earners | 250 (32.3%) | $111,667 |
| 3+ Earners | 170 (22.0%) | $175,263 |
| Total | 773 (100.0%) | $110,337 |
Household Income in Grand Point
Household Income Brackets in Grand Point
With 217 households falling in the category, the $100,000 to $149,999 income range is the most frequent in Grand Point, accounting for 25.9% of all households.
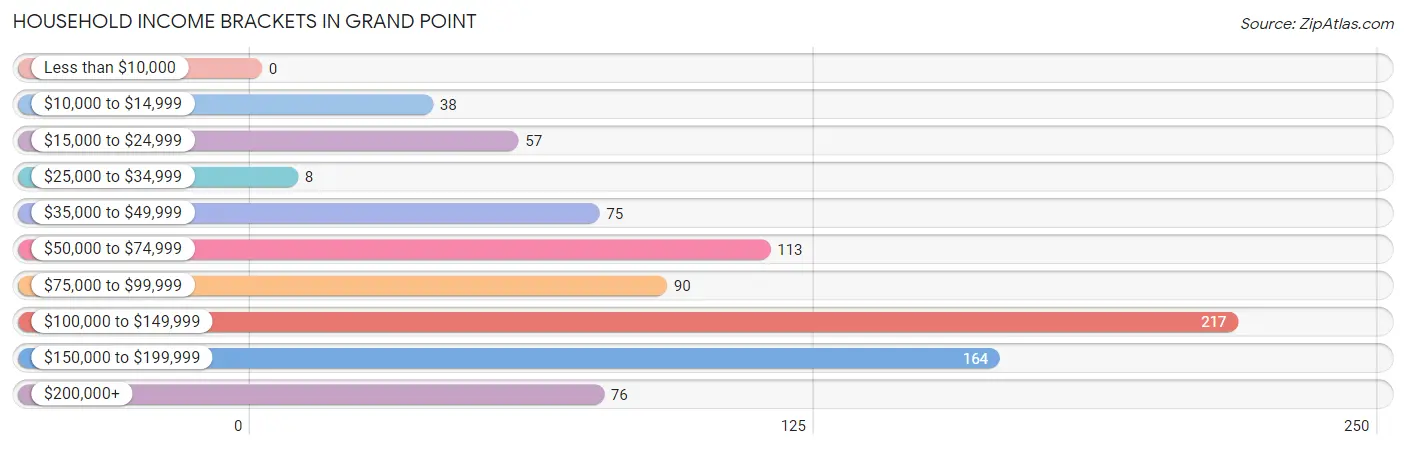
| Income Bracket | # Households | % Households |
| Less than $10,000 | 0 | 0.0% |
| $10,000 to $14,999 | 38 | 4.5% |
| $15,000 to $24,999 | 57 | 6.8% |
| $25,000 to $34,999 | 8 | 1.0% |
| $35,000 to $49,999 | 75 | 8.9% |
| $50,000 to $74,999 | 113 | 13.5% |
| $75,000 to $99,999 | 90 | 10.7% |
| $100,000 to $149,999 | 217 | 25.9% |
| $150,000 to $199,999 | 164 | 19.6% |
| $200,000+ | 76 | 9.1% |
Household Income by Householder Age in Grand Point
The median household income in Grand Point is $104,034, with the highest median household income of $131,083 found in the 45 to 64 years age bracket for the primary householder. A total of 435 households (51.9%) fall into this category.
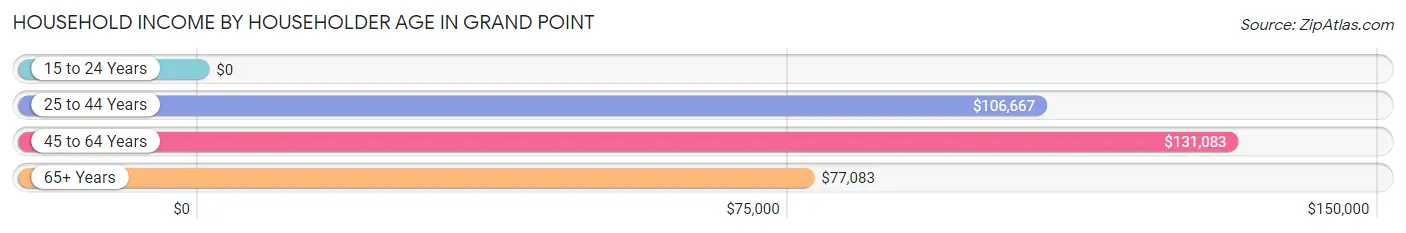
| Income Bracket | # Households | Median Income |
| 15 to 24 Years | 0 (0.0%) | $0 |
| 25 to 44 Years | 186 (22.2%) | $106,667 |
| 45 to 64 Years | 435 (51.9%) | $131,083 |
| 65+ Years | 217 (25.9%) | $77,083 |
| Total | 838 (100.0%) | $104,034 |
Poverty in Grand Point
Income Below Poverty by Sex and Age in Grand Point
With 15.4% poverty level for males and 13.0% for females among the residents of Grand Point, under 5 year old males and 6 to 11 year old females are the most vulnerable to poverty, with 102 males (89.5%) and 59 females (50.4%) in their respective age groups living below the poverty level.
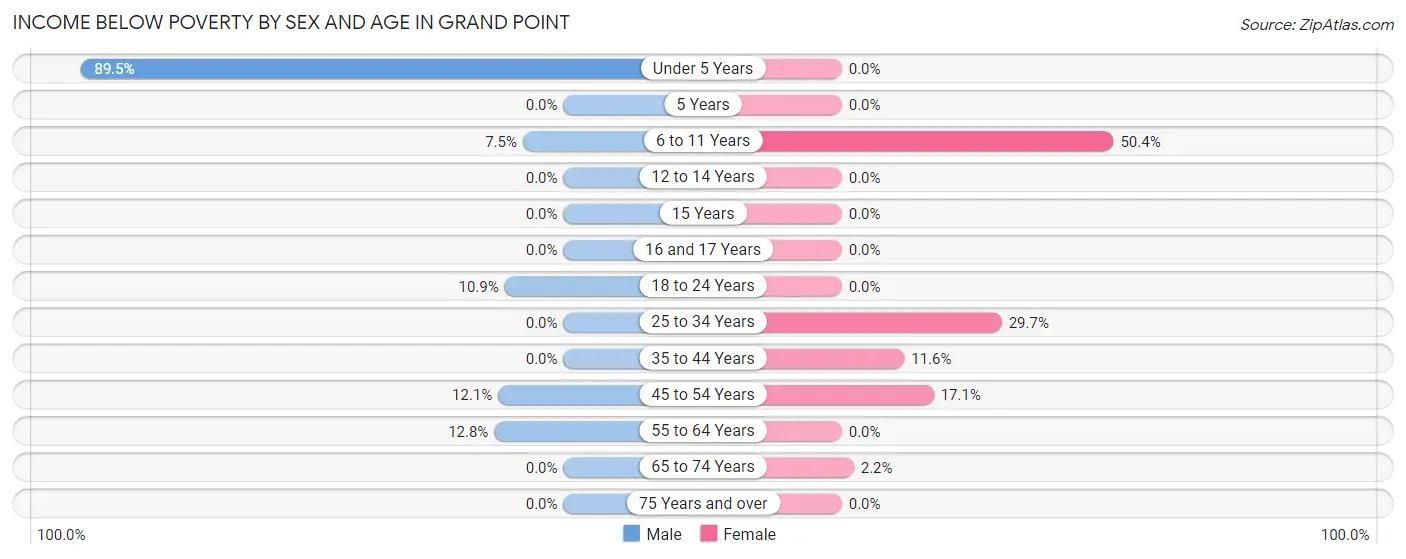
| Age Bracket | Male | Female |
| Under 5 Years | 102 (89.5%) | 0 (0.0%) |
| 5 Years | 0 (0.0%) | 0 (0.0%) |
| 6 to 11 Years | 7 (7.5%) | 59 (50.4%) |
| 12 to 14 Years | 0 (0.0%) | 0 (0.0%) |
| 15 Years | 0 (0.0%) | 0 (0.0%) |
| 16 and 17 Years | 0 (0.0%) | 0 (0.0%) |
| 18 to 24 Years | 12 (10.9%) | 0 (0.0%) |
| 25 to 34 Years | 0 (0.0%) | 57 (29.7%) |
| 35 to 44 Years | 0 (0.0%) | 29 (11.6%) |
| 45 to 54 Years | 15 (12.1%) | 36 (17.1%) |
| 55 to 64 Years | 33 (12.8%) | 0 (0.0%) |
| 65 to 74 Years | 0 (0.0%) | 5 (2.2%) |
| 75 Years and over | 0 (0.0%) | 0 (0.0%) |
| Total | 169 (15.4%) | 186 (13.0%) |
Income Above Poverty by Sex and Age in Grand Point
According to the poverty statistics in Grand Point, males aged 12 to 14 years and females aged under 5 years are the age groups that are most secure financially, with 100.0% of males and 100.0% of females in these age groups living above the poverty line.
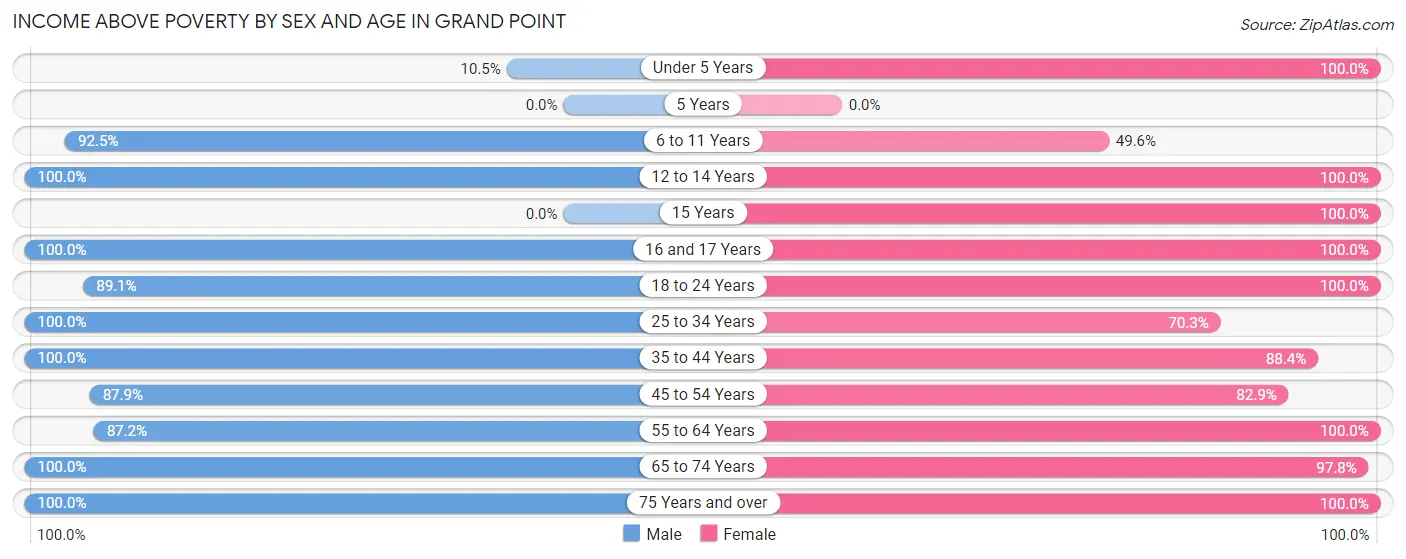
| Age Bracket | Male | Female |
| Under 5 Years | 12 (10.5%) | 23 (100.0%) |
| 5 Years | 0 (0.0%) | 0 (0.0%) |
| 6 to 11 Years | 86 (92.5%) | 58 (49.6%) |
| 12 to 14 Years | 17 (100.0%) | 13 (100.0%) |
| 15 Years | 0 (0.0%) | 20 (100.0%) |
| 16 and 17 Years | 44 (100.0%) | 19 (100.0%) |
| 18 to 24 Years | 98 (89.1%) | 147 (100.0%) |
| 25 to 34 Years | 72 (100.0%) | 135 (70.3%) |
| 35 to 44 Years | 127 (100.0%) | 221 (88.4%) |
| 45 to 54 Years | 109 (87.9%) | 175 (82.9%) |
| 55 to 64 Years | 224 (87.2%) | 198 (100.0%) |
| 65 to 74 Years | 125 (100.0%) | 220 (97.8%) |
| 75 Years and over | 14 (100.0%) | 21 (100.0%) |
| Total | 928 (84.6%) | 1,250 (87.1%) |
Income Below Poverty Among Married-Couple Families in Grand Point
The poverty statistics for married-couple families in Grand Point show that 1.3% or 8 of the total 592 families live below the poverty line. Families with 1 or 2 children have the highest poverty rate of 5.2%, comprising of 8 families. On the other hand, families with no children have the lowest poverty rate of 0.0%, which includes 0 families.
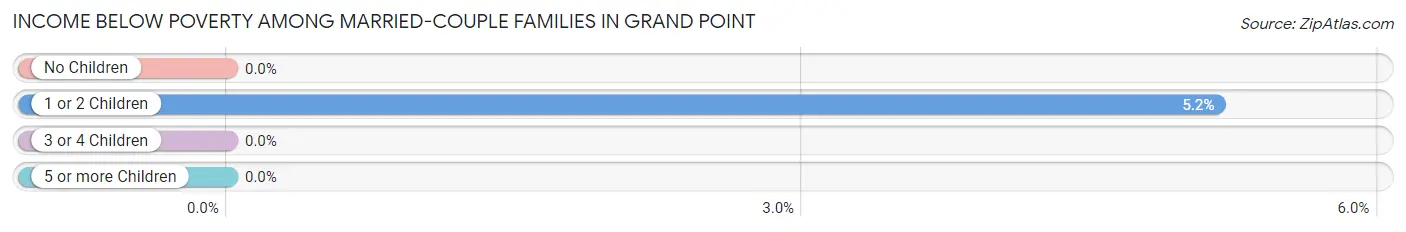
| Children | Above Poverty | Below Poverty |
| No Children | 437 (100.0%) | 0 (0.0%) |
| 1 or 2 Children | 147 (94.8%) | 8 (5.2%) |
| 3 or 4 Children | 0 (0.0%) | 0 (0.0%) |
| 5 or more Children | 0 (0.0%) | 0 (0.0%) |
| Total | 584 (98.7%) | 8 (1.3%) |
Income Below Poverty Among Single-Parent Households in Grand Point
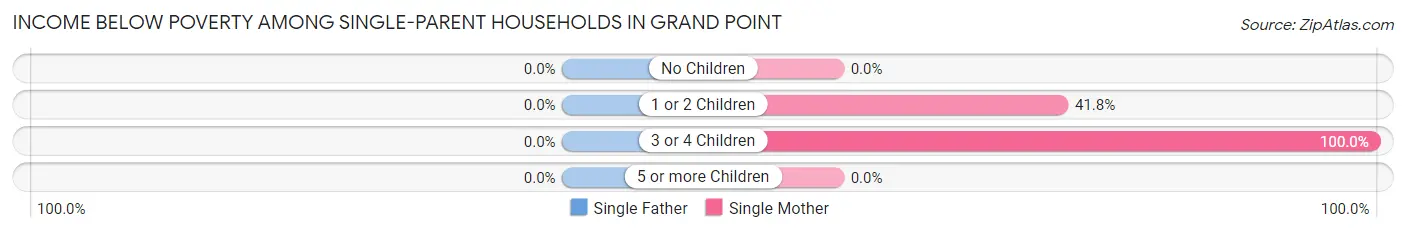
| Children | Single Father | Single Mother |
| No Children | 0 (0.0%) | 0 (0.0%) |
| 1 or 2 Children | 0 (0.0%) | 28 (41.8%) |
| 3 or 4 Children | 0 (0.0%) | 29 (100.0%) |
| 5 or more Children | 0 (0.0%) | 0 (0.0%) |
| Total | 0 (0.0%) | 57 (35.6%) |
Income Below Poverty Among Married-Couple vs Single-Parent Households in Grand Point
The poverty data for Grand Point shows that 8 of the married-couple family households (1.3%) and 57 of the single-parent households (31.5%) are living below the poverty level. Within the married-couple family households, those with 1 or 2 children have the highest poverty rate, with 8 households (5.2%) falling below the poverty line. Among the single-parent households, those with 3 or 4 children have the highest poverty rate, with 29 household (70.7%) living below poverty.
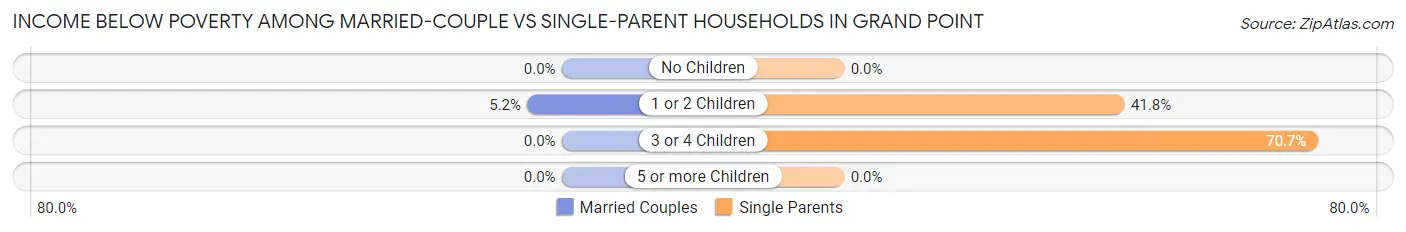
| Children | Married-Couple Families | Single-Parent Households |
| No Children | 0 (0.0%) | 0 (0.0%) |
| 1 or 2 Children | 8 (5.2%) | 28 (41.8%) |
| 3 or 4 Children | 0 (0.0%) | 29 (70.7%) |
| 5 or more Children | 0 (0.0%) | 0 (0.0%) |
| Total | 8 (1.3%) | 57 (31.5%) |
Race in Grand Point
The most populous races in Grand Point are White / Caucasian (1,445 | 57.1%), Black / African American (1,083 | 42.8%), and Asian (5 | 0.2%).
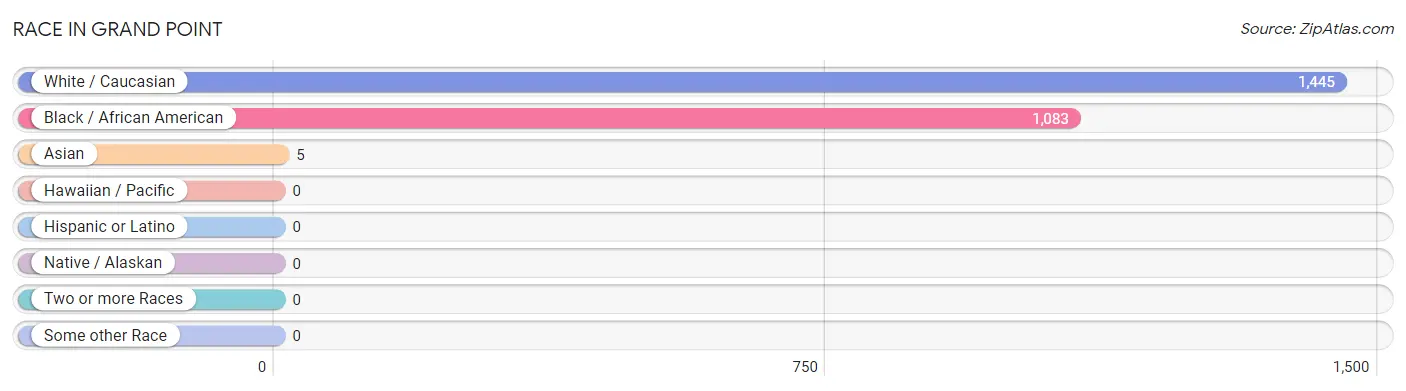
| Race | # Population | % Population |
| Asian | 5 | 0.2% |
| Black / African American | 1,083 | 42.8% |
| Hawaiian / Pacific | 0 | 0.0% |
| Hispanic or Latino | 0 | 0.0% |
| Native / Alaskan | 0 | 0.0% |
| White / Caucasian | 1,445 | 57.1% |
| Two or more Races | 0 | 0.0% |
| Some other Race | 0 | 0.0% |
| Total | 2,533 | 100.0% |
Ancestry in Grand Point
The most populous ancestries reported in Grand Point are French (425 | 16.8%), American (419 | 16.5%), German (199 | 7.9%), French Canadian (73 | 2.9%), and Irish (73 | 2.9%), together accounting for 46.9% of all Grand Point residents.
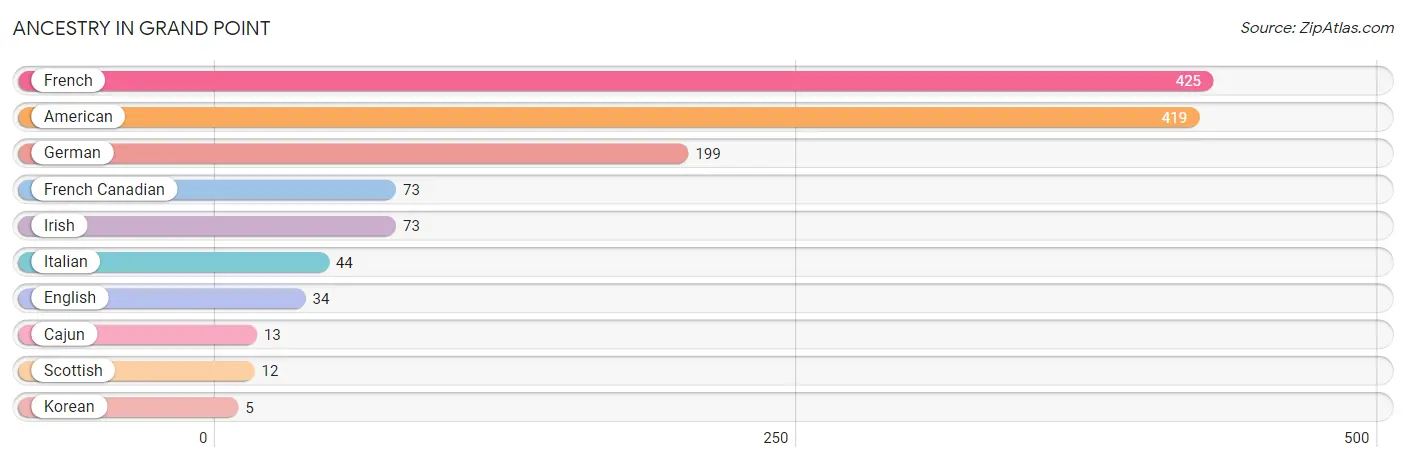
| Ancestry | # Population | % Population |
| American | 419 | 16.5% |
| Cajun | 13 | 0.5% |
| English | 34 | 1.3% |
| French | 425 | 16.8% |
| French Canadian | 73 | 2.9% |
| German | 199 | 7.9% |
| Irish | 73 | 2.9% |
| Italian | 44 | 1.7% |
| Korean | 5 | 0.2% |
| Scottish | 12 | 0.5% | View All 10 Rows |
Immigrants in Grand Point
The most numerous immigrant groups reported in Grand Point came from Asia (5 | 0.2%), Philippines (5 | 0.2%), and South Eastern Asia (5 | 0.2%), together accounting for 0.6% of all Grand Point residents.
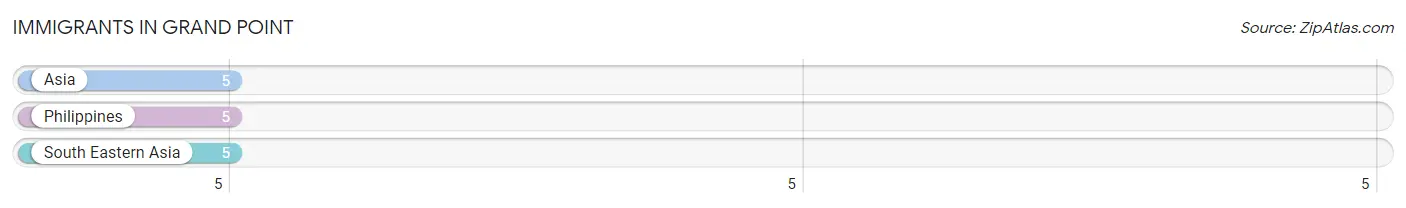
| Immigration Origin | # Population | % Population |
| Asia | 5 | 0.2% |
| Philippines | 5 | 0.2% |
| South Eastern Asia | 5 | 0.2% | View All 3 Rows |
Sex and Age in Grand Point
Sex and Age in Grand Point
The most populous age groups in Grand Point are 60 to 64 Years (141 | 12.9%) for men and 65 to 69 Years (161 | 11.2%) for women.
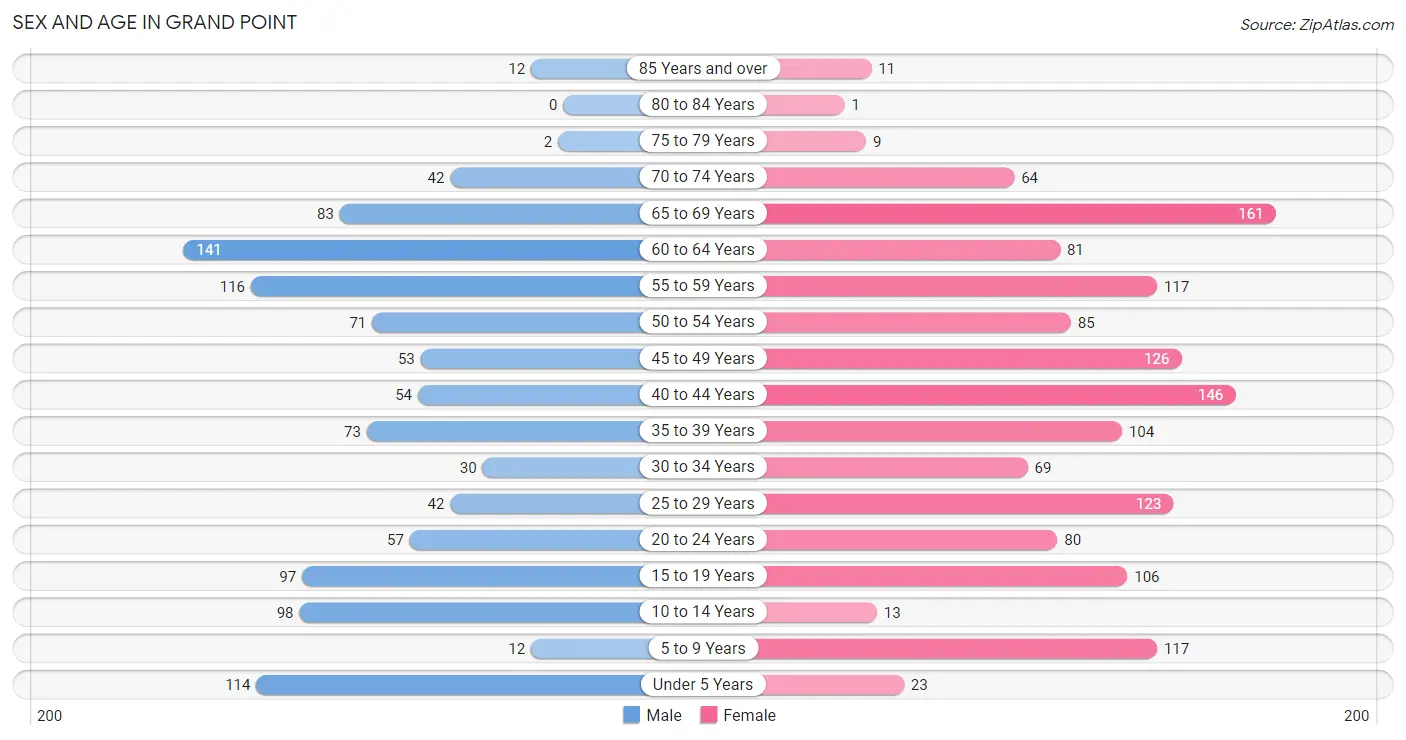
| Age Bracket | Male | Female |
| Under 5 Years | 114 (10.4%) | 23 (1.6%) |
| 5 to 9 Years | 12 (1.1%) | 117 (8.2%) |
| 10 to 14 Years | 98 (8.9%) | 13 (0.9%) |
| 15 to 19 Years | 97 (8.8%) | 106 (7.4%) |
| 20 to 24 Years | 57 (5.2%) | 80 (5.6%) |
| 25 to 29 Years | 42 (3.8%) | 123 (8.6%) |
| 30 to 34 Years | 30 (2.7%) | 69 (4.8%) |
| 35 to 39 Years | 73 (6.7%) | 104 (7.2%) |
| 40 to 44 Years | 54 (4.9%) | 146 (10.2%) |
| 45 to 49 Years | 53 (4.8%) | 126 (8.8%) |
| 50 to 54 Years | 71 (6.5%) | 85 (5.9%) |
| 55 to 59 Years | 116 (10.6%) | 117 (8.2%) |
| 60 to 64 Years | 141 (12.9%) | 81 (5.6%) |
| 65 to 69 Years | 83 (7.6%) | 161 (11.2%) |
| 70 to 74 Years | 42 (3.8%) | 64 (4.5%) |
| 75 to 79 Years | 2 (0.2%) | 9 (0.6%) |
| 80 to 84 Years | 0 (0.0%) | 1 (0.1%) |
| 85 Years and over | 12 (1.1%) | 11 (0.8%) |
| Total | 1,097 (100.0%) | 1,436 (100.0%) |
Families and Households in Grand Point
Median Family Size in Grand Point
The median family size in Grand Point is 3.14 persons per family, with single female/mother families (160 | 20.7%) accounting for the largest median family size of 4.76 persons per family. On the other hand, married-couple families (592 | 76.6%) represent the smallest median family size with 2.68 persons per family.
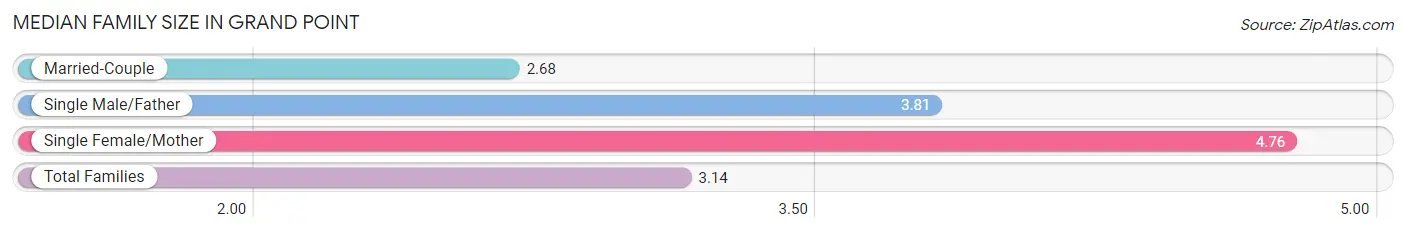
| Family Type | # Families | Family Size |
| Married-Couple | 592 (76.6%) | 2.68 |
| Single Male/Father | 21 (2.7%) | 3.81 |
| Single Female/Mother | 160 (20.7%) | 4.76 |
| Total Families | 773 (100.0%) | 3.14 |
Median Household Size in Grand Point
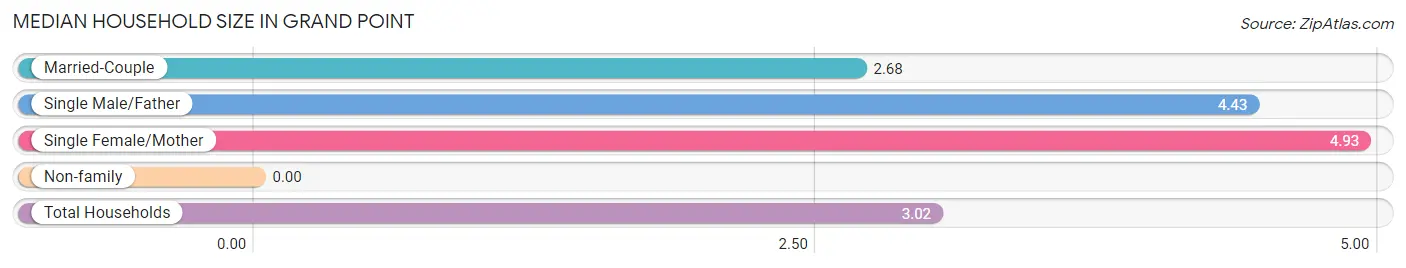
| Household Type | # Households | Household Size |
| Married-Couple | 592 (70.6%) | 2.68 |
| Single Male/Father | 21 (2.5%) | 4.43 |
| Single Female/Mother | 160 (19.1%) | 4.93 |
| Non-family | 65 (7.8%) | - |
| Total Households | 838 (100.0%) | 3.02 |
Household Size by Marriage Status in Grand Point
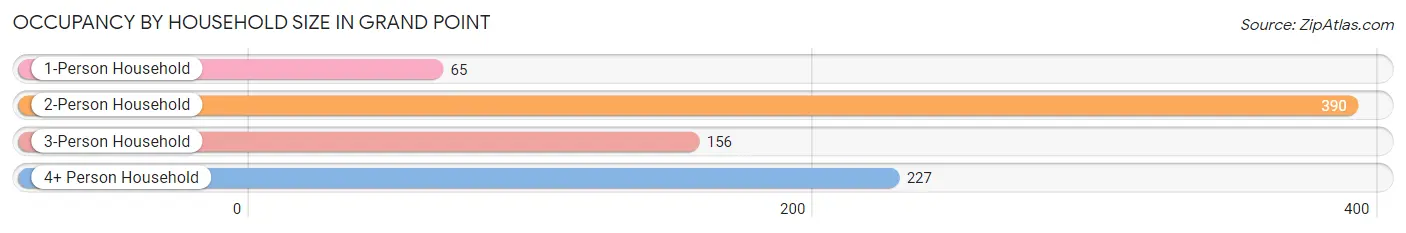
Out of a total of 838 households in Grand Point, 773 (92.2%) are family households, while 65 (7.8%) are nonfamily households. The most numerous type of family households are 2-person households, comprising 390, and the most common type of nonfamily households are 1-person households, comprising 65.
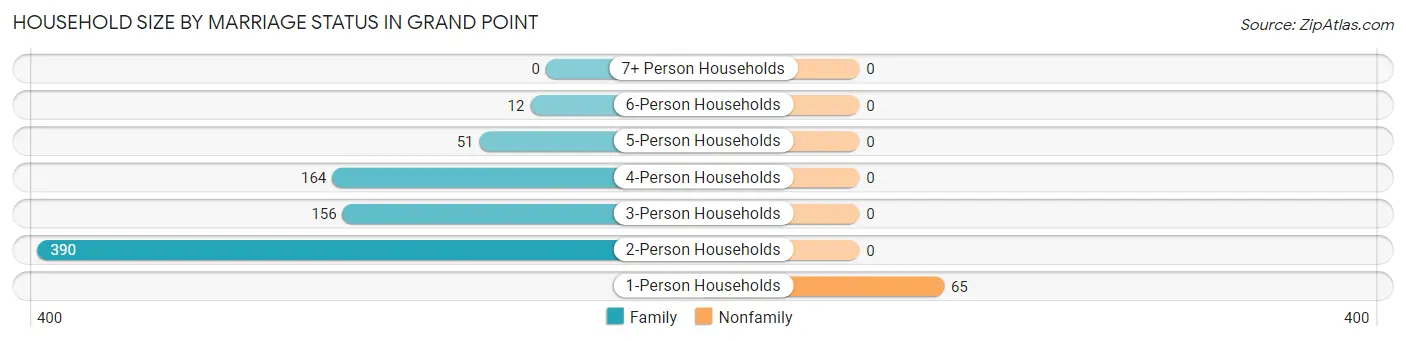
| Household Size | Family Households | Nonfamily Households |
| 1-Person Households | - | 65 (7.8%) |
| 2-Person Households | 390 (46.5%) | 0 (0.0%) |
| 3-Person Households | 156 (18.6%) | 0 (0.0%) |
| 4-Person Households | 164 (19.6%) | 0 (0.0%) |
| 5-Person Households | 51 (6.1%) | 0 (0.0%) |
| 6-Person Households | 12 (1.4%) | 0 (0.0%) |
| 7+ Person Households | 0 (0.0%) | 0 (0.0%) |
| Total | 773 (92.2%) | 65 (7.8%) |
Female Fertility in Grand Point
Fertility by Age in Grand Point
Average fertility rate in Grand Point is 14.0 births per 1,000 women. Women in the age bracket of 35 to 50 years have the highest fertility rate with 26.0 births per 1,000 women. Women in the age bracket of 35 to 50 years acount for 100.0% of all women with births.
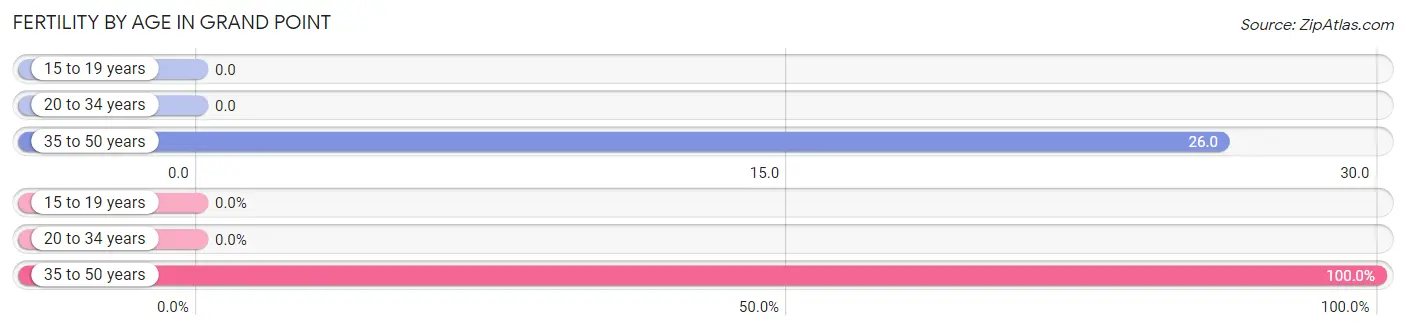
| Age Bracket | Women with Births | Births / 1,000 Women |
| 15 to 19 years | 0 (0.0%) | 0.0 |
| 20 to 34 years | 0 (0.0%) | 0.0 |
| 35 to 50 years | 11 (100.0%) | 26.0 |
| Total | 11 (100.0%) | 14.0 |
Fertility by Age by Marriage Status in Grand Point
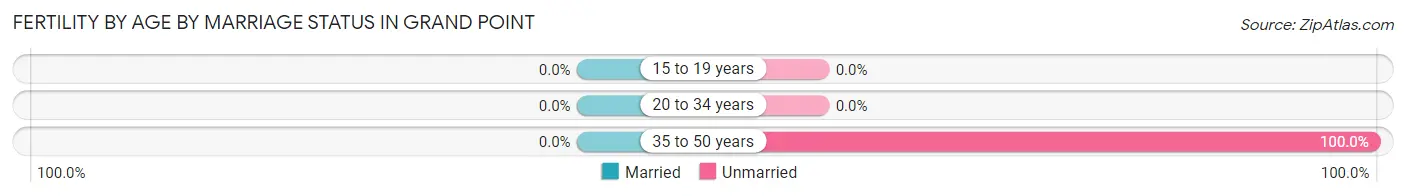
| Age Bracket | Married | Unmarried |
| 15 to 19 years | 0 (0.0%) | 0 (0.0%) |
| 20 to 34 years | 0 (0.0%) | 0 (0.0%) |
| 35 to 50 years | 0 (0.0%) | 11 (100.0%) |
| Total | 0 (0.0%) | 11 (100.0%) |
Fertility by Education in Grand Point
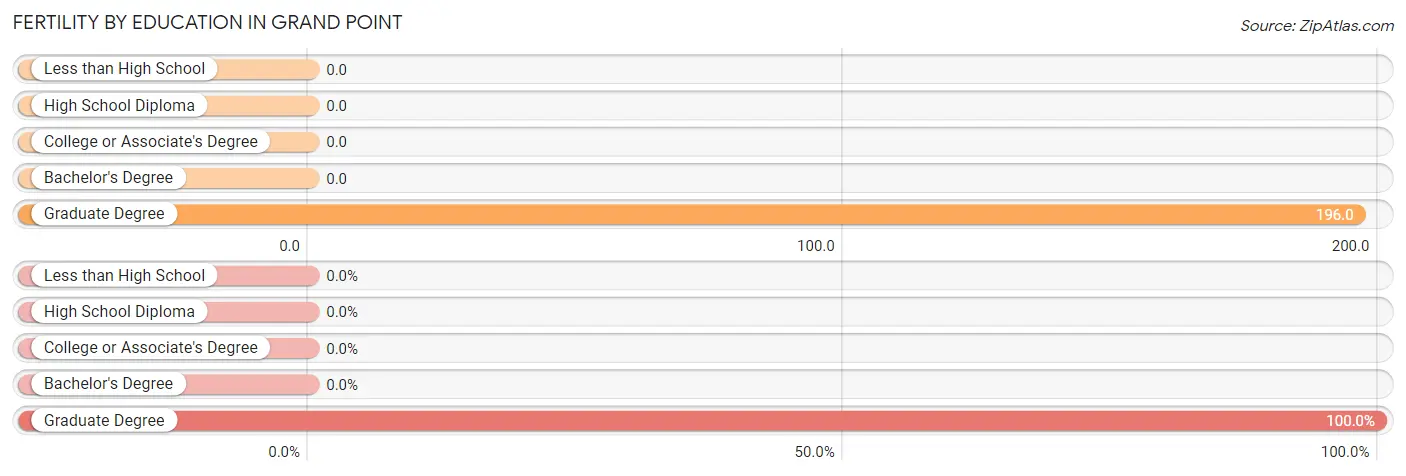
| Educational Attainment | Women with Births | Births / 1,000 Women |
| Less than High School | 0 (0.0%) | 0.0 |
| High School Diploma | 0 (0.0%) | 0.0 |
| College or Associate's Degree | 0 (0.0%) | 0.0 |
| Bachelor's Degree | 0 (0.0%) | 0.0 |
| Graduate Degree | 11 (100.0%) | 196.0 |
| Total | 11 (100.0%) | 14.0 |
Fertility by Education by Marriage Status in Grand Point
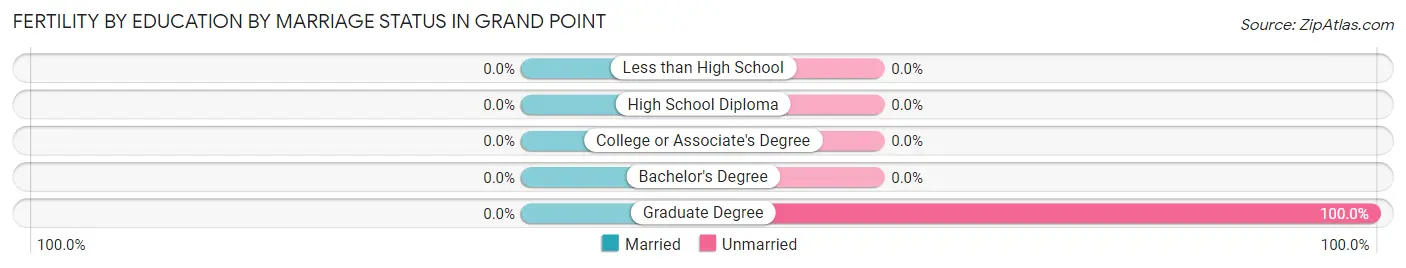
| Educational Attainment | Married | Unmarried |
| Less than High School | 0 (0.0%) | 0 (0.0%) |
| High School Diploma | 0 (0.0%) | 0 (0.0%) |
| College or Associate's Degree | 0 (0.0%) | 0 (0.0%) |
| Bachelor's Degree | 0 (0.0%) | 0 (0.0%) |
| Graduate Degree | 0 (0.0%) | 11 (100.0%) |
| Total | 0 (0.0%) | 11 (100.0%) |
Employment Characteristics in Grand Point
Employment by Class of Employer in Grand Point
Among the 1,442 employed individuals in Grand Point, private company employees (996 | 69.1%), local government employees (222 | 15.4%), and not-for-profit organizations (84 | 5.8%) make up the most common classes of employment.
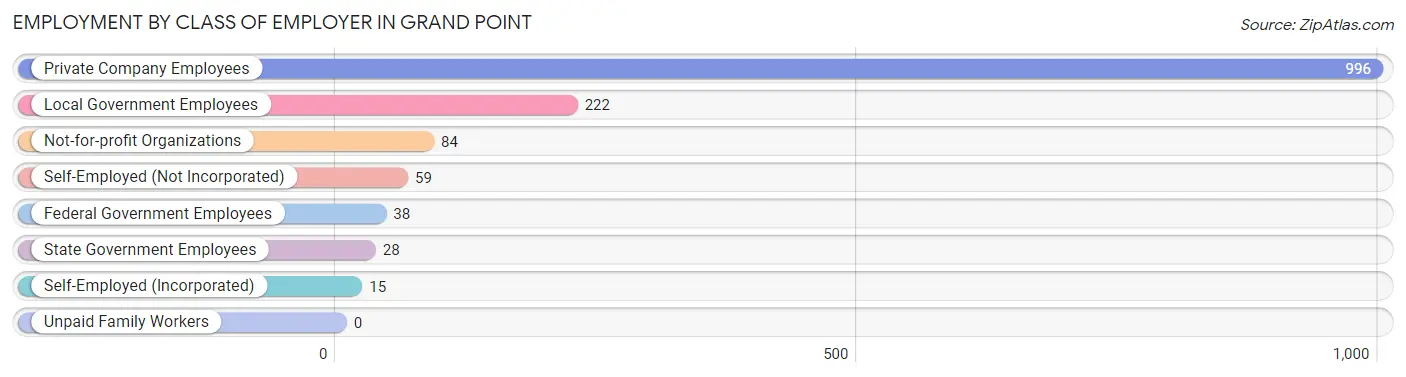
| Employer Class | # Employees | % Employees |
| Private Company Employees | 996 | 69.1% |
| Self-Employed (Incorporated) | 15 | 1.0% |
| Self-Employed (Not Incorporated) | 59 | 4.1% |
| Not-for-profit Organizations | 84 | 5.8% |
| Local Government Employees | 222 | 15.4% |
| State Government Employees | 28 | 1.9% |
| Federal Government Employees | 38 | 2.6% |
| Unpaid Family Workers | 0 | 0.0% |
| Total | 1,442 | 100.0% |
Employment Status by Age in Grand Point
According to the labor force statistics for Grand Point, out of the total population over 16 years of age (2,136), 71.9% or 1,536 individuals are in the labor force, with 3.8% or 58 of them unemployed. The age group with the highest labor force participation rate is 25 to 29 years, with 100.0% or 165 individuals in the labor force. Within the labor force, the 16 to 19 years age range has the highest percentage of unemployed individuals, with 19.4% or 26 of them being unemployed.
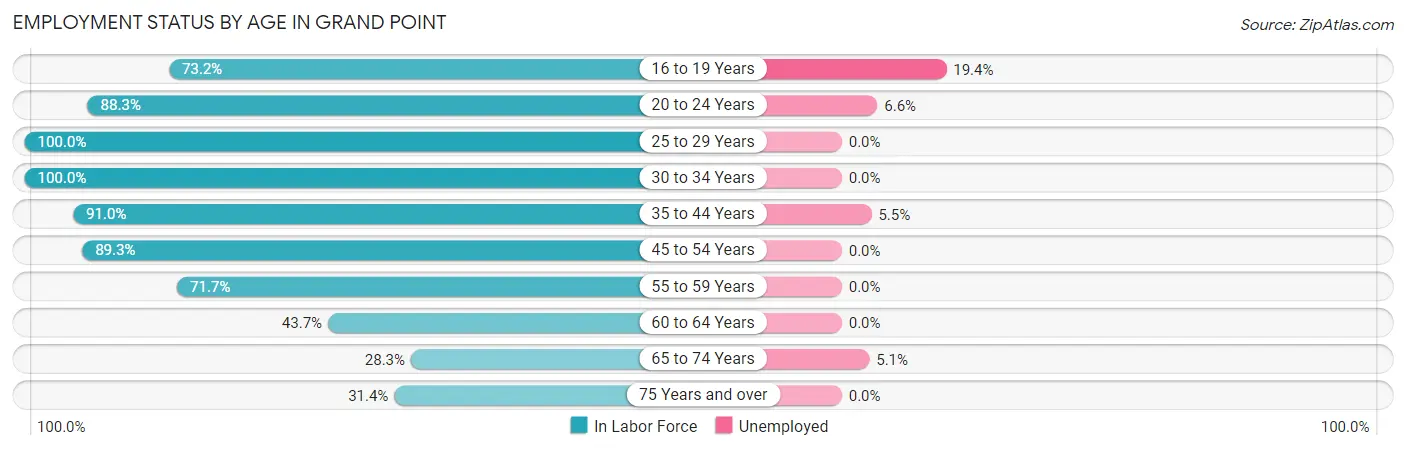
| Age Bracket | In Labor Force | Unemployed |
| 16 to 19 Years | 134 (73.2%) | 26 (19.4%) |
| 20 to 24 Years | 121 (88.3%) | 8 (6.6%) |
| 25 to 29 Years | 165 (100.0%) | 0 (0.0%) |
| 30 to 34 Years | 99 (100.0%) | 0 (0.0%) |
| 35 to 44 Years | 343 (91.0%) | 19 (5.5%) |
| 45 to 54 Years | 299 (89.3%) | 0 (0.0%) |
| 55 to 59 Years | 167 (71.7%) | 0 (0.0%) |
| 60 to 64 Years | 97 (43.7%) | 0 (0.0%) |
| 65 to 74 Years | 99 (28.3%) | 5 (5.1%) |
| 75 Years and over | 11 (31.4%) | 0 (0.0%) |
| Total | 1,536 (71.9%) | 58 (3.8%) |
Employment Status by Educational Attainment in Grand Point
According to labor force statistics for Grand Point, 81.8% of individuals (1,171) out of the total population between 25 and 64 years of age (1,431) are in the labor force, with 1.6% or 19 of them being unemployed. The group with the highest labor force participation rate are those with the educational attainment of bachelor's degree or higher, with 98.0% or 293 individuals in the labor force. Within the labor force, individuals with less than high school education have the highest percentage of unemployment, with 16.3% or 7 of them being unemployed.
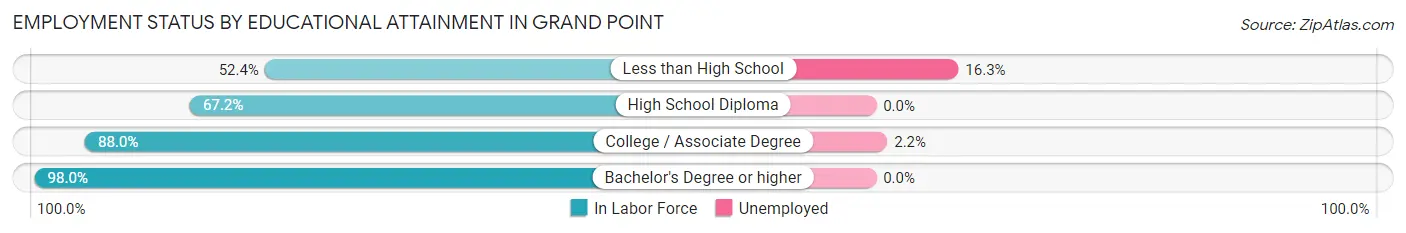
| Educational Attainment | In Labor Force | Unemployed |
| Less than High School | 43 (52.4%) | 13 (16.3%) |
| High School Diploma | 291 (67.2%) | 0 (0.0%) |
| College / Associate Degree | 543 (88.0%) | 14 (2.2%) |
| Bachelor's Degree or higher | 293 (98.0%) | 0 (0.0%) |
| Total | 1,171 (81.8%) | 23 (1.6%) |
Employment Occupations by Sex in Grand Point
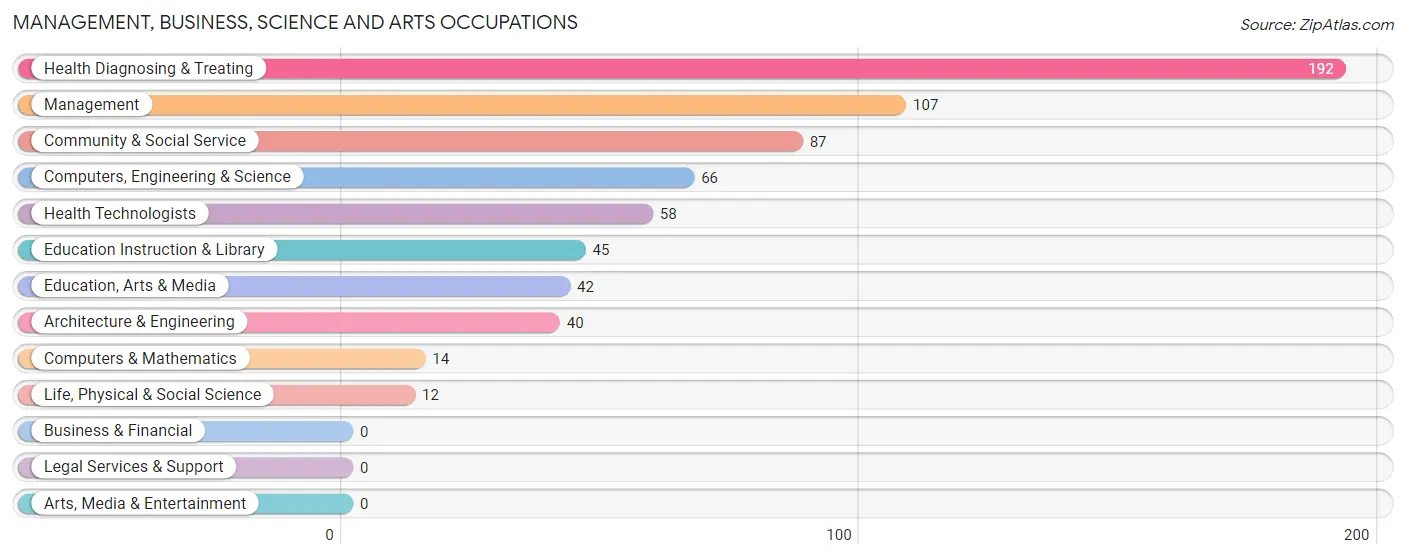
Management, Business, Science and Arts Occupations
The most common Management, Business, Science and Arts occupations in Grand Point are Health Diagnosing & Treating (192 | 13.0%), Management (107 | 7.2%), Community & Social Service (87 | 5.9%), Computers, Engineering & Science (66 | 4.5%), and Health Technologists (58 | 3.9%).
Management, Business, Science and Arts Occupations by Sex
Within the Management, Business, Science and Arts occupations in Grand Point, the most male-oriented occupations are Computers & Mathematics (100.0%), Life, Physical & Social Science (100.0%), and Computers, Engineering & Science (81.8%), while the most female-oriented occupations are Health Diagnosing & Treating (100.0%), Health Technologists (100.0%), and Education, Arts & Media (88.1%).
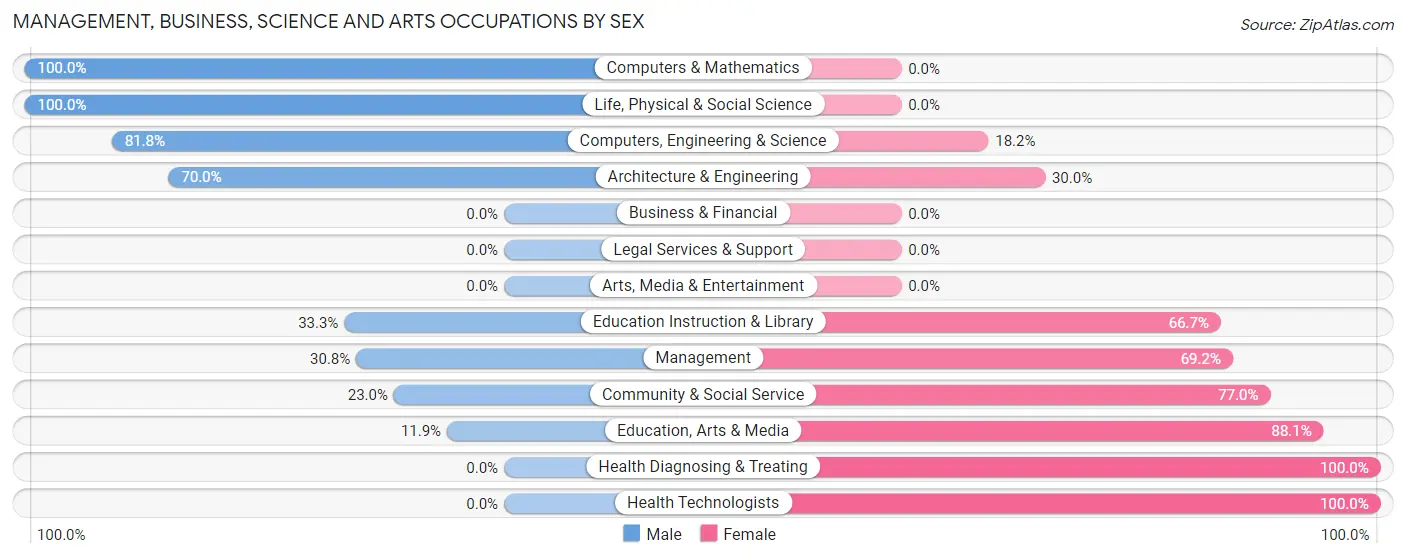
| Occupation | Male | Female |
| Management | 33 (30.8%) | 74 (69.2%) |
| Business & Financial | 0 (0.0%) | 0 (0.0%) |
| Computers, Engineering & Science | 54 (81.8%) | 12 (18.2%) |
| Computers & Mathematics | 14 (100.0%) | 0 (0.0%) |
| Architecture & Engineering | 28 (70.0%) | 12 (30.0%) |
| Life, Physical & Social Science | 12 (100.0%) | 0 (0.0%) |
| Community & Social Service | 20 (23.0%) | 67 (77.0%) |
| Education, Arts & Media | 5 (11.9%) | 37 (88.1%) |
| Legal Services & Support | 0 (0.0%) | 0 (0.0%) |
| Education Instruction & Library | 15 (33.3%) | 30 (66.7%) |
| Arts, Media & Entertainment | 0 (0.0%) | 0 (0.0%) |
| Health Diagnosing & Treating | 0 (0.0%) | 192 (100.0%) |
| Health Technologists | 0 (0.0%) | 58 (100.0%) |
| Total (Category) | 107 (23.7%) | 345 (76.3%) |
| Total (Overall) | 587 (39.7%) | 890 (60.3%) |
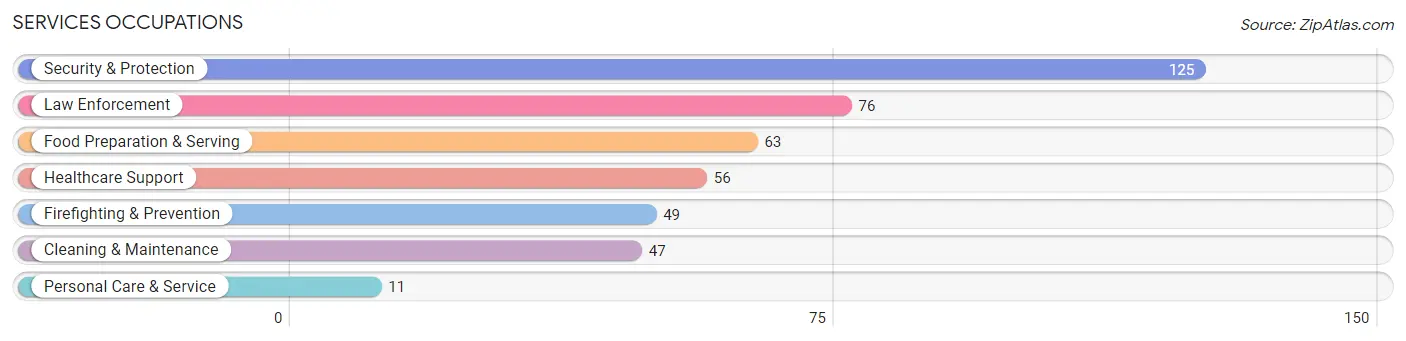
Services Occupations
The most common Services occupations in Grand Point are Security & Protection (125 | 8.5%), Law Enforcement (76 | 5.1%), Food Preparation & Serving (63 | 4.3%), Healthcare Support (56 | 3.8%), and Firefighting & Prevention (49 | 3.3%).
Services Occupations by Sex
Within the Services occupations in Grand Point, the most male-oriented occupations are Personal Care & Service (100.0%), Law Enforcement (56.6%), and Security & Protection (52.0%), while the most female-oriented occupations are Healthcare Support (100.0%), Food Preparation & Serving (85.7%), and Cleaning & Maintenance (61.7%).
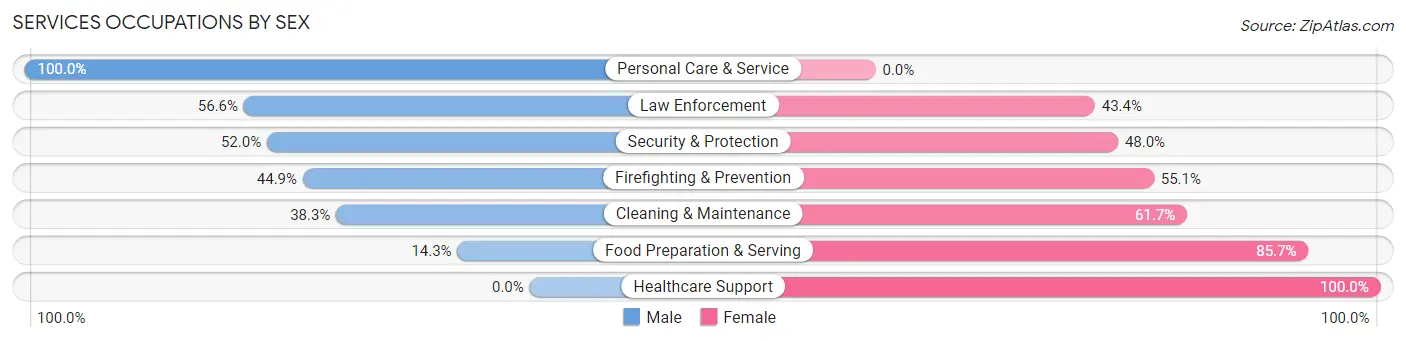
| Occupation | Male | Female |
| Healthcare Support | 0 (0.0%) | 56 (100.0%) |
| Security & Protection | 65 (52.0%) | 60 (48.0%) |
| Firefighting & Prevention | 22 (44.9%) | 27 (55.1%) |
| Law Enforcement | 43 (56.6%) | 33 (43.4%) |
| Food Preparation & Serving | 9 (14.3%) | 54 (85.7%) |
| Cleaning & Maintenance | 18 (38.3%) | 29 (61.7%) |
| Personal Care & Service | 11 (100.0%) | 0 (0.0%) |
| Total (Category) | 103 (34.1%) | 199 (65.9%) |
| Total (Overall) | 587 (39.7%) | 890 (60.3%) |
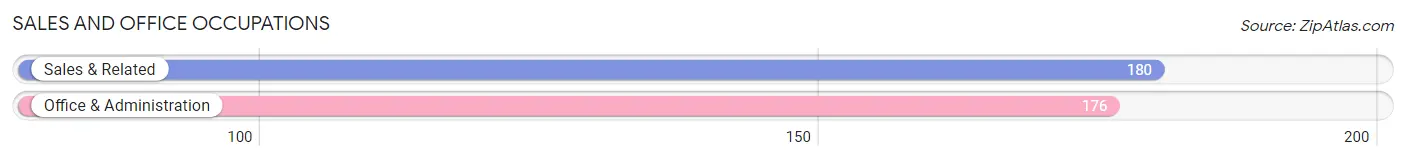
Sales and Office Occupations
The most common Sales and Office occupations in Grand Point are Sales & Related (180 | 12.2%), and Office & Administration (176 | 11.9%).
Sales and Office Occupations by Sex
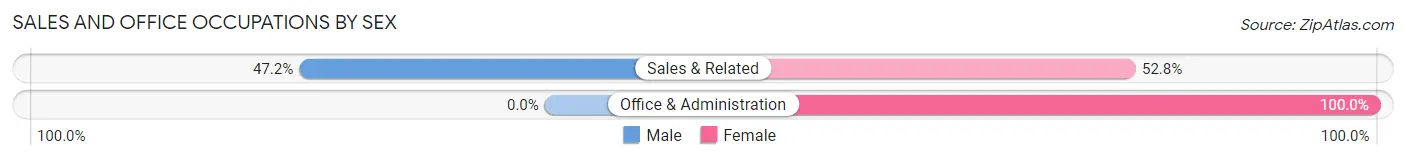
| Occupation | Male | Female |
| Sales & Related | 85 (47.2%) | 95 (52.8%) |
| Office & Administration | 0 (0.0%) | 176 (100.0%) |
| Total (Category) | 85 (23.9%) | 271 (76.1%) |
| Total (Overall) | 587 (39.7%) | 890 (60.3%) |
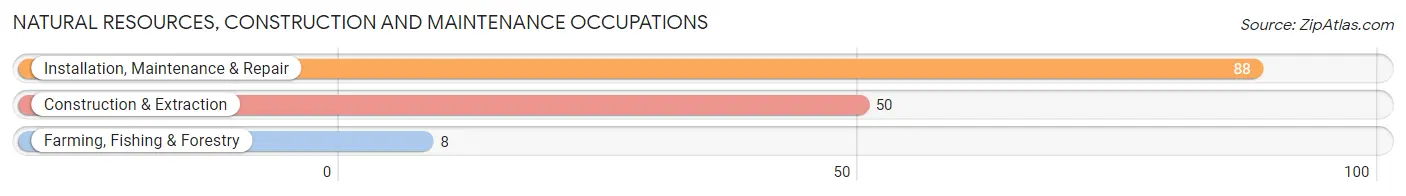
Natural Resources, Construction and Maintenance Occupations
The most common Natural Resources, Construction and Maintenance occupations in Grand Point are Installation, Maintenance & Repair (88 | 6.0%), Construction & Extraction (50 | 3.4%), and Farming, Fishing & Forestry (8 | 0.5%).
Natural Resources, Construction and Maintenance Occupations by Sex
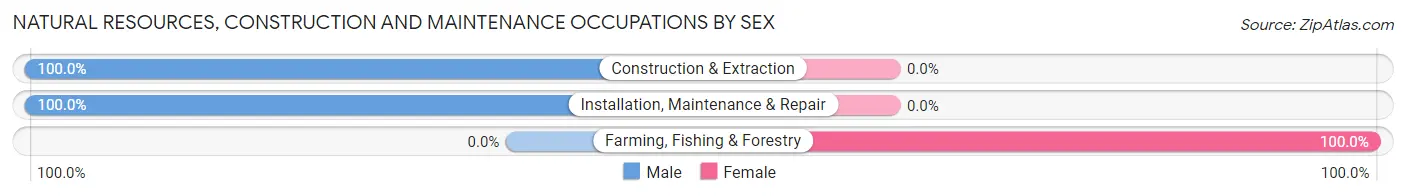
| Occupation | Male | Female |
| Farming, Fishing & Forestry | 0 (0.0%) | 8 (100.0%) |
| Construction & Extraction | 50 (100.0%) | 0 (0.0%) |
| Installation, Maintenance & Repair | 88 (100.0%) | 0 (0.0%) |
| Total (Category) | 138 (94.5%) | 8 (5.5%) |
| Total (Overall) | 587 (39.7%) | 890 (60.3%) |
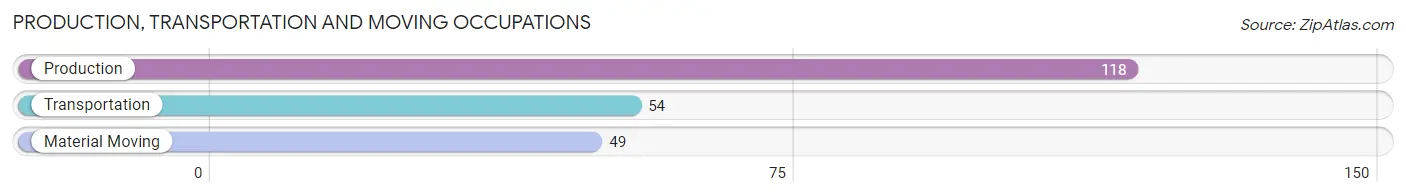
Production, Transportation and Moving Occupations
The most common Production, Transportation and Moving occupations in Grand Point are Production (118 | 8.0%), Transportation (54 | 3.7%), and Material Moving (49 | 3.3%).
Production, Transportation and Moving Occupations by Sex
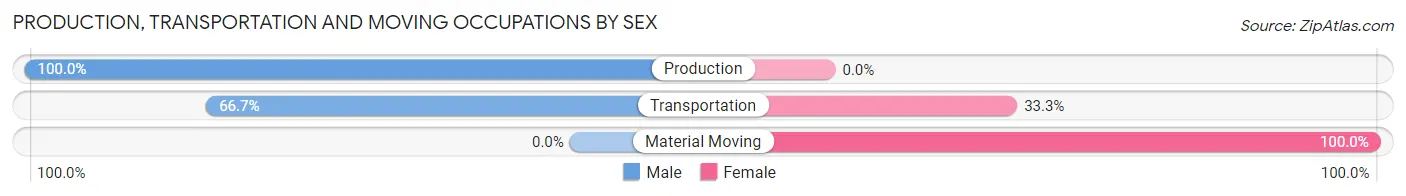
| Occupation | Male | Female |
| Production | 118 (100.0%) | 0 (0.0%) |
| Transportation | 36 (66.7%) | 18 (33.3%) |
| Material Moving | 0 (0.0%) | 49 (100.0%) |
| Total (Category) | 154 (69.7%) | 67 (30.3%) |
| Total (Overall) | 587 (39.7%) | 890 (60.3%) |
Employment Industries by Sex in Grand Point
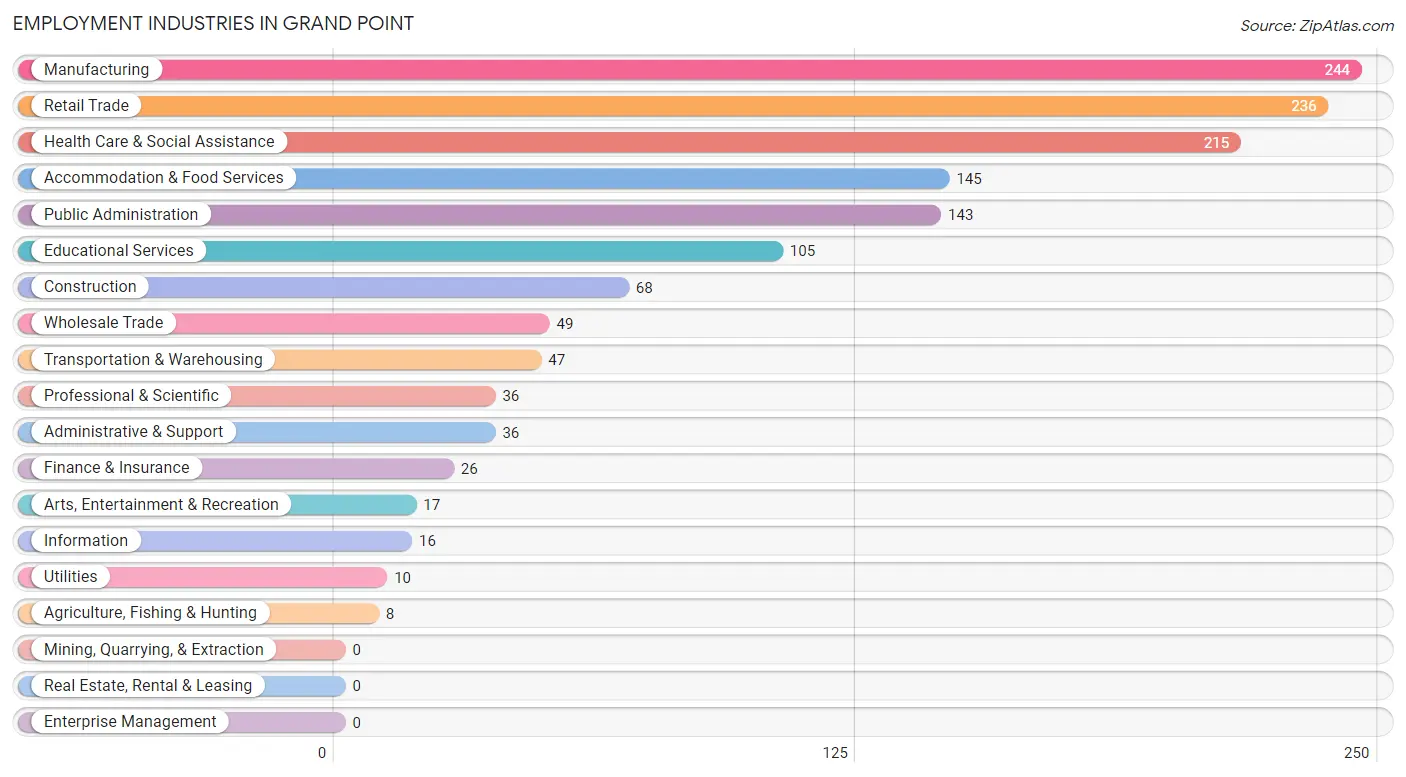
Employment Industries in Grand Point
The major employment industries in Grand Point include Manufacturing (244 | 16.5%), Retail Trade (236 | 16.0%), Health Care & Social Assistance (215 | 14.6%), Accommodation & Food Services (145 | 9.8%), and Public Administration (143 | 9.7%).
Employment Industries by Sex in Grand Point
The Grand Point industries that see more men than women are Construction (100.0%), Wholesale Trade (100.0%), and Utilities (100.0%), whereas the industries that tend to have a higher number of women are Agriculture, Fishing & Hunting (100.0%), Information (100.0%), and Finance & Insurance (100.0%).
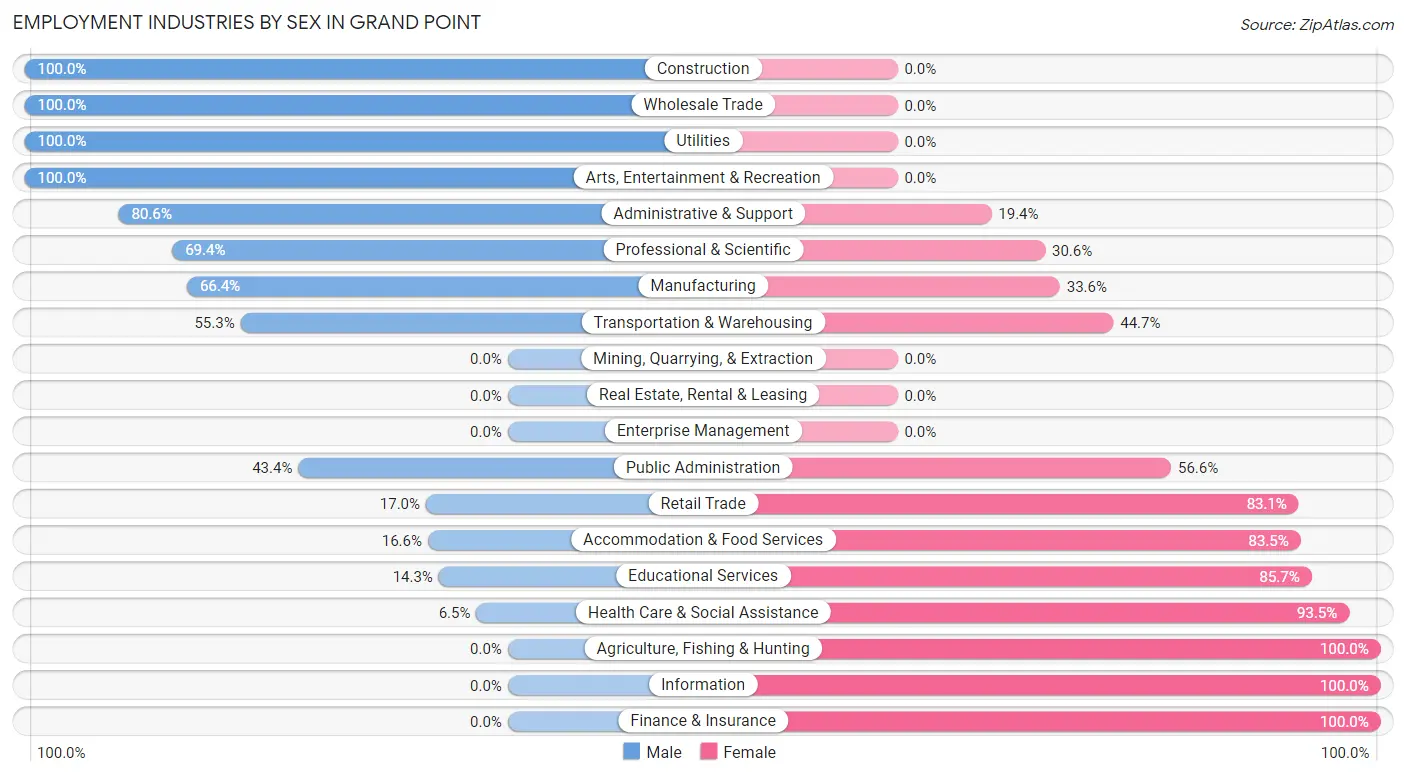
| Industry | Male | Female |
| Agriculture, Fishing & Hunting | 0 (0.0%) | 8 (100.0%) |
| Mining, Quarrying, & Extraction | 0 (0.0%) | 0 (0.0%) |
| Construction | 68 (100.0%) | 0 (0.0%) |
| Manufacturing | 162 (66.4%) | 82 (33.6%) |
| Wholesale Trade | 49 (100.0%) | 0 (0.0%) |
| Retail Trade | 40 (17.0%) | 196 (83.1%) |
| Transportation & Warehousing | 26 (55.3%) | 21 (44.7%) |
| Utilities | 10 (100.0%) | 0 (0.0%) |
| Information | 0 (0.0%) | 16 (100.0%) |
| Finance & Insurance | 0 (0.0%) | 26 (100.0%) |
| Real Estate, Rental & Leasing | 0 (0.0%) | 0 (0.0%) |
| Professional & Scientific | 25 (69.4%) | 11 (30.6%) |
| Enterprise Management | 0 (0.0%) | 0 (0.0%) |
| Administrative & Support | 29 (80.6%) | 7 (19.4%) |
| Educational Services | 15 (14.3%) | 90 (85.7%) |
| Health Care & Social Assistance | 14 (6.5%) | 201 (93.5%) |
| Arts, Entertainment & Recreation | 17 (100.0%) | 0 (0.0%) |
| Accommodation & Food Services | 24 (16.6%) | 121 (83.5%) |
| Public Administration | 62 (43.4%) | 81 (56.6%) |
| Total | 587 (39.7%) | 890 (60.3%) |
Education in Grand Point
School Enrollment in Grand Point
The most common levels of schooling among the 557 students in Grand Point are high school (169 | 30.3%), college / undergraduate (108 | 19.4%), and middle school (92 | 16.5%).
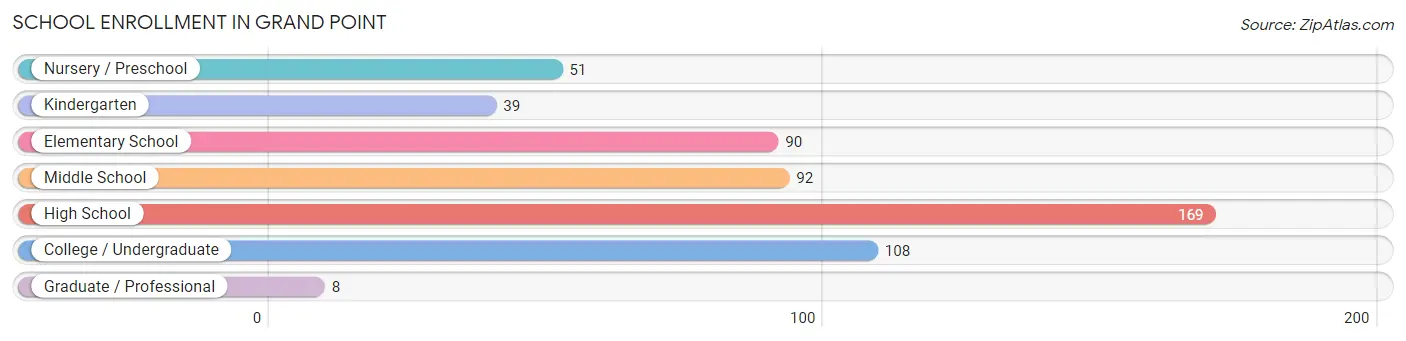
| School Level | # Students | % Students |
| Nursery / Preschool | 51 | 9.2% |
| Kindergarten | 39 | 7.0% |
| Elementary School | 90 | 16.2% |
| Middle School | 92 | 16.5% |
| High School | 169 | 30.3% |
| College / Undergraduate | 108 | 19.4% |
| Graduate / Professional | 8 | 1.4% |
| Total | 557 | 100.0% |
School Enrollment by Age by Funding Source in Grand Point
Out of a total of 557 students who are enrolled in schools in Grand Point, 40 (7.2%) attend a private institution, while the remaining 517 (92.8%) are enrolled in public schools. The age group of 25 to 34 year olds has the highest likelihood of being enrolled in private schools, with 14 (35.0% in the age bracket) enrolled. Conversely, the age group of 3 to 4 year olds has the lowest likelihood of being enrolled in a private school, with 51 (100.0% in the age bracket) attending a public institution.
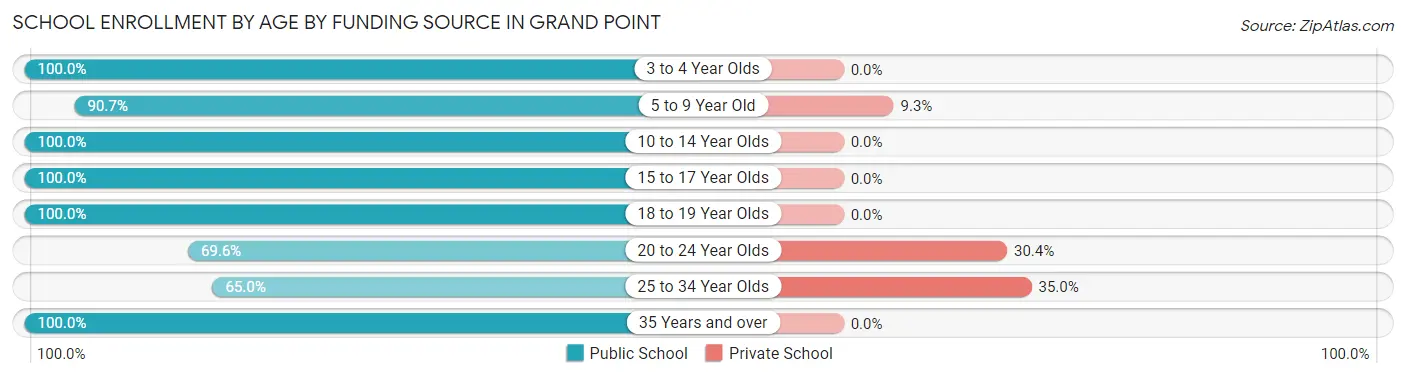
| Age Bracket | Public School | Private School |
| 3 to 4 Year Olds | 51 (100.0%) | 0 (0.0%) |
| 5 to 9 Year Old | 117 (90.7%) | 12 (9.3%) |
| 10 to 14 Year Olds | 111 (100.0%) | 0 (0.0%) |
| 15 to 17 Year Olds | 83 (100.0%) | 0 (0.0%) |
| 18 to 19 Year Olds | 90 (100.0%) | 0 (0.0%) |
| 20 to 24 Year Olds | 32 (69.6%) | 14 (30.4%) |
| 25 to 34 Year Olds | 26 (65.0%) | 14 (35.0%) |
| 35 Years and over | 7 (100.0%) | 0 (0.0%) |
| Total | 517 (92.8%) | 40 (7.2%) |
Educational Attainment by Field of Study in Grand Point
Science & technology (69 | 22.1%), business (48 | 15.4%), physical & health sciences (38 | 12.2%), psychology (37 | 11.9%), and engineering (32 | 10.3%) are the most common fields of study among 312 individuals in Grand Point who have obtained a bachelor's degree or higher.
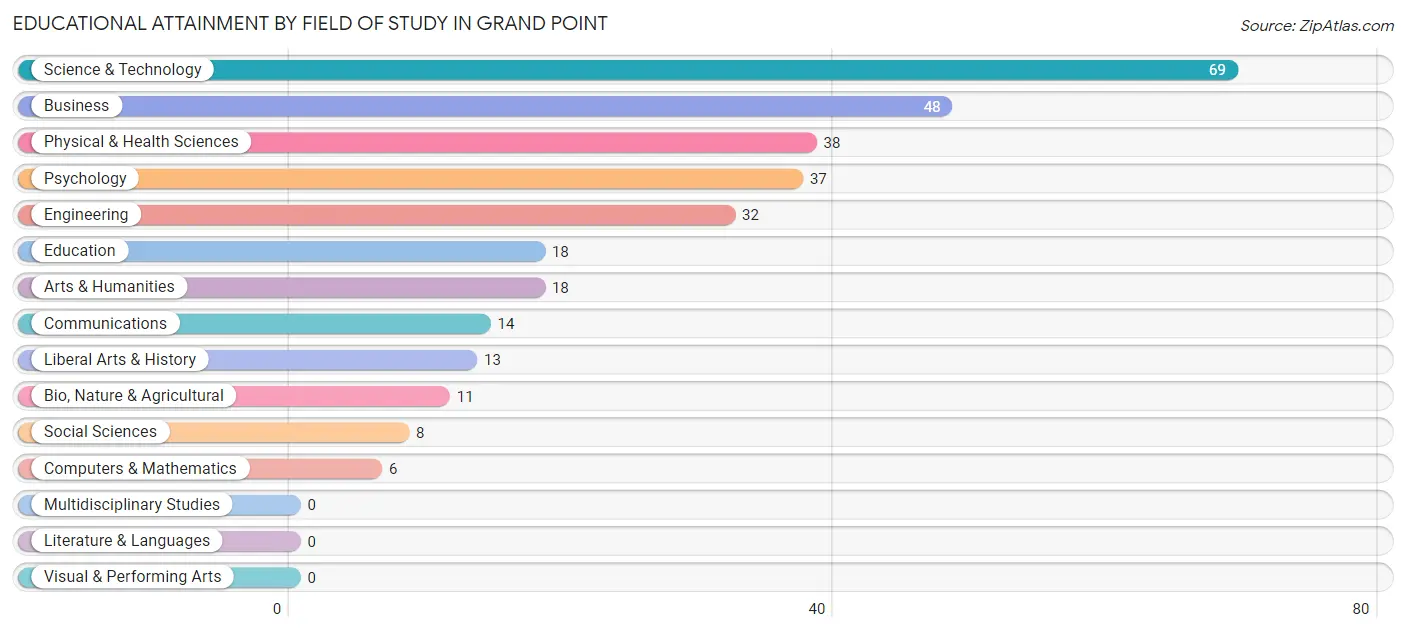
| Field of Study | # Graduates | % Graduates |
| Computers & Mathematics | 6 | 1.9% |
| Bio, Nature & Agricultural | 11 | 3.5% |
| Physical & Health Sciences | 38 | 12.2% |
| Psychology | 37 | 11.9% |
| Social Sciences | 8 | 2.6% |
| Engineering | 32 | 10.3% |
| Multidisciplinary Studies | 0 | 0.0% |
| Science & Technology | 69 | 22.1% |
| Business | 48 | 15.4% |
| Education | 18 | 5.8% |
| Literature & Languages | 0 | 0.0% |
| Liberal Arts & History | 13 | 4.2% |
| Visual & Performing Arts | 0 | 0.0% |
| Communications | 14 | 4.5% |
| Arts & Humanities | 18 | 5.8% |
| Total | 312 | 100.0% |
Transportation & Commute in Grand Point
Vehicle Availability by Sex in Grand Point
The most prevalent vehicle ownership categories in Grand Point are males with 2 vehicles (223, accounting for 38.7%) and females with 2 vehicles (300, making up 25.8%).
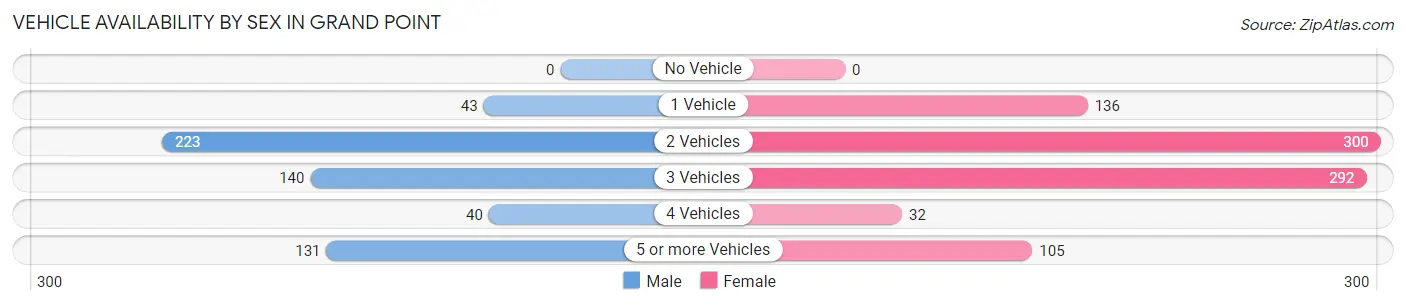
| Vehicles Available | Male | Female |
| No Vehicle | 0 (0.0%) | 0 (0.0%) |
| 1 Vehicle | 43 (7.4%) | 136 (15.7%) |
| 2 Vehicles | 223 (38.7%) | 300 (34.7%) |
| 3 Vehicles | 140 (24.3%) | 292 (33.8%) |
| 4 Vehicles | 40 (6.9%) | 32 (3.7%) |
| 5 or more Vehicles | 131 (22.7%) | 105 (12.1%) |
| Total | 577 (100.0%) | 865 (100.0%) |
Commute Time in Grand Point
The most frequently occuring commute durations in Grand Point are 10 to 14 minutes (315 commuters, 23.7%), 15 to 19 minutes (207 commuters, 15.6%), and 30 to 34 minutes (167 commuters, 12.6%).
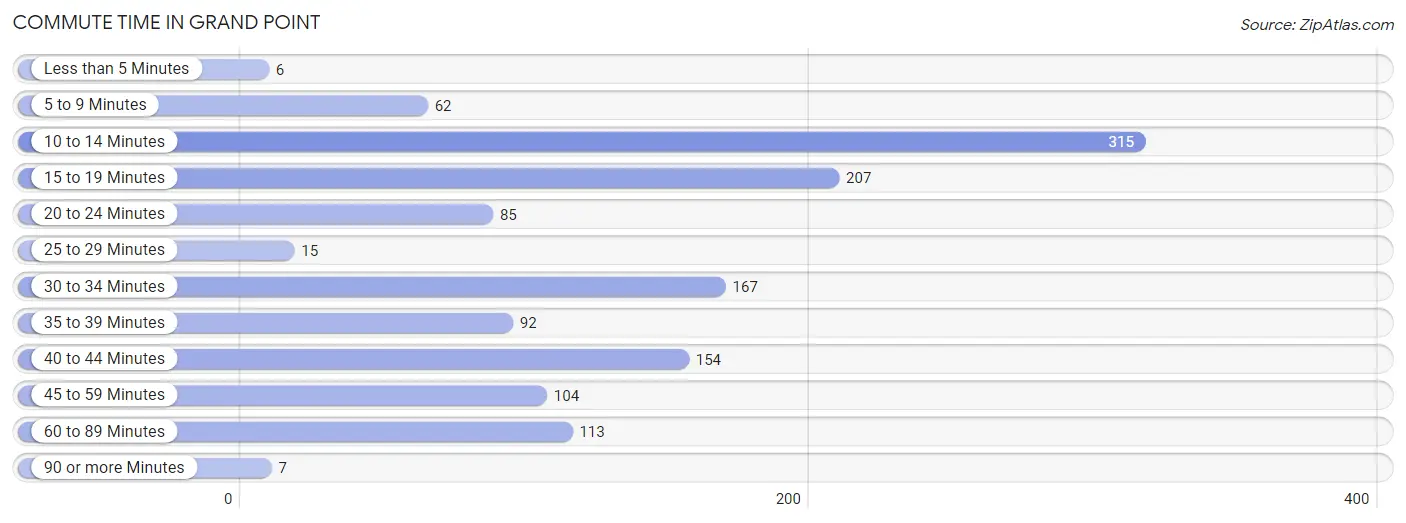
| Commute Time | # Commuters | % Commuters |
| Less than 5 Minutes | 6 | 0.4% |
| 5 to 9 Minutes | 62 | 4.7% |
| 10 to 14 Minutes | 315 | 23.7% |
| 15 to 19 Minutes | 207 | 15.6% |
| 20 to 24 Minutes | 85 | 6.4% |
| 25 to 29 Minutes | 15 | 1.1% |
| 30 to 34 Minutes | 167 | 12.6% |
| 35 to 39 Minutes | 92 | 6.9% |
| 40 to 44 Minutes | 154 | 11.6% |
| 45 to 59 Minutes | 104 | 7.8% |
| 60 to 89 Minutes | 113 | 8.5% |
| 90 or more Minutes | 7 | 0.5% |
Commute Time by Sex in Grand Point
The most common commute times in Grand Point are 10 to 14 minutes (216 commuters, 39.7%) for males and 40 to 44 minutes (127 commuters, 16.2%) for females.
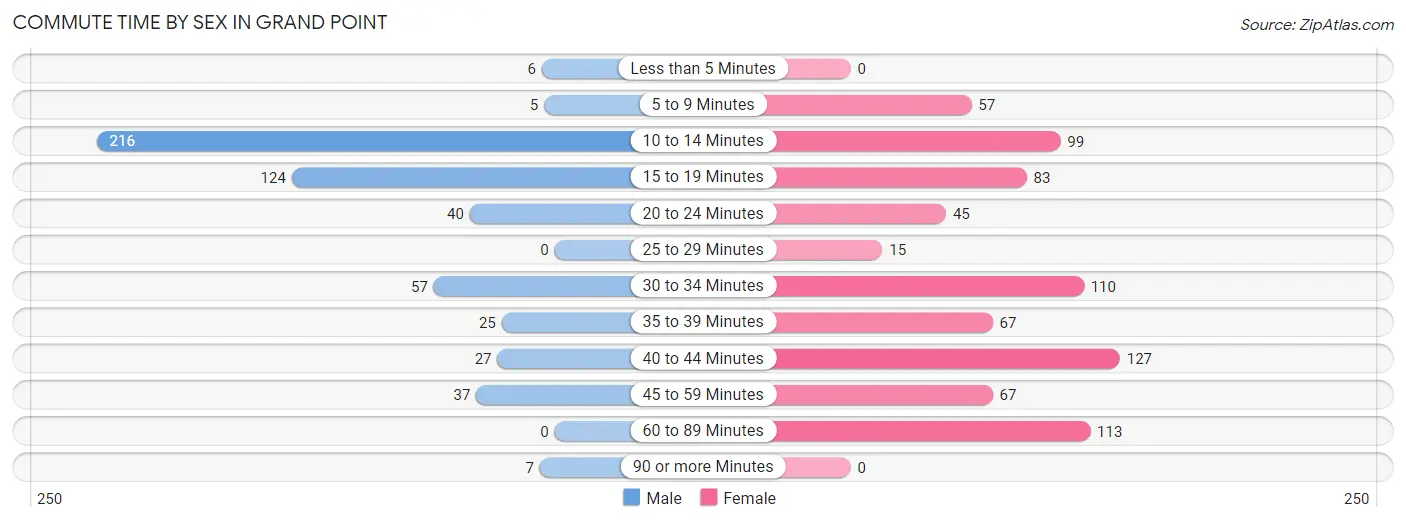
| Commute Time | Male | Female |
| Less than 5 Minutes | 6 (1.1%) | 0 (0.0%) |
| 5 to 9 Minutes | 5 (0.9%) | 57 (7.3%) |
| 10 to 14 Minutes | 216 (39.7%) | 99 (12.6%) |
| 15 to 19 Minutes | 124 (22.8%) | 83 (10.6%) |
| 20 to 24 Minutes | 40 (7.3%) | 45 (5.8%) |
| 25 to 29 Minutes | 0 (0.0%) | 15 (1.9%) |
| 30 to 34 Minutes | 57 (10.5%) | 110 (14.1%) |
| 35 to 39 Minutes | 25 (4.6%) | 67 (8.6%) |
| 40 to 44 Minutes | 27 (5.0%) | 127 (16.2%) |
| 45 to 59 Minutes | 37 (6.8%) | 67 (8.6%) |
| 60 to 89 Minutes | 0 (0.0%) | 113 (14.4%) |
| 90 or more Minutes | 7 (1.3%) | 0 (0.0%) |
Time of Departure to Work by Sex in Grand Point
The most frequent times of departure to work in Grand Point are 5:30 AM to 5:59 AM (161, 29.6%) for males and 7:00 AM to 7:29 AM (263, 33.6%) for females.
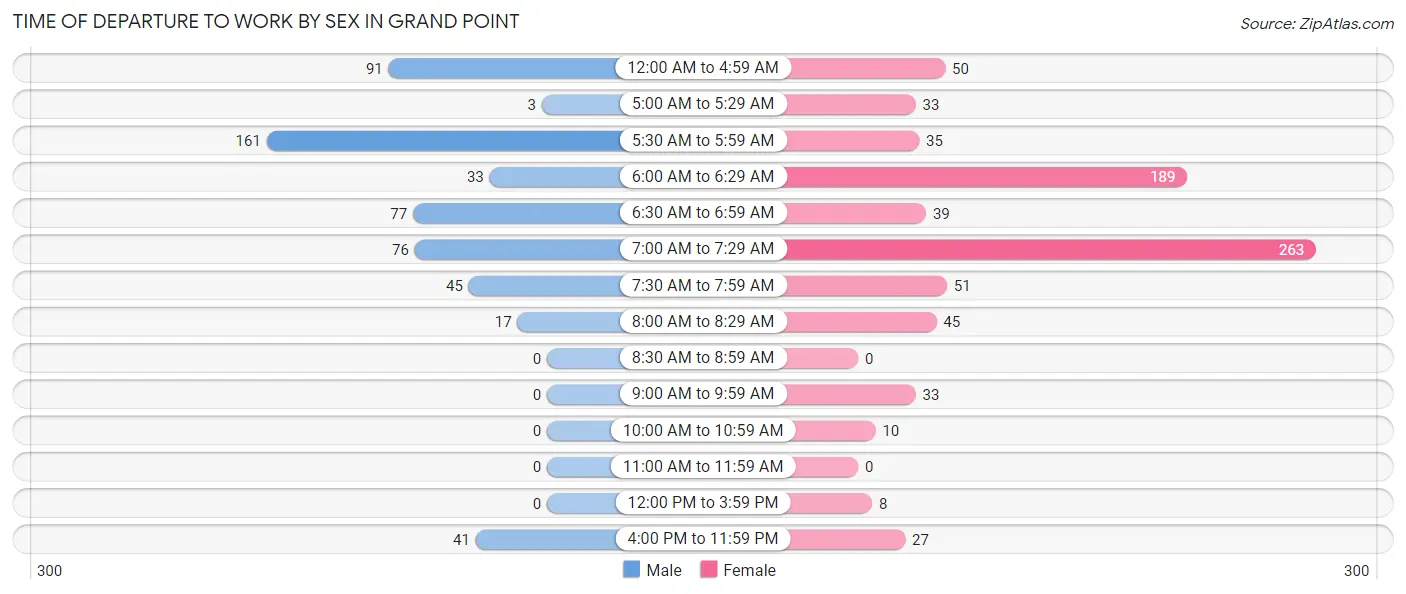
| Time of Departure | Male | Female |
| 12:00 AM to 4:59 AM | 91 (16.7%) | 50 (6.4%) |
| 5:00 AM to 5:29 AM | 3 (0.5%) | 33 (4.2%) |
| 5:30 AM to 5:59 AM | 161 (29.6%) | 35 (4.5%) |
| 6:00 AM to 6:29 AM | 33 (6.1%) | 189 (24.1%) |
| 6:30 AM to 6:59 AM | 77 (14.1%) | 39 (5.0%) |
| 7:00 AM to 7:29 AM | 76 (14.0%) | 263 (33.6%) |
| 7:30 AM to 7:59 AM | 45 (8.3%) | 51 (6.5%) |
| 8:00 AM to 8:29 AM | 17 (3.1%) | 45 (5.8%) |
| 8:30 AM to 8:59 AM | 0 (0.0%) | 0 (0.0%) |
| 9:00 AM to 9:59 AM | 0 (0.0%) | 33 (4.2%) |
| 10:00 AM to 10:59 AM | 0 (0.0%) | 10 (1.3%) |
| 11:00 AM to 11:59 AM | 0 (0.0%) | 0 (0.0%) |
| 12:00 PM to 3:59 PM | 0 (0.0%) | 8 (1.0%) |
| 4:00 PM to 11:59 PM | 41 (7.5%) | 27 (3.5%) |
| Total | 544 (100.0%) | 783 (100.0%) |
Housing Occupancy in Grand Point
Occupancy by Ownership in Grand Point
Of the total 838 dwellings in Grand Point, owner-occupied units account for 774 (92.4%), while renter-occupied units make up 64 (7.6%).
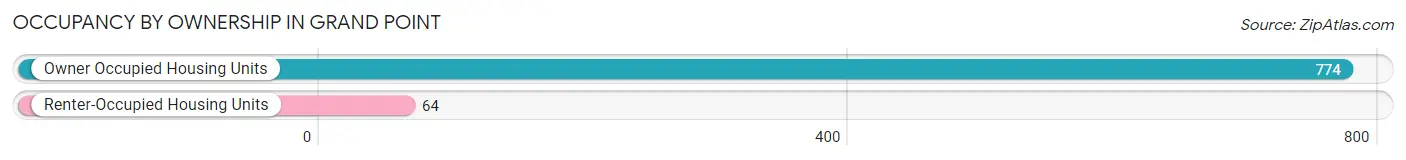
| Occupancy | # Housing Units | % Housing Units |
| Owner Occupied Housing Units | 774 | 92.4% |
| Renter-Occupied Housing Units | 64 | 7.6% |
| Total Occupied Housing Units | 838 | 100.0% |
Occupancy by Household Size in Grand Point
| Household Size | # Housing Units | % Housing Units |
| 1-Person Household | 65 | 7.8% |
| 2-Person Household | 390 | 46.5% |
| 3-Person Household | 156 | 18.6% |
| 4+ Person Household | 227 | 27.1% |
| Total Housing Units | 838 | 100.0% |
Occupancy by Ownership by Household Size in Grand Point
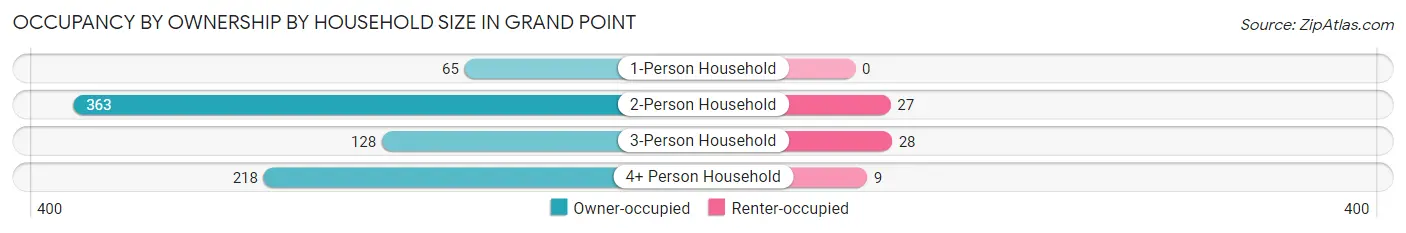
| Household Size | Owner-occupied | Renter-occupied |
| 1-Person Household | 65 (100.0%) | 0 (0.0%) |
| 2-Person Household | 363 (93.1%) | 27 (6.9%) |
| 3-Person Household | 128 (82.1%) | 28 (17.9%) |
| 4+ Person Household | 218 (96.0%) | 9 (4.0%) |
| Total Housing Units | 774 (92.4%) | 64 (7.6%) |
Occupancy by Educational Attainment in Grand Point
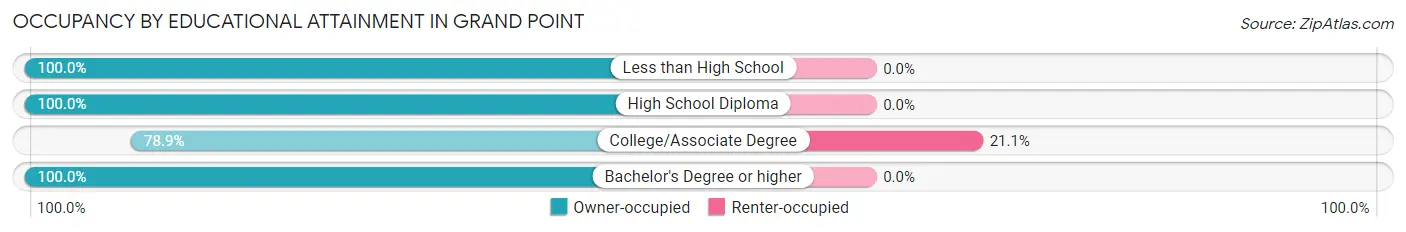
| Household Size | Owner-occupied | Renter-occupied |
| Less than High School | 26 (100.0%) | 0 (0.0%) |
| High School Diploma | 333 (100.0%) | 0 (0.0%) |
| College/Associate Degree | 239 (78.9%) | 64 (21.1%) |
| Bachelor's Degree or higher | 176 (100.0%) | 0 (0.0%) |
Occupancy by Age of Householder in Grand Point
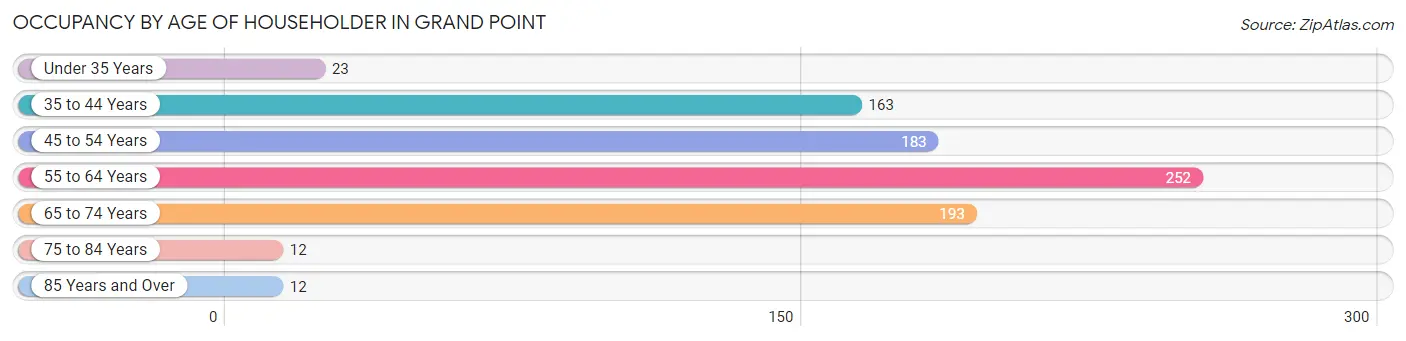
| Age Bracket | # Households | % Households |
| Under 35 Years | 23 | 2.7% |
| 35 to 44 Years | 163 | 19.5% |
| 45 to 54 Years | 183 | 21.8% |
| 55 to 64 Years | 252 | 30.1% |
| 65 to 74 Years | 193 | 23.0% |
| 75 to 84 Years | 12 | 1.4% |
| 85 Years and Over | 12 | 1.4% |
| Total | 838 | 100.0% |
Housing Finances in Grand Point
Median Income by Occupancy in Grand Point
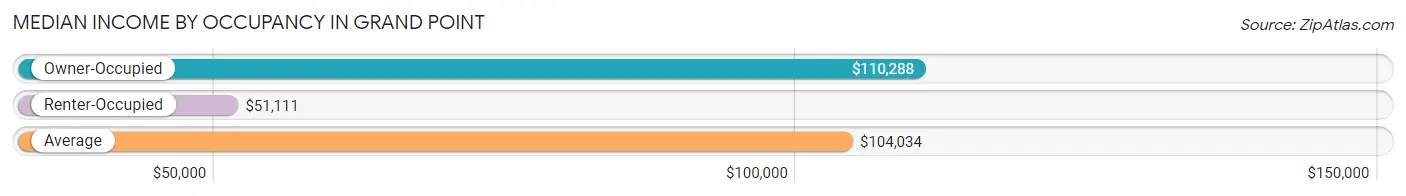
| Occupancy Type | # Households | Median Income |
| Owner-Occupied | 774 (92.4%) | $110,288 |
| Renter-Occupied | 64 (7.6%) | $51,111 |
| Average | 838 (100.0%) | $104,034 |
Occupancy by Householder Income Bracket in Grand Point
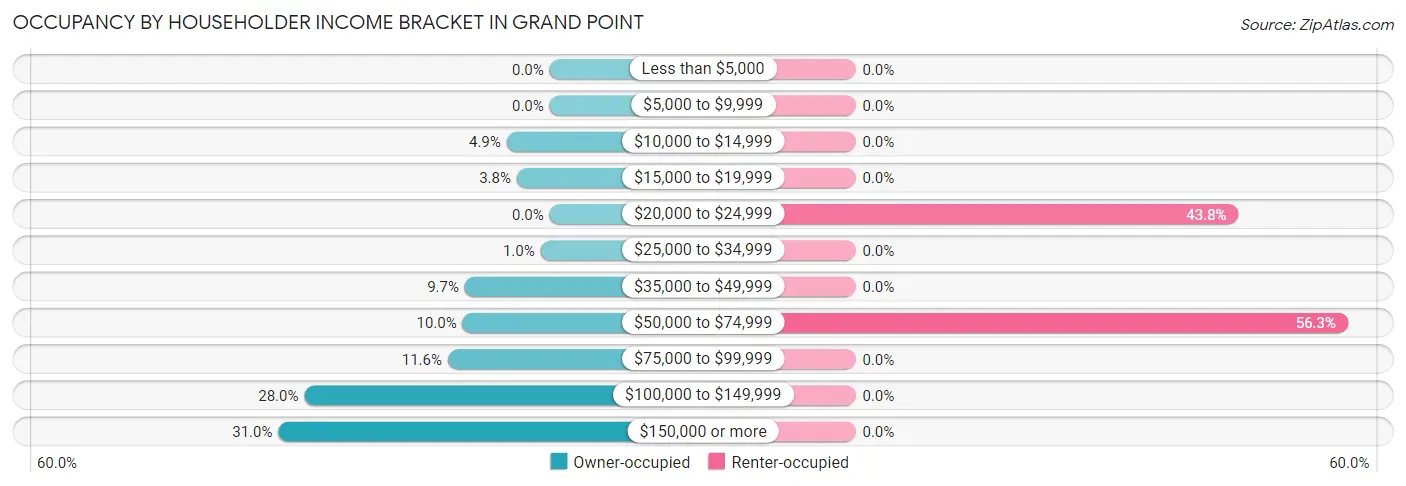
| Income Bracket | Owner-occupied | Renter-occupied |
| Less than $5,000 | 0 (0.0%) | 0 (0.0%) |
| $5,000 to $9,999 | 0 (0.0%) | 0 (0.0%) |
| $10,000 to $14,999 | 38 (4.9%) | 0 (0.0%) |
| $15,000 to $19,999 | 29 (3.7%) | 0 (0.0%) |
| $20,000 to $24,999 | 0 (0.0%) | 28 (43.8%) |
| $25,000 to $34,999 | 8 (1.0%) | 0 (0.0%) |
| $35,000 to $49,999 | 75 (9.7%) | 0 (0.0%) |
| $50,000 to $74,999 | 77 (10.0%) | 36 (56.2%) |
| $75,000 to $99,999 | 90 (11.6%) | 0 (0.0%) |
| $100,000 to $149,999 | 217 (28.0%) | 0 (0.0%) |
| $150,000 or more | 240 (31.0%) | 0 (0.0%) |
| Total | 774 (100.0%) | 64 (100.0%) |
Monthly Housing Cost Tiers in Grand Point
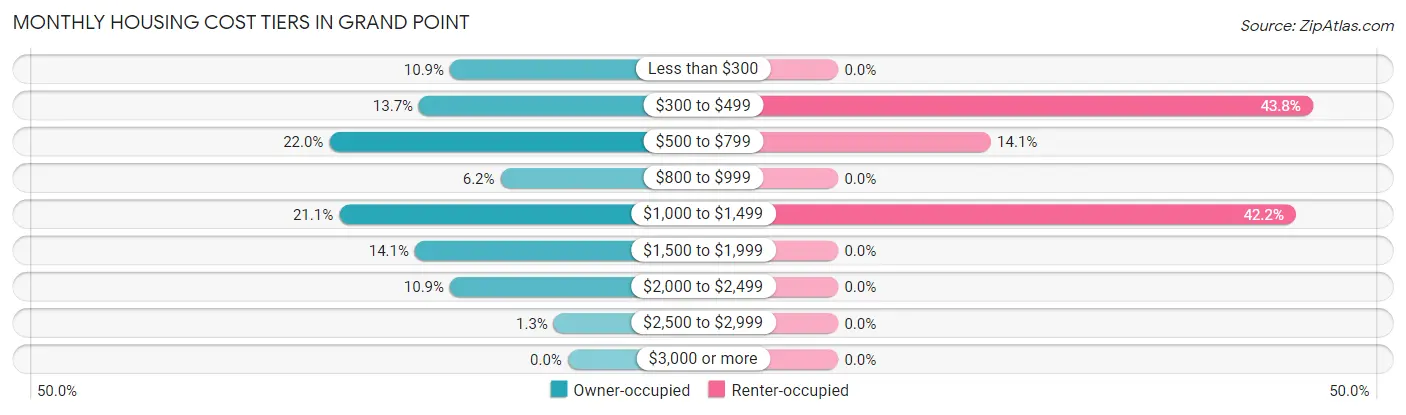
| Monthly Cost | Owner-occupied | Renter-occupied |
| Less than $300 | 84 (10.8%) | 0 (0.0%) |
| $300 to $499 | 106 (13.7%) | 28 (43.8%) |
| $500 to $799 | 170 (22.0%) | 9 (14.1%) |
| $800 to $999 | 48 (6.2%) | 0 (0.0%) |
| $1,000 to $1,499 | 163 (21.1%) | 27 (42.2%) |
| $1,500 to $1,999 | 109 (14.1%) | 0 (0.0%) |
| $2,000 to $2,499 | 84 (10.8%) | 0 (0.0%) |
| $2,500 to $2,999 | 10 (1.3%) | 0 (0.0%) |
| $3,000 or more | 0 (0.0%) | 0 (0.0%) |
| Total | 774 (100.0%) | 64 (100.0%) |
Physical Housing Characteristics in Grand Point
Housing Structures in Grand Point
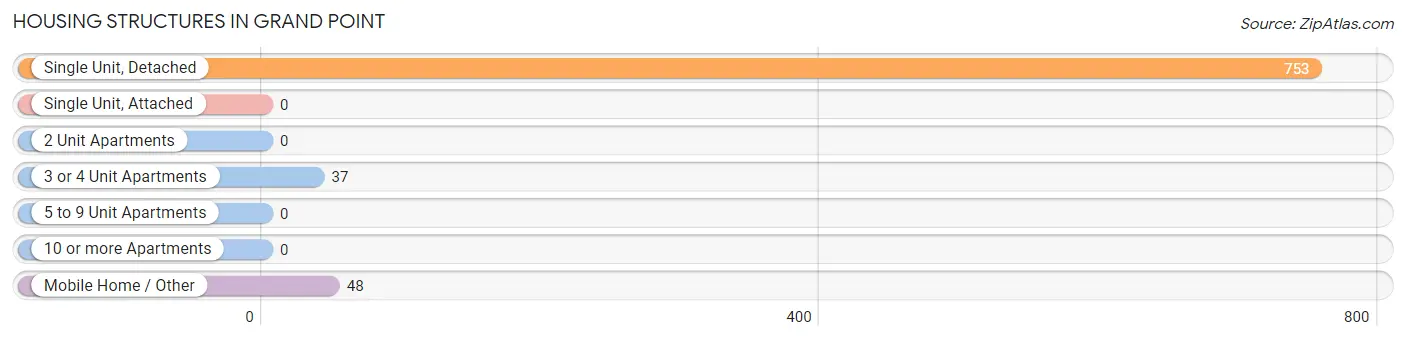
| Structure Type | # Housing Units | % Housing Units |
| Single Unit, Detached | 753 | 89.9% |
| Single Unit, Attached | 0 | 0.0% |
| 2 Unit Apartments | 0 | 0.0% |
| 3 or 4 Unit Apartments | 37 | 4.4% |
| 5 to 9 Unit Apartments | 0 | 0.0% |
| 10 or more Apartments | 0 | 0.0% |
| Mobile Home / Other | 48 | 5.7% |
| Total | 838 | 100.0% |
Housing Structures by Occupancy in Grand Point
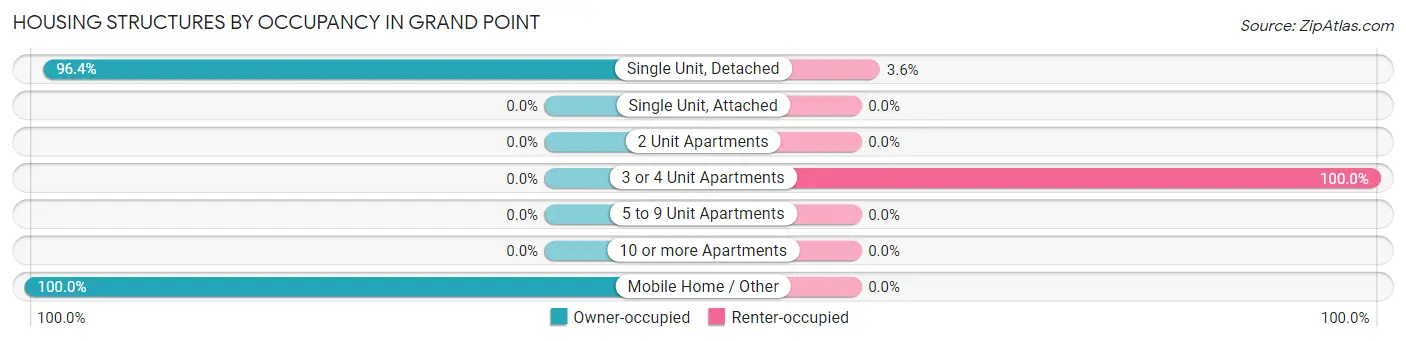
| Structure Type | Owner-occupied | Renter-occupied |
| Single Unit, Detached | 726 (96.4%) | 27 (3.6%) |
| Single Unit, Attached | 0 (0.0%) | 0 (0.0%) |
| 2 Unit Apartments | 0 (0.0%) | 0 (0.0%) |
| 3 or 4 Unit Apartments | 0 (0.0%) | 37 (100.0%) |
| 5 to 9 Unit Apartments | 0 (0.0%) | 0 (0.0%) |
| 10 or more Apartments | 0 (0.0%) | 0 (0.0%) |
| Mobile Home / Other | 48 (100.0%) | 0 (0.0%) |
| Total | 774 (92.4%) | 64 (7.6%) |
Housing Structures by Number of Rooms in Grand Point
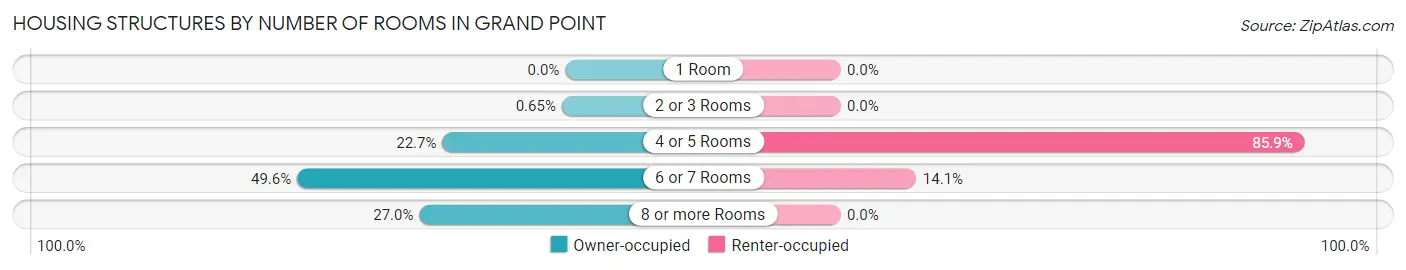
| Number of Rooms | Owner-occupied | Renter-occupied |
| 1 Room | 0 (0.0%) | 0 (0.0%) |
| 2 or 3 Rooms | 5 (0.6%) | 0 (0.0%) |
| 4 or 5 Rooms | 176 (22.7%) | 55 (85.9%) |
| 6 or 7 Rooms | 384 (49.6%) | 9 (14.1%) |
| 8 or more Rooms | 209 (27.0%) | 0 (0.0%) |
| Total | 774 (100.0%) | 64 (100.0%) |
Housing Structure by Heating Type in Grand Point
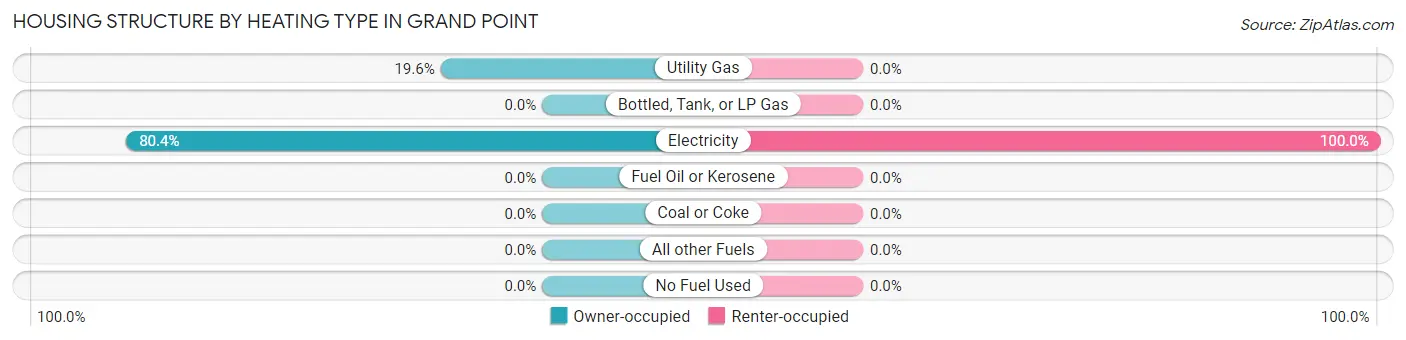
| Heating Type | Owner-occupied | Renter-occupied |
| Utility Gas | 152 (19.6%) | 0 (0.0%) |
| Bottled, Tank, or LP Gas | 0 (0.0%) | 0 (0.0%) |
| Electricity | 622 (80.4%) | 64 (100.0%) |
| Fuel Oil or Kerosene | 0 (0.0%) | 0 (0.0%) |
| Coal or Coke | 0 (0.0%) | 0 (0.0%) |
| All other Fuels | 0 (0.0%) | 0 (0.0%) |
| No Fuel Used | 0 (0.0%) | 0 (0.0%) |
| Total | 774 (100.0%) | 64 (100.0%) |
Household Vehicle Usage in Grand Point
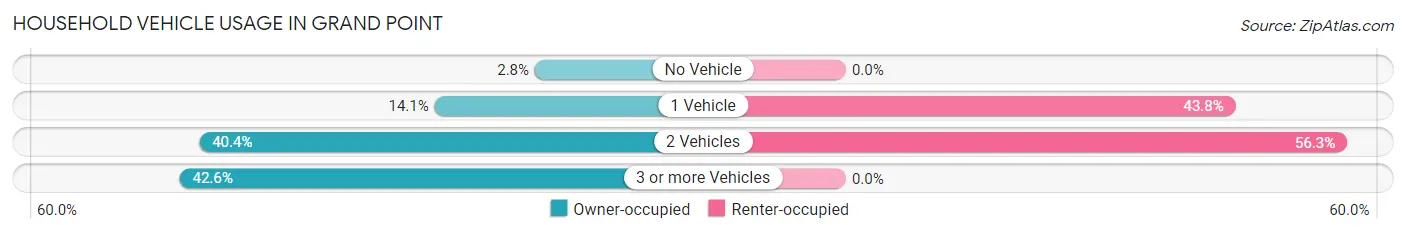
| Vehicles per Household | Owner-occupied | Renter-occupied |
| No Vehicle | 22 (2.8%) | 0 (0.0%) |
| 1 Vehicle | 109 (14.1%) | 28 (43.8%) |
| 2 Vehicles | 313 (40.4%) | 36 (56.2%) |
| 3 or more Vehicles | 330 (42.6%) | 0 (0.0%) |
| Total | 774 (100.0%) | 64 (100.0%) |
Real Estate & Mortgages in Grand Point
Real Estate and Mortgage Overview in Grand Point
| Characteristic | Without Mortgage | With Mortgage |
| Housing Units | 396 | 378 |
| Median Property Value | $267,000 | $267,600 |
| Median Household Income | $76,000 | $196 |
| Monthly Housing Costs | $513 | $0 |
| Real Estate Taxes | $998 | $0 |
Property Value by Mortgage Status in Grand Point
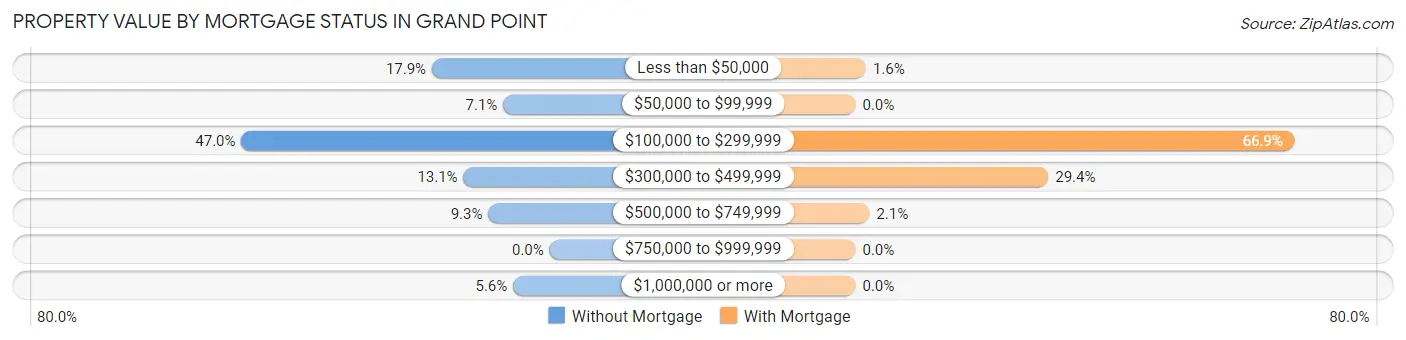
| Property Value | Without Mortgage | With Mortgage |
| Less than $50,000 | 71 (17.9%) | 6 (1.6%) |
| $50,000 to $99,999 | 28 (7.1%) | 0 (0.0%) |
| $100,000 to $299,999 | 186 (47.0%) | 253 (66.9%) |
| $300,000 to $499,999 | 52 (13.1%) | 111 (29.4%) |
| $500,000 to $749,999 | 37 (9.3%) | 8 (2.1%) |
| $750,000 to $999,999 | 0 (0.0%) | 0 (0.0%) |
| $1,000,000 or more | 22 (5.6%) | 0 (0.0%) |
| Total | 396 (100.0%) | 378 (100.0%) |
Household Income by Mortgage Status in Grand Point
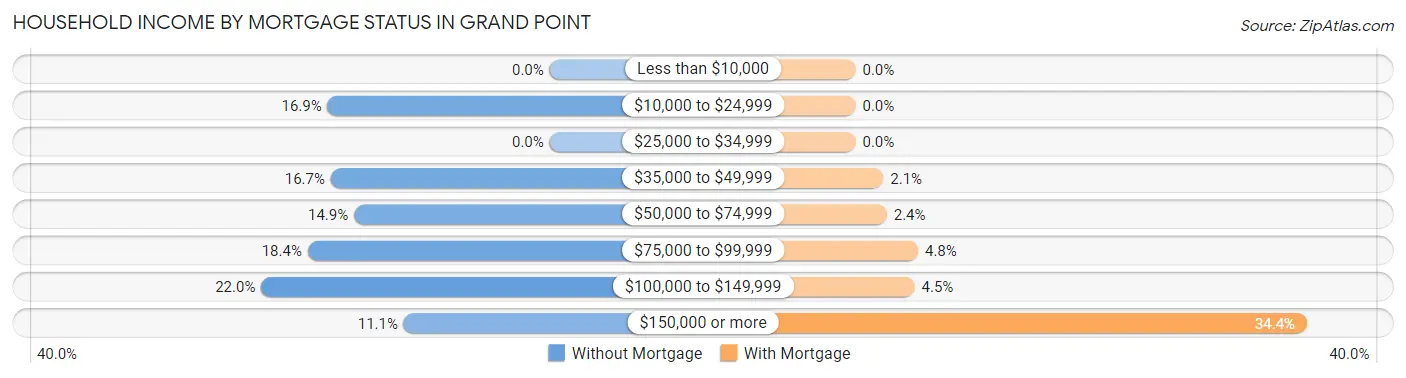
| Household Income | Without Mortgage | With Mortgage |
| Less than $10,000 | 0 (0.0%) | 0 (0.0%) |
| $10,000 to $24,999 | 67 (16.9%) | 0 (0.0%) |
| $25,000 to $34,999 | 0 (0.0%) | 0 (0.0%) |
| $35,000 to $49,999 | 66 (16.7%) | 8 (2.1%) |
| $50,000 to $74,999 | 59 (14.9%) | 9 (2.4%) |
| $75,000 to $99,999 | 73 (18.4%) | 18 (4.8%) |
| $100,000 to $149,999 | 87 (22.0%) | 17 (4.5%) |
| $150,000 or more | 44 (11.1%) | 130 (34.4%) |
| Total | 396 (100.0%) | 378 (100.0%) |
Property Value to Household Income Ratio in Grand Point
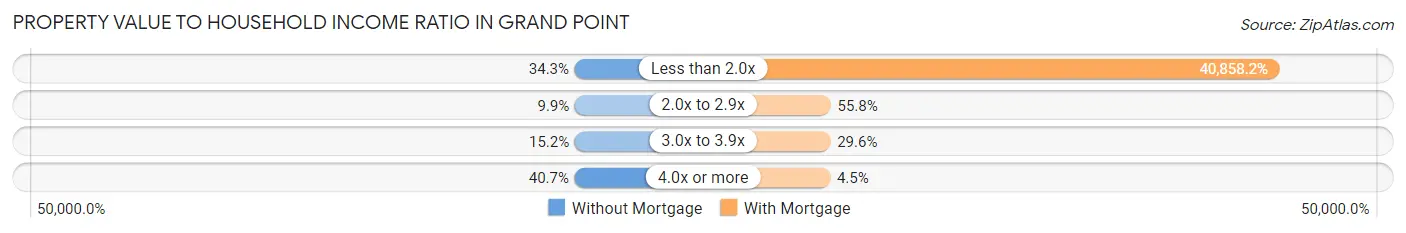
| Value-to-Income Ratio | Without Mortgage | With Mortgage |
| Less than 2.0x | 136 (34.3%) | 154,444 (40,858.2%) |
| 2.0x to 2.9x | 39 (9.9%) | 211 (55.8%) |
| 3.0x to 3.9x | 60 (15.1%) | 112 (29.6%) |
| 4.0x or more | 161 (40.7%) | 17 (4.5%) |
| Total | 396 (100.0%) | 378 (100.0%) |
Real Estate Taxes by Mortgage Status in Grand Point
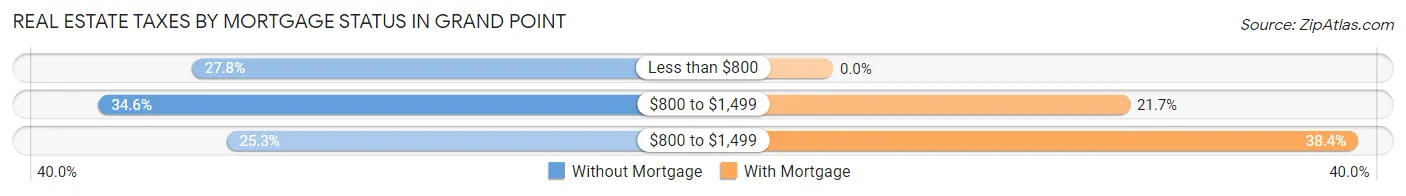
| Property Taxes | Without Mortgage | With Mortgage |
| Less than $800 | 110 (27.8%) | 0 (0.0%) |
| $800 to $1,499 | 137 (34.6%) | 82 (21.7%) |
| $800 to $1,499 | 100 (25.3%) | 145 (38.4%) |
| Total | 396 (100.0%) | 378 (100.0%) |
Health & Disability in Grand Point
Health Insurance Coverage by Age in Grand Point
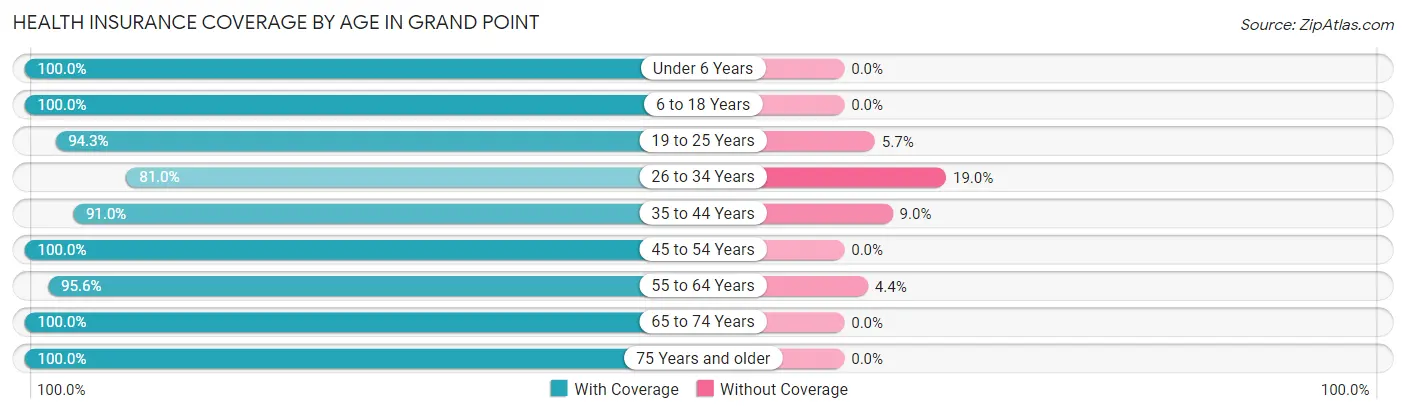
| Age Bracket | With Coverage | Without Coverage |
| Under 6 Years | 137 (100.0%) | 0 (0.0%) |
| 6 to 18 Years | 402 (100.0%) | 0 (0.0%) |
| 19 to 25 Years | 198 (94.3%) | 12 (5.7%) |
| 26 to 34 Years | 188 (81.0%) | 44 (19.0%) |
| 35 to 44 Years | 343 (91.0%) | 34 (9.0%) |
| 45 to 54 Years | 335 (100.0%) | 0 (0.0%) |
| 55 to 64 Years | 435 (95.6%) | 20 (4.4%) |
| 65 to 74 Years | 350 (100.0%) | 0 (0.0%) |
| 75 Years and older | 35 (100.0%) | 0 (0.0%) |
| Total | 2,423 (95.7%) | 110 (4.3%) |
Health Insurance Coverage by Citizenship Status in Grand Point
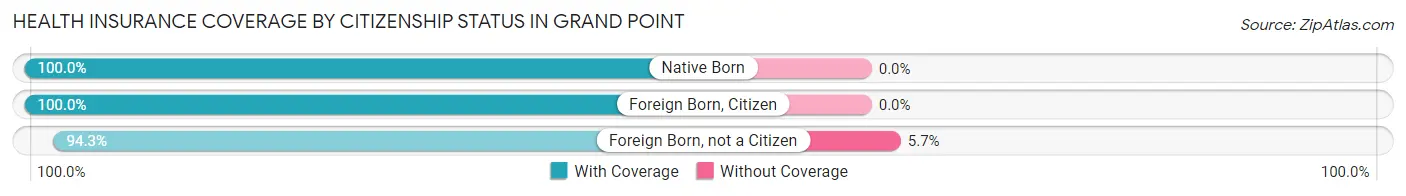
| Citizenship Status | With Coverage | Without Coverage |
| Native Born | 137 (100.0%) | 0 (0.0%) |
| Foreign Born, Citizen | 402 (100.0%) | 0 (0.0%) |
| Foreign Born, not a Citizen | 198 (94.3%) | 12 (5.7%) |
Health Insurance Coverage by Household Income in Grand Point
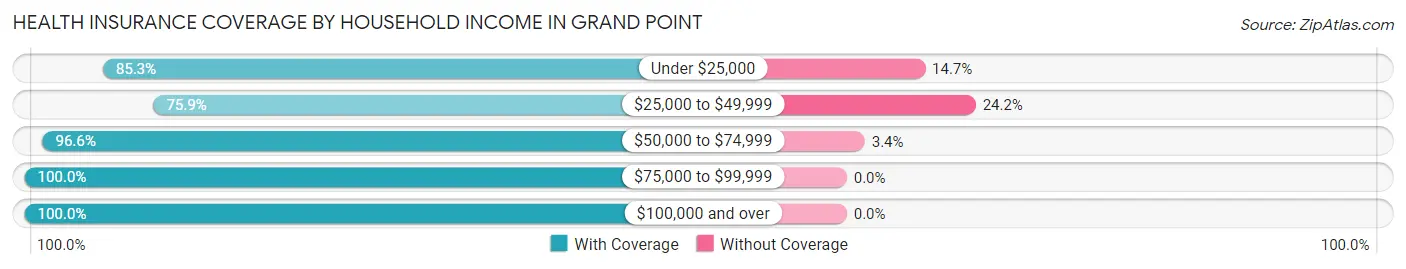
| Household Income | With Coverage | Without Coverage |
| Under $25,000 | 256 (85.3%) | 44 (14.7%) |
| $25,000 to $49,999 | 179 (75.8%) | 57 (24.1%) |
| $50,000 to $74,999 | 258 (96.6%) | 9 (3.4%) |
| $75,000 to $99,999 | 288 (100.0%) | 0 (0.0%) |
| $100,000 and over | 1,442 (100.0%) | 0 (0.0%) |
Public vs Private Health Insurance Coverage by Age in Grand Point
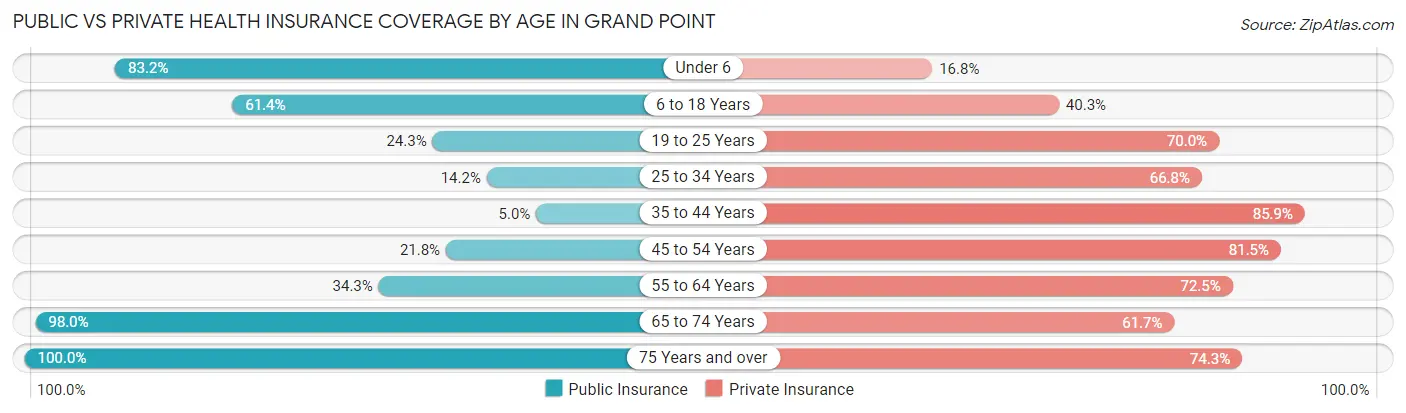
| Age Bracket | Public Insurance | Private Insurance |
| Under 6 | 114 (83.2%) | 23 (16.8%) |
| 6 to 18 Years | 247 (61.4%) | 162 (40.3%) |
| 19 to 25 Years | 51 (24.3%) | 147 (70.0%) |
| 25 to 34 Years | 33 (14.2%) | 155 (66.8%) |
| 35 to 44 Years | 19 (5.0%) | 324 (85.9%) |
| 45 to 54 Years | 73 (21.8%) | 273 (81.5%) |
| 55 to 64 Years | 156 (34.3%) | 330 (72.5%) |
| 65 to 74 Years | 343 (98.0%) | 216 (61.7%) |
| 75 Years and over | 35 (100.0%) | 26 (74.3%) |
| Total | 1,071 (42.3%) | 1,656 (65.4%) |
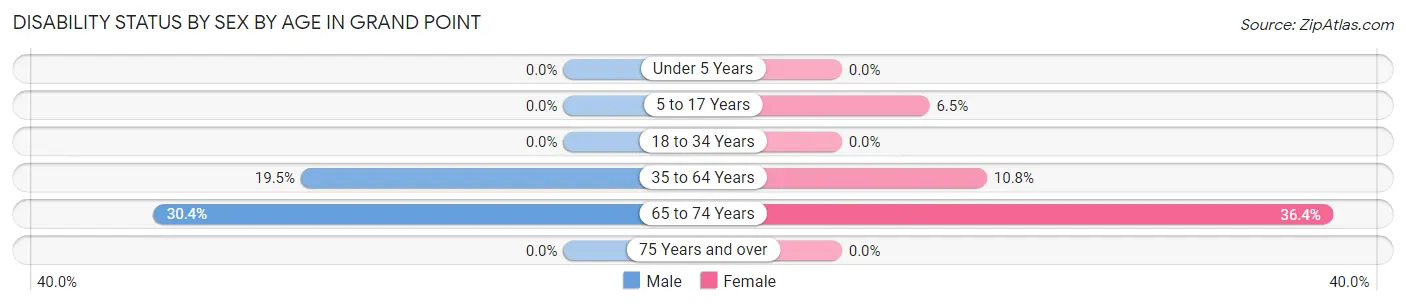
Disability Status by Sex by Age in Grand Point
| Age Bracket | Male | Female |
| Under 5 Years | 0 (0.0%) | 0 (0.0%) |
| 5 to 17 Years | 0 (0.0%) | 11 (6.5%) |
| 18 to 34 Years | 0 (0.0%) | 0 (0.0%) |
| 35 to 64 Years | 99 (19.5%) | 71 (10.8%) |
| 65 to 74 Years | 38 (30.4%) | 82 (36.4%) |
| 75 Years and over | 0 (0.0%) | 0 (0.0%) |
Disability Class by Sex by Age in Grand Point
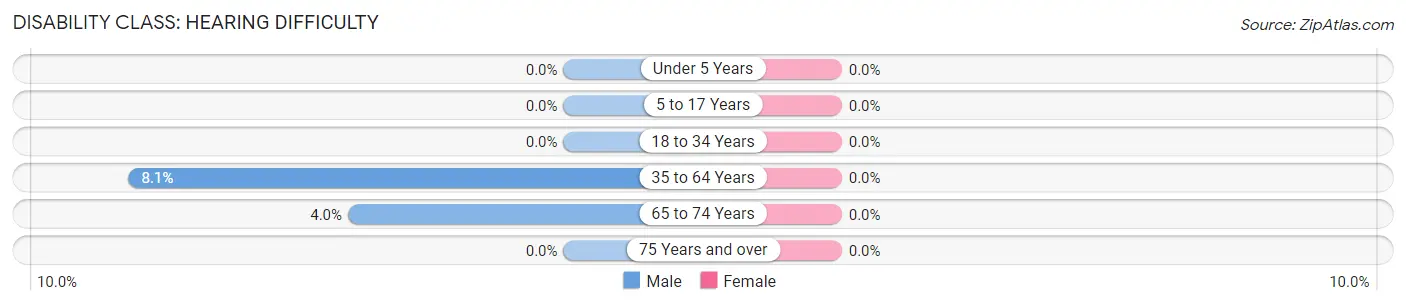
Disability Class: Hearing Difficulty
| Age Bracket | Male | Female |
| Under 5 Years | 0 (0.0%) | 0 (0.0%) |
| 5 to 17 Years | 0 (0.0%) | 0 (0.0%) |
| 18 to 34 Years | 0 (0.0%) | 0 (0.0%) |
| 35 to 64 Years | 41 (8.1%) | 0 (0.0%) |
| 65 to 74 Years | 5 (4.0%) | 0 (0.0%) |
| 75 Years and over | 0 (0.0%) | 0 (0.0%) |
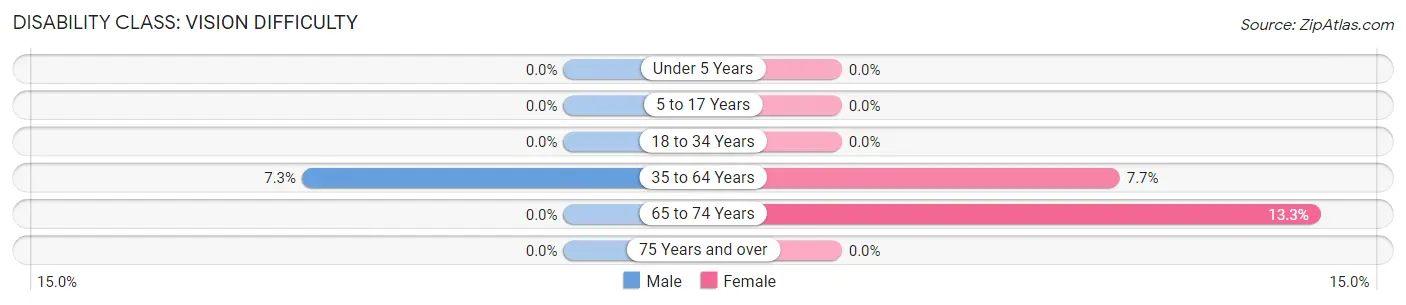
Disability Class: Vision Difficulty
| Age Bracket | Male | Female |
| Under 5 Years | 0 (0.0%) | 0 (0.0%) |
| 5 to 17 Years | 0 (0.0%) | 0 (0.0%) |
| 18 to 34 Years | 0 (0.0%) | 0 (0.0%) |
| 35 to 64 Years | 37 (7.3%) | 51 (7.7%) |
| 65 to 74 Years | 0 (0.0%) | 30 (13.3%) |
| 75 Years and over | 0 (0.0%) | 0 (0.0%) |
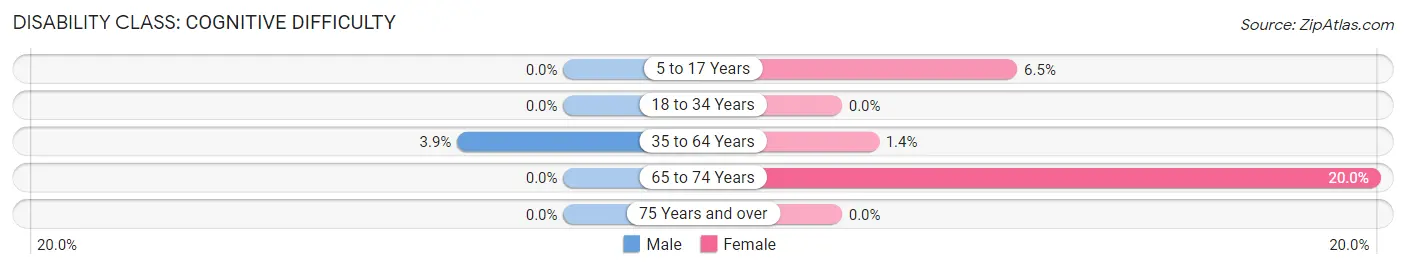
Disability Class: Cognitive Difficulty
| Age Bracket | Male | Female |
| 5 to 17 Years | 0 (0.0%) | 11 (6.5%) |
| 18 to 34 Years | 0 (0.0%) | 0 (0.0%) |
| 35 to 64 Years | 20 (3.9%) | 9 (1.4%) |
| 65 to 74 Years | 0 (0.0%) | 45 (20.0%) |
| 75 Years and over | 0 (0.0%) | 0 (0.0%) |
Disability Class: Ambulatory Difficulty
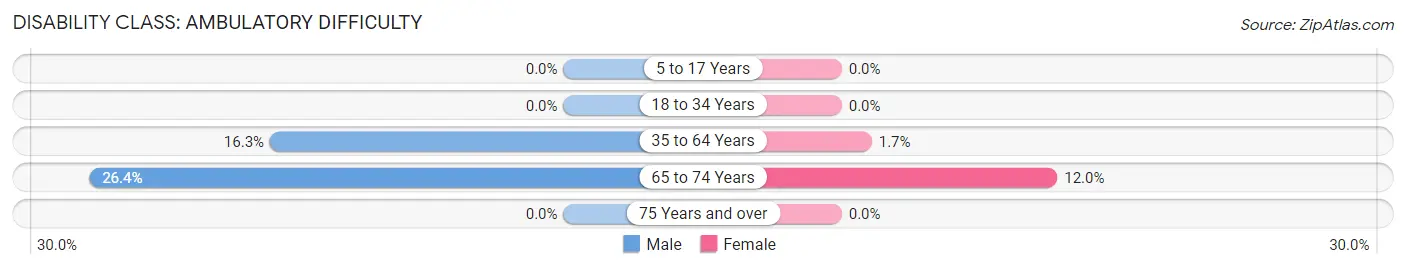
| Age Bracket | Male | Female |
| 5 to 17 Years | 0 (0.0%) | 0 (0.0%) |
| 18 to 34 Years | 0 (0.0%) | 0 (0.0%) |
| 35 to 64 Years | 83 (16.3%) | 11 (1.7%) |
| 65 to 74 Years | 33 (26.4%) | 27 (12.0%) |
| 75 Years and over | 0 (0.0%) | 0 (0.0%) |
Disability Class: Self-Care Difficulty
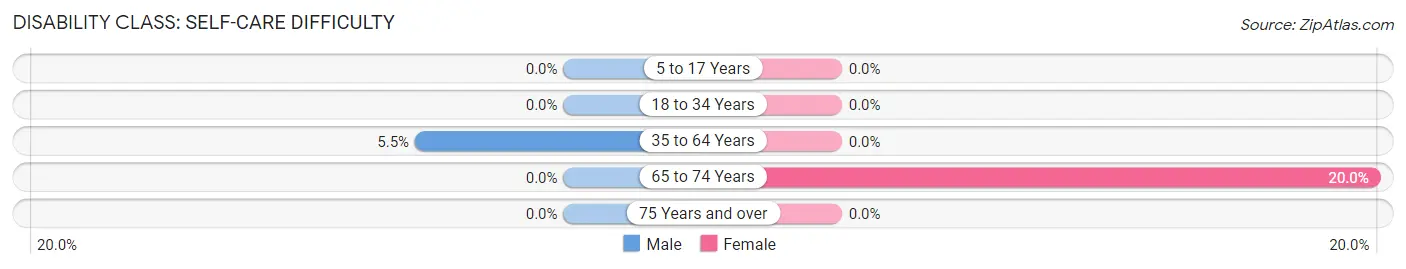
| Age Bracket | Male | Female |
| 5 to 17 Years | 0 (0.0%) | 0 (0.0%) |
| 18 to 34 Years | 0 (0.0%) | 0 (0.0%) |
| 35 to 64 Years | 28 (5.5%) | 0 (0.0%) |
| 65 to 74 Years | 0 (0.0%) | 45 (20.0%) |
| 75 Years and over | 0 (0.0%) | 0 (0.0%) |
Technology Access in Grand Point
Computing Device Access in Grand Point
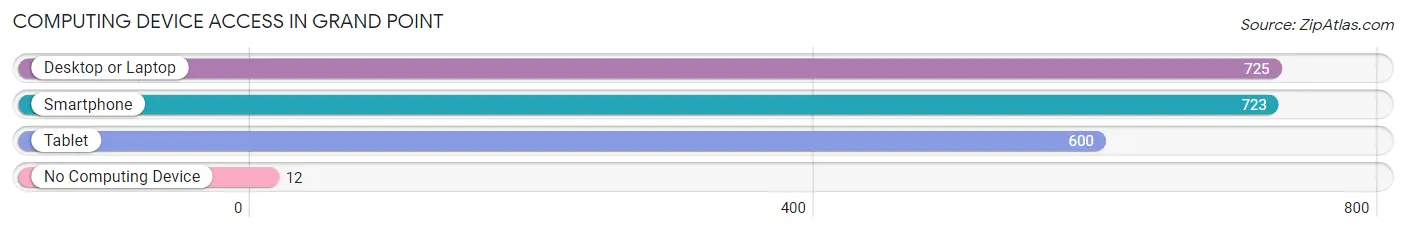
| Device Type | # Households | % Households |
| Desktop or Laptop | 725 | 86.5% |
| Smartphone | 723 | 86.3% |
| Tablet | 600 | 71.6% |
| No Computing Device | 12 | 1.4% |
| Total | 838 | 100.0% |
Internet Access in Grand Point
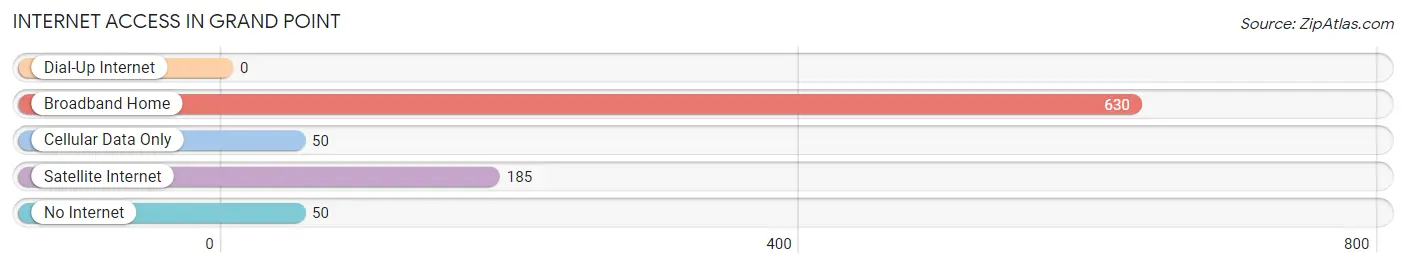
| Internet Type | # Households | % Households |
| Dial-Up Internet | 0 | 0.0% |
| Broadband Home | 630 | 75.2% |
| Cellular Data Only | 50 | 6.0% |
| Satellite Internet | 185 | 22.1% |
| No Internet | 50 | 6.0% |
| Total | 838 | 100.0% |
Grand Point Summary
Geography
Grand Point is a small unincorporated community located in the parish of St. Landry, Louisiana. It is situated in the southwestern part of the state, approximately 20 miles south of Opelousas and 40 miles northwest of Lafayette. The community is located on the banks of the Bayou Teche, a tributary of the Atchafalaya River. The area is characterized by flat, low-lying terrain, with the highest elevation being just over 100 feet above sea level. The climate is humid subtropical, with hot, humid summers and mild winters.
History
Grand Point was first settled in the early 1800s by French-speaking Acadians who had been expelled from Nova Scotia. The community was originally known as “Grand Pointe des Acadiens”, and was a small farming and fishing village. In the mid-1800s, the area was home to a large sugar cane plantation, and the community grew to include a post office, a general store, and a school.
In the early 1900s, the area experienced a period of economic decline, as the sugar cane industry declined and the population dwindled. In the 1950s, the community was revitalized by the construction of a bridge across the Bayou Teche, which allowed for increased access to the area. In the late 20th century, the area experienced a period of growth, as new businesses and industries moved into the area.
Economy
The economy of Grand Point is largely based on agriculture and tourism. The area is home to several large farms, which produce a variety of crops, including sugar cane, corn, soybeans, and cotton. The area is also home to several small businesses, including restaurants, convenience stores, and gas stations.
Tourism is an important part of the local economy, as the area is home to several popular attractions, including the Bayou Teche National Wildlife Refuge, the Grand Point State Park, and the Grand Pointe Golf Course. The area is also home to several festivals and events, including the Grand Pointe Festival, which is held annually in the summer.
Demographics
As of the 2010 census, the population of Grand Point was 1,845. The racial makeup of the community was 79.3% White, 17.2% African American, 0.7% Native American, 0.3% Asian, and 2.5% from other races. The median household income was $31,250, and the median age was 37.
Grand Point is a small, rural community, and is home to a diverse population. The area is home to a variety of cultures and religions, including French, African American, and Native American. The area is also home to a variety of businesses, including restaurants, convenience stores, and gas stations.
Common Questions
What is Per Capita Income in Grand Point?
Per Capita income in Grand Point is $37,962.
What is the Median Family Income in Grand Point?
Median Family Income in Grand Point is $110,337.
What is the Median Household income in Grand Point?
Median Household Income in Grand Point is $104,034.
What is Income or Wage Gap in Grand Point?
Income or Wage Gap in Grand Point is 40.4%.
Women in Grand Point earn 59.7 cents for every dollar earned by a man.
What is Inequality or Gini Index in Grand Point?
Inequality or Gini Index in Grand Point is 0.34.
What is the Total Population of Grand Point?
Total Population of Grand Point is 2,533.
What is the Total Male Population of Grand Point?
Total Male Population of Grand Point is 1,097.
What is the Total Female Population of Grand Point?
Total Female Population of Grand Point is 1,436.
What is the Ratio of Males per 100 Females in Grand Point?
There are 76.39 Males per 100 Females in Grand Point.
What is the Ratio of Females per 100 Males in Grand Point?
There are 130.90 Females per 100 Males in Grand Point.
What is the Median Population Age in Grand Point?
Median Population Age in Grand Point is 41.8 Years.
What is the Average Family Size in Grand Point
Average Family Size in Grand Point is 3.1 People.
What is the Average Household Size in Grand Point
Average Household Size in Grand Point is 3.0 People.
How Large is the Labor Force in Grand Point?
There are 1,536 People in the Labor Forcein in Grand Point.
What is the Percentage of People in the Labor Force in Grand Point?
71.9% of People are in the Labor Force in Grand Point.
What is the Unemployment Rate in Grand Point?
Unemployment Rate in Grand Point is 3.8%.