Killian, LA Map & Demographics
Killian Map
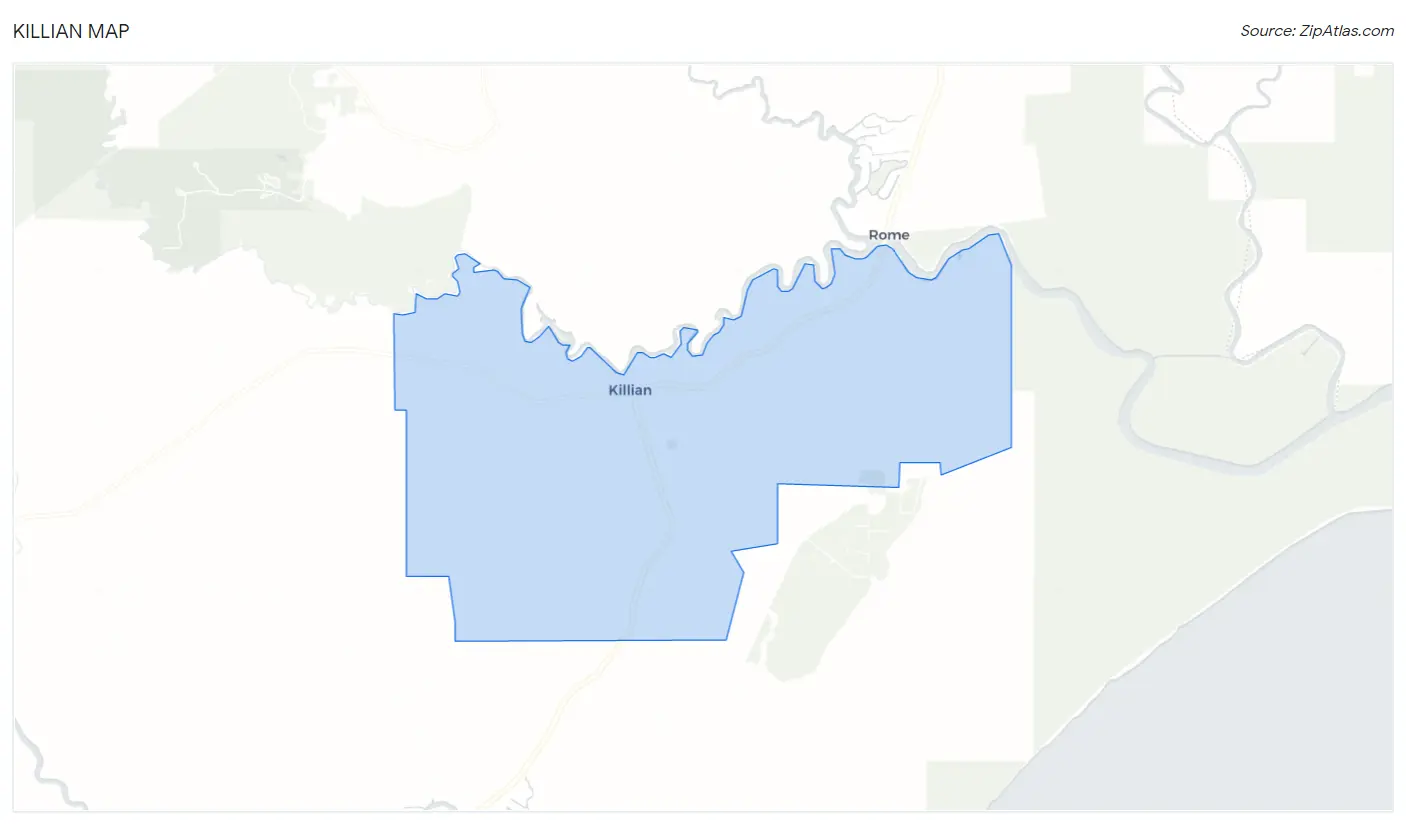
Killian Overview
$38,371
PER CAPITA INCOME
$57,813
AVG FAMILY INCOME
$49,359
AVG HOUSEHOLD INCOME
51.8%
WAGE / INCOME GAP [ % ]
48.2¢/ $1
WAGE / INCOME GAP [ $ ]
0.50
INEQUALITY / GINI INDEX
1,345
TOTAL POPULATION
627
MALE POPULATION
718
FEMALE POPULATION
87.33
MALES / 100 FEMALES
114.51
FEMALES / 100 MALES
50.7
MEDIAN AGE
2.5
AVG FAMILY SIZE
2.2
AVG HOUSEHOLD SIZE
502
LABOR FORCE [ PEOPLE ]
44.2%
PERCENT IN LABOR FORCE
4.0%
UNEMPLOYMENT RATE
Income in Killian
Income Overview in Killian
Per Capita Income in Killian is $38,371, while median incomes of families and households are $57,813 and $49,359 respectively.
| Characteristic | Number | Measure |
| Per Capita Income | 1,345 | $38,371 |
| Median Family Income | 425 | $57,813 |
| Mean Family Income | 425 | $90,374 |
| Median Household Income | 614 | $49,359 |
| Mean Household Income | 614 | $82,915 |
| Income Deficit | 425 | $0 |
| Wage / Income Gap (%) | 1,345 | 51.77% |
| Wage / Income Gap ($) | 1,345 | 48.23¢ per $1 |
| Gini / Inequality Index | 1,345 | 0.50 |
Earnings by Sex in Killian
Average Earnings in Killian are $38,824, $62,143 for men and $29,971 for women, a difference of 51.8%.
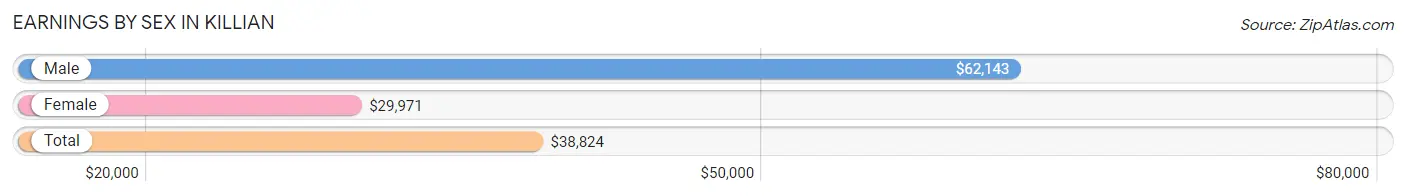
| Sex | Number | Average Earnings |
| Male | 320 (56.4%) | $62,143 |
| Female | 247 (43.6%) | $29,971 |
| Total | 567 (100.0%) | $38,824 |
Earnings by Sex by Income Bracket in Killian
The most common earnings brackets in Killian are $100,000+ for men (61 | 19.1%) and $35,000 to $39,999 for women (56 | 22.7%).
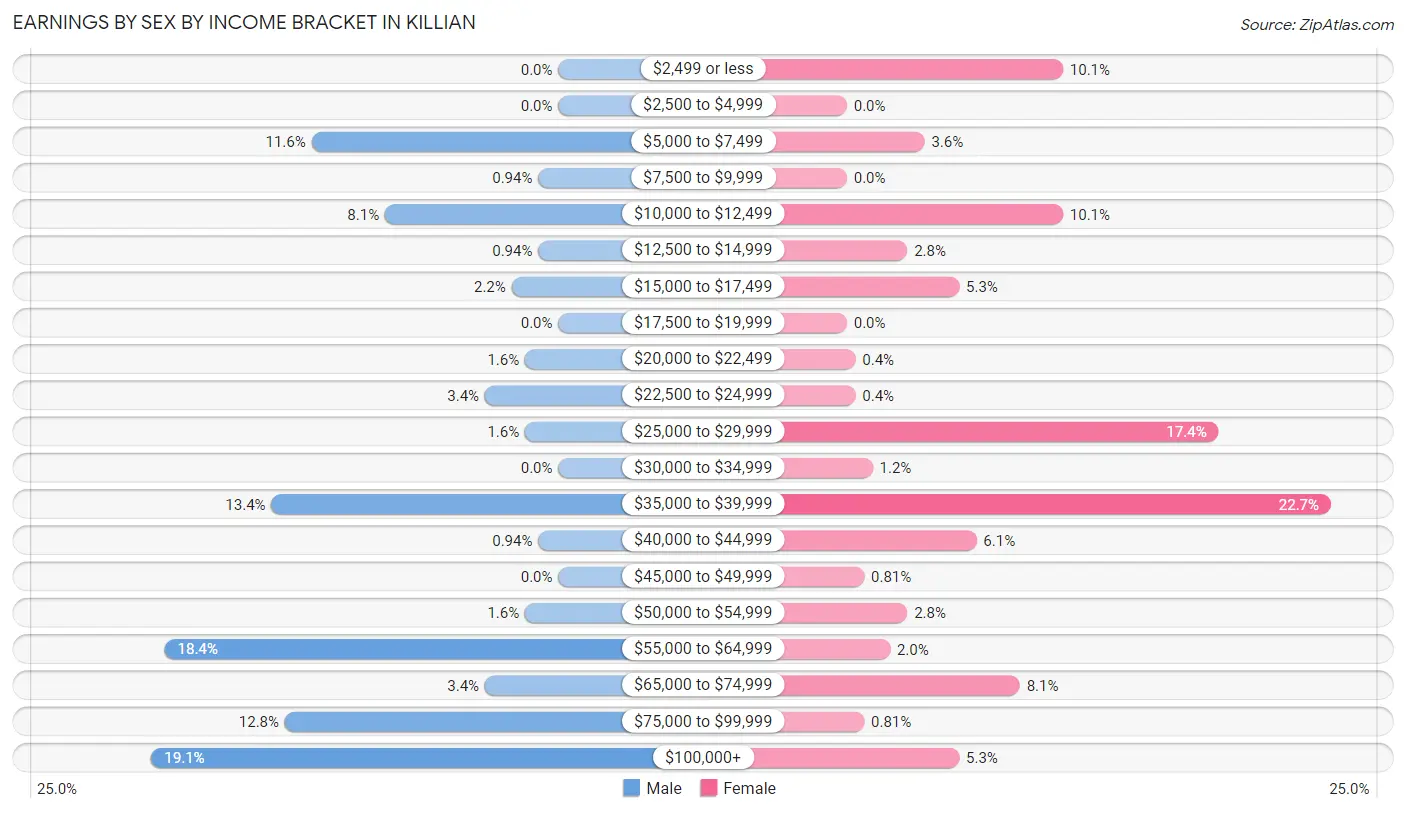
| Income | Male | Female |
| $2,499 or less | 0 (0.0%) | 25 (10.1%) |
| $2,500 to $4,999 | 0 (0.0%) | 0 (0.0%) |
| $5,000 to $7,499 | 37 (11.6%) | 9 (3.6%) |
| $7,500 to $9,999 | 3 (0.9%) | 0 (0.0%) |
| $10,000 to $12,499 | 26 (8.1%) | 25 (10.1%) |
| $12,500 to $14,999 | 3 (0.9%) | 7 (2.8%) |
| $15,000 to $17,499 | 7 (2.2%) | 13 (5.3%) |
| $17,500 to $19,999 | 0 (0.0%) | 0 (0.0%) |
| $20,000 to $22,499 | 5 (1.6%) | 1 (0.4%) |
| $22,500 to $24,999 | 11 (3.4%) | 1 (0.4%) |
| $25,000 to $29,999 | 5 (1.6%) | 43 (17.4%) |
| $30,000 to $34,999 | 0 (0.0%) | 3 (1.2%) |
| $35,000 to $39,999 | 43 (13.4%) | 56 (22.7%) |
| $40,000 to $44,999 | 3 (0.9%) | 15 (6.1%) |
| $45,000 to $49,999 | 0 (0.0%) | 2 (0.8%) |
| $50,000 to $54,999 | 5 (1.6%) | 7 (2.8%) |
| $55,000 to $64,999 | 59 (18.4%) | 5 (2.0%) |
| $65,000 to $74,999 | 11 (3.4%) | 20 (8.1%) |
| $75,000 to $99,999 | 41 (12.8%) | 2 (0.8%) |
| $100,000+ | 61 (19.1%) | 13 (5.3%) |
| Total | 320 (100.0%) | 247 (100.0%) |
Earnings by Sex by Educational Attainment in Killian
Average earnings in Killian are $62,717 for men and $37,500 for women, a difference of 40.2%. Men with an educational attainment of bachelor's degree enjoy the highest average annual earnings of $159,688, while those with high school diploma education earn the least with $38,372. Women with an educational attainment of college or associate's degree earn the most with the average annual earnings of $36,607, while those with college or associate's degree education have the smallest earnings of $36,607.
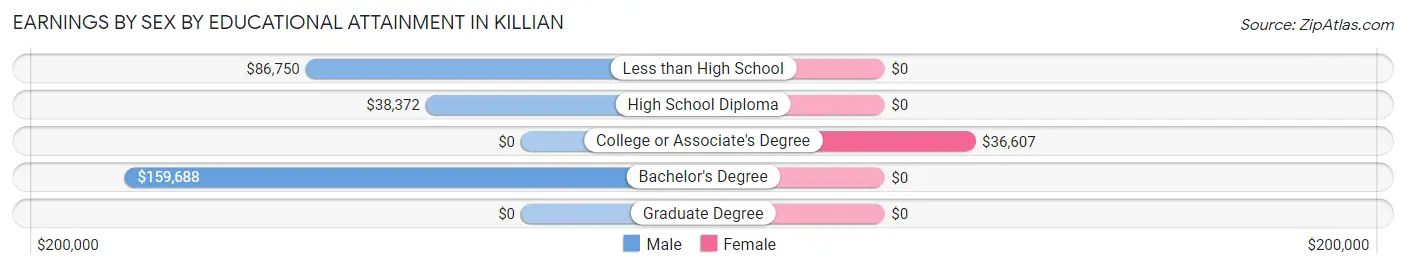
| Educational Attainment | Male Income | Female Income |
| Less than High School | $86,750 | $0 |
| High School Diploma | $38,372 | $0 |
| College or Associate's Degree | - | - |
| Bachelor's Degree | $159,688 | $0 |
| Graduate Degree | - | - |
| Total | $62,717 | $37,500 |
Family Income in Killian
Family Income Brackets in Killian
According to the Killian family income data, there are 86 families falling into the $50,000 to $74,999 income range, which is the most common income bracket and makes up 20.2% of all families. Conversely, the less than $10,000 income bracket is the least frequent group with only 7 families (1.7%) belonging to this category.
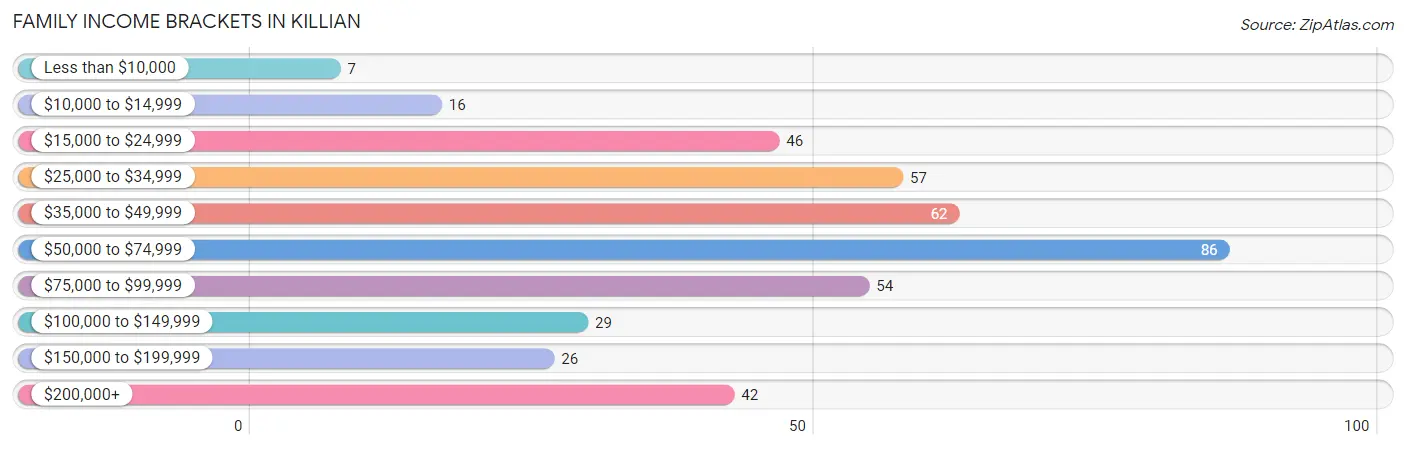
| Income Bracket | # Families | % Families |
| Less than $10,000 | 7 | 1.6% |
| $10,000 to $14,999 | 16 | 3.8% |
| $15,000 to $24,999 | 46 | 10.8% |
| $25,000 to $34,999 | 57 | 13.4% |
| $35,000 to $49,999 | 62 | 14.6% |
| $50,000 to $74,999 | 86 | 20.2% |
| $75,000 to $99,999 | 54 | 12.7% |
| $100,000 to $149,999 | 29 | 6.8% |
| $150,000 to $199,999 | 26 | 6.1% |
| $200,000+ | 42 | 9.9% |
Family Income by Famaliy Size in Killian
4-person families (50 | 11.8%) account for the highest median family income in Killian with $76,221 per family, while 2-person families (244 | 57.4%) have the highest median income of $27,916 per family member.
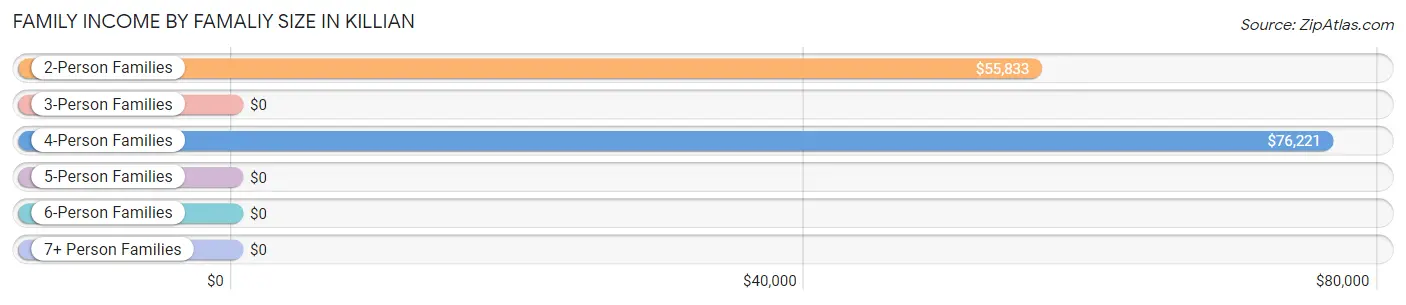
| Income Bracket | # Families | Median Income |
| 2-Person Families | 244 (57.4%) | $55,833 |
| 3-Person Families | 125 (29.4%) | $0 |
| 4-Person Families | 50 (11.8%) | $76,221 |
| 5-Person Families | 6 (1.4%) | $0 |
| 6-Person Families | 0 (0.0%) | $0 |
| 7+ Person Families | 0 (0.0%) | $0 |
| Total | 425 (100.0%) | $57,813 |
Family Income by Number of Earners in Killian
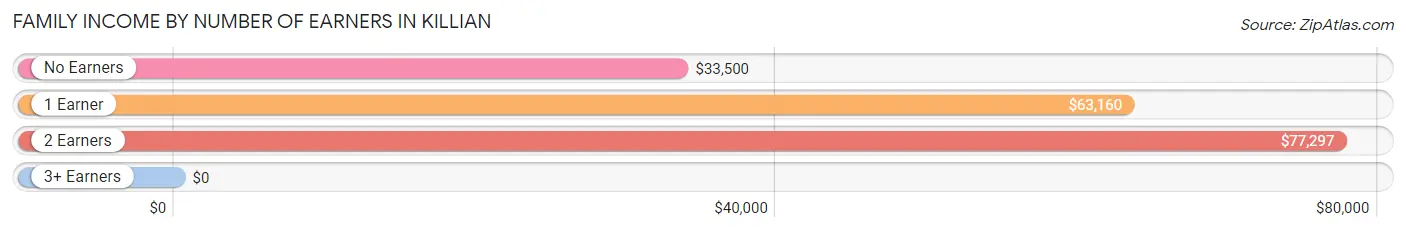
| Number of Earners | # Families | Median Income |
| No Earners | 156 (36.7%) | $33,500 |
| 1 Earner | 129 (30.3%) | $63,160 |
| 2 Earners | 131 (30.8%) | $77,297 |
| 3+ Earners | 9 (2.1%) | $0 |
| Total | 425 (100.0%) | $57,813 |
Household Income in Killian
Household Income Brackets in Killian
With 159 households falling in the category, the $35,000 to $49,999 income range is the most frequent in Killian, accounting for 25.9% of all households. In contrast, only 17 households (2.8%) fall into the less than $10,000 income bracket, making it the least populous group.
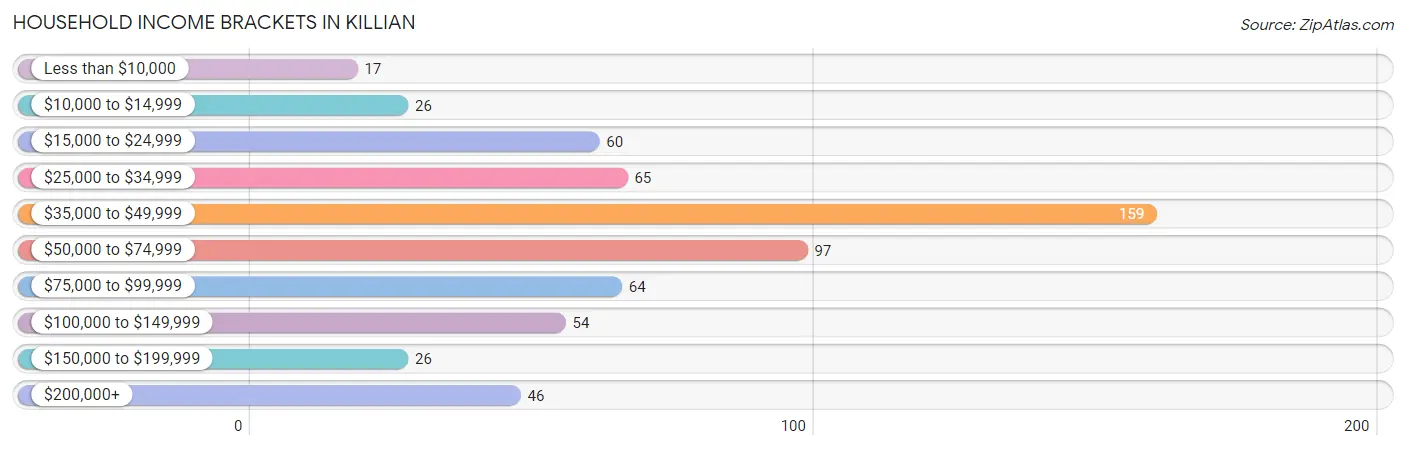
| Income Bracket | # Households | % Households |
| Less than $10,000 | 17 | 2.8% |
| $10,000 to $14,999 | 26 | 4.2% |
| $15,000 to $24,999 | 60 | 9.8% |
| $25,000 to $34,999 | 65 | 10.6% |
| $35,000 to $49,999 | 159 | 25.9% |
| $50,000 to $74,999 | 97 | 15.8% |
| $75,000 to $99,999 | 64 | 10.4% |
| $100,000 to $149,999 | 54 | 8.8% |
| $150,000 to $199,999 | 26 | 4.2% |
| $200,000+ | 46 | 7.5% |
Household Income by Householder Age in Killian
The median household income in Killian is $49,359, with the highest median household income of $66,458 found in the 25 to 44 years age bracket for the primary householder. A total of 123 households (20.0%) fall into this category. Meanwhile, the 15 to 24 years age bracket for the primary householder has the lowest median household income of $0, with 20 households (3.3%) in this group.
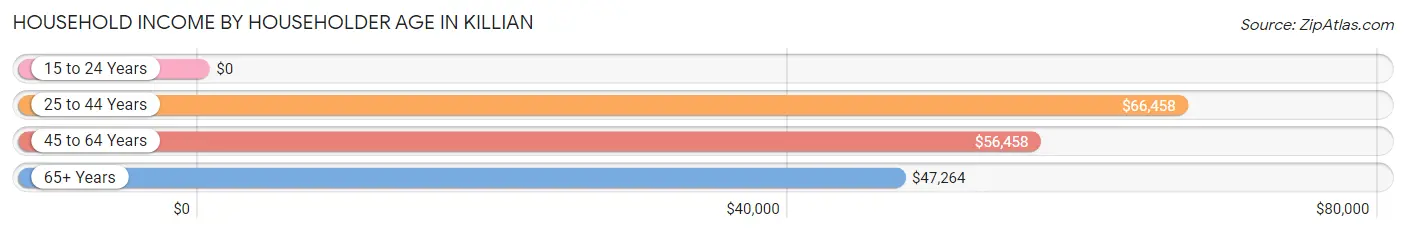
| Income Bracket | # Households | Median Income |
| 15 to 24 Years | 20 (3.3%) | $0 |
| 25 to 44 Years | 123 (20.0%) | $66,458 |
| 45 to 64 Years | 262 (42.7%) | $56,458 |
| 65+ Years | 209 (34.0%) | $47,264 |
| Total | 614 (100.0%) | $49,359 |
Poverty in Killian
Income Below Poverty by Sex and Age in Killian
With 11.8% poverty level for males and 10.3% for females among the residents of Killian, 6 to 11 year old males and 16 and 17 year old females are the most vulnerable to poverty, with 14 males (100.0%) and 12 females (35.3%) in their respective age groups living below the poverty level.
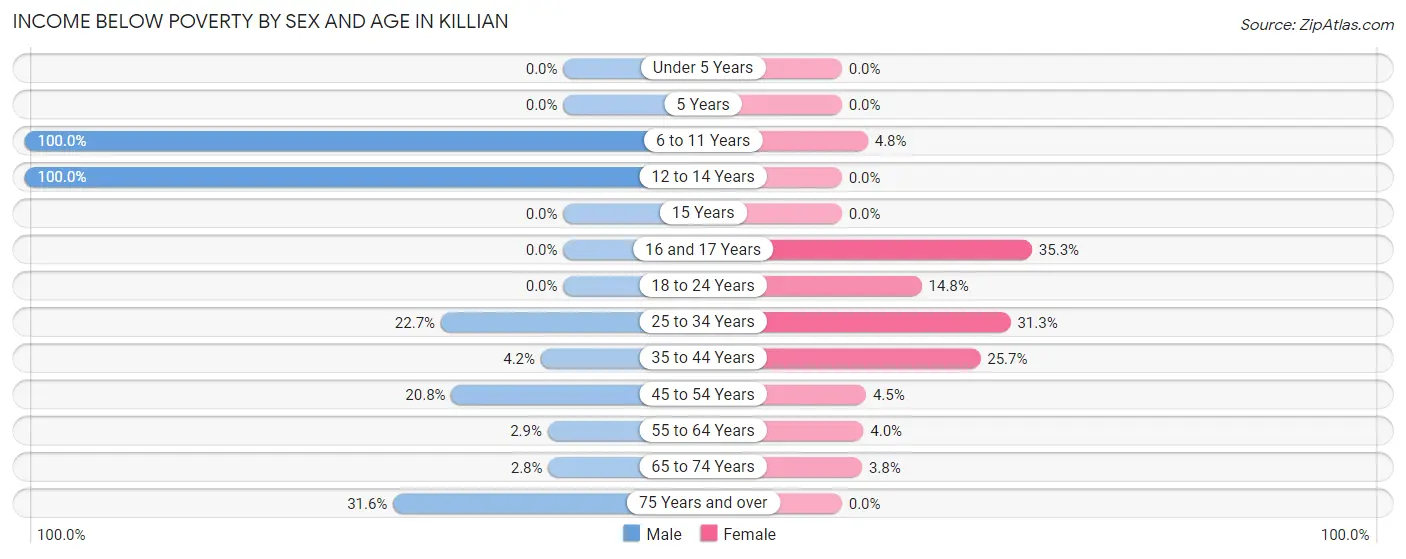
| Age Bracket | Male | Female |
| Under 5 Years | 0 (0.0%) | 0 (0.0%) |
| 5 Years | 0 (0.0%) | 0 (0.0%) |
| 6 to 11 Years | 14 (100.0%) | 4 (4.8%) |
| 12 to 14 Years | 7 (100.0%) | 0 (0.0%) |
| 15 Years | 0 (0.0%) | 0 (0.0%) |
| 16 and 17 Years | 0 (0.0%) | 12 (35.3%) |
| 18 to 24 Years | 0 (0.0%) | 4 (14.8%) |
| 25 to 34 Years | 15 (22.7%) | 31 (31.3%) |
| 35 to 44 Years | 3 (4.2%) | 9 (25.7%) |
| 45 to 54 Years | 16 (20.8%) | 4 (4.5%) |
| 55 to 64 Years | 4 (2.9%) | 5 (4.0%) |
| 65 to 74 Years | 3 (2.8%) | 3 (3.7%) |
| 75 Years and over | 12 (31.6%) | 0 (0.0%) |
| Total | 74 (11.8%) | 72 (10.3%) |
Income Above Poverty by Sex and Age in Killian
According to the poverty statistics in Killian, males aged under 5 years and females aged 12 to 14 years are the age groups that are most secure financially, with 100.0% of males and 100.0% of females in these age groups living above the poverty line.
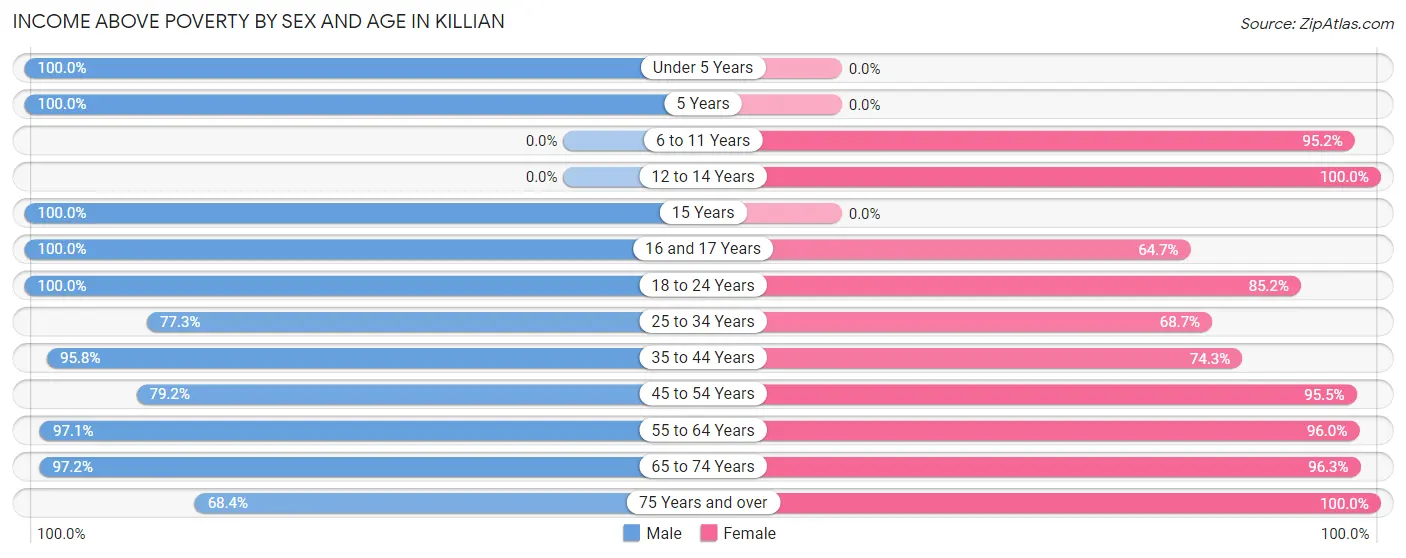
| Age Bracket | Male | Female |
| Under 5 Years | 35 (100.0%) | 0 (0.0%) |
| 5 Years | 3 (100.0%) | 0 (0.0%) |
| 6 to 11 Years | 0 (0.0%) | 79 (95.2%) |
| 12 to 14 Years | 0 (0.0%) | 41 (100.0%) |
| 15 Years | 11 (100.0%) | 0 (0.0%) |
| 16 and 17 Years | 5 (100.0%) | 22 (64.7%) |
| 18 to 24 Years | 52 (100.0%) | 23 (85.2%) |
| 25 to 34 Years | 51 (77.3%) | 68 (68.7%) |
| 35 to 44 Years | 69 (95.8%) | 26 (74.3%) |
| 45 to 54 Years | 61 (79.2%) | 85 (95.5%) |
| 55 to 64 Years | 135 (97.1%) | 120 (96.0%) |
| 65 to 74 Years | 105 (97.2%) | 77 (96.3%) |
| 75 Years and over | 26 (68.4%) | 89 (100.0%) |
| Total | 553 (88.2%) | 630 (89.7%) |
Income Below Poverty Among Married-Couple Families in Killian
The poverty statistics for married-couple families in Killian show that 5.2% or 17 of the total 324 families live below the poverty line. Families with 1 or 2 children have the highest poverty rate of 15.9%, comprising of 13 families. On the other hand, families with no children have the lowest poverty rate of 1.7%, which includes 4 families.
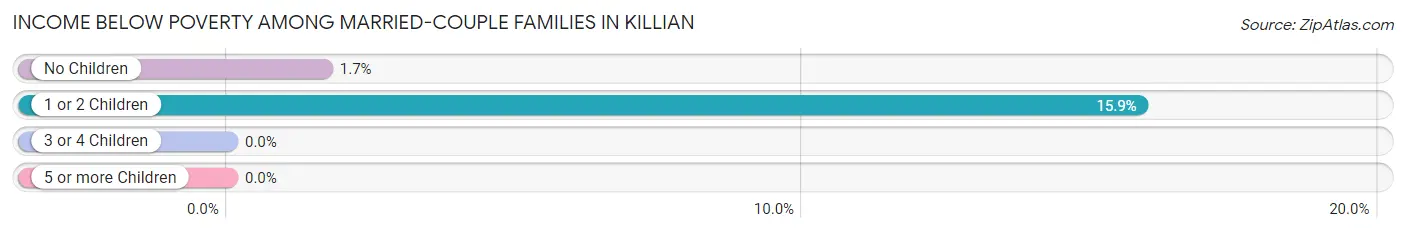
| Children | Above Poverty | Below Poverty |
| No Children | 238 (98.4%) | 4 (1.7%) |
| 1 or 2 Children | 69 (84.2%) | 13 (15.9%) |
| 3 or 4 Children | 0 (0.0%) | 0 (0.0%) |
| 5 or more Children | 0 (0.0%) | 0 (0.0%) |
| Total | 307 (94.8%) | 17 (5.2%) |
Income Below Poverty Among Single-Parent Households in Killian
According to the poverty data in Killian, 26.8% or 19 single-father households and 23.3% or 7 single-mother households are living below the poverty line. Among single-father households, those with 1 or 2 children have the highest poverty rate, with 19 households (29.2%) experiencing poverty. Likewise, among single-mother households, those with 1 or 2 children have the highest poverty rate, with 7 households (46.7%) falling below the poverty line.
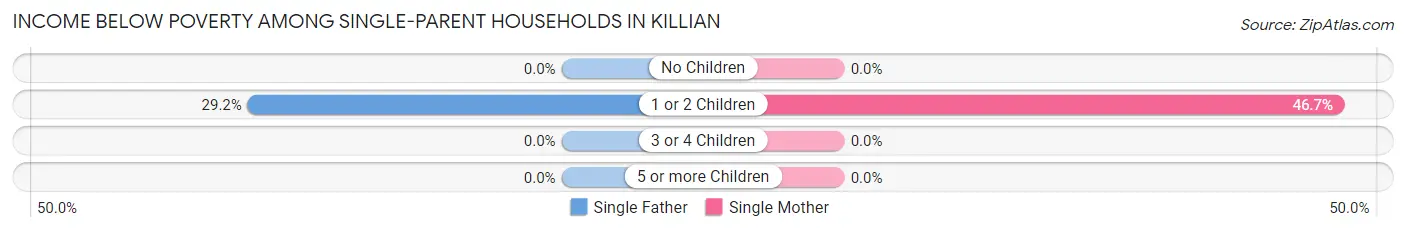
| Children | Single Father | Single Mother |
| No Children | 0 (0.0%) | 0 (0.0%) |
| 1 or 2 Children | 19 (29.2%) | 7 (46.7%) |
| 3 or 4 Children | 0 (0.0%) | 0 (0.0%) |
| 5 or more Children | 0 (0.0%) | 0 (0.0%) |
| Total | 19 (26.8%) | 7 (23.3%) |
Income Below Poverty Among Married-Couple vs Single-Parent Households in Killian
The poverty data for Killian shows that 17 of the married-couple family households (5.2%) and 26 of the single-parent households (25.7%) are living below the poverty level. Within the married-couple family households, those with 1 or 2 children have the highest poverty rate, with 13 households (15.9%) falling below the poverty line. Among the single-parent households, those with 1 or 2 children have the highest poverty rate, with 26 household (32.5%) living below poverty.
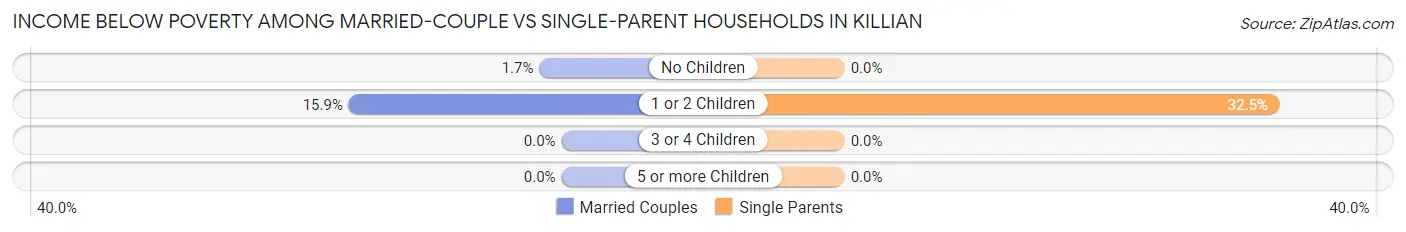
| Children | Married-Couple Families | Single-Parent Households |
| No Children | 4 (1.7%) | 0 (0.0%) |
| 1 or 2 Children | 13 (15.9%) | 26 (32.5%) |
| 3 or 4 Children | 0 (0.0%) | 0 (0.0%) |
| 5 or more Children | 0 (0.0%) | 0 (0.0%) |
| Total | 17 (5.2%) | 26 (25.7%) |
Race in Killian
The most populous races in Killian are White / Caucasian (1,146 | 85.2%), Two or more Races (91 | 6.8%), and Black / African American (90 | 6.7%).
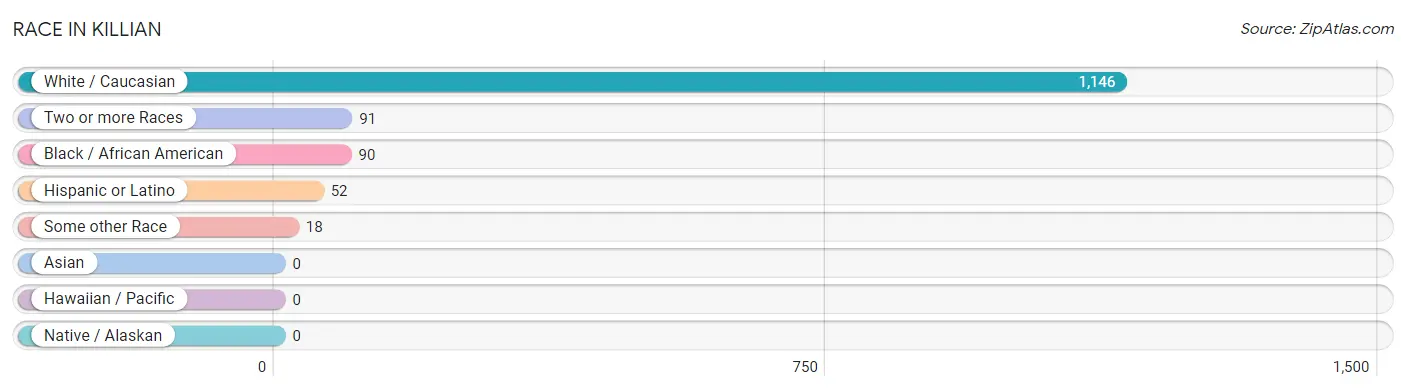
| Race | # Population | % Population |
| Asian | 0 | 0.0% |
| Black / African American | 90 | 6.7% |
| Hawaiian / Pacific | 0 | 0.0% |
| Hispanic or Latino | 52 | 3.9% |
| Native / Alaskan | 0 | 0.0% |
| White / Caucasian | 1,146 | 85.2% |
| Two or more Races | 91 | 6.8% |
| Some other Race | 18 | 1.3% |
| Total | 1,345 | 100.0% |
Ancestry in Killian
The most populous ancestries reported in Killian are French (298 | 22.2%), German (201 | 14.9%), English (129 | 9.6%), Irish (128 | 9.5%), and Scottish (122 | 9.1%), together accounting for 65.3% of all Killian residents.
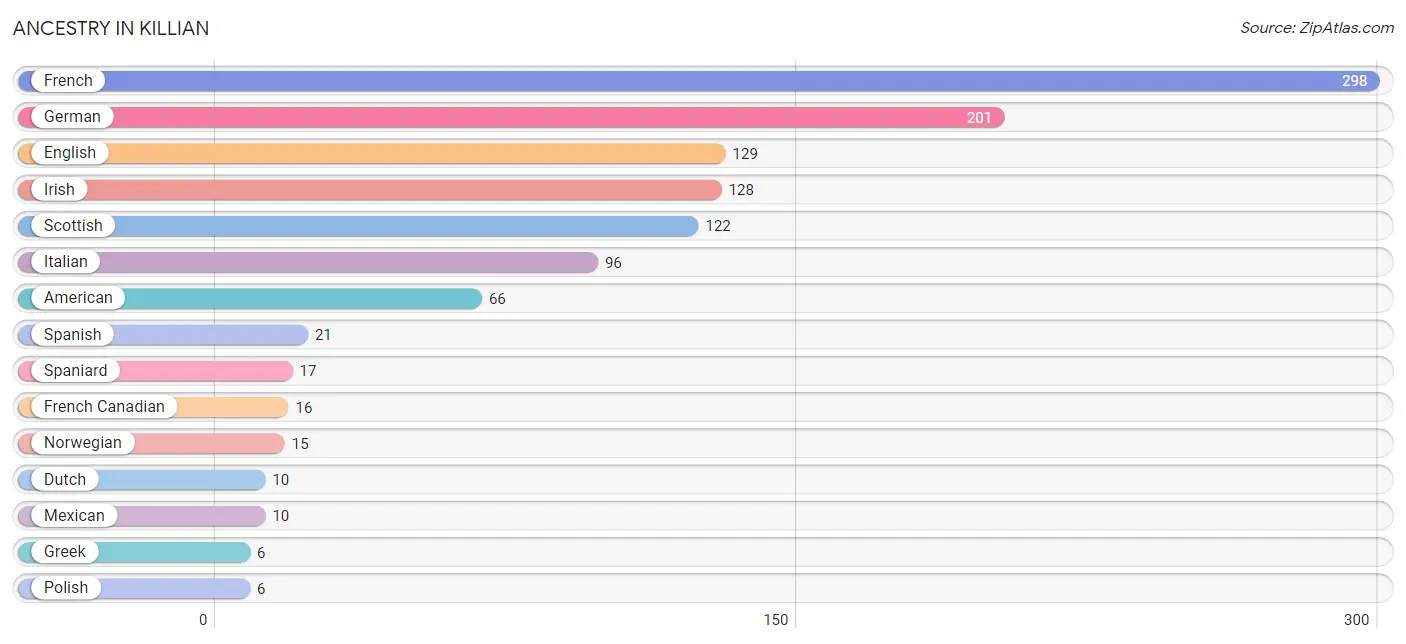
| Ancestry | # Population | % Population |
| American | 66 | 4.9% |
| Cajun | 3 | 0.2% |
| Cherokee | 2 | 0.2% |
| Dutch | 10 | 0.7% |
| Eastern European | 2 | 0.2% |
| English | 129 | 9.6% |
| European | 3 | 0.2% |
| French | 298 | 22.2% |
| French Canadian | 16 | 1.2% |
| German | 201 | 14.9% |
| Greek | 6 | 0.4% |
| Irish | 128 | 9.5% |
| Italian | 96 | 7.1% |
| Mexican | 10 | 0.7% |
| Norwegian | 15 | 1.1% |
| Polish | 6 | 0.4% |
| Puerto Rican | 4 | 0.3% |
| Scotch-Irish | 3 | 0.2% |
| Scottish | 122 | 9.1% |
| Spaniard | 17 | 1.3% |
| Spanish | 21 | 1.6% | View All 21 Rows |
Immigrants in Killian
The most numerous immigrant groups reported in Killian came from , and Canada (4 | 0.3%), together accounting for 0.3% of all Killian residents.

| Immigration Origin | # Population | % Population |
| Canada | 4 | 0.3% | View All 1 Rows |
Sex and Age in Killian
Sex and Age in Killian
The most populous age groups in Killian are 60 to 64 Years (85 | 13.6%) for men and 10 to 14 Years (92 | 12.8%) for women.
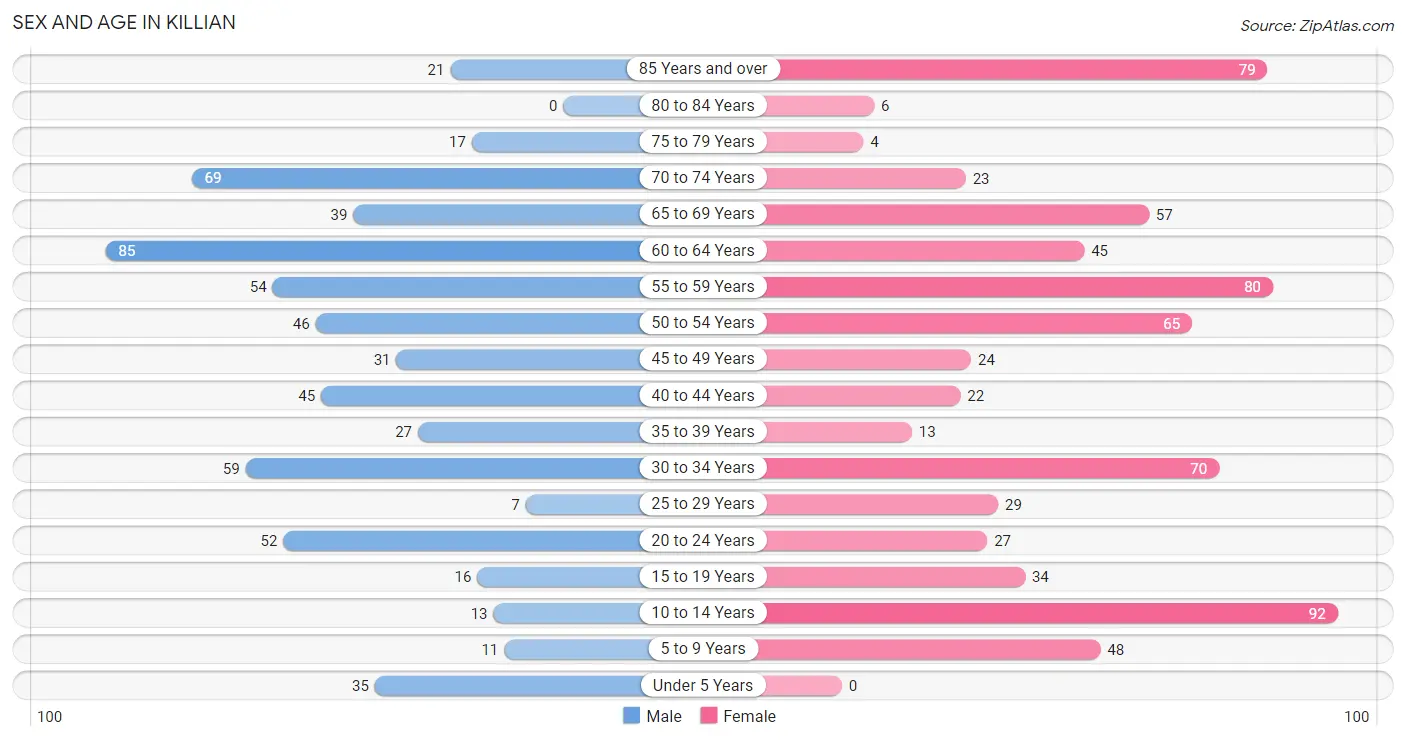
| Age Bracket | Male | Female |
| Under 5 Years | 35 (5.6%) | 0 (0.0%) |
| 5 to 9 Years | 11 (1.8%) | 48 (6.7%) |
| 10 to 14 Years | 13 (2.1%) | 92 (12.8%) |
| 15 to 19 Years | 16 (2.5%) | 34 (4.7%) |
| 20 to 24 Years | 52 (8.3%) | 27 (3.8%) |
| 25 to 29 Years | 7 (1.1%) | 29 (4.0%) |
| 30 to 34 Years | 59 (9.4%) | 70 (9.8%) |
| 35 to 39 Years | 27 (4.3%) | 13 (1.8%) |
| 40 to 44 Years | 45 (7.2%) | 22 (3.1%) |
| 45 to 49 Years | 31 (4.9%) | 24 (3.3%) |
| 50 to 54 Years | 46 (7.3%) | 65 (9.0%) |
| 55 to 59 Years | 54 (8.6%) | 80 (11.1%) |
| 60 to 64 Years | 85 (13.6%) | 45 (6.3%) |
| 65 to 69 Years | 39 (6.2%) | 57 (7.9%) |
| 70 to 74 Years | 69 (11.0%) | 23 (3.2%) |
| 75 to 79 Years | 17 (2.7%) | 4 (0.6%) |
| 80 to 84 Years | 0 (0.0%) | 6 (0.8%) |
| 85 Years and over | 21 (3.4%) | 79 (11.0%) |
| Total | 627 (100.0%) | 718 (100.0%) |
Families and Households in Killian
Median Family Size in Killian
The median family size in Killian is 2.52 persons per family, with single female/mother families (30 | 7.1%) accounting for the largest median family size of 3.03 persons per family. On the other hand, married-couple families (324 | 76.2%) represent the smallest median family size with 2.42 persons per family.
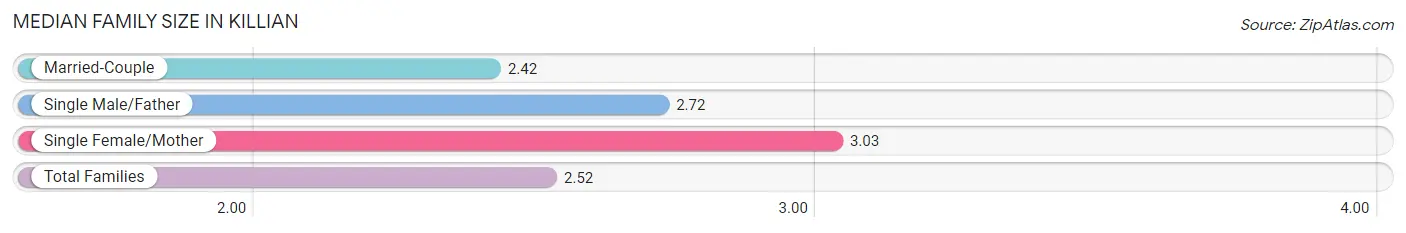
| Family Type | # Families | Family Size |
| Married-Couple | 324 (76.2%) | 2.42 |
| Single Male/Father | 71 (16.7%) | 2.72 |
| Single Female/Mother | 30 (7.1%) | 3.03 |
| Total Families | 425 (100.0%) | 2.52 |
Median Household Size in Killian
The median household size in Killian is 2.19 persons per household, with single male/father households (71 | 11.6%) accounting for the largest median household size of 3.23 persons per household. non-family households (189 | 30.8%) represent the smallest median household size with 1.27 persons per household.
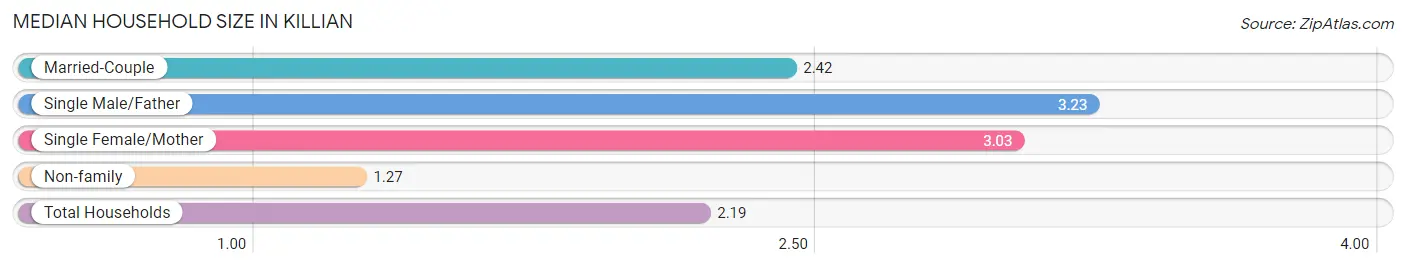
| Household Type | # Households | Household Size |
| Married-Couple | 324 (52.8%) | 2.42 |
| Single Male/Father | 71 (11.6%) | 3.23 |
| Single Female/Mother | 30 (4.9%) | 3.03 |
| Non-family | 189 (30.8%) | 1.27 |
| Total Households | 614 (100.0%) | 2.19 |
Household Size by Marriage Status in Killian
Out of a total of 614 households in Killian, 425 (69.2%) are family households, while 189 (30.8%) are nonfamily households. The most numerous type of family households are 2-person households, comprising 231, and the most common type of nonfamily households are 1-person households, comprising 167.
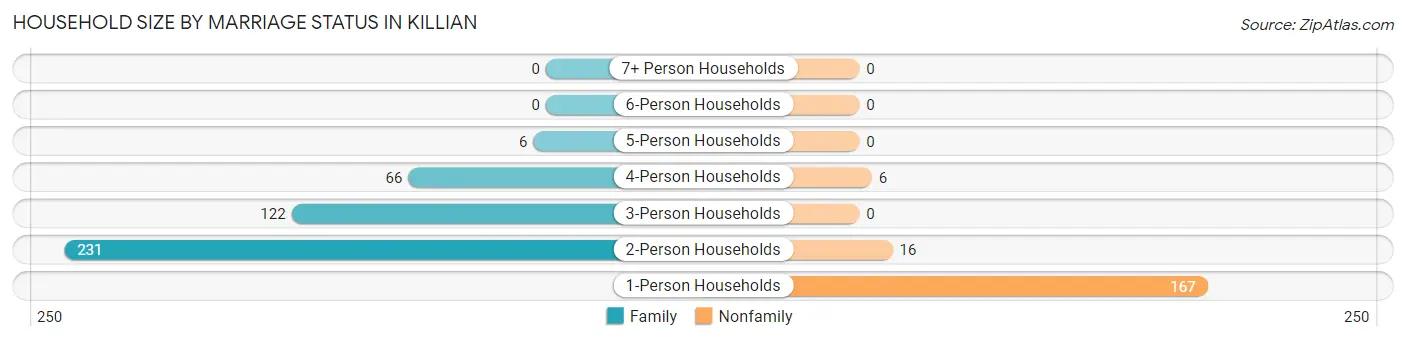
| Household Size | Family Households | Nonfamily Households |
| 1-Person Households | - | 167 (27.2%) |
| 2-Person Households | 231 (37.6%) | 16 (2.6%) |
| 3-Person Households | 122 (19.9%) | 0 (0.0%) |
| 4-Person Households | 66 (10.7%) | 6 (1.0%) |
| 5-Person Households | 6 (1.0%) | 0 (0.0%) |
| 6-Person Households | 0 (0.0%) | 0 (0.0%) |
| 7+ Person Households | 0 (0.0%) | 0 (0.0%) |
| Total | 425 (69.2%) | 189 (30.8%) |
Female Fertility in Killian
Fertility by Age in Killian
| Age Bracket | Women with Births | Births / 1,000 Women |
| 15 to 19 years | 0 (0.0%) | 0.0 |
| 20 to 34 years | 0 (0.0%) | 0.0 |
| 35 to 50 years | 0 (0.0%) | 0.0 |
| Total | 0 (0.0%) | 0.0 |
Fertility by Age by Marriage Status in Killian
| Age Bracket | Married | Unmarried |
| 15 to 19 years | 0 (0.0%) | 0 (0.0%) |
| 20 to 34 years | 0 (0.0%) | 0 (0.0%) |
| 35 to 50 years | 0 (0.0%) | 0 (0.0%) |
| Total | 0 (0.0%) | 0 (0.0%) |
Fertility by Education in Killian
| Educational Attainment | Women with Births | Births / 1,000 Women |
| Less than High School | 0 (0.0%) | 0.0 |
| High School Diploma | 0 (0.0%) | 0.0 |
| College or Associate's Degree | 0 (0.0%) | 0.0 |
| Bachelor's Degree | 0 (0.0%) | 0.0 |
| Graduate Degree | 0 (0.0%) | 0.0 |
| Total | 0 (0.0%) | 0.0 |
Fertility by Education by Marriage Status in Killian
| Educational Attainment | Married | Unmarried |
| Less than High School | 0 (0.0%) | 0 (0.0%) |
| High School Diploma | 0 (0.0%) | 0 (0.0%) |
| College or Associate's Degree | 0 (0.0%) | 0 (0.0%) |
| Bachelor's Degree | 0 (0.0%) | 0 (0.0%) |
| Graduate Degree | 0 (0.0%) | 0 (0.0%) |
| Total | 0 (0.0%) | 0 (0.0%) |
Employment Characteristics in Killian
Employment by Class of Employer in Killian
Among the 472 employed individuals in Killian, private company employees (383 | 81.1%), self-employed (not incorporated) (24 | 5.1%), and state government employees (22 | 4.7%) make up the most common classes of employment.
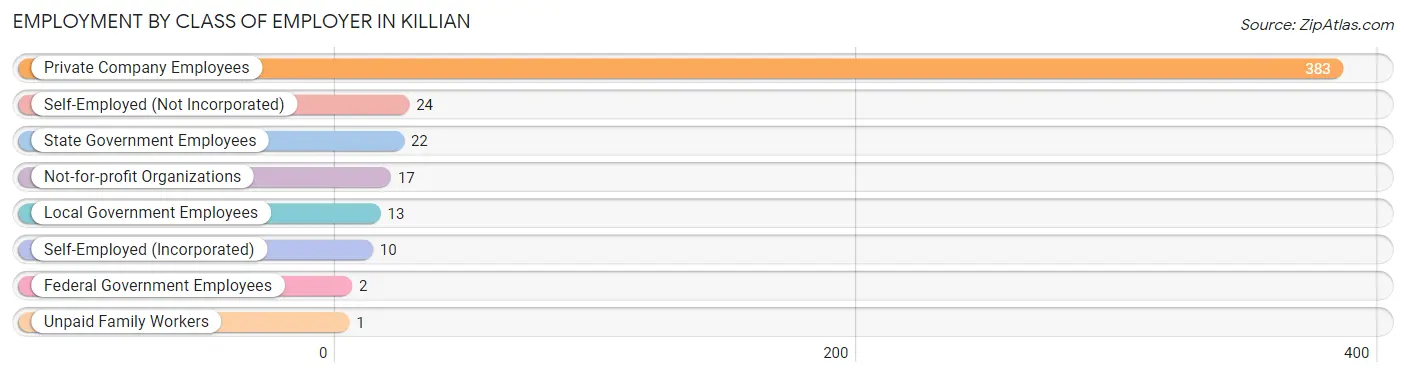
| Employer Class | # Employees | % Employees |
| Private Company Employees | 383 | 81.1% |
| Self-Employed (Incorporated) | 10 | 2.1% |
| Self-Employed (Not Incorporated) | 24 | 5.1% |
| Not-for-profit Organizations | 17 | 3.6% |
| Local Government Employees | 13 | 2.8% |
| State Government Employees | 22 | 4.7% |
| Federal Government Employees | 2 | 0.4% |
| Unpaid Family Workers | 1 | 0.2% |
| Total | 472 | 100.0% |
Employment Status by Age in Killian
According to the labor force statistics for Killian, out of the total population over 16 years of age (1,135), 44.2% or 502 individuals are in the labor force, with 4.0% or 20 of them unemployed. The age group with the highest labor force participation rate is 35 to 44 years, with 87.9% or 94 individuals in the labor force. Within the labor force, the 30 to 34 years age range has the highest percentage of unemployed individuals, with 14.9% or 11 of them being unemployed.
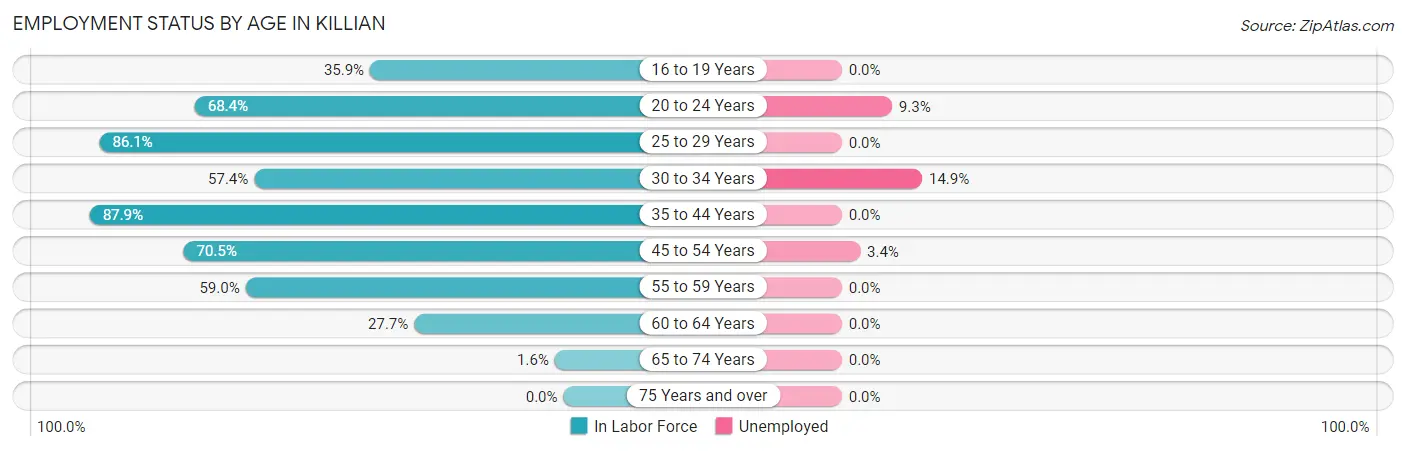
| Age Bracket | In Labor Force | Unemployed |
| 16 to 19 Years | 14 (35.9%) | 0 (0.0%) |
| 20 to 24 Years | 54 (68.4%) | 5 (9.3%) |
| 25 to 29 Years | 31 (86.1%) | 0 (0.0%) |
| 30 to 34 Years | 74 (57.4%) | 11 (14.9%) |
| 35 to 44 Years | 94 (87.9%) | 0 (0.0%) |
| 45 to 54 Years | 117 (70.5%) | 4 (3.4%) |
| 55 to 59 Years | 79 (59.0%) | 0 (0.0%) |
| 60 to 64 Years | 36 (27.7%) | 0 (0.0%) |
| 65 to 74 Years | 3 (1.6%) | 0 (0.0%) |
| 75 Years and over | 0 (0.0%) | 0 (0.0%) |
| Total | 502 (44.2%) | 20 (4.0%) |
Employment Status by Educational Attainment in Killian
According to labor force statistics for Killian, 61.4% of individuals (431) out of the total population between 25 and 64 years of age (702) are in the labor force, with 3.5% or 15 of them being unemployed. The group with the highest labor force participation rate are those with the educational attainment of bachelor's degree or higher, with 65.6% or 84 individuals in the labor force. Within the labor force, individuals with bachelor's degree or higher education have the highest percentage of unemployment, with 8.3% or 7 of them being unemployed.
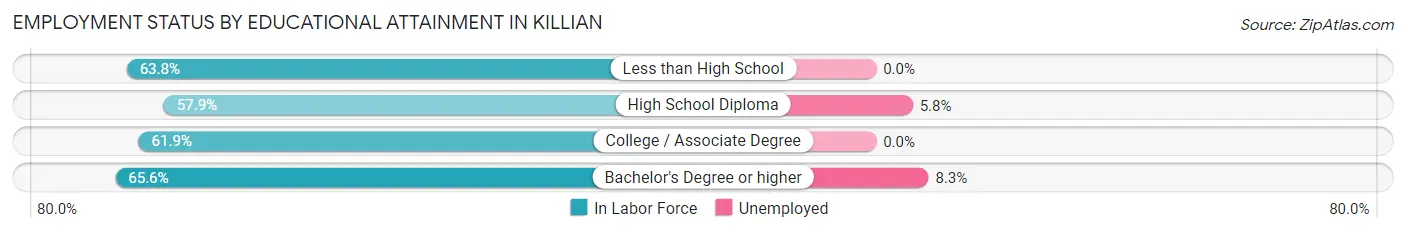
| Educational Attainment | In Labor Force | Unemployed |
| Less than High School | 44 (63.8%) | 0 (0.0%) |
| High School Diploma | 139 (57.9%) | 14 (5.8%) |
| College / Associate Degree | 164 (61.9%) | 0 (0.0%) |
| Bachelor's Degree or higher | 84 (65.6%) | 11 (8.3%) |
| Total | 431 (61.4%) | 25 (3.5%) |
Employment Occupations by Sex in Killian
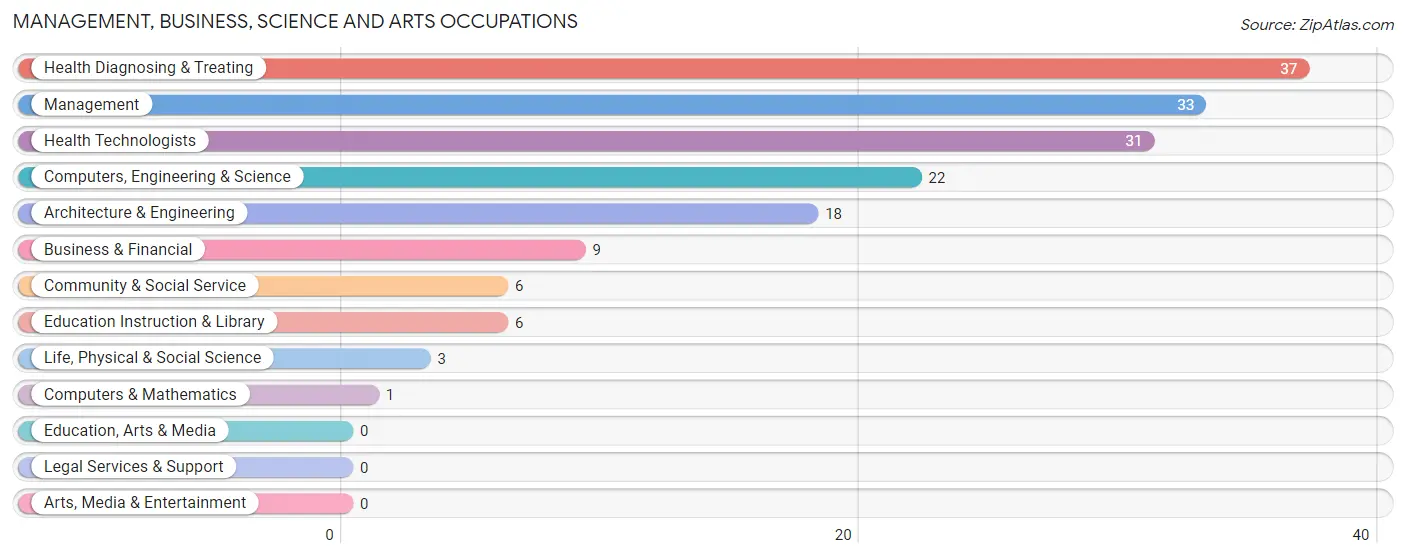
Management, Business, Science and Arts Occupations
The most common Management, Business, Science and Arts occupations in Killian are Health Diagnosing & Treating (37 | 7.7%), Management (33 | 6.9%), Health Technologists (31 | 6.4%), Computers, Engineering & Science (22 | 4.6%), and Architecture & Engineering (18 | 3.7%).
Management, Business, Science and Arts Occupations by Sex
Within the Management, Business, Science and Arts occupations in Killian, the most male-oriented occupations are Architecture & Engineering (100.0%), Life, Physical & Social Science (100.0%), and Computers, Engineering & Science (95.5%), while the most female-oriented occupations are Computers & Mathematics (100.0%), Community & Social Service (100.0%), and Education Instruction & Library (100.0%).
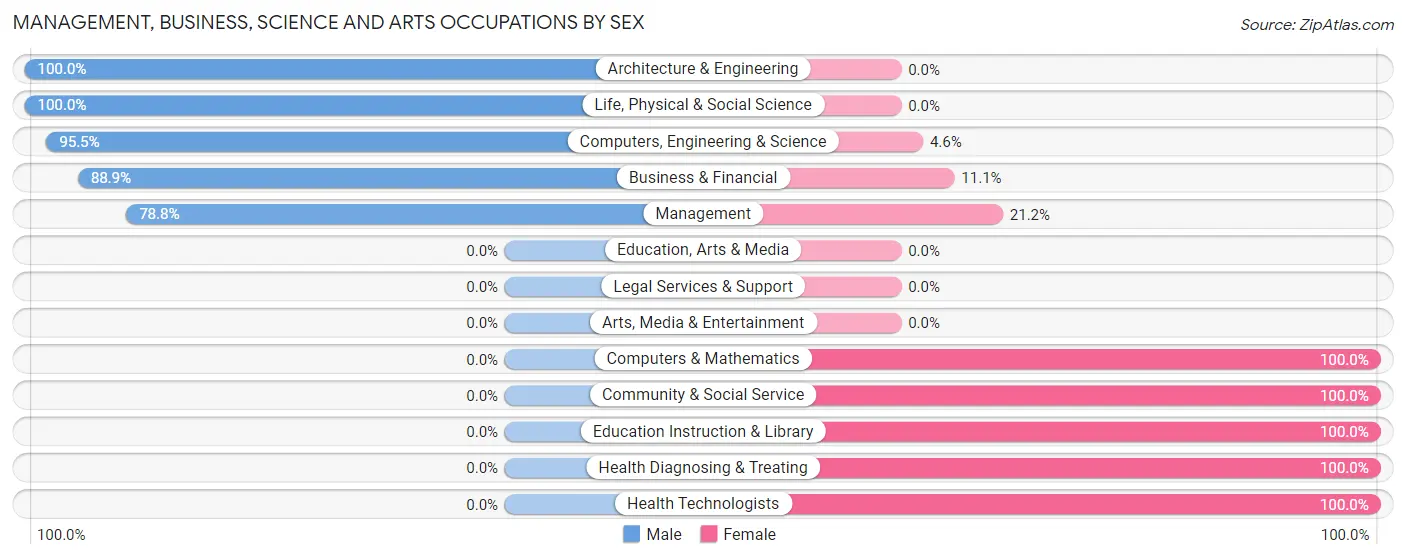
| Occupation | Male | Female |
| Management | 26 (78.8%) | 7 (21.2%) |
| Business & Financial | 8 (88.9%) | 1 (11.1%) |
| Computers, Engineering & Science | 21 (95.5%) | 1 (4.5%) |
| Computers & Mathematics | 0 (0.0%) | 1 (100.0%) |
| Architecture & Engineering | 18 (100.0%) | 0 (0.0%) |
| Life, Physical & Social Science | 3 (100.0%) | 0 (0.0%) |
| Community & Social Service | 0 (0.0%) | 6 (100.0%) |
| Education, Arts & Media | 0 (0.0%) | 0 (0.0%) |
| Legal Services & Support | 0 (0.0%) | 0 (0.0%) |
| Education Instruction & Library | 0 (0.0%) | 6 (100.0%) |
| Arts, Media & Entertainment | 0 (0.0%) | 0 (0.0%) |
| Health Diagnosing & Treating | 0 (0.0%) | 37 (100.0%) |
| Health Technologists | 0 (0.0%) | 31 (100.0%) |
| Total (Category) | 55 (51.4%) | 52 (48.6%) |
| Total (Overall) | 280 (58.1%) | 202 (41.9%) |
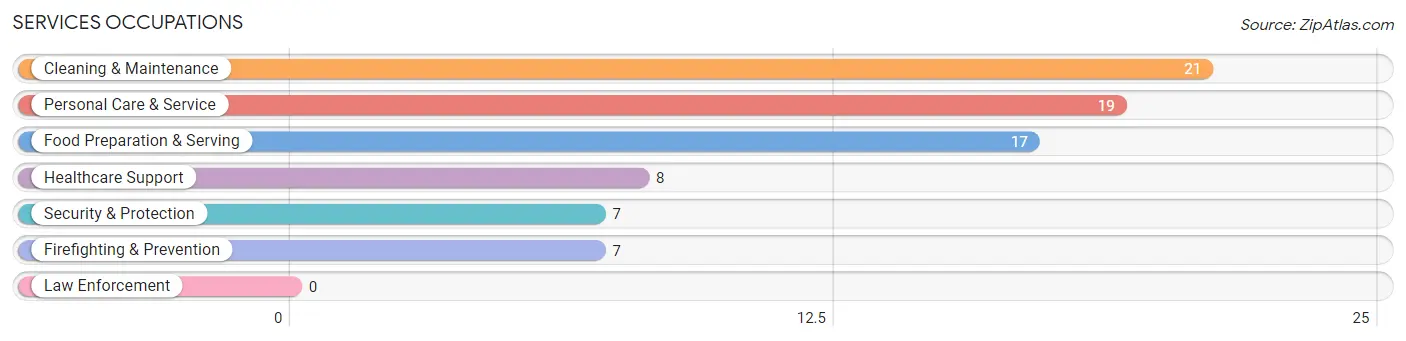
Services Occupations
The most common Services occupations in Killian are Cleaning & Maintenance (21 | 4.4%), Personal Care & Service (19 | 3.9%), Food Preparation & Serving (17 | 3.5%), Healthcare Support (8 | 1.7%), and Security & Protection (7 | 1.5%).
Services Occupations by Sex
Within the Services occupations in Killian, the most male-oriented occupations are Security & Protection (100.0%), Firefighting & Prevention (100.0%), and Personal Care & Service (26.3%), while the most female-oriented occupations are Healthcare Support (100.0%), Food Preparation & Serving (100.0%), and Cleaning & Maintenance (100.0%).
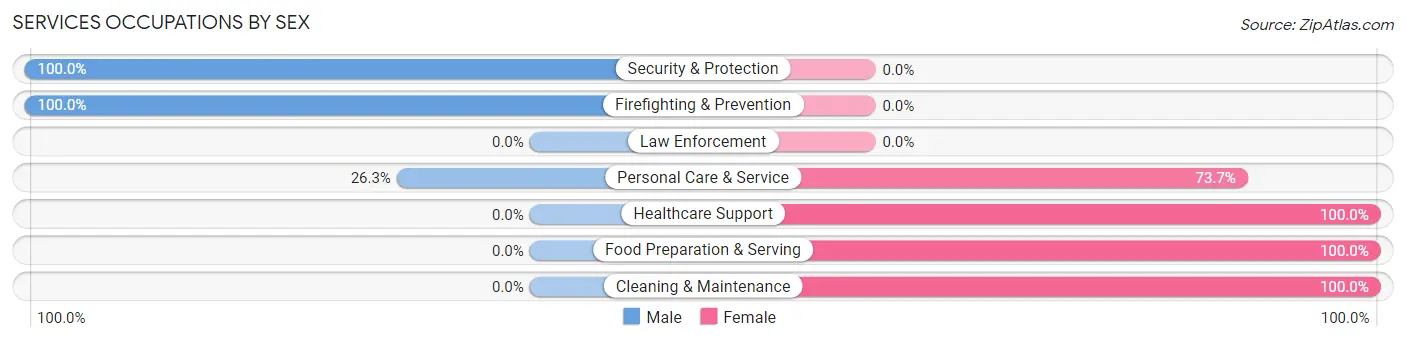
| Occupation | Male | Female |
| Healthcare Support | 0 (0.0%) | 8 (100.0%) |
| Security & Protection | 7 (100.0%) | 0 (0.0%) |
| Firefighting & Prevention | 7 (100.0%) | 0 (0.0%) |
| Law Enforcement | 0 (0.0%) | 0 (0.0%) |
| Food Preparation & Serving | 0 (0.0%) | 17 (100.0%) |
| Cleaning & Maintenance | 0 (0.0%) | 21 (100.0%) |
| Personal Care & Service | 5 (26.3%) | 14 (73.7%) |
| Total (Category) | 12 (16.7%) | 60 (83.3%) |
| Total (Overall) | 280 (58.1%) | 202 (41.9%) |
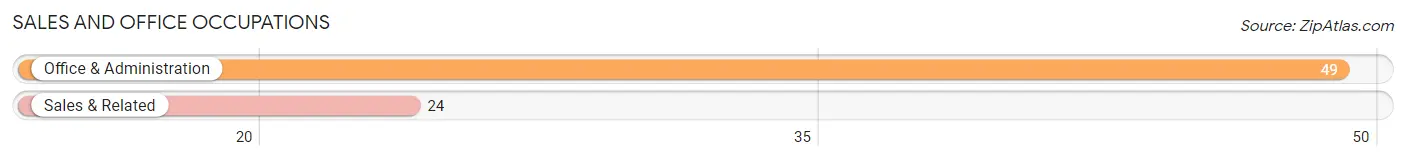
Sales and Office Occupations
The most common Sales and Office occupations in Killian are Office & Administration (49 | 10.2%), and Sales & Related (24 | 5.0%).
Sales and Office Occupations by Sex

| Occupation | Male | Female |
| Sales & Related | 12 (50.0%) | 12 (50.0%) |
| Office & Administration | 2 (4.1%) | 47 (95.9%) |
| Total (Category) | 14 (19.2%) | 59 (80.8%) |
| Total (Overall) | 280 (58.1%) | 202 (41.9%) |
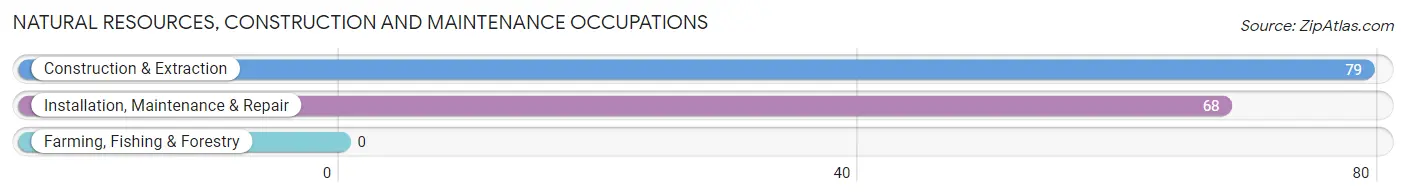
Natural Resources, Construction and Maintenance Occupations
The most common Natural Resources, Construction and Maintenance occupations in Killian are Construction & Extraction (79 | 16.4%), and Installation, Maintenance & Repair (68 | 14.1%).
Natural Resources, Construction and Maintenance Occupations by Sex
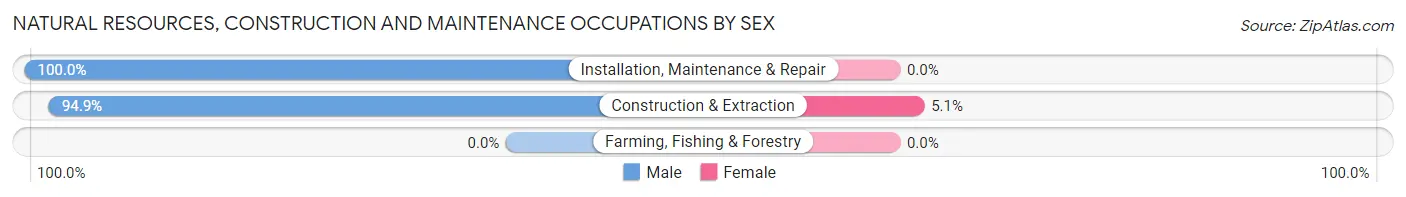
| Occupation | Male | Female |
| Farming, Fishing & Forestry | 0 (0.0%) | 0 (0.0%) |
| Construction & Extraction | 75 (94.9%) | 4 (5.1%) |
| Installation, Maintenance & Repair | 68 (100.0%) | 0 (0.0%) |
| Total (Category) | 143 (97.3%) | 4 (2.7%) |
| Total (Overall) | 280 (58.1%) | 202 (41.9%) |
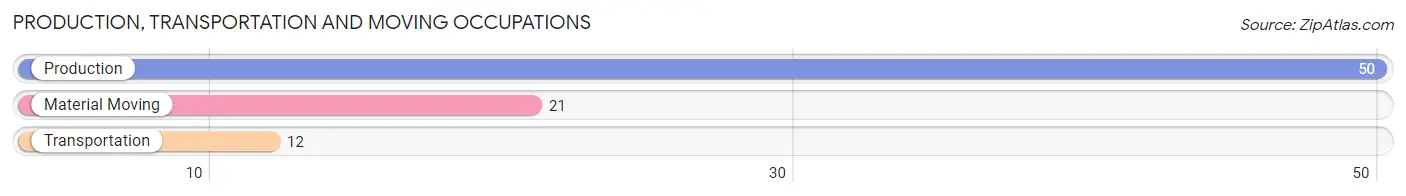
Production, Transportation and Moving Occupations
The most common Production, Transportation and Moving occupations in Killian are Production (50 | 10.4%), Material Moving (21 | 4.4%), and Transportation (12 | 2.5%).
Production, Transportation and Moving Occupations by Sex
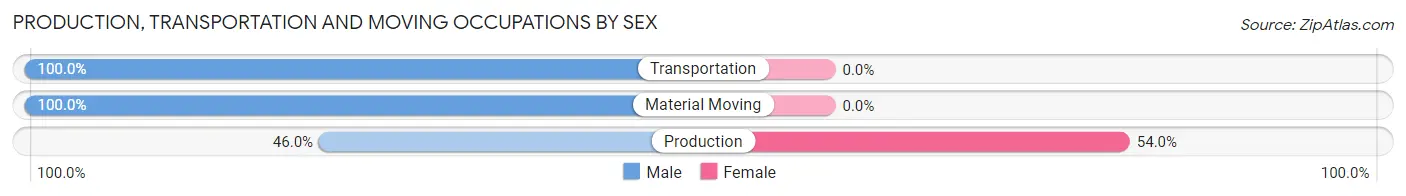
| Occupation | Male | Female |
| Production | 23 (46.0%) | 27 (54.0%) |
| Transportation | 12 (100.0%) | 0 (0.0%) |
| Material Moving | 21 (100.0%) | 0 (0.0%) |
| Total (Category) | 56 (67.5%) | 27 (32.5%) |
| Total (Overall) | 280 (58.1%) | 202 (41.9%) |
Employment Industries by Sex in Killian
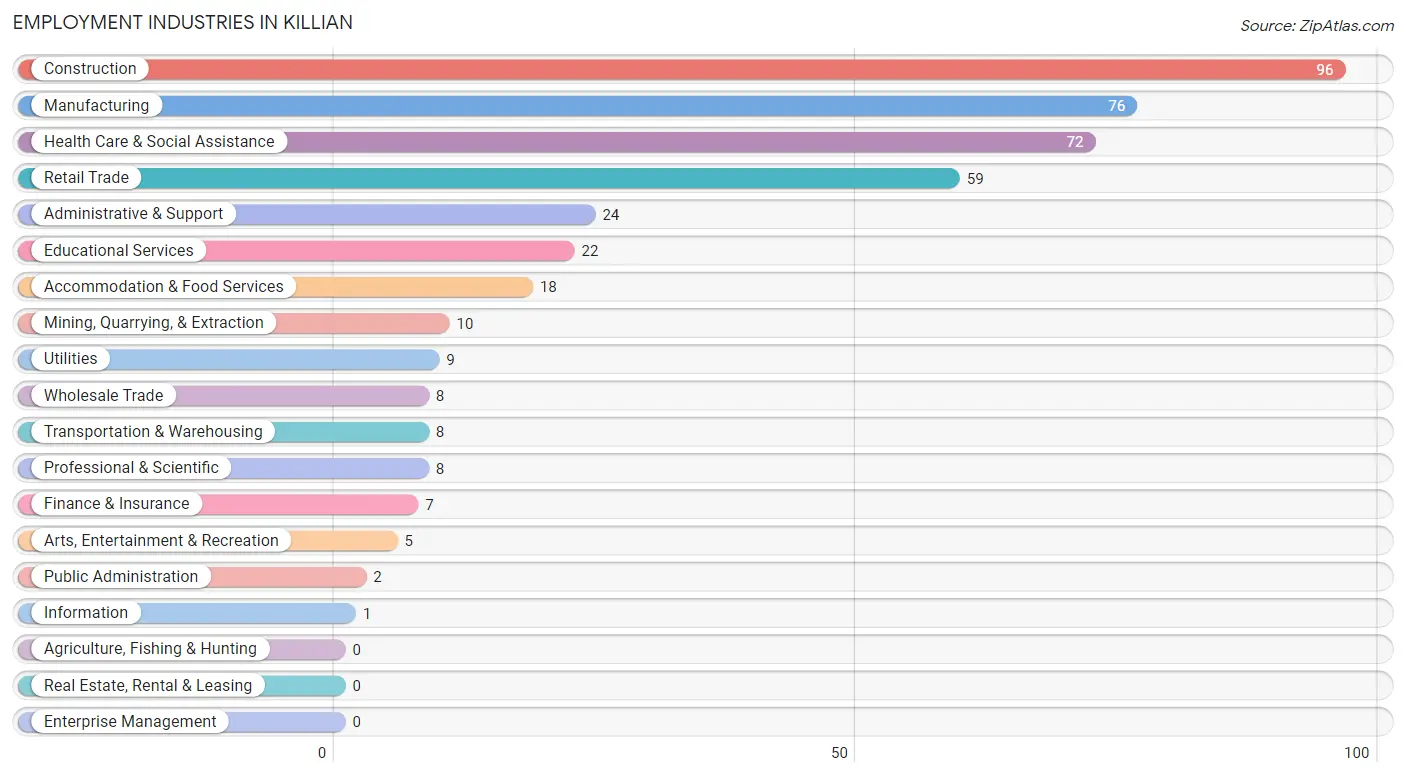
Employment Industries in Killian
The major employment industries in Killian include Construction (96 | 19.9%), Manufacturing (76 | 15.8%), Health Care & Social Assistance (72 | 14.9%), Retail Trade (59 | 12.2%), and Administrative & Support (24 | 5.0%).
Employment Industries by Sex in Killian
The Killian industries that see more men than women are Mining, Quarrying, & Extraction (100.0%), Transportation & Warehousing (100.0%), and Utilities (100.0%), whereas the industries that tend to have a higher number of women are Information (100.0%), Health Care & Social Assistance (100.0%), and Accommodation & Food Services (100.0%).
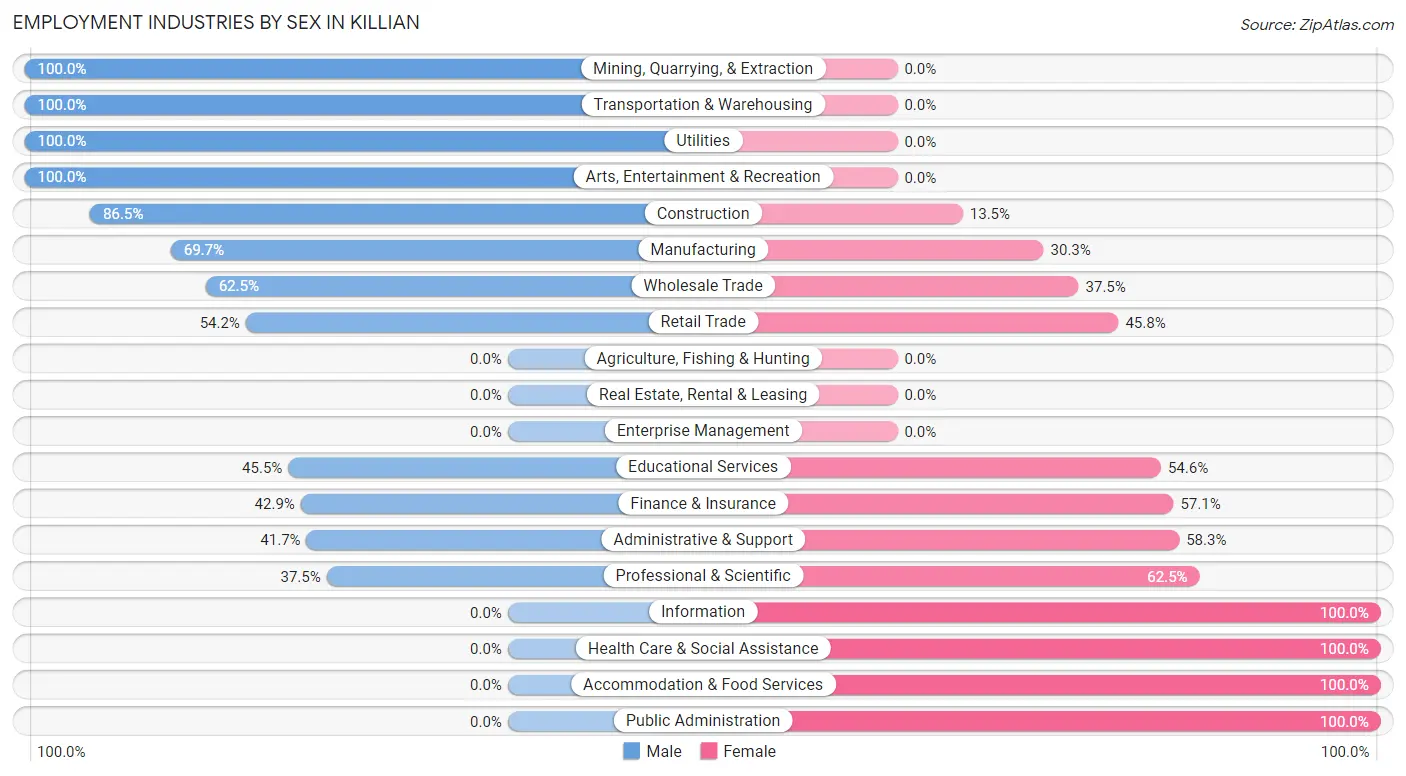
| Industry | Male | Female |
| Agriculture, Fishing & Hunting | 0 (0.0%) | 0 (0.0%) |
| Mining, Quarrying, & Extraction | 10 (100.0%) | 0 (0.0%) |
| Construction | 83 (86.5%) | 13 (13.5%) |
| Manufacturing | 53 (69.7%) | 23 (30.3%) |
| Wholesale Trade | 5 (62.5%) | 3 (37.5%) |
| Retail Trade | 32 (54.2%) | 27 (45.8%) |
| Transportation & Warehousing | 8 (100.0%) | 0 (0.0%) |
| Utilities | 9 (100.0%) | 0 (0.0%) |
| Information | 0 (0.0%) | 1 (100.0%) |
| Finance & Insurance | 3 (42.9%) | 4 (57.1%) |
| Real Estate, Rental & Leasing | 0 (0.0%) | 0 (0.0%) |
| Professional & Scientific | 3 (37.5%) | 5 (62.5%) |
| Enterprise Management | 0 (0.0%) | 0 (0.0%) |
| Administrative & Support | 10 (41.7%) | 14 (58.3%) |
| Educational Services | 10 (45.5%) | 12 (54.5%) |
| Health Care & Social Assistance | 0 (0.0%) | 72 (100.0%) |
| Arts, Entertainment & Recreation | 5 (100.0%) | 0 (0.0%) |
| Accommodation & Food Services | 0 (0.0%) | 18 (100.0%) |
| Public Administration | 0 (0.0%) | 2 (100.0%) |
| Total | 280 (58.1%) | 202 (41.9%) |
Education in Killian
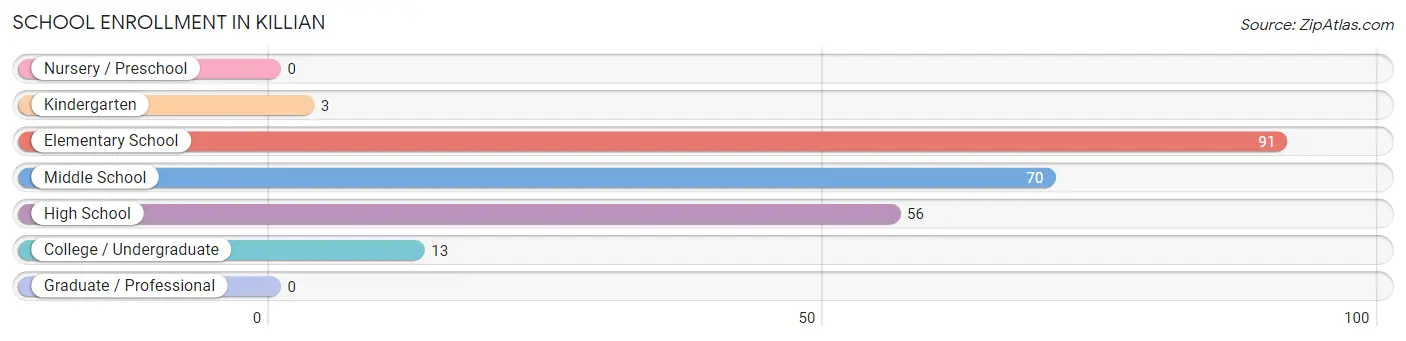
School Enrollment in Killian
The most common levels of schooling among the 233 students in Killian are elementary school (91 | 39.1%), middle school (70 | 30.0%), and high school (56 | 24.0%).
| School Level | # Students | % Students |
| Nursery / Preschool | 0 | 0.0% |
| Kindergarten | 3 | 1.3% |
| Elementary School | 91 | 39.1% |
| Middle School | 70 | 30.0% |
| High School | 56 | 24.0% |
| College / Undergraduate | 13 | 5.6% |
| Graduate / Professional | 0 | 0.0% |
| Total | 233 | 100.0% |
School Enrollment by Age by Funding Source in Killian
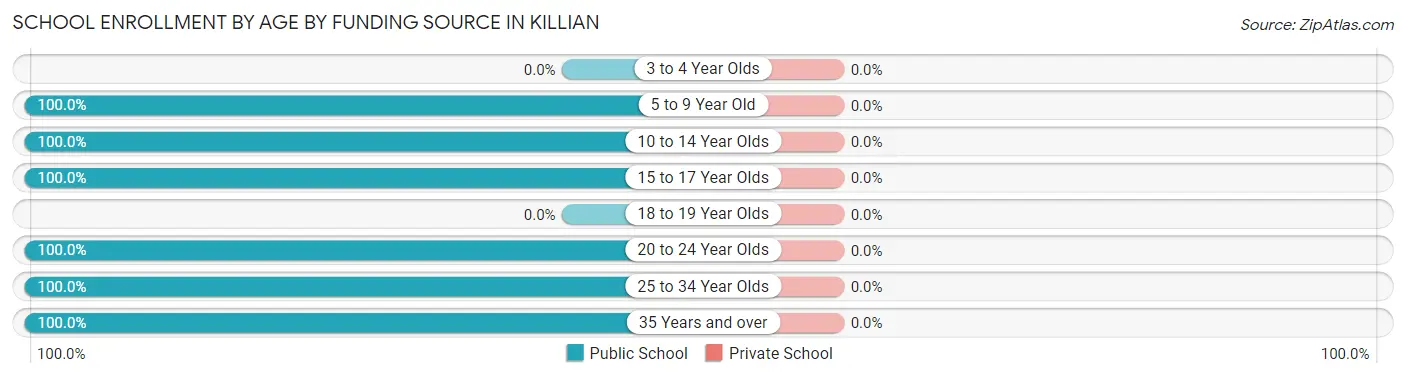
| Age Bracket | Public School | Private School |
| 3 to 4 Year Olds | 0 (0.0%) | 0 (0.0%) |
| 5 to 9 Year Old | 59 (100.0%) | 0 (0.0%) |
| 10 to 14 Year Olds | 105 (100.0%) | 0 (0.0%) |
| 15 to 17 Year Olds | 50 (100.0%) | 0 (0.0%) |
| 18 to 19 Year Olds | 0 (0.0%) | 0 (0.0%) |
| 20 to 24 Year Olds | 6 (100.0%) | 0 (0.0%) |
| 25 to 34 Year Olds | 7 (100.0%) | 0 (0.0%) |
| 35 Years and over | 6 (100.0%) | 0 (0.0%) |
| Total | 233 (100.0%) | 0 (0.0%) |
Educational Attainment by Field of Study in Killian
Science & technology (69 | 35.9%), business (50 | 26.0%), engineering (32 | 16.7%), bio, nature & agricultural (12 | 6.2%), and computers & mathematics (9 | 4.7%) are the most common fields of study among 192 individuals in Killian who have obtained a bachelor's degree or higher.
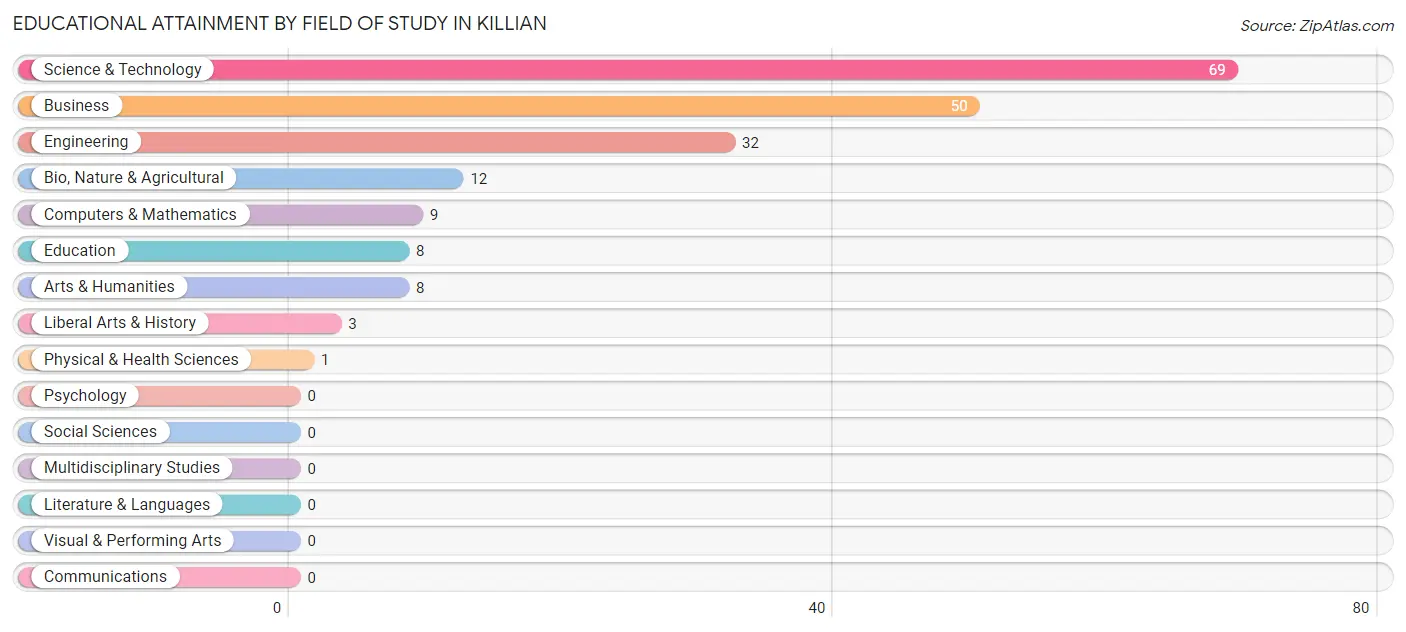
| Field of Study | # Graduates | % Graduates |
| Computers & Mathematics | 9 | 4.7% |
| Bio, Nature & Agricultural | 12 | 6.2% |
| Physical & Health Sciences | 1 | 0.5% |
| Psychology | 0 | 0.0% |
| Social Sciences | 0 | 0.0% |
| Engineering | 32 | 16.7% |
| Multidisciplinary Studies | 0 | 0.0% |
| Science & Technology | 69 | 35.9% |
| Business | 50 | 26.0% |
| Education | 8 | 4.2% |
| Literature & Languages | 0 | 0.0% |
| Liberal Arts & History | 3 | 1.6% |
| Visual & Performing Arts | 0 | 0.0% |
| Communications | 0 | 0.0% |
| Arts & Humanities | 8 | 4.2% |
| Total | 192 | 100.0% |
Transportation & Commute in Killian
Vehicle Availability by Sex in Killian
The most prevalent vehicle ownership categories in Killian are males with 1 vehicle (99, accounting for 35.7%) and females with 1 vehicle (35, making up 50.8%).
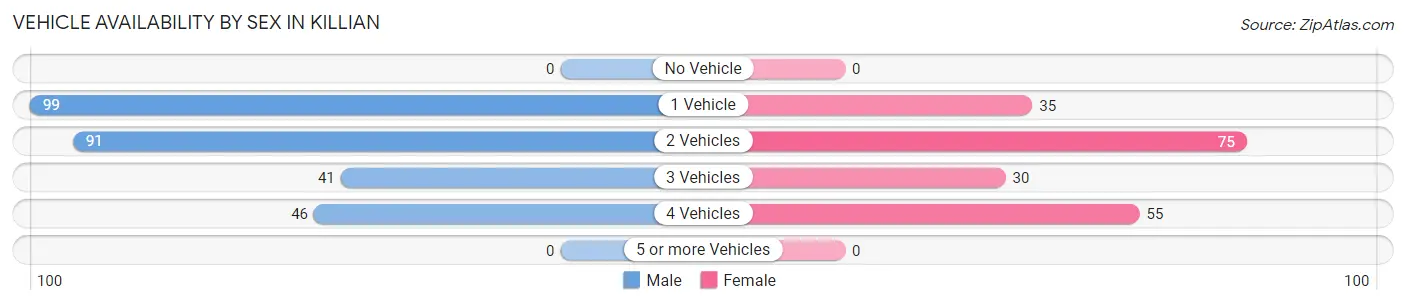
| Vehicles Available | Male | Female |
| No Vehicle | 0 (0.0%) | 0 (0.0%) |
| 1 Vehicle | 99 (35.7%) | 35 (17.9%) |
| 2 Vehicles | 91 (32.9%) | 75 (38.5%) |
| 3 Vehicles | 41 (14.8%) | 30 (15.4%) |
| 4 Vehicles | 46 (16.6%) | 55 (28.2%) |
| 5 or more Vehicles | 0 (0.0%) | 0 (0.0%) |
| Total | 277 (100.0%) | 195 (100.0%) |
Commute Time in Killian
The most frequently occuring commute durations in Killian are 60 to 89 minutes (109 commuters, 25.2%), 30 to 34 minutes (65 commuters, 15.0%), and 45 to 59 minutes (61 commuters, 14.1%).
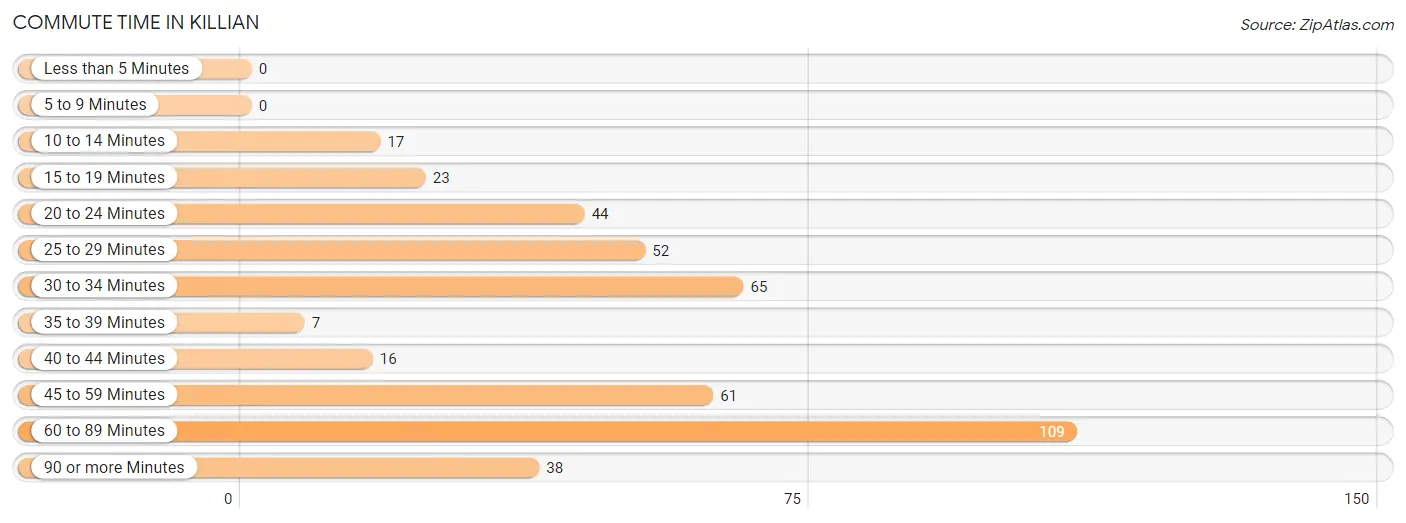
| Commute Time | # Commuters | % Commuters |
| Less than 5 Minutes | 0 | 0.0% |
| 5 to 9 Minutes | 0 | 0.0% |
| 10 to 14 Minutes | 17 | 3.9% |
| 15 to 19 Minutes | 23 | 5.3% |
| 20 to 24 Minutes | 44 | 10.2% |
| 25 to 29 Minutes | 52 | 12.0% |
| 30 to 34 Minutes | 65 | 15.0% |
| 35 to 39 Minutes | 7 | 1.6% |
| 40 to 44 Minutes | 16 | 3.7% |
| 45 to 59 Minutes | 61 | 14.1% |
| 60 to 89 Minutes | 109 | 25.2% |
| 90 or more Minutes | 38 | 8.8% |
Commute Time by Sex in Killian
The most common commute times in Killian are 60 to 89 minutes (89 commuters, 36.0%) for males and 30 to 34 minutes (46 commuters, 24.9%) for females.
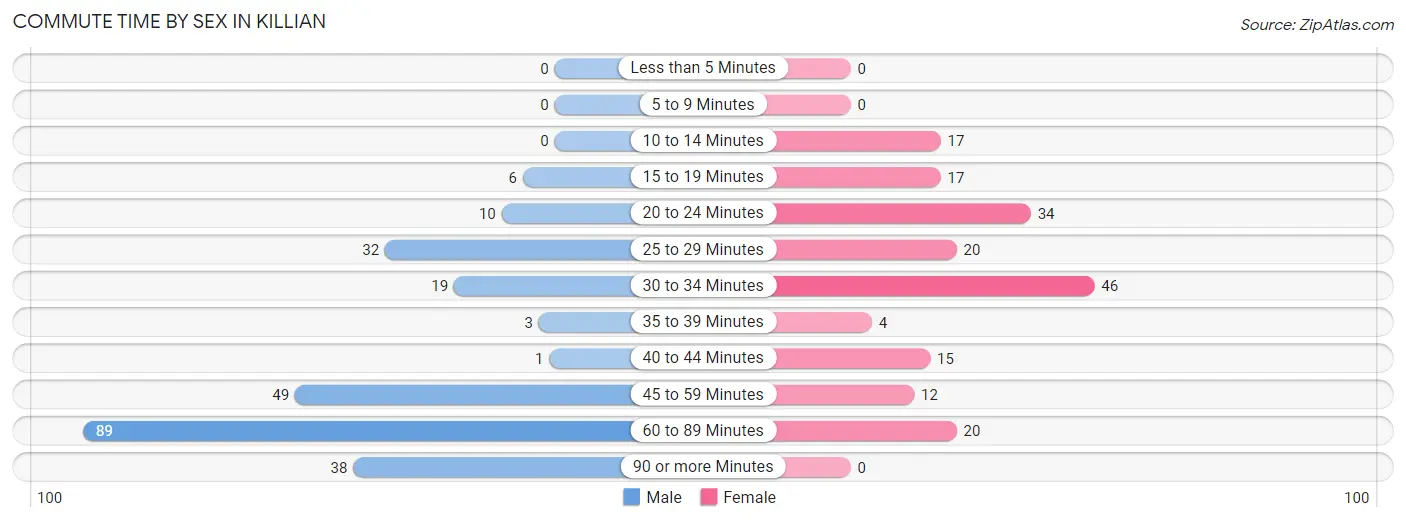
| Commute Time | Male | Female |
| Less than 5 Minutes | 0 (0.0%) | 0 (0.0%) |
| 5 to 9 Minutes | 0 (0.0%) | 0 (0.0%) |
| 10 to 14 Minutes | 0 (0.0%) | 17 (9.2%) |
| 15 to 19 Minutes | 6 (2.4%) | 17 (9.2%) |
| 20 to 24 Minutes | 10 (4.1%) | 34 (18.4%) |
| 25 to 29 Minutes | 32 (13.0%) | 20 (10.8%) |
| 30 to 34 Minutes | 19 (7.7%) | 46 (24.9%) |
| 35 to 39 Minutes | 3 (1.2%) | 4 (2.2%) |
| 40 to 44 Minutes | 1 (0.4%) | 15 (8.1%) |
| 45 to 59 Minutes | 49 (19.8%) | 12 (6.5%) |
| 60 to 89 Minutes | 89 (36.0%) | 20 (10.8%) |
| 90 or more Minutes | 38 (15.4%) | 0 (0.0%) |
Time of Departure to Work by Sex in Killian
The most frequent times of departure to work in Killian are 5:00 AM to 5:29 AM (68, 27.5%) for males and 7:00 AM to 7:29 AM (50, 27.0%) for females.
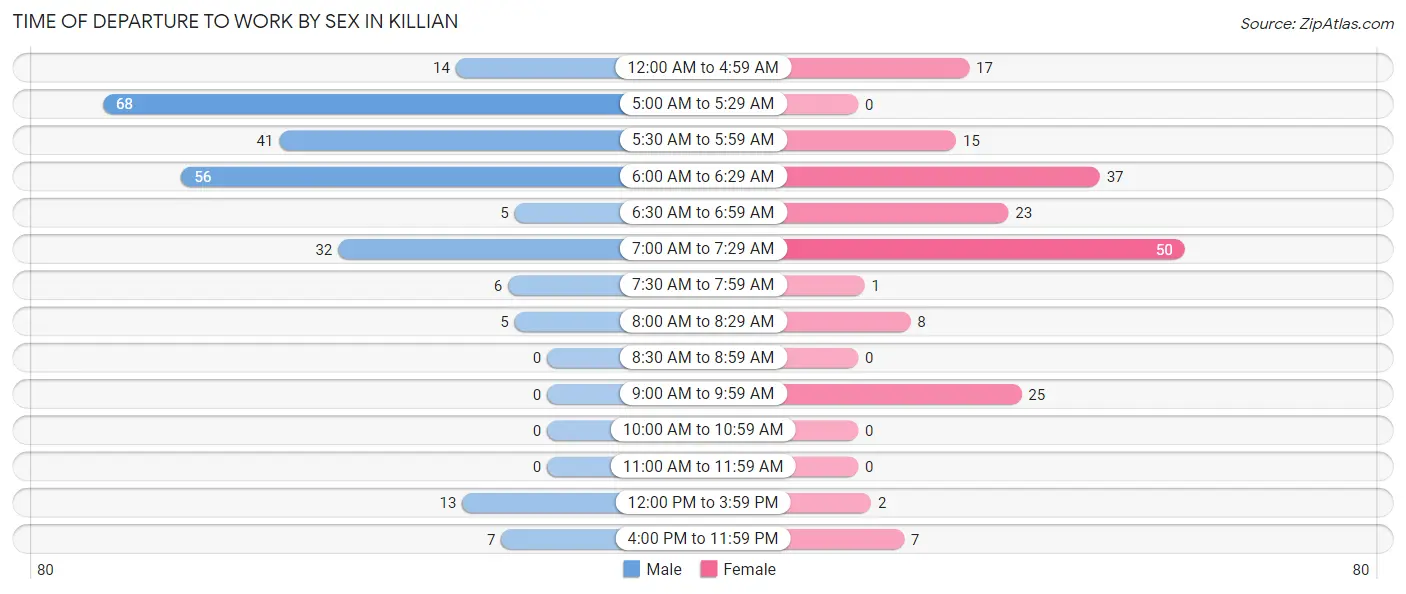
| Time of Departure | Male | Female |
| 12:00 AM to 4:59 AM | 14 (5.7%) | 17 (9.2%) |
| 5:00 AM to 5:29 AM | 68 (27.5%) | 0 (0.0%) |
| 5:30 AM to 5:59 AM | 41 (16.6%) | 15 (8.1%) |
| 6:00 AM to 6:29 AM | 56 (22.7%) | 37 (20.0%) |
| 6:30 AM to 6:59 AM | 5 (2.0%) | 23 (12.4%) |
| 7:00 AM to 7:29 AM | 32 (13.0%) | 50 (27.0%) |
| 7:30 AM to 7:59 AM | 6 (2.4%) | 1 (0.5%) |
| 8:00 AM to 8:29 AM | 5 (2.0%) | 8 (4.3%) |
| 8:30 AM to 8:59 AM | 0 (0.0%) | 0 (0.0%) |
| 9:00 AM to 9:59 AM | 0 (0.0%) | 25 (13.5%) |
| 10:00 AM to 10:59 AM | 0 (0.0%) | 0 (0.0%) |
| 11:00 AM to 11:59 AM | 0 (0.0%) | 0 (0.0%) |
| 12:00 PM to 3:59 PM | 13 (5.3%) | 2 (1.1%) |
| 4:00 PM to 11:59 PM | 7 (2.8%) | 7 (3.8%) |
| Total | 247 (100.0%) | 185 (100.0%) |
Housing Occupancy in Killian
Occupancy by Ownership in Killian
Of the total 614 dwellings in Killian, owner-occupied units account for 574 (93.5%), while renter-occupied units make up 40 (6.5%).
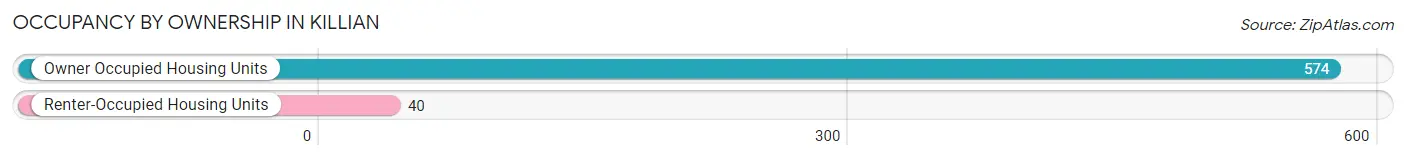
| Occupancy | # Housing Units | % Housing Units |
| Owner Occupied Housing Units | 574 | 93.5% |
| Renter-Occupied Housing Units | 40 | 6.5% |
| Total Occupied Housing Units | 614 | 100.0% |
Occupancy by Household Size in Killian
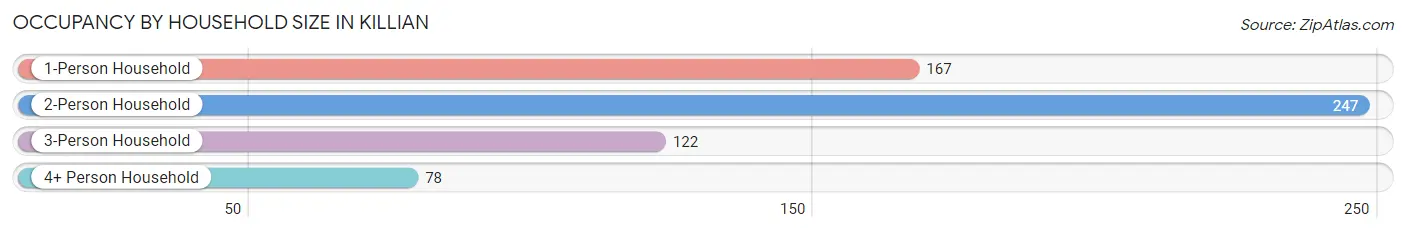
| Household Size | # Housing Units | % Housing Units |
| 1-Person Household | 167 | 27.2% |
| 2-Person Household | 247 | 40.2% |
| 3-Person Household | 122 | 19.9% |
| 4+ Person Household | 78 | 12.7% |
| Total Housing Units | 614 | 100.0% |
Occupancy by Ownership by Household Size in Killian
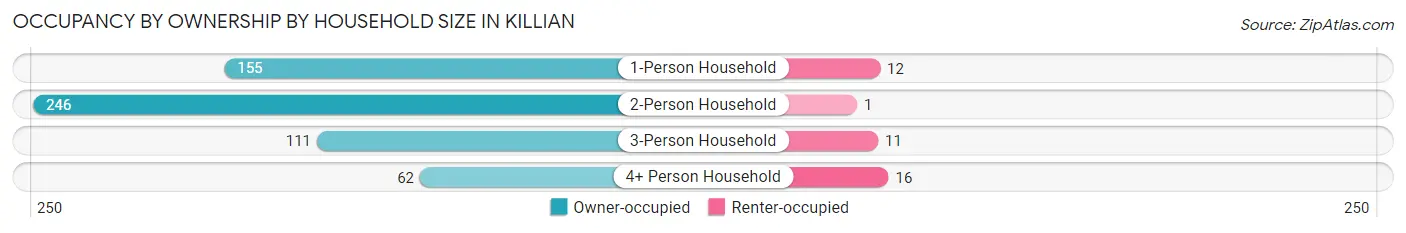
| Household Size | Owner-occupied | Renter-occupied |
| 1-Person Household | 155 (92.8%) | 12 (7.2%) |
| 2-Person Household | 246 (99.6%) | 1 (0.4%) |
| 3-Person Household | 111 (91.0%) | 11 (9.0%) |
| 4+ Person Household | 62 (79.5%) | 16 (20.5%) |
| Total Housing Units | 574 (93.5%) | 40 (6.5%) |
Occupancy by Educational Attainment in Killian
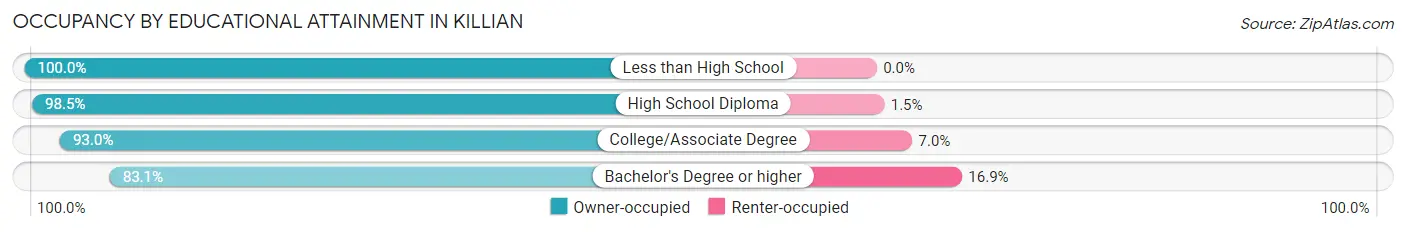
| Household Size | Owner-occupied | Renter-occupied |
| Less than High School | 36 (100.0%) | 0 (0.0%) |
| High School Diploma | 261 (98.5%) | 4 (1.5%) |
| College/Associate Degree | 159 (93.0%) | 12 (7.0%) |
| Bachelor's Degree or higher | 118 (83.1%) | 24 (16.9%) |
Occupancy by Age of Householder in Killian
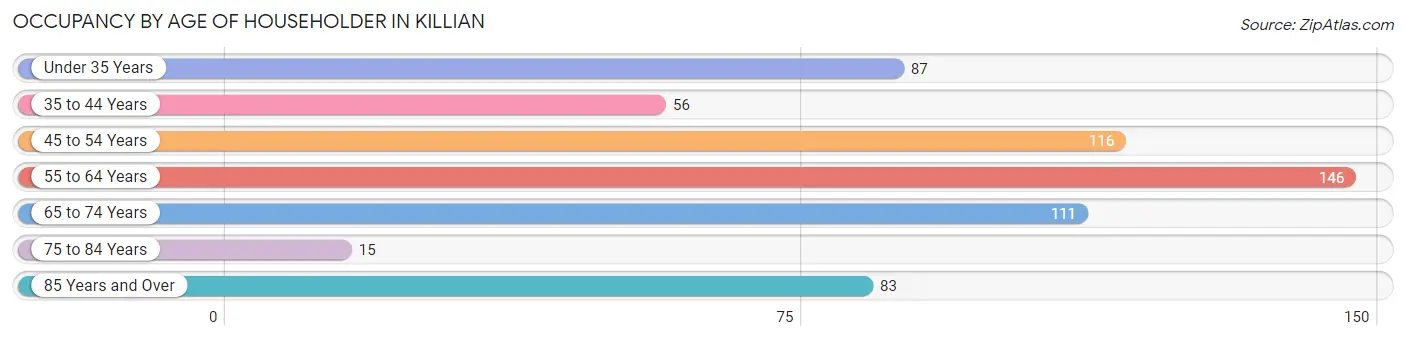
| Age Bracket | # Households | % Households |
| Under 35 Years | 87 | 14.2% |
| 35 to 44 Years | 56 | 9.1% |
| 45 to 54 Years | 116 | 18.9% |
| 55 to 64 Years | 146 | 23.8% |
| 65 to 74 Years | 111 | 18.1% |
| 75 to 84 Years | 15 | 2.4% |
| 85 Years and Over | 83 | 13.5% |
| Total | 614 | 100.0% |
Housing Finances in Killian
Median Income by Occupancy in Killian
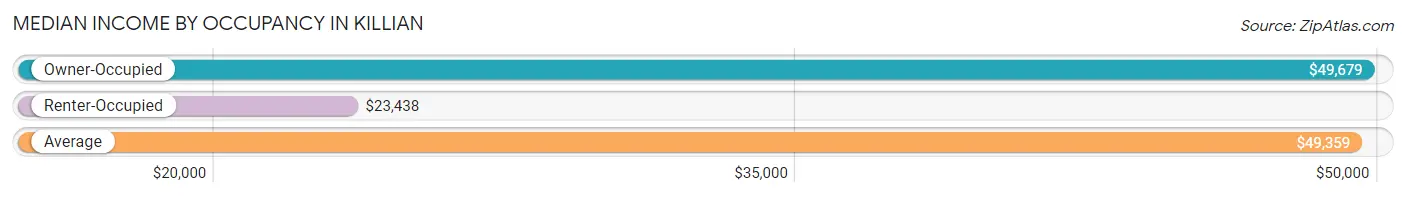
| Occupancy Type | # Households | Median Income |
| Owner-Occupied | 574 (93.5%) | $49,679 |
| Renter-Occupied | 40 (6.5%) | $23,438 |
| Average | 614 (100.0%) | $49,359 |
Occupancy by Householder Income Bracket in Killian
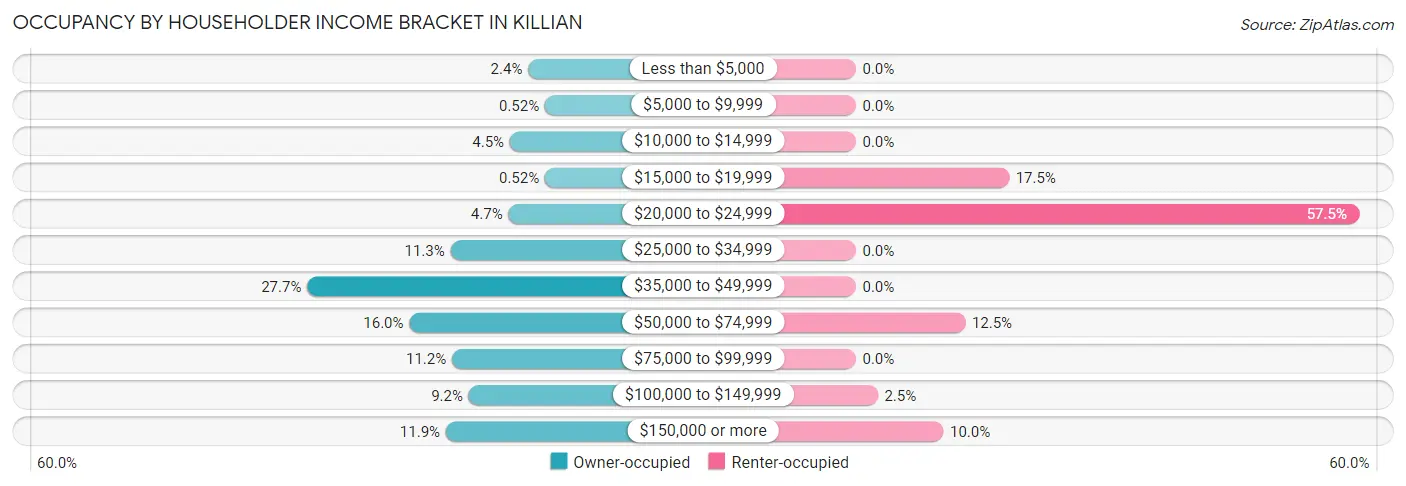
| Income Bracket | Owner-occupied | Renter-occupied |
| Less than $5,000 | 14 (2.4%) | 0 (0.0%) |
| $5,000 to $9,999 | 3 (0.5%) | 0 (0.0%) |
| $10,000 to $14,999 | 26 (4.5%) | 0 (0.0%) |
| $15,000 to $19,999 | 3 (0.5%) | 7 (17.5%) |
| $20,000 to $24,999 | 27 (4.7%) | 23 (57.5%) |
| $25,000 to $34,999 | 65 (11.3%) | 0 (0.0%) |
| $35,000 to $49,999 | 159 (27.7%) | 0 (0.0%) |
| $50,000 to $74,999 | 92 (16.0%) | 5 (12.5%) |
| $75,000 to $99,999 | 64 (11.2%) | 0 (0.0%) |
| $100,000 to $149,999 | 53 (9.2%) | 1 (2.5%) |
| $150,000 or more | 68 (11.8%) | 4 (10.0%) |
| Total | 574 (100.0%) | 40 (100.0%) |
Monthly Housing Cost Tiers in Killian
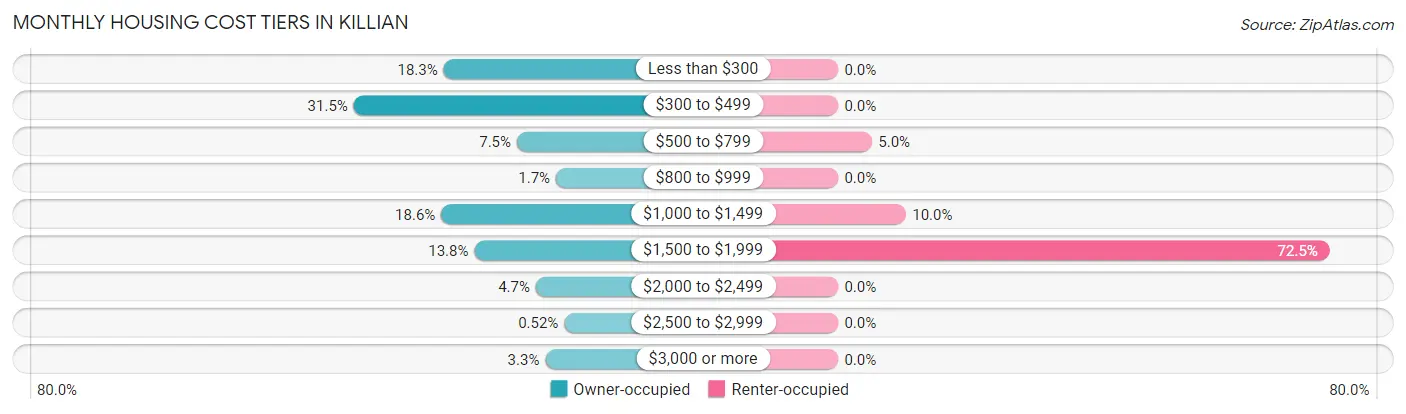
| Monthly Cost | Owner-occupied | Renter-occupied |
| Less than $300 | 105 (18.3%) | 0 (0.0%) |
| $300 to $499 | 181 (31.5%) | 0 (0.0%) |
| $500 to $799 | 43 (7.5%) | 2 (5.0%) |
| $800 to $999 | 10 (1.7%) | 0 (0.0%) |
| $1,000 to $1,499 | 107 (18.6%) | 4 (10.0%) |
| $1,500 to $1,999 | 79 (13.8%) | 29 (72.5%) |
| $2,000 to $2,499 | 27 (4.7%) | 0 (0.0%) |
| $2,500 to $2,999 | 3 (0.5%) | 0 (0.0%) |
| $3,000 or more | 19 (3.3%) | 0 (0.0%) |
| Total | 574 (100.0%) | 40 (100.0%) |
Physical Housing Characteristics in Killian
Housing Structures in Killian
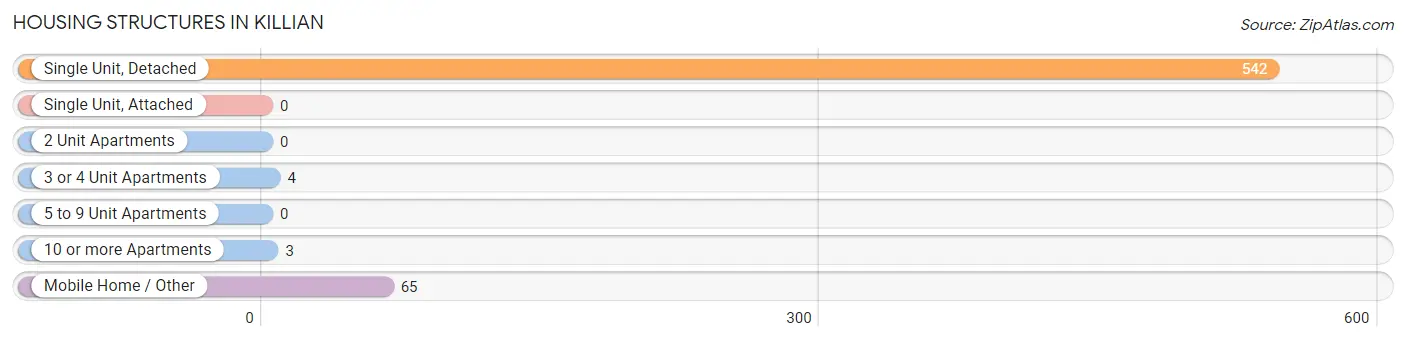
| Structure Type | # Housing Units | % Housing Units |
| Single Unit, Detached | 542 | 88.3% |
| Single Unit, Attached | 0 | 0.0% |
| 2 Unit Apartments | 0 | 0.0% |
| 3 or 4 Unit Apartments | 4 | 0.6% |
| 5 to 9 Unit Apartments | 0 | 0.0% |
| 10 or more Apartments | 3 | 0.5% |
| Mobile Home / Other | 65 | 10.6% |
| Total | 614 | 100.0% |
Housing Structures by Occupancy in Killian
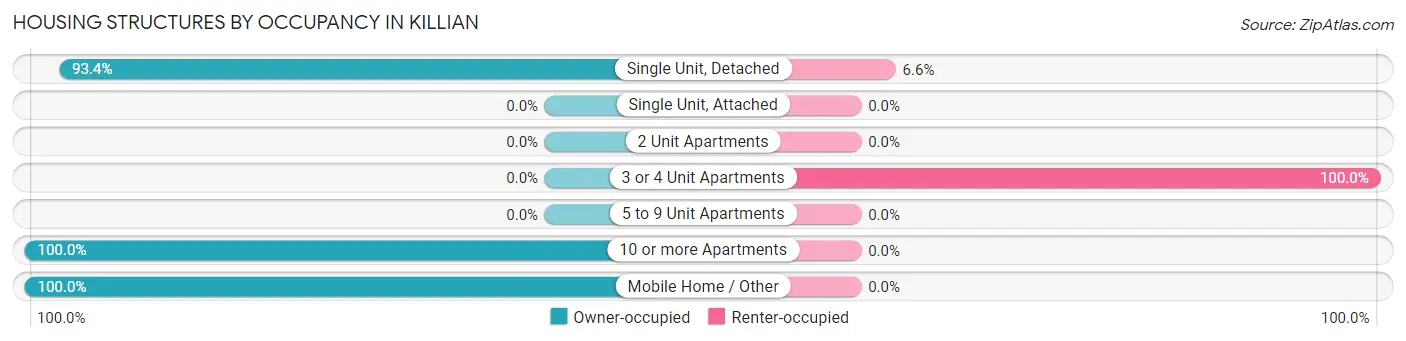
| Structure Type | Owner-occupied | Renter-occupied |
| Single Unit, Detached | 506 (93.4%) | 36 (6.6%) |
| Single Unit, Attached | 0 (0.0%) | 0 (0.0%) |
| 2 Unit Apartments | 0 (0.0%) | 0 (0.0%) |
| 3 or 4 Unit Apartments | 0 (0.0%) | 4 (100.0%) |
| 5 to 9 Unit Apartments | 0 (0.0%) | 0 (0.0%) |
| 10 or more Apartments | 3 (100.0%) | 0 (0.0%) |
| Mobile Home / Other | 65 (100.0%) | 0 (0.0%) |
| Total | 574 (93.5%) | 40 (6.5%) |
Housing Structures by Number of Rooms in Killian
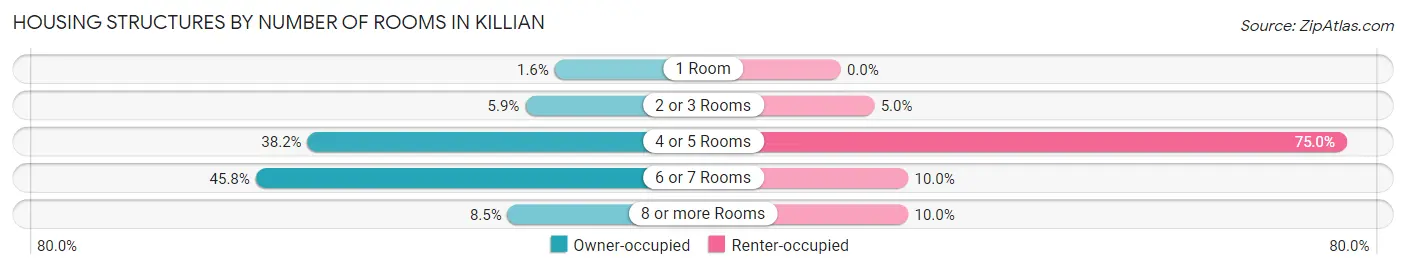
| Number of Rooms | Owner-occupied | Renter-occupied |
| 1 Room | 9 (1.6%) | 0 (0.0%) |
| 2 or 3 Rooms | 34 (5.9%) | 2 (5.0%) |
| 4 or 5 Rooms | 219 (38.2%) | 30 (75.0%) |
| 6 or 7 Rooms | 263 (45.8%) | 4 (10.0%) |
| 8 or more Rooms | 49 (8.5%) | 4 (10.0%) |
| Total | 574 (100.0%) | 40 (100.0%) |
Housing Structure by Heating Type in Killian
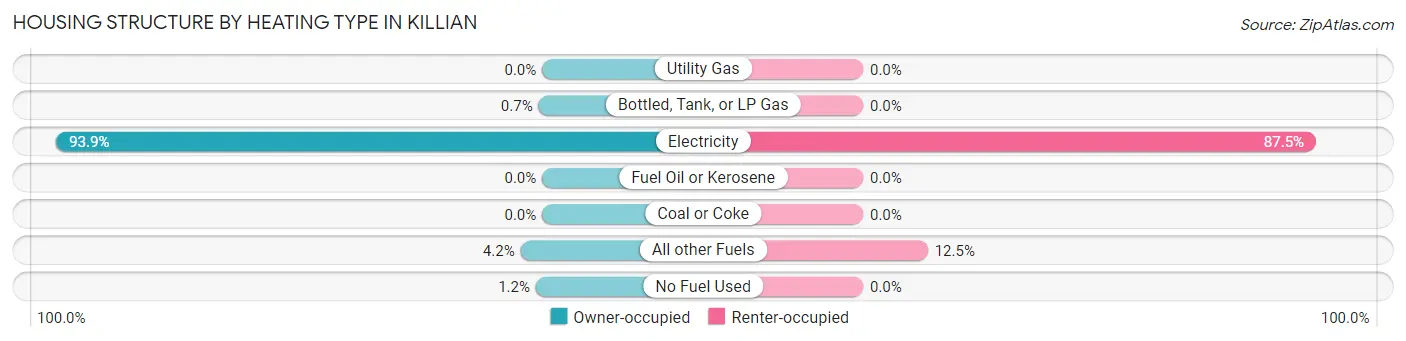
| Heating Type | Owner-occupied | Renter-occupied |
| Utility Gas | 0 (0.0%) | 0 (0.0%) |
| Bottled, Tank, or LP Gas | 4 (0.7%) | 0 (0.0%) |
| Electricity | 539 (93.9%) | 35 (87.5%) |
| Fuel Oil or Kerosene | 0 (0.0%) | 0 (0.0%) |
| Coal or Coke | 0 (0.0%) | 0 (0.0%) |
| All other Fuels | 24 (4.2%) | 5 (12.5%) |
| No Fuel Used | 7 (1.2%) | 0 (0.0%) |
| Total | 574 (100.0%) | 40 (100.0%) |
Household Vehicle Usage in Killian
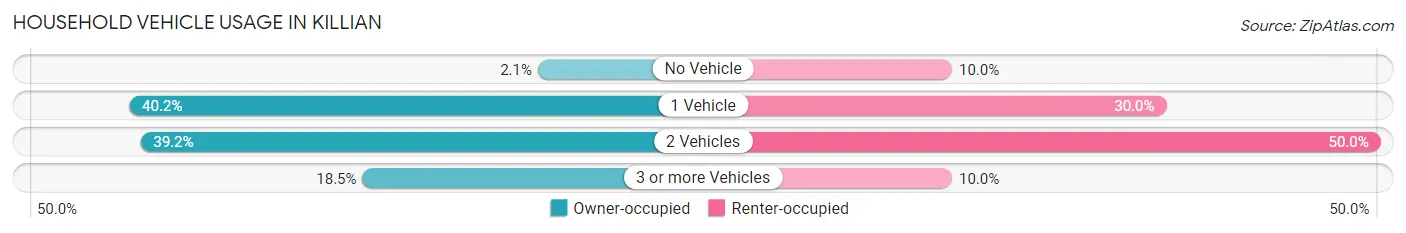
| Vehicles per Household | Owner-occupied | Renter-occupied |
| No Vehicle | 12 (2.1%) | 4 (10.0%) |
| 1 Vehicle | 231 (40.2%) | 12 (30.0%) |
| 2 Vehicles | 225 (39.2%) | 20 (50.0%) |
| 3 or more Vehicles | 106 (18.5%) | 4 (10.0%) |
| Total | 574 (100.0%) | 40 (100.0%) |
Real Estate & Mortgages in Killian
Real Estate and Mortgage Overview in Killian
| Characteristic | Without Mortgage | With Mortgage |
| Housing Units | 329 | 245 |
| Median Property Value | $303,400 | $219,200 |
| Median Household Income | $47,516 | $26 |
| Monthly Housing Costs | $371 | $19 |
| Real Estate Taxes | - | - |
Property Value by Mortgage Status in Killian
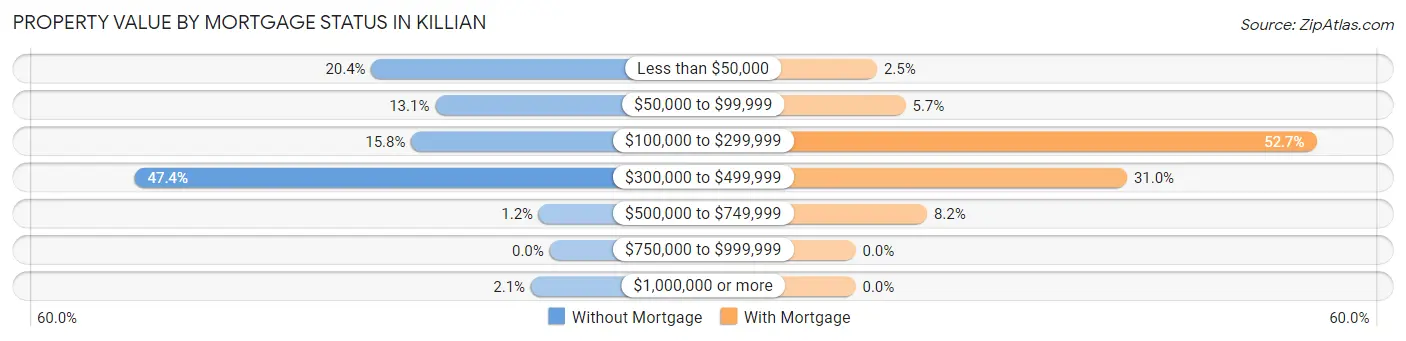
| Property Value | Without Mortgage | With Mortgage |
| Less than $50,000 | 67 (20.4%) | 6 (2.5%) |
| $50,000 to $99,999 | 43 (13.1%) | 14 (5.7%) |
| $100,000 to $299,999 | 52 (15.8%) | 129 (52.6%) |
| $300,000 to $499,999 | 156 (47.4%) | 76 (31.0%) |
| $500,000 to $749,999 | 4 (1.2%) | 20 (8.2%) |
| $750,000 to $999,999 | 0 (0.0%) | 0 (0.0%) |
| $1,000,000 or more | 7 (2.1%) | 0 (0.0%) |
| Total | 329 (100.0%) | 245 (100.0%) |
Household Income by Mortgage Status in Killian
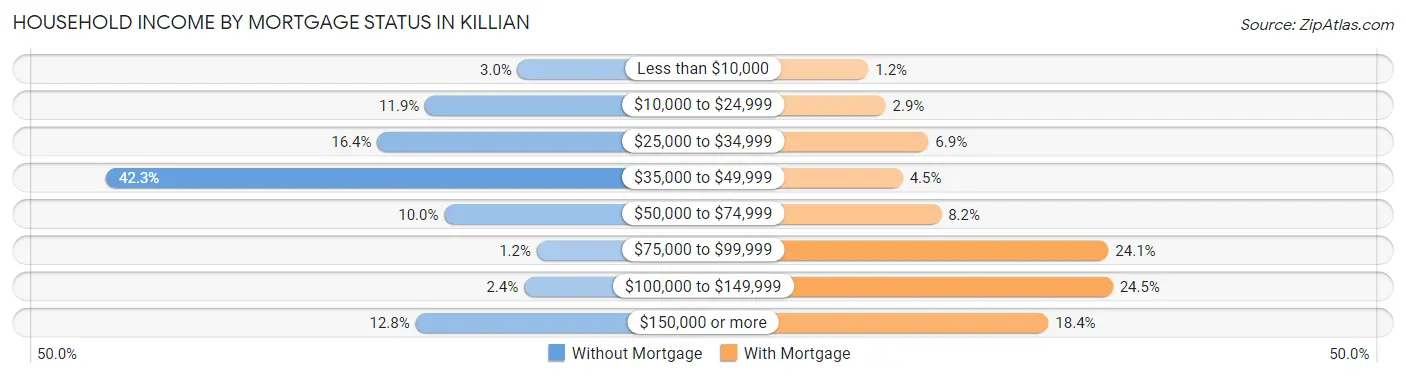
| Household Income | Without Mortgage | With Mortgage |
| Less than $10,000 | 10 (3.0%) | 3 (1.2%) |
| $10,000 to $24,999 | 39 (11.8%) | 7 (2.9%) |
| $25,000 to $34,999 | 54 (16.4%) | 17 (6.9%) |
| $35,000 to $49,999 | 139 (42.2%) | 11 (4.5%) |
| $50,000 to $74,999 | 33 (10.0%) | 20 (8.2%) |
| $75,000 to $99,999 | 4 (1.2%) | 59 (24.1%) |
| $100,000 to $149,999 | 8 (2.4%) | 60 (24.5%) |
| $150,000 or more | 42 (12.8%) | 45 (18.4%) |
| Total | 329 (100.0%) | 245 (100.0%) |
Property Value to Household Income Ratio in Killian
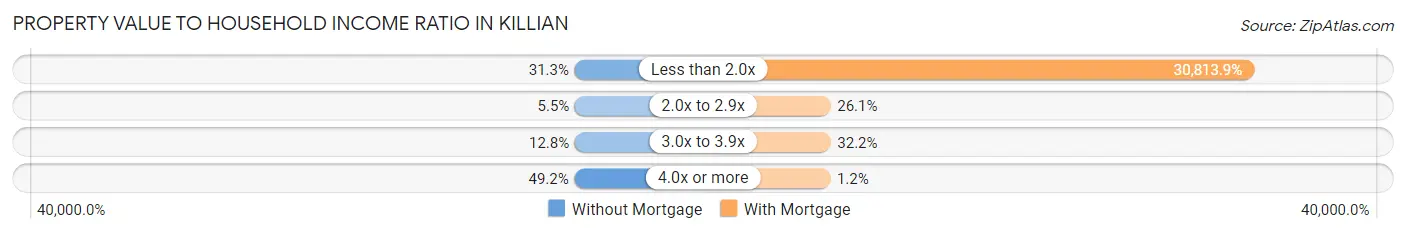
| Value-to-Income Ratio | Without Mortgage | With Mortgage |
| Less than 2.0x | 103 (31.3%) | 75,494 (30,813.9%) |
| 2.0x to 2.9x | 18 (5.5%) | 64 (26.1%) |
| 3.0x to 3.9x | 42 (12.8%) | 79 (32.2%) |
| 4.0x or more | 162 (49.2%) | 3 (1.2%) |
| Total | 329 (100.0%) | 245 (100.0%) |
Real Estate Taxes by Mortgage Status in Killian
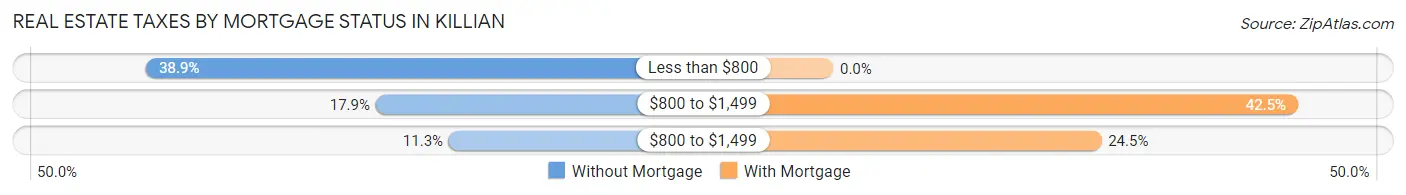
| Property Taxes | Without Mortgage | With Mortgage |
| Less than $800 | 128 (38.9%) | 0 (0.0%) |
| $800 to $1,499 | 59 (17.9%) | 104 (42.4%) |
| $800 to $1,499 | 37 (11.3%) | 60 (24.5%) |
| Total | 329 (100.0%) | 245 (100.0%) |
Health & Disability in Killian
Health Insurance Coverage by Age in Killian
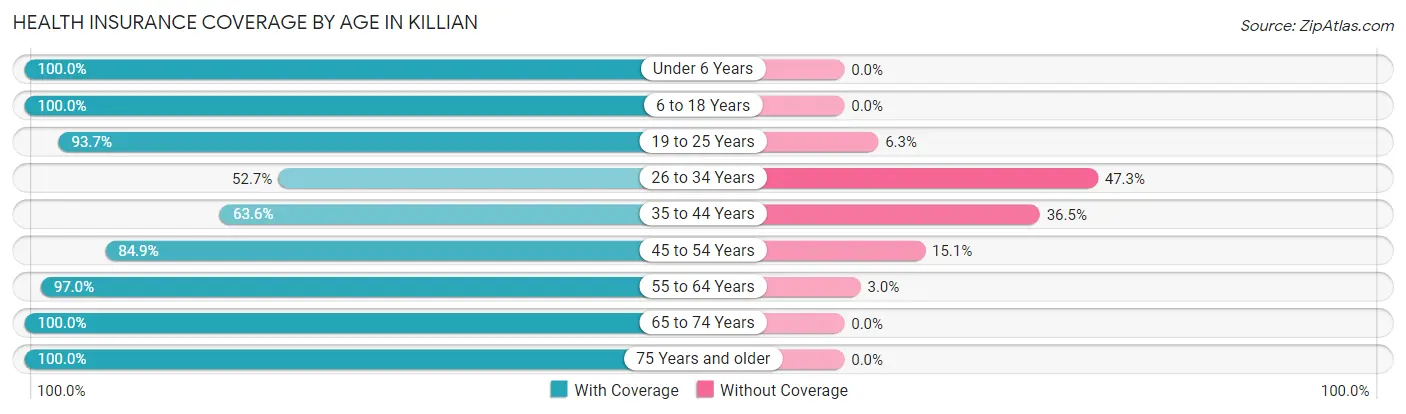
| Age Bracket | With Coverage | Without Coverage |
| Under 6 Years | 38 (100.0%) | 0 (0.0%) |
| 6 to 18 Years | 211 (100.0%) | 0 (0.0%) |
| 19 to 25 Years | 74 (93.7%) | 5 (6.3%) |
| 26 to 34 Years | 87 (52.7%) | 78 (47.3%) |
| 35 to 44 Years | 68 (63.5%) | 39 (36.4%) |
| 45 to 54 Years | 141 (84.9%) | 25 (15.1%) |
| 55 to 64 Years | 256 (97.0%) | 8 (3.0%) |
| 65 to 74 Years | 188 (100.0%) | 0 (0.0%) |
| 75 Years and older | 127 (100.0%) | 0 (0.0%) |
| Total | 1,190 (88.5%) | 155 (11.5%) |
Health Insurance Coverage by Citizenship Status in Killian
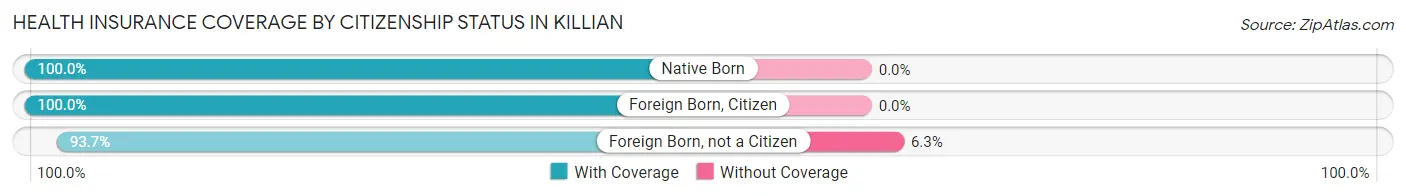
| Citizenship Status | With Coverage | Without Coverage |
| Native Born | 38 (100.0%) | 0 (0.0%) |
| Foreign Born, Citizen | 211 (100.0%) | 0 (0.0%) |
| Foreign Born, not a Citizen | 74 (93.7%) | 5 (6.3%) |
Health Insurance Coverage by Household Income in Killian
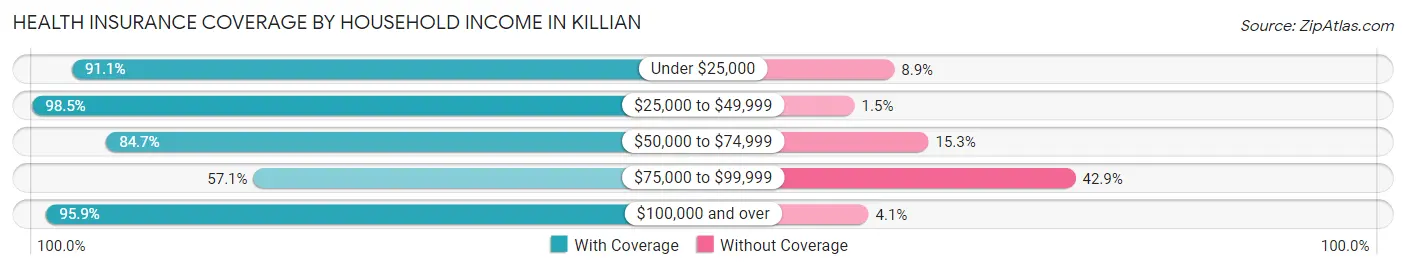
| Household Income | With Coverage | Without Coverage |
| Under $25,000 | 225 (91.1%) | 22 (8.9%) |
| $25,000 to $49,999 | 334 (98.5%) | 5 (1.5%) |
| $50,000 to $74,999 | 199 (84.7%) | 36 (15.3%) |
| $75,000 to $99,999 | 104 (57.1%) | 78 (42.9%) |
| $100,000 and over | 328 (95.9%) | 14 (4.1%) |
Public vs Private Health Insurance Coverage by Age in Killian
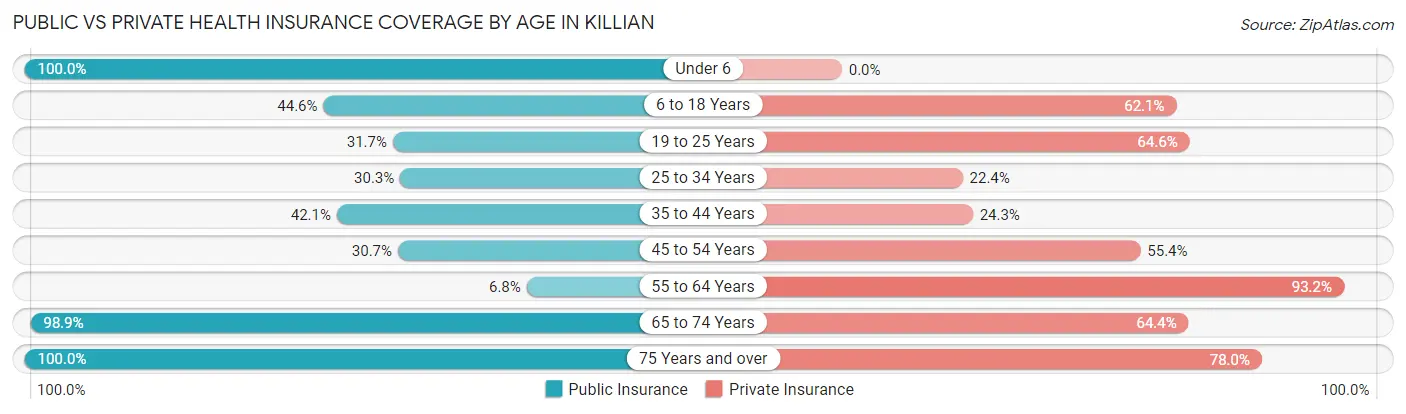
| Age Bracket | Public Insurance | Private Insurance |
| Under 6 | 38 (100.0%) | 0 (0.0%) |
| 6 to 18 Years | 94 (44.6%) | 131 (62.1%) |
| 19 to 25 Years | 25 (31.7%) | 51 (64.6%) |
| 25 to 34 Years | 50 (30.3%) | 37 (22.4%) |
| 35 to 44 Years | 45 (42.1%) | 26 (24.3%) |
| 45 to 54 Years | 51 (30.7%) | 92 (55.4%) |
| 55 to 64 Years | 18 (6.8%) | 246 (93.2%) |
| 65 to 74 Years | 186 (98.9%) | 121 (64.4%) |
| 75 Years and over | 127 (100.0%) | 99 (77.9%) |
| Total | 634 (47.1%) | 803 (59.7%) |
Disability Status by Sex by Age in Killian
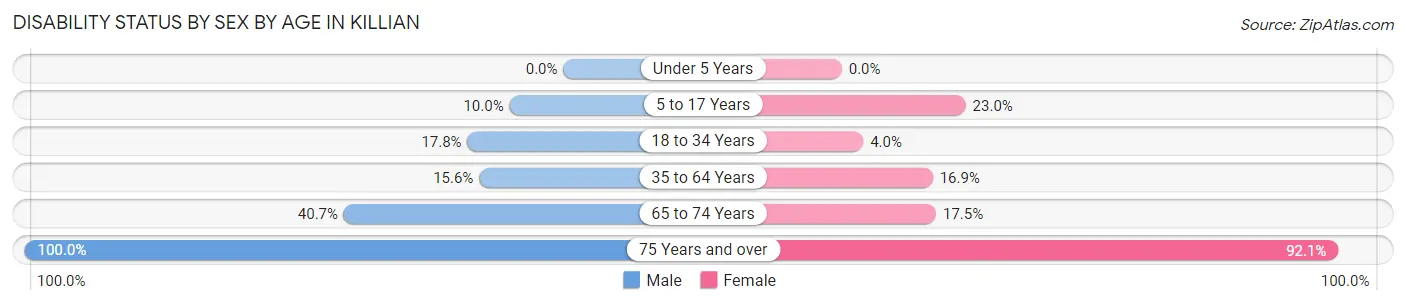
| Age Bracket | Male | Female |
| Under 5 Years | 0 (0.0%) | 0 (0.0%) |
| 5 to 17 Years | 4 (10.0%) | 40 (23.0%) |
| 18 to 34 Years | 21 (17.8%) | 5 (4.0%) |
| 35 to 64 Years | 45 (15.6%) | 42 (16.9%) |
| 65 to 74 Years | 44 (40.7%) | 14 (17.5%) |
| 75 Years and over | 38 (100.0%) | 82 (92.1%) |
Disability Class by Sex by Age in Killian
Disability Class: Hearing Difficulty
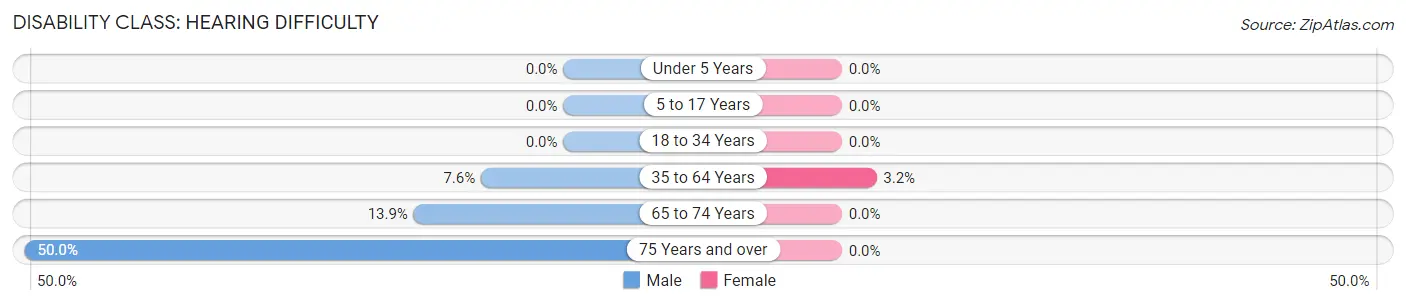
| Age Bracket | Male | Female |
| Under 5 Years | 0 (0.0%) | 0 (0.0%) |
| 5 to 17 Years | 0 (0.0%) | 0 (0.0%) |
| 18 to 34 Years | 0 (0.0%) | 0 (0.0%) |
| 35 to 64 Years | 22 (7.6%) | 8 (3.2%) |
| 65 to 74 Years | 15 (13.9%) | 0 (0.0%) |
| 75 Years and over | 19 (50.0%) | 0 (0.0%) |
Disability Class: Vision Difficulty
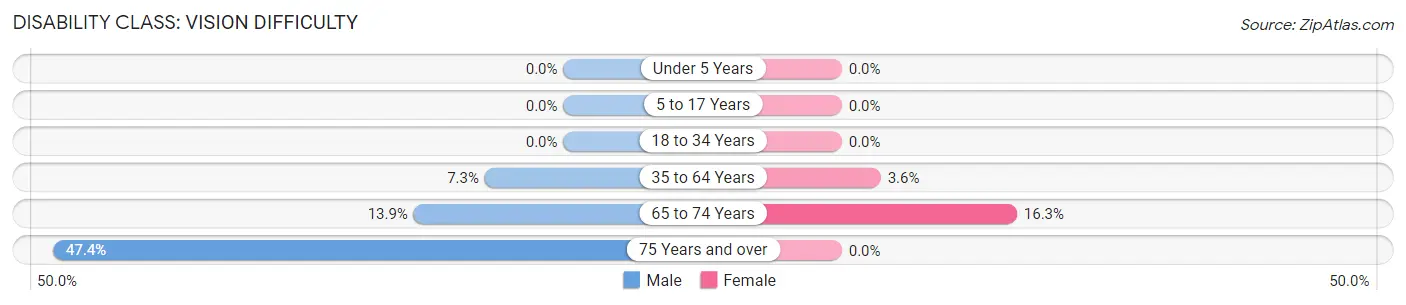
| Age Bracket | Male | Female |
| Under 5 Years | 0 (0.0%) | 0 (0.0%) |
| 5 to 17 Years | 0 (0.0%) | 0 (0.0%) |
| 18 to 34 Years | 0 (0.0%) | 0 (0.0%) |
| 35 to 64 Years | 21 (7.3%) | 9 (3.6%) |
| 65 to 74 Years | 15 (13.9%) | 13 (16.3%) |
| 75 Years and over | 18 (47.4%) | 0 (0.0%) |
Disability Class: Cognitive Difficulty
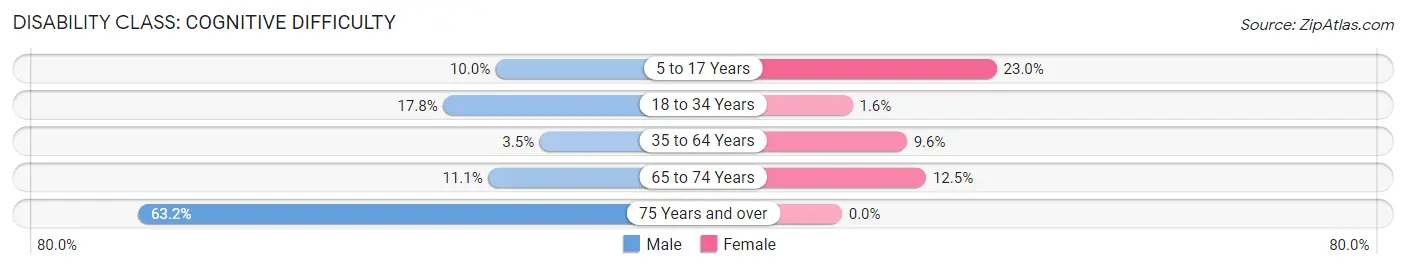
| Age Bracket | Male | Female |
| 5 to 17 Years | 4 (10.0%) | 40 (23.0%) |
| 18 to 34 Years | 21 (17.8%) | 2 (1.6%) |
| 35 to 64 Years | 10 (3.5%) | 24 (9.6%) |
| 65 to 74 Years | 12 (11.1%) | 10 (12.5%) |
| 75 Years and over | 24 (63.2%) | 0 (0.0%) |
Disability Class: Ambulatory Difficulty
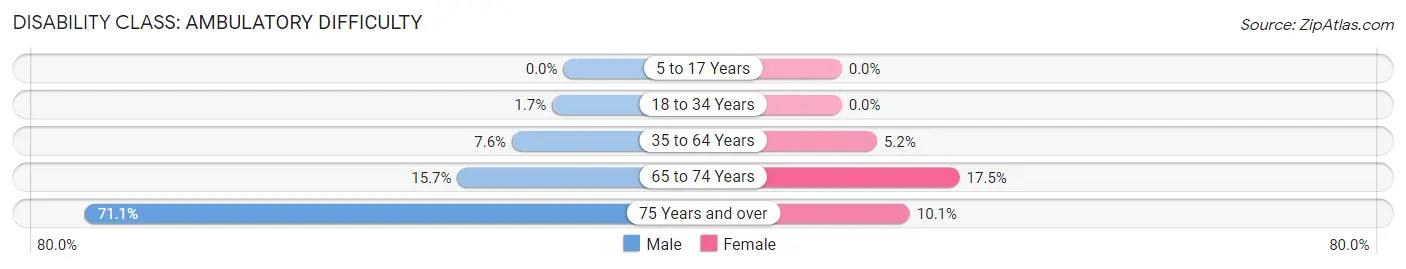
| Age Bracket | Male | Female |
| 5 to 17 Years | 0 (0.0%) | 0 (0.0%) |
| 18 to 34 Years | 2 (1.7%) | 0 (0.0%) |
| 35 to 64 Years | 22 (7.6%) | 13 (5.2%) |
| 65 to 74 Years | 17 (15.7%) | 14 (17.5%) |
| 75 Years and over | 27 (71.1%) | 9 (10.1%) |
Disability Class: Self-Care Difficulty
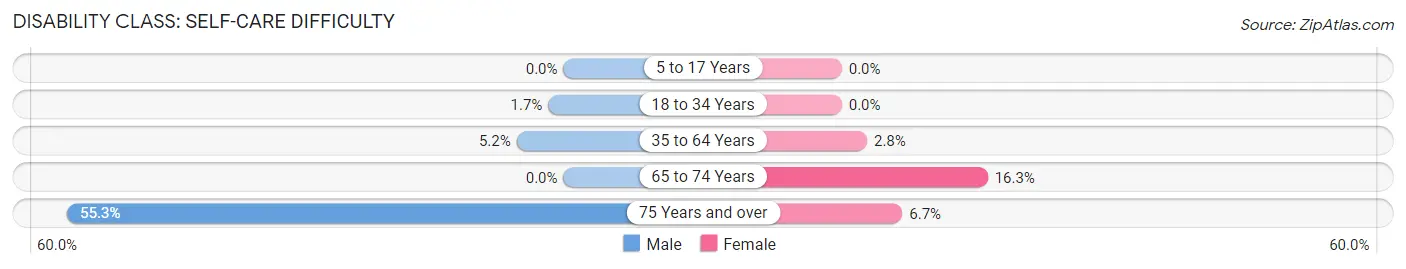
| Age Bracket | Male | Female |
| 5 to 17 Years | 0 (0.0%) | 0 (0.0%) |
| 18 to 34 Years | 2 (1.7%) | 0 (0.0%) |
| 35 to 64 Years | 15 (5.2%) | 7 (2.8%) |
| 65 to 74 Years | 0 (0.0%) | 13 (16.3%) |
| 75 Years and over | 21 (55.3%) | 6 (6.7%) |
Technology Access in Killian
Computing Device Access in Killian
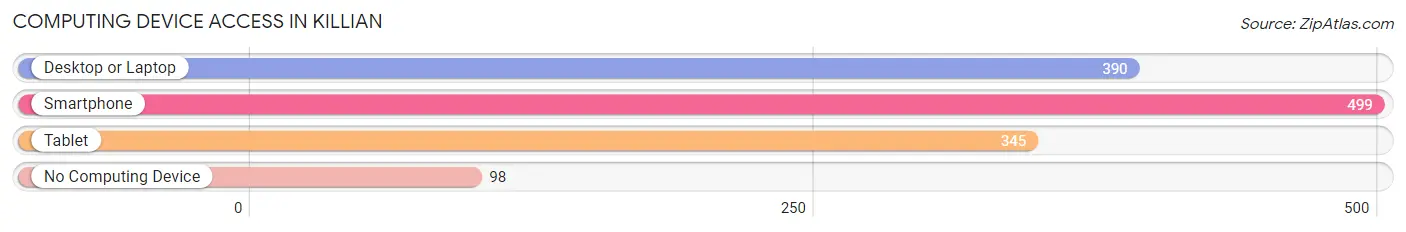
| Device Type | # Households | % Households |
| Desktop or Laptop | 390 | 63.5% |
| Smartphone | 499 | 81.3% |
| Tablet | 345 | 56.2% |
| No Computing Device | 98 | 16.0% |
| Total | 614 | 100.0% |
Internet Access in Killian
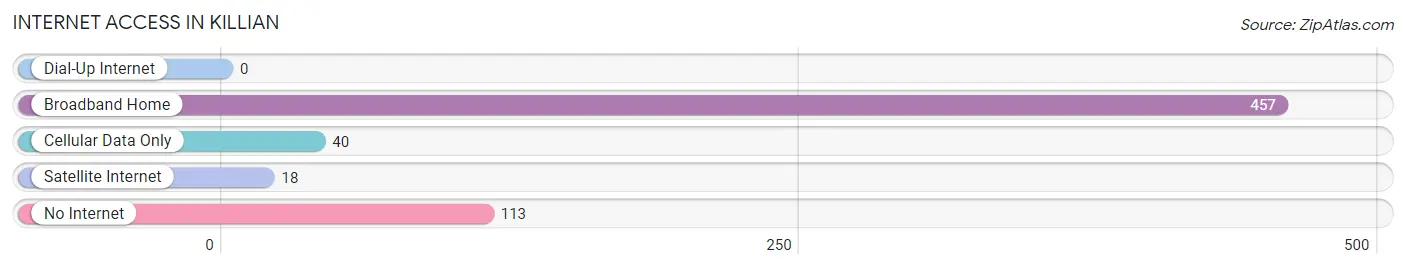
| Internet Type | # Households | % Households |
| Dial-Up Internet | 0 | 0.0% |
| Broadband Home | 457 | 74.4% |
| Cellular Data Only | 40 | 6.5% |
| Satellite Internet | 18 | 2.9% |
| No Internet | 113 | 18.4% |
| Total | 614 | 100.0% |
Killian Summary
Killian is a small town located in Livingston Parish, Louisiana. It is situated on the banks of the Amite River, about 25 miles east of Baton Rouge. The town has a population of approximately 1,500 people and is part of the Greater Baton Rouge Metropolitan Statistical Area.
History
The area that is now Killian was first settled in the early 1800s by French-speaking settlers from the nearby town of French Settlement. The town was originally known as “La Pointe” and was a small farming community. In 1845, the town was renamed “Killian” after a local landowner, John Killian.
In the late 1800s, the town began to grow and develop. The first post office was established in 1887 and the first school was built in 1895. The town was incorporated in 1902 and the first mayor was elected in 1903.
In the early 1900s, the town began to experience a period of growth and prosperity. The population increased from around 500 in 1900 to over 1,000 by 1910. The town was home to several businesses, including a sawmill, a cotton gin, a grist mill, and a brickyard.
In the 1920s, the town experienced a period of decline. The population decreased to around 800 by 1930. The Great Depression further impacted the town and the population decreased to around 500 by 1940.
Geography
Killian is located in Livingston Parish, Louisiana. It is situated on the banks of the Amite River, about 25 miles east of Baton Rouge. The town is located in a rural area and is surrounded by farmland and woodlands. The town is located at an elevation of approximately 30 feet above sea level.
The climate in Killian is humid subtropical, with hot, humid summers and mild winters. The average annual temperature is around 70 degrees Fahrenheit. The average annual precipitation is around 50 inches.
Economy
The economy of Killian is largely based on agriculture. The town is home to several farms, which produce a variety of crops, including corn, soybeans, and cotton. The town is also home to several small businesses, including a sawmill, a cotton gin, a grist mill, and a brickyard.
The town is also home to several manufacturing companies, including a furniture factory, a plastics factory, and a metal fabrication plant. The town is also home to several retail stores, including a grocery store, a hardware store, and a pharmacy.
Demographics
As of the 2010 census, the population of Killian was 1,500. The racial makeup of the town was 97.3% White, 0.7% African American, 0.3% Native American, 0.3% Asian, and 1.3% from other races. The median household income was $37,500 and the median family income was $45,000.
The town is home to several churches, including Baptist, Methodist, and Catholic. The town is also home to several schools, including a public elementary school, a public middle school, and a public high school. The town is served by the Livingston Parish Public Schools system.
Common Questions
What is Per Capita Income in Killian?
Per Capita income in Killian is $38,371.
What is the Median Family Income in Killian?
Median Family Income in Killian is $57,813.
What is the Median Household income in Killian?
Median Household Income in Killian is $49,359.
What is Income or Wage Gap in Killian?
Income or Wage Gap in Killian is 51.8%.
Women in Killian earn 48.2 cents for every dollar earned by a man.
What is Inequality or Gini Index in Killian?
Inequality or Gini Index in Killian is 0.50.
What is the Total Population of Killian?
Total Population of Killian is 1,345.
What is the Total Male Population of Killian?
Total Male Population of Killian is 627.
What is the Total Female Population of Killian?
Total Female Population of Killian is 718.
What is the Ratio of Males per 100 Females in Killian?
There are 87.33 Males per 100 Females in Killian.
What is the Ratio of Females per 100 Males in Killian?
There are 114.51 Females per 100 Males in Killian.
What is the Median Population Age in Killian?
Median Population Age in Killian is 50.7 Years.
What is the Average Family Size in Killian
Average Family Size in Killian is 2.5 People.
What is the Average Household Size in Killian
Average Household Size in Killian is 2.2 People.
How Large is the Labor Force in Killian?
There are 502 People in the Labor Forcein in Killian.
What is the Percentage of People in the Labor Force in Killian?
44.2% of People are in the Labor Force in Killian.
What is the Unemployment Rate in Killian?
Unemployment Rate in Killian is 4.0%.