Zip Codes with the Highest Percentage of Population Employed in Security & Protection in Kansas
RELATED REPORTS & OPTIONS
Security & Protection
Kansas
Compare Zip Codes
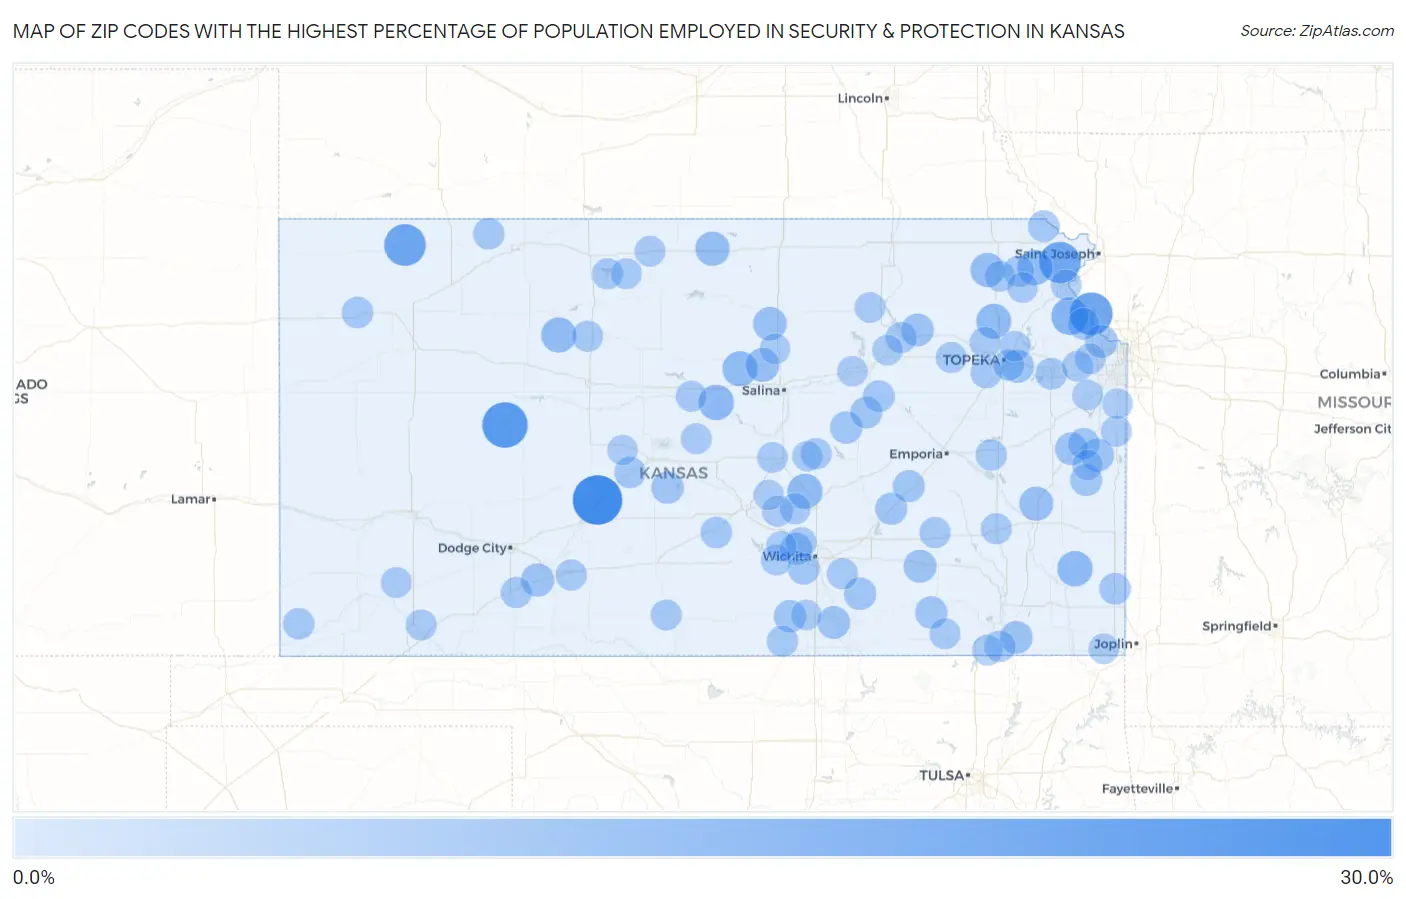
Map of Zip Codes with the Highest Percentage of Population Employed in Security & Protection in Kansas
0.0%
30.0%
Zip Codes with the Highest Percentage of Population Employed in Security & Protection in Kansas
| Zip Code | % Employed | vs State | vs National | |
| 1. | 67529 | 28.3% | 1.8%(+26.5)#1 | 2.1%(+26.1)#108 |
| 2. | 67515 | 22.9% | 1.8%(+21.1)#2 | 2.1%(+20.7)#151 |
| 3. | 66027 | 19.2% | 1.8%(+17.5)#3 | 2.1%(+17.1)#214 |
| 4. | 67744 | 18.0% | 1.8%(+16.2)#4 | 2.1%(+15.8)#253 |
| 5. | 66008 | 17.4% | 1.8%(+15.6)#5 | 2.1%(+15.2)#275 |
| 6. | 66020 | 12.3% | 1.8%(+10.5)#6 | 2.1%(+10.1)#528 |
| 7. | 67439 | 9.7% | 1.8%(+7.91)#7 | 2.1%(+7.53)#806 |
| 8. | 66780 | 9.6% | 1.8%(+7.87)#8 | 2.1%(+7.50)#810 |
| 9. | 67657 | 9.4% | 1.8%(+7.66)#9 | 2.1%(+7.29)#850 |
| 10. | 66424 | 9.4% | 1.8%(+7.64)#10 | 2.1%(+7.27)#853 |
| 11. | 66509 | 9.2% | 1.8%(+7.42)#11 | 2.1%(+7.05)#880 |
| 12. | 67062 | 9.2% | 1.8%(+7.38)#12 | 2.1%(+7.01)#883 |
| 13. | 67423 | 9.1% | 1.8%(+7.37)#13 | 2.1%(+6.99)#886 |
| 14. | 66956 | 8.2% | 1.8%(+6.43)#14 | 2.1%(+6.06)#1,094 |
| 15. | 66550 | 8.0% | 1.8%(+6.27)#15 | 2.1%(+5.90)#1,149 |
| 16. | 66015 | 7.9% | 1.8%(+6.12)#16 | 2.1%(+5.75)#1,202 |
| 17. | 67484 | 7.6% | 1.8%(+5.85)#17 | 2.1%(+5.47)#1,288 |
| 18. | 67436 | 7.4% | 1.8%(+5.63)#18 | 2.1%(+5.26)#1,361 |
| 19. | 67842 | 6.9% | 1.8%(+5.15)#19 | 2.1%(+4.77)#1,568 |
| 20. | 66026 | 6.8% | 1.8%(+4.99)#20 | 2.1%(+4.61)#1,651 |
| 21. | 66542 | 6.7% | 1.8%(+4.95)#21 | 2.1%(+4.58)#1,673 |
| 22. | 67122 | 6.5% | 1.8%(+4.70)#22 | 2.1%(+4.32)#1,799 |
| 23. | 67351 | 6.5% | 1.8%(+4.69)#23 | 2.1%(+4.32)#1,800 |
| 24. | 67119 | 6.3% | 1.8%(+4.55)#24 | 2.1%(+4.18)#1,886 |
| 25. | 66109 | 6.3% | 1.8%(+4.48)#25 | 2.1%(+4.11)#1,917 |
| 26. | 66535 | 6.2% | 1.8%(+4.46)#26 | 2.1%(+4.09)#1,929 |
| 27. | 66042 | 6.1% | 1.8%(+4.31)#27 | 2.1%(+3.94)#2,022 |
| 28. | 67545 | 5.9% | 1.8%(+4.17)#28 | 2.1%(+3.79)#2,119 |
| 29. | 67131 | 5.9% | 1.8%(+4.11)#29 | 2.1%(+3.73)#2,157 |
| 30. | 67103 | 5.9% | 1.8%(+4.11)#30 | 2.1%(+3.73)#2,159 |
| 31. | 67475 | 5.8% | 1.8%(+4.02)#31 | 2.1%(+3.65)#2,206 |
| 32. | 67353 | 5.8% | 1.8%(+3.99)#32 | 2.1%(+3.62)#2,238 |
| 33. | 66842 | 5.6% | 1.8%(+3.86)#33 | 2.1%(+3.49)#2,343 |
| 34. | 67223 | 5.4% | 1.8%(+3.67)#34 | 2.1%(+3.30)#2,494 |
| 35. | 66862 | 5.4% | 1.8%(+3.63)#35 | 2.1%(+3.26)#2,535 |
| 36. | 66014 | 5.3% | 1.8%(+3.57)#36 | 2.1%(+3.20)#2,587 |
| 37. | 67449 | 5.2% | 1.8%(+3.46)#37 | 2.1%(+3.09)#2,682 |
| 38. | 66045 | 5.0% | 1.8%(+3.25)#38 | 2.1%(+2.88)#2,891 |
| 39. | 66048 | 5.0% | 1.8%(+3.24)#39 | 2.1%(+2.87)#2,904 |
| 40. | 67215 | 5.0% | 1.8%(+3.24)#40 | 2.1%(+2.86)#2,915 |
| 41. | 66763 | 4.9% | 1.8%(+3.11)#41 | 2.1%(+2.73)#3,070 |
| 42. | 66872 | 4.9% | 1.8%(+3.09)#42 | 2.1%(+2.72)#3,091 |
| 43. | 66064 | 4.8% | 1.8%(+3.07)#43 | 2.1%(+2.70)#3,114 |
| 44. | 66094 | 4.8% | 1.8%(+3.06)#44 | 2.1%(+2.69)#3,124 |
| 45. | 67732 | 4.8% | 1.8%(+3.00)#45 | 2.1%(+2.63)#3,195 |
| 46. | 66610 | 4.7% | 1.8%(+2.97)#46 | 2.1%(+2.59)#3,248 |
| 47. | 67514 | 4.7% | 1.8%(+2.94)#47 | 2.1%(+2.57)#3,282 |
| 48. | 67567 | 4.7% | 1.8%(+2.93)#48 | 2.1%(+2.56)#3,297 |
| 49. | 67953 | 4.7% | 1.8%(+2.88)#49 | 2.1%(+2.50)#3,369 |
| 50. | 67653 | 4.6% | 1.8%(+2.80)#50 | 2.1%(+2.43)#3,485 |
| 51. | 67340 | 4.5% | 1.8%(+2.77)#51 | 2.1%(+2.40)#3,531 |
| 52. | 67109 | 4.4% | 1.8%(+2.63)#52 | 2.1%(+2.26)#3,765 |
| 53. | 67022 | 4.4% | 1.8%(+2.60)#53 | 2.1%(+2.23)#3,817 |
| 54. | 67045 | 4.4% | 1.8%(+2.59)#54 | 2.1%(+2.21)#3,841 |
| 55. | 66856 | 4.3% | 1.8%(+2.53)#55 | 2.1%(+2.15)#3,945 |
| 56. | 67133 | 4.3% | 1.8%(+2.50)#56 | 2.1%(+2.13)#3,985 |
| 57. | 66506 | 4.2% | 1.8%(+2.45)#57 | 2.1%(+2.08)#4,076 |
| 58. | 67073 | 4.2% | 1.8%(+2.42)#58 | 2.1%(+2.04)#4,134 |
| 59. | 67663 | 4.2% | 1.8%(+2.40)#59 | 2.1%(+2.03)#4,172 |
| 60. | 67865 | 4.1% | 1.8%(+2.36)#60 | 2.1%(+1.99)#4,235 |
| 61. | 67104 | 4.1% | 1.8%(+2.33)#61 | 2.1%(+1.96)#4,281 |
| 62. | 66783 | 4.1% | 1.8%(+2.32)#62 | 2.1%(+1.95)#4,300 |
| 63. | 66605 | 4.1% | 1.8%(+2.32)#63 | 2.1%(+1.95)#4,304 |
| 64. | 66439 | 4.1% | 1.8%(+2.30)#64 | 2.1%(+1.92)#4,356 |
| 65. | 66526 | 4.1% | 1.8%(+2.28)#65 | 2.1%(+1.91)#4,387 |
| 66. | 67644 | 4.1% | 1.8%(+2.28)#66 | 2.1%(+1.91)#4,388 |
| 67. | 66539 | 4.0% | 1.8%(+2.26)#67 | 2.1%(+1.88)#4,428 |
| 68. | 67870 | 4.0% | 1.8%(+2.25)#68 | 2.1%(+1.87)#4,448 |
| 69. | 67020 | 4.0% | 1.8%(+2.24)#69 | 2.1%(+1.86)#4,466 |
| 70. | 67859 | 4.0% | 1.8%(+2.23)#70 | 2.1%(+1.86)#4,471 |
| 71. | 67056 | 4.0% | 1.8%(+2.22)#71 | 2.1%(+1.85)#4,509 |
| 72. | 67427 | 4.0% | 1.8%(+2.19)#72 | 2.1%(+1.82)#4,557 |
| 73. | 67490 | 4.0% | 1.8%(+2.18)#73 | 2.1%(+1.80)#4,589 |
| 74. | 67364 | 3.9% | 1.8%(+2.17)#74 | 2.1%(+1.80)#4,595 |
| 75. | 66002 | 3.9% | 1.8%(+2.16)#75 | 2.1%(+1.78)#4,622 |
| 76. | 67361 | 3.9% | 1.8%(+2.14)#76 | 2.1%(+1.76)#4,669 |
| 77. | 67628 | 3.9% | 1.8%(+2.12)#77 | 2.1%(+1.75)#4,698 |
| 78. | 66052 | 3.9% | 1.8%(+2.11)#78 | 2.1%(+1.74)#4,708 |
| 79. | 66967 | 3.8% | 1.8%(+2.07)#79 | 2.1%(+1.69)#4,823 |
| 80. | 67050 | 3.8% | 1.8%(+2.06)#80 | 2.1%(+1.69)#4,832 |
| 81. | 66053 | 3.8% | 1.8%(+2.00)#81 | 2.1%(+1.63)#4,953 |
| 82. | 66516 | 3.8% | 1.8%(+1.99)#82 | 2.1%(+1.62)#4,998 |
| 83. | 66030 | 3.7% | 1.8%(+1.91)#83 | 2.1%(+1.54)#5,189 |
| 84. | 66012 | 3.7% | 1.8%(+1.90)#84 | 2.1%(+1.52)#5,212 |
| 85. | 67460 | 3.7% | 1.8%(+1.89)#85 | 2.1%(+1.51)#5,237 |
| 86. | 66449 | 3.6% | 1.8%(+1.84)#86 | 2.1%(+1.47)#5,360 |
| 87. | 66058 | 3.6% | 1.8%(+1.83)#87 | 2.1%(+1.46)#5,390 |
| 88. | 67101 | 3.6% | 1.8%(+1.79)#88 | 2.1%(+1.42)#5,493 |
| 89. | 66517 | 3.6% | 1.8%(+1.79)#89 | 2.1%(+1.42)#5,497 |
| 90. | 66617 | 3.5% | 1.8%(+1.77)#90 | 2.1%(+1.40)#5,548 |
| 91. | 67001 | 3.5% | 1.8%(+1.71)#91 | 2.1%(+1.33)#5,714 |
| 92. | 66013 | 3.5% | 1.8%(+1.70)#92 | 2.1%(+1.33)#5,724 |
| 93. | 66713 | 3.4% | 1.8%(+1.64)#93 | 2.1%(+1.26)#5,894 |
| 94. | 67431 | 3.4% | 1.8%(+1.63)#94 | 2.1%(+1.26)#5,911 |
| 95. | 66072 | 3.4% | 1.8%(+1.63)#95 | 2.1%(+1.26)#5,917 |
| 96. | 67428 | 3.4% | 1.8%(+1.59)#96 | 2.1%(+1.22)#6,027 |
| 97. | 67152 | 3.3% | 1.8%(+1.57)#97 | 2.1%(+1.20)#6,095 |
| 98. | 67467 | 3.3% | 1.8%(+1.56)#98 | 2.1%(+1.19)#6,130 |
| 99. | 67522 | 3.3% | 1.8%(+1.54)#99 | 2.1%(+1.17)#6,193 |
| 100. | 67511 | 3.3% | 1.8%(+1.50)#100 | 2.1%(+1.13)#6,316 |
Common Questions
What are the Top 10 Zip Codes with the Highest Percentage of Population Employed in Security & Protection in Kansas?
Top 10 Zip Codes with the Highest Percentage of Population Employed in Security & Protection in Kansas are:
What zip code has the Highest Percentage of Population Employed in Security & Protection in Kansas?
67529 has the Highest Percentage of Population Employed in Security & Protection in Kansas with 28.3%.
What is the Percentage of Population Employed in Security & Protection in the State of Kansas?
Percentage of Population Employed in Security & Protection in Kansas is 1.8%.
What is the Percentage of Population Employed in Security & Protection in the United States?
Percentage of Population Employed in Security & Protection in the United States is 2.1%.