Zip Codes with the Highest Percentage of Population Employed in Security & Protection in Lenexa, KS
RELATED REPORTS & OPTIONS
Security & Protection
Lenexa
Compare Zip Codes
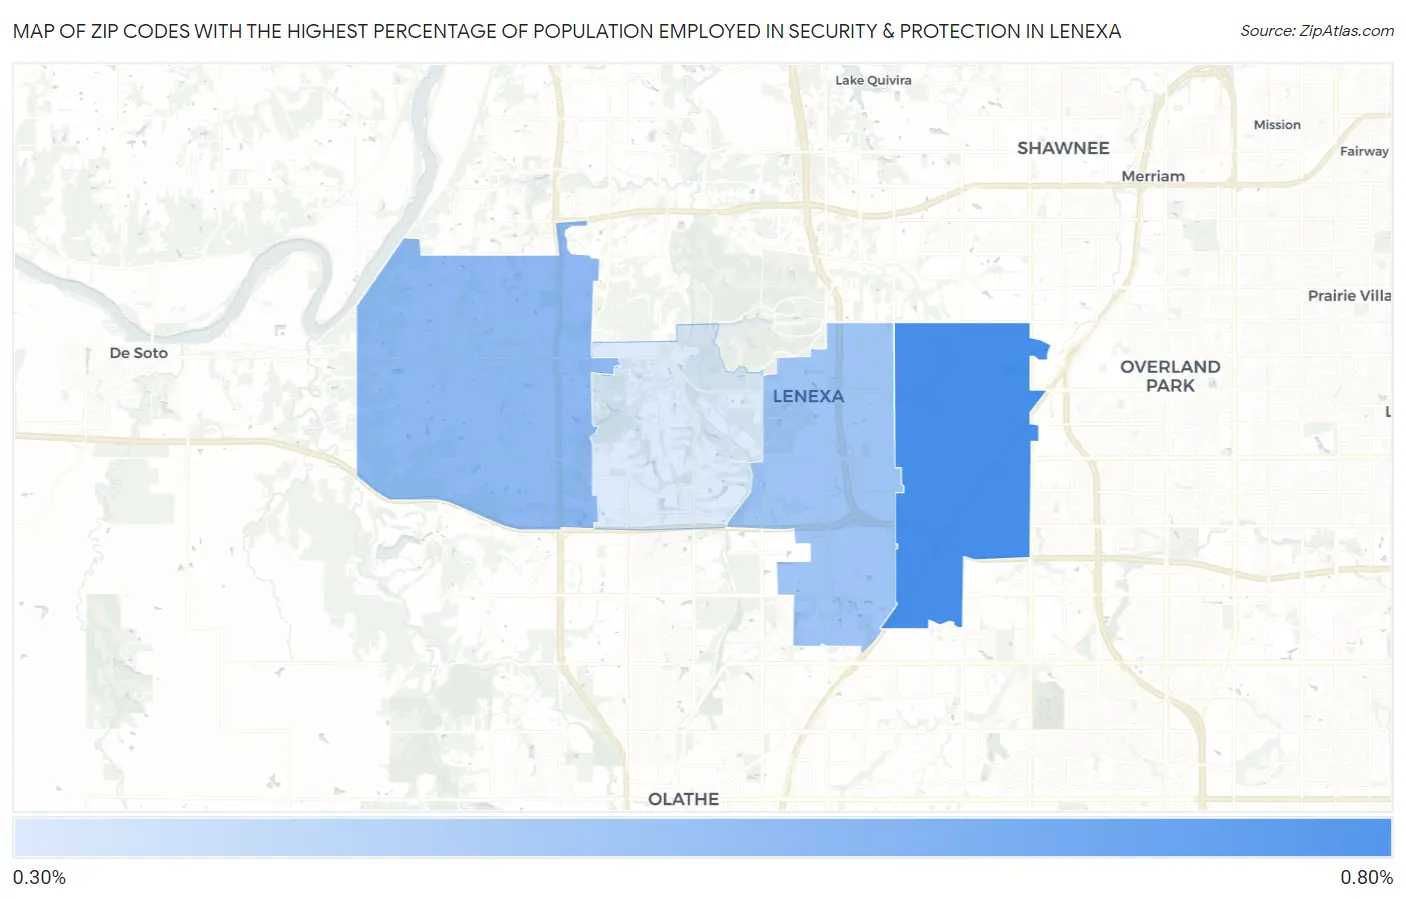
Map of Zip Codes with the Highest Percentage of Population Employed in Security & Protection in Lenexa
0.33%
0.74%
Zip Codes with the Highest Percentage of Population Employed in Security & Protection in Lenexa, KS
| Zip Code | % Employed | vs State | vs National | |
| 1. | 66215 | 0.74% | 1.8%(-1.03)#389 | 2.1%(-1.41)#21,789 |
| 2. | 66227 | 0.55% | 1.8%(-1.22)#414 | 2.1%(-1.60)#22,966 |
| 3. | 66219 | 0.50% | 1.8%(-1.28)#424 | 2.1%(-1.65)#23,238 |
| 4. | 66220 | 0.33% | 1.8%(-1.45)#444 | 2.1%(-1.82)#24,056 |
1
Common Questions
What are the Top 3 Zip Codes with the Highest Percentage of Population Employed in Security & Protection in Lenexa, KS?
Top 3 Zip Codes with the Highest Percentage of Population Employed in Security & Protection in Lenexa, KS are:
What zip code has the Highest Percentage of Population Employed in Security & Protection in Lenexa, KS?
66215 has the Highest Percentage of Population Employed in Security & Protection in Lenexa, KS with 0.74%.
What is the Percentage of Population Employed in Security & Protection in Lenexa, KS?
Percentage of Population Employed in Security & Protection in Lenexa is 0.65%.
What is the Percentage of Population Employed in Security & Protection in Kansas?
Percentage of Population Employed in Security & Protection in Kansas is 1.8%.
What is the Percentage of Population Employed in Security & Protection in the United States?
Percentage of Population Employed in Security & Protection in the United States is 2.1%.