Zip Codes with the Highest Percentage of Population Employed in Security & Protection in Overland Park, KS
RELATED REPORTS & OPTIONS
Security & Protection
Overland Park
Compare Zip Codes
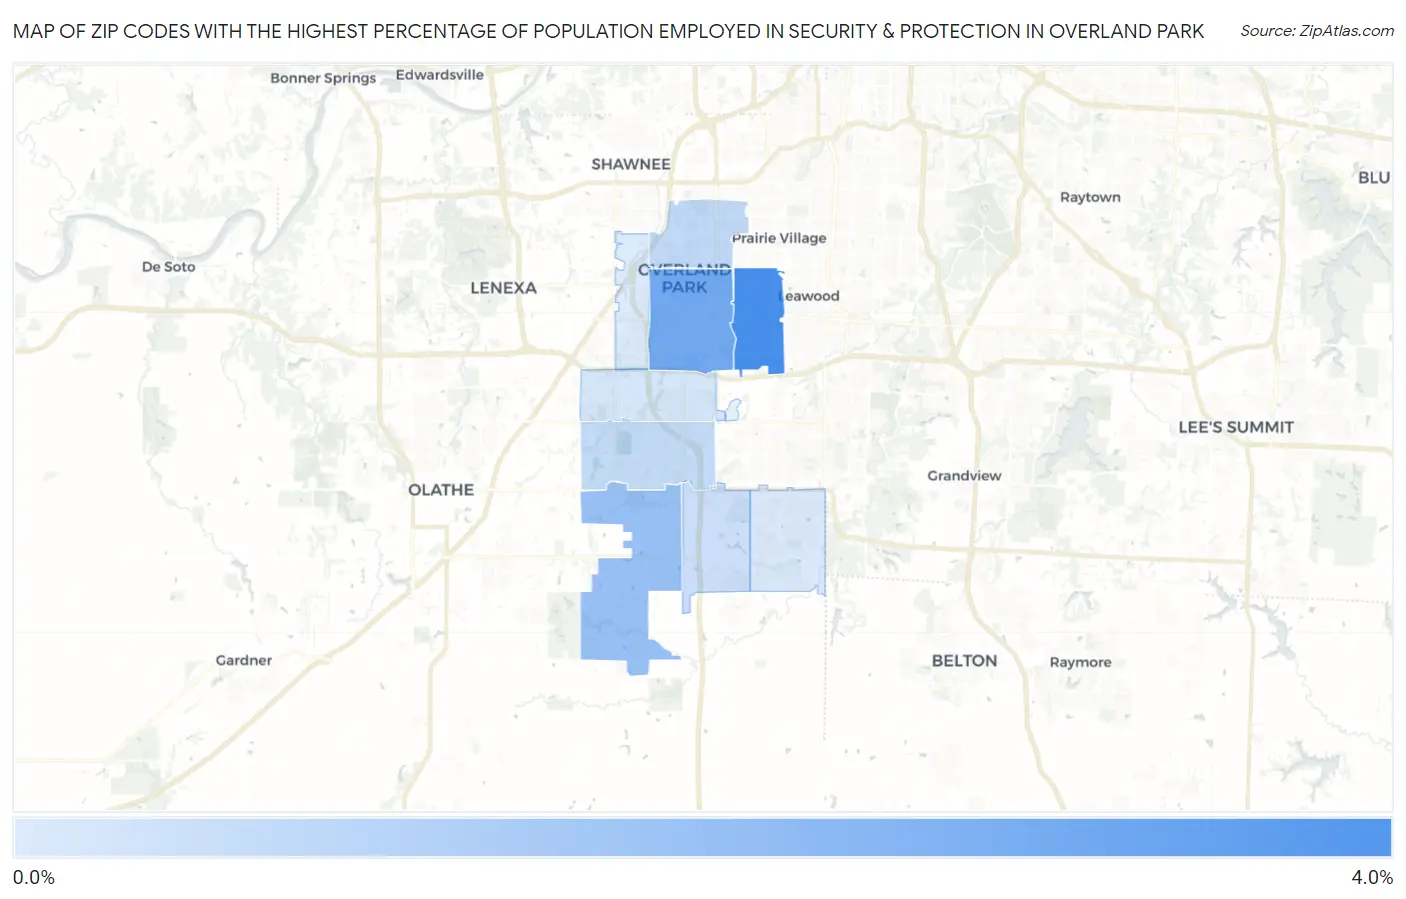
Map of Zip Codes with the Highest Percentage of Population Employed in Security & Protection in Overland Park
0.19%
3.2%
Zip Codes with the Highest Percentage of Population Employed in Security & Protection in Overland Park, KS
| Zip Code | % Employed | vs State | vs National | |
| 1. | 66207 | 3.2% | 1.8%(+1.45)#105 | 2.1%(+1.08)#6,486 |
| 2. | 66212 | 2.3% | 1.8%(+0.564)#162 | 2.1%(+0.190)#10,405 |
| 3. | 66221 | 1.6% | 1.8%(-0.189)#255 | 2.1%(-0.562)#15,518 |
| 4. | 66204 | 0.75% | 1.8%(-1.02)#385 | 2.1%(-1.40)#21,708 |
| 5. | 66213 | 0.71% | 1.8%(-1.07)#395 | 2.1%(-1.44)#22,015 |
| 6. | 66223 | 0.54% | 1.8%(-1.24)#418 | 2.1%(-1.61)#23,032 |
| 7. | 66210 | 0.32% | 1.8%(-1.45)#445 | 2.1%(-1.83)#24,089 |
| 8. | 66224 | 0.24% | 1.8%(-1.54)#454 | 2.1%(-1.91)#24,408 |
| 9. | 66214 | 0.19% | 1.8%(-1.59)#456 | 2.1%(-1.96)#24,558 |
1
Common Questions
What are the Top 5 Zip Codes with the Highest Percentage of Population Employed in Security & Protection in Overland Park, KS?
Top 5 Zip Codes with the Highest Percentage of Population Employed in Security & Protection in Overland Park, KS are:
What zip code has the Highest Percentage of Population Employed in Security & Protection in Overland Park, KS?
66207 has the Highest Percentage of Population Employed in Security & Protection in Overland Park, KS with 3.2%.
What is the Percentage of Population Employed in Security & Protection in Overland Park, KS?
Percentage of Population Employed in Security & Protection in Overland Park is 1.2%.
What is the Percentage of Population Employed in Security & Protection in Kansas?
Percentage of Population Employed in Security & Protection in Kansas is 1.8%.
What is the Percentage of Population Employed in Security & Protection in the United States?
Percentage of Population Employed in Security & Protection in the United States is 2.1%.