Earlton, KS Map & Demographics
Earlton Map
Earlton Overview
$23,308
PER CAPITA INCOME
$71,696
AVG FAMILY INCOME
$71,429
AVG HOUSEHOLD INCOME
0.28
INEQUALITY / GINI INDEX
124
TOTAL POPULATION
46
MALE POPULATION
78
FEMALE POPULATION
58.97
MALES / 100 FEMALES
169.57
FEMALES / 100 MALES
35.5
MEDIAN AGE
3.4
AVG FAMILY SIZE
3.3
AVG HOUSEHOLD SIZE
46
LABOR FORCE [ PEOPLE ]
50.0%
PERCENT IN LABOR FORCE
Income in Earlton
Income Overview in Earlton
Per Capita Income in Earlton is $23,308, while median incomes of families and households are $71,696 and $71,429 respectively.
| Characteristic | Number | Measure |
| Per Capita Income | 124 | $23,308 |
| Median Family Income | 35 | $71,696 |
| Mean Family Income | 35 | $80,060 |
| Median Household Income | 38 | $71,429 |
| Mean Household Income | 38 | $76,361 |
| Income Deficit | 35 | $0 |
| Wage / Income Gap (%) | 124 | 0.00% |
| Wage / Income Gap ($) | 124 | 100.00¢ per $1 |
| Gini / Inequality Index | 124 | 0.28 |
Earnings by Sex in Earlton
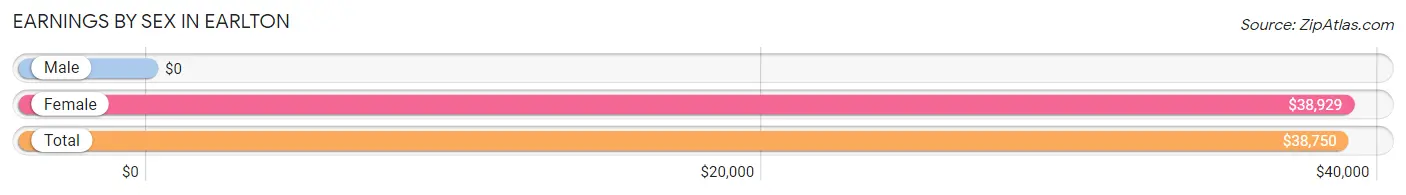
| Sex | Number | Average Earnings |
| Male | 16 (34.8%) | $0 |
| Female | 30 (65.2%) | $38,929 |
| Total | 46 (100.0%) | $38,750 |
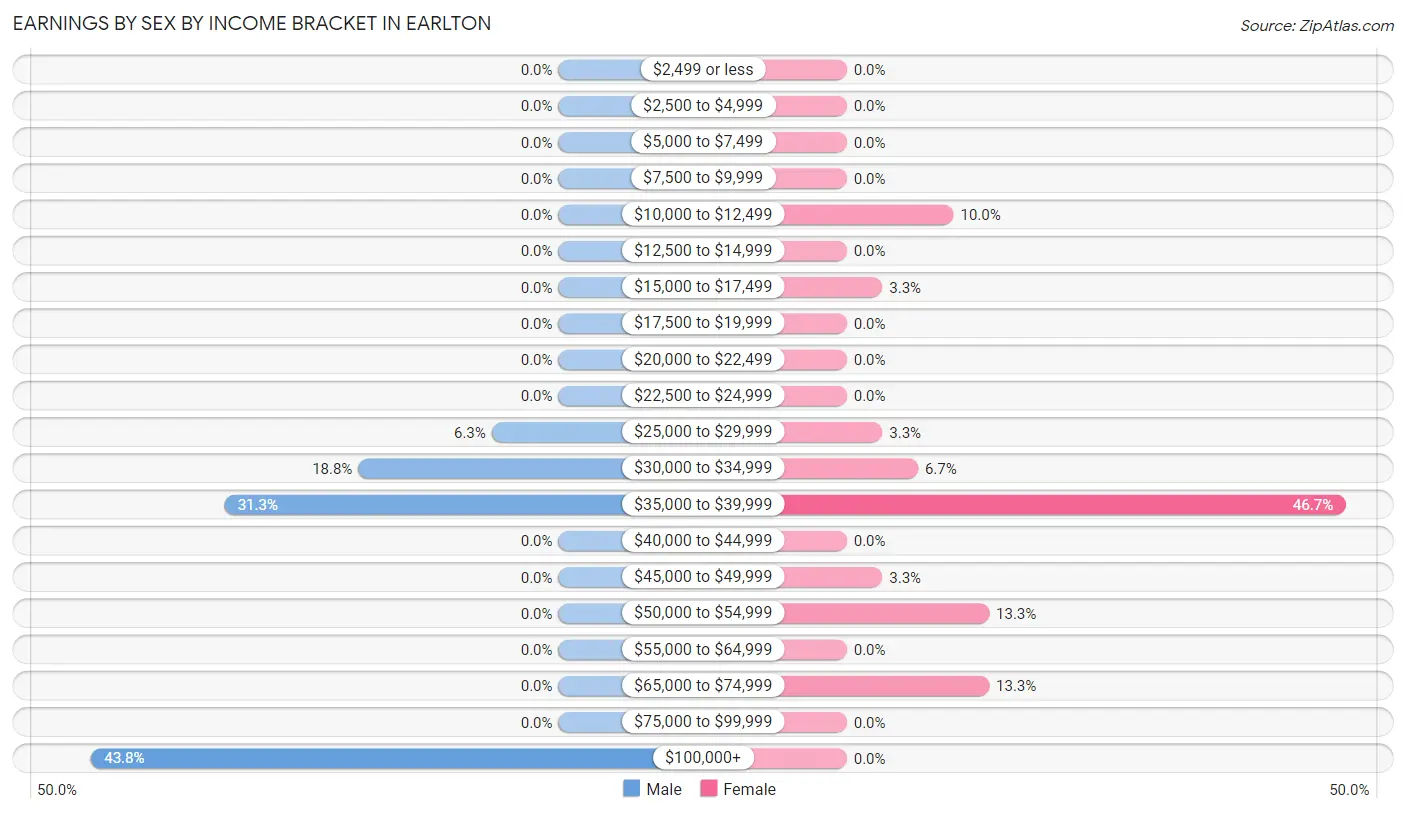
Earnings by Sex by Income Bracket in Earlton
The most common earnings brackets in Earlton are $100,000+ for men (7 | 43.8%) and $35,000 to $39,999 for women (14 | 46.7%).
| Income | Male | Female |
| $2,499 or less | 0 (0.0%) | 0 (0.0%) |
| $2,500 to $4,999 | 0 (0.0%) | 0 (0.0%) |
| $5,000 to $7,499 | 0 (0.0%) | 0 (0.0%) |
| $7,500 to $9,999 | 0 (0.0%) | 0 (0.0%) |
| $10,000 to $12,499 | 0 (0.0%) | 3 (10.0%) |
| $12,500 to $14,999 | 0 (0.0%) | 0 (0.0%) |
| $15,000 to $17,499 | 0 (0.0%) | 1 (3.3%) |
| $17,500 to $19,999 | 0 (0.0%) | 0 (0.0%) |
| $20,000 to $22,499 | 0 (0.0%) | 0 (0.0%) |
| $22,500 to $24,999 | 0 (0.0%) | 0 (0.0%) |
| $25,000 to $29,999 | 1 (6.2%) | 1 (3.3%) |
| $30,000 to $34,999 | 3 (18.8%) | 2 (6.7%) |
| $35,000 to $39,999 | 5 (31.2%) | 14 (46.7%) |
| $40,000 to $44,999 | 0 (0.0%) | 0 (0.0%) |
| $45,000 to $49,999 | 0 (0.0%) | 1 (3.3%) |
| $50,000 to $54,999 | 0 (0.0%) | 4 (13.3%) |
| $55,000 to $64,999 | 0 (0.0%) | 0 (0.0%) |
| $65,000 to $74,999 | 0 (0.0%) | 4 (13.3%) |
| $75,000 to $99,999 | 0 (0.0%) | 0 (0.0%) |
| $100,000+ | 7 (43.8%) | 0 (0.0%) |
| Total | 16 (100.0%) | 30 (100.0%) |
Earnings by Sex by Educational Attainment in Earlton
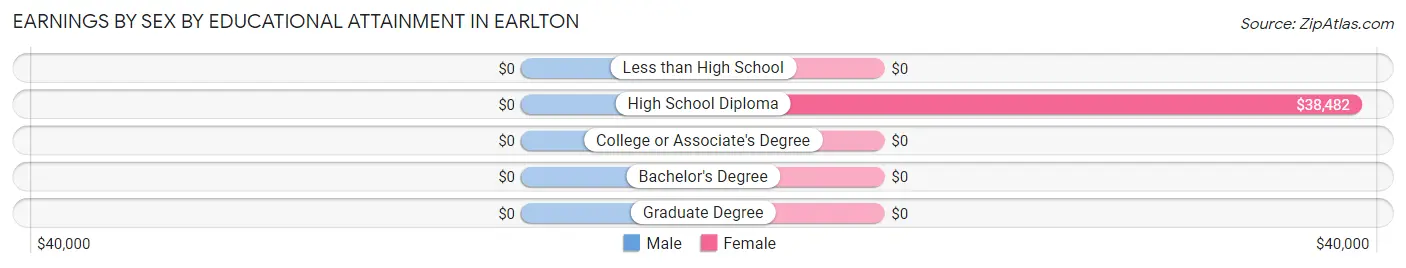
| Educational Attainment | Male Income | Female Income |
| Less than High School | - | - |
| High School Diploma | - | - |
| College or Associate's Degree | - | - |
| Bachelor's Degree | - | - |
| Graduate Degree | - | - |
| Total | - | - |
Family Income in Earlton
Family Income Brackets in Earlton
According to the Earlton family income data, there are 17 families falling into the $50,000 to $74,999 income range, which is the most common income bracket and makes up 48.6% of all families.
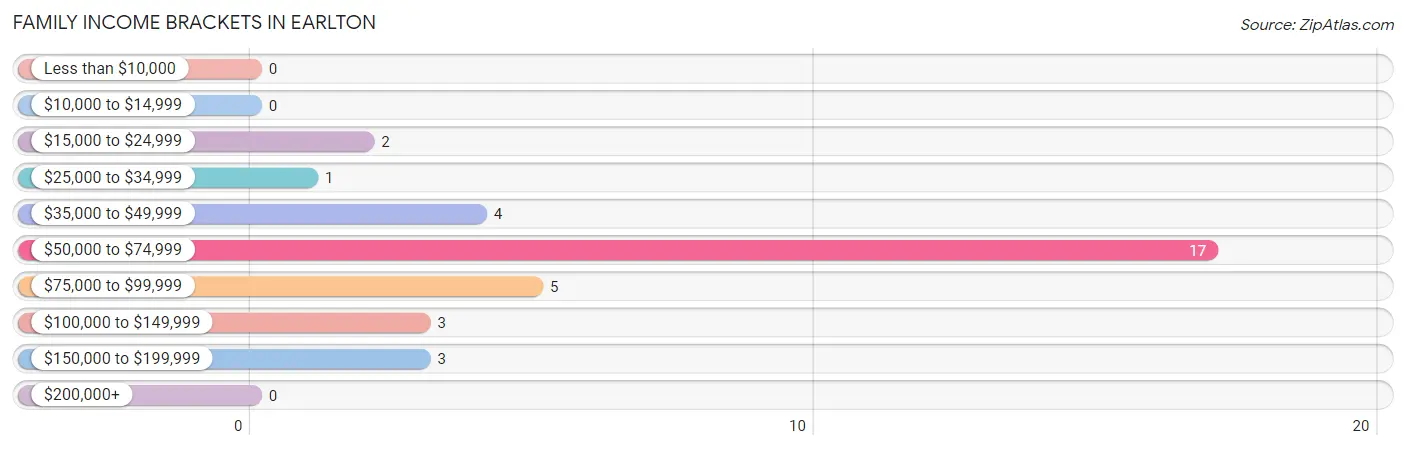
| Income Bracket | # Families | % Families |
| Less than $10,000 | 0 | 0.0% |
| $10,000 to $14,999 | 0 | 0.0% |
| $15,000 to $24,999 | 2 | 5.7% |
| $25,000 to $34,999 | 1 | 2.9% |
| $35,000 to $49,999 | 4 | 11.4% |
| $50,000 to $74,999 | 17 | 48.6% |
| $75,000 to $99,999 | 5 | 14.3% |
| $100,000 to $149,999 | 3 | 8.6% |
| $150,000 to $199,999 | 3 | 8.6% |
| $200,000+ | 0 | 0.0% |
Family Income by Famaliy Size in Earlton
3-person families (20 | 57.1%) account for the highest median family income in Earlton with $71,607 per family, while 3-person families (20 | 57.1%) have the highest median income of $23,869 per family member.
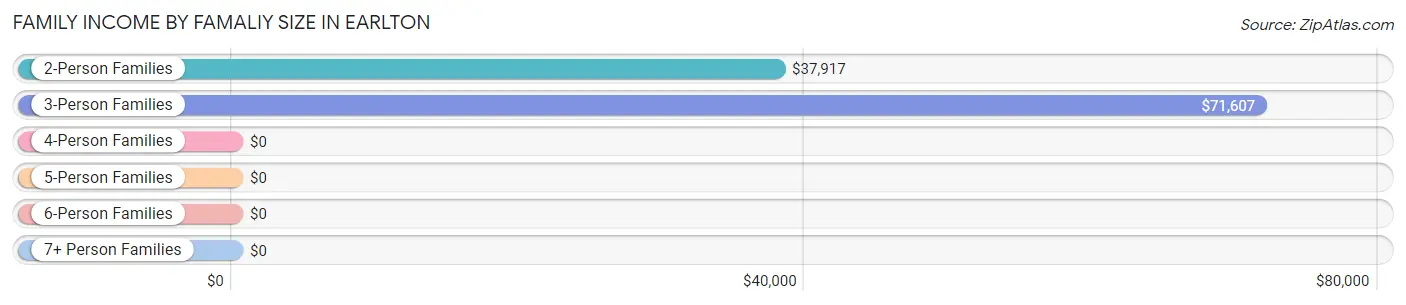
| Income Bracket | # Families | Median Income |
| 2-Person Families | 7 (20.0%) | $37,917 |
| 3-Person Families | 20 (57.1%) | $71,607 |
| 4-Person Families | 1 (2.9%) | $0 |
| 5-Person Families | 5 (14.3%) | $0 |
| 6-Person Families | 2 (5.7%) | $0 |
| 7+ Person Families | 0 (0.0%) | $0 |
| Total | 35 (100.0%) | $71,696 |
Family Income by Number of Earners in Earlton
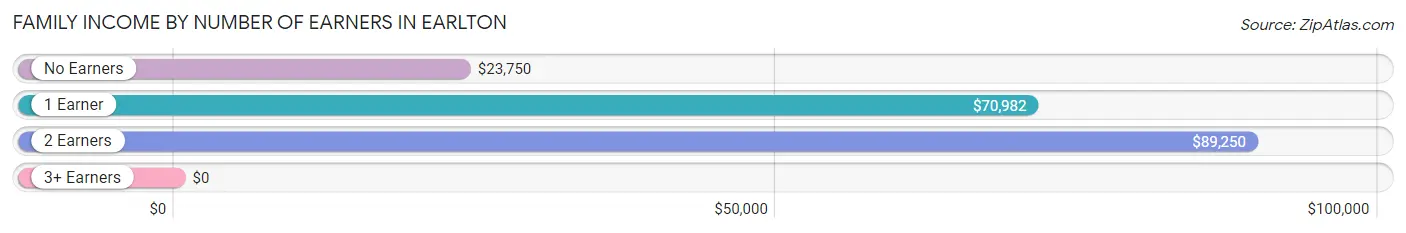
| Number of Earners | # Families | Median Income |
| No Earners | 3 (8.6%) | $23,750 |
| 1 Earner | 19 (54.3%) | $70,982 |
| 2 Earners | 13 (37.1%) | $89,250 |
| 3+ Earners | 0 (0.0%) | $0 |
| Total | 35 (100.0%) | $71,696 |
Household Income in Earlton
Household Income Brackets in Earlton
With 20 households falling in the category, the $50,000 to $74,999 income range is the most frequent in Earlton, accounting for 52.6% of all households.
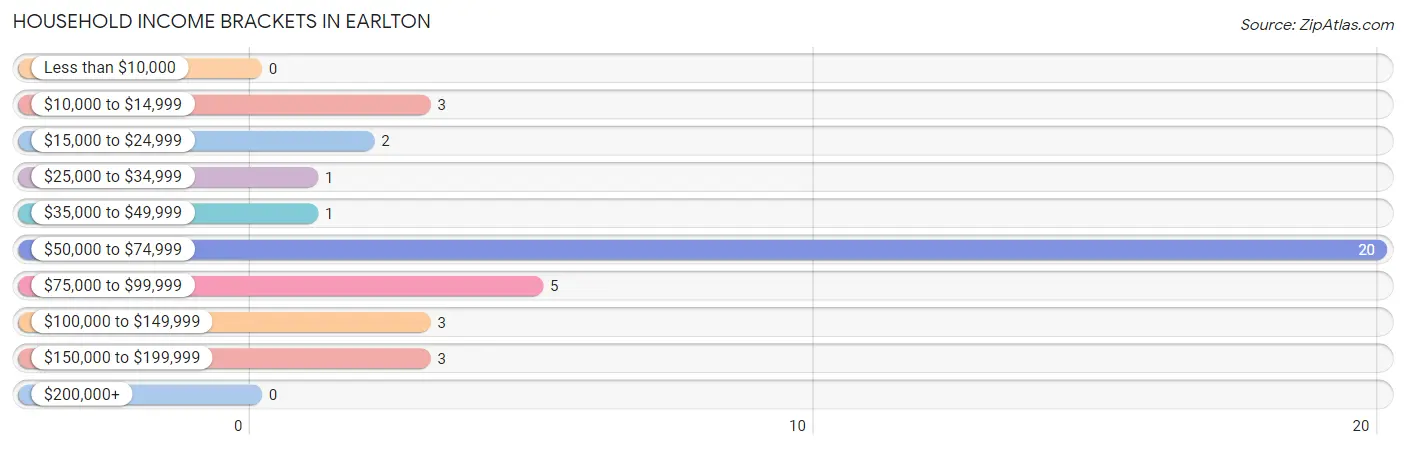
| Income Bracket | # Households | % Households |
| Less than $10,000 | 0 | 0.0% |
| $10,000 to $14,999 | 3 | 7.9% |
| $15,000 to $24,999 | 2 | 5.3% |
| $25,000 to $34,999 | 1 | 2.6% |
| $35,000 to $49,999 | 1 | 2.6% |
| $50,000 to $74,999 | 20 | 52.6% |
| $75,000 to $99,999 | 5 | 13.2% |
| $100,000 to $149,999 | 3 | 7.9% |
| $150,000 to $199,999 | 3 | 7.9% |
| $200,000+ | 0 | 0.0% |
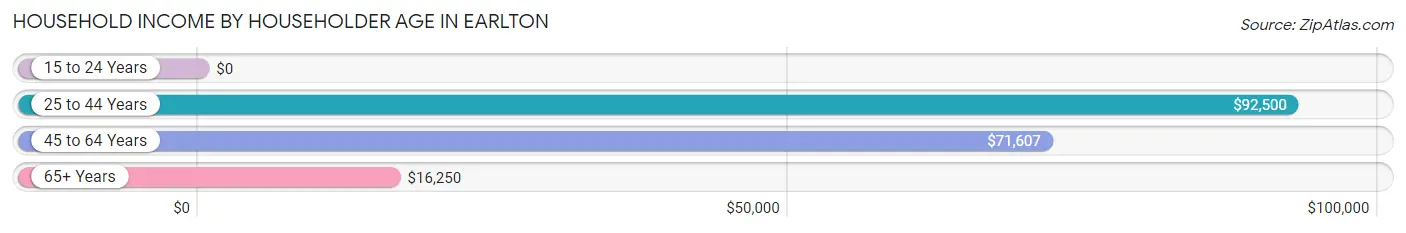
Household Income by Householder Age in Earlton
The median household income in Earlton is $71,429, with the highest median household income of $92,500 found in the 25 to 44 years age bracket for the primary householder. A total of 6 households (15.8%) fall into this category.
| Income Bracket | # Households | Median Income |
| 15 to 24 Years | 0 (0.0%) | $0 |
| 25 to 44 Years | 6 (15.8%) | $92,500 |
| 45 to 64 Years | 26 (68.4%) | $71,607 |
| 65+ Years | 6 (15.8%) | $16,250 |
| Total | 38 (100.0%) | $71,429 |
Poverty in Earlton
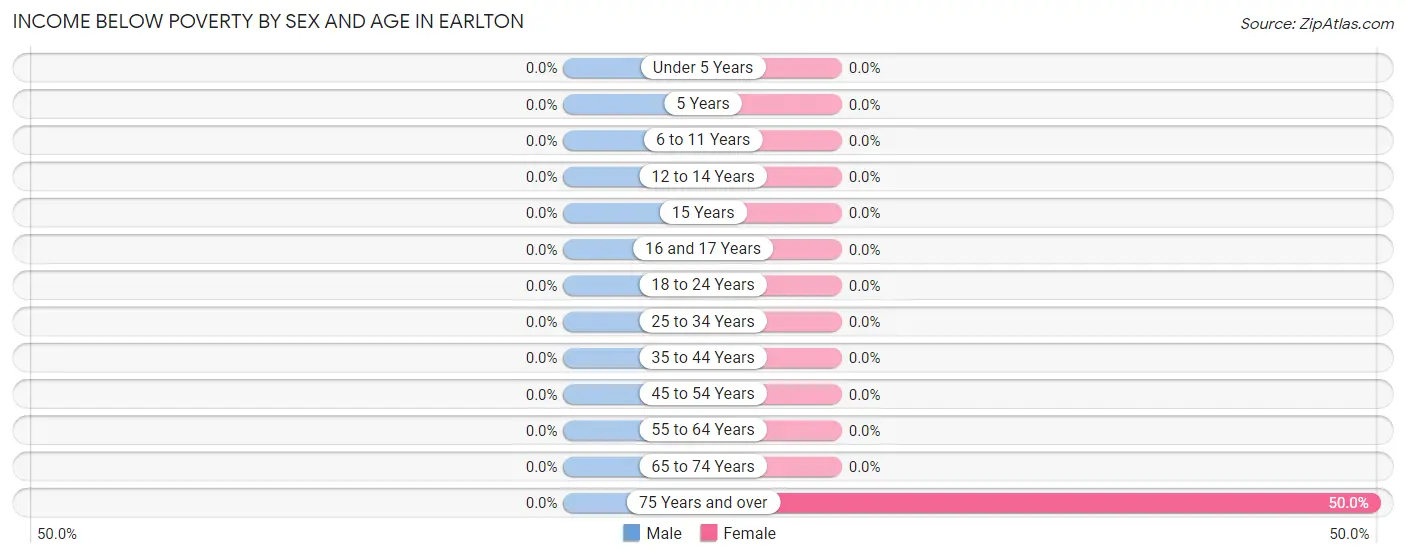
Income Below Poverty by Sex and Age in Earlton
| Age Bracket | Male | Female |
| Under 5 Years | 0 (0.0%) | 0 (0.0%) |
| 5 Years | 0 (0.0%) | 0 (0.0%) |
| 6 to 11 Years | 0 (0.0%) | 0 (0.0%) |
| 12 to 14 Years | 0 (0.0%) | 0 (0.0%) |
| 15 Years | 0 (0.0%) | 0 (0.0%) |
| 16 and 17 Years | 0 (0.0%) | 0 (0.0%) |
| 18 to 24 Years | 0 (0.0%) | 0 (0.0%) |
| 25 to 34 Years | 0 (0.0%) | 0 (0.0%) |
| 35 to 44 Years | 0 (0.0%) | 0 (0.0%) |
| 45 to 54 Years | 0 (0.0%) | 0 (0.0%) |
| 55 to 64 Years | 0 (0.0%) | 0 (0.0%) |
| 65 to 74 Years | 0 (0.0%) | 0 (0.0%) |
| 75 Years and over | 0 (0.0%) | 3 (50.0%) |
| Total | 0 (0.0%) | 3 (3.8%) |
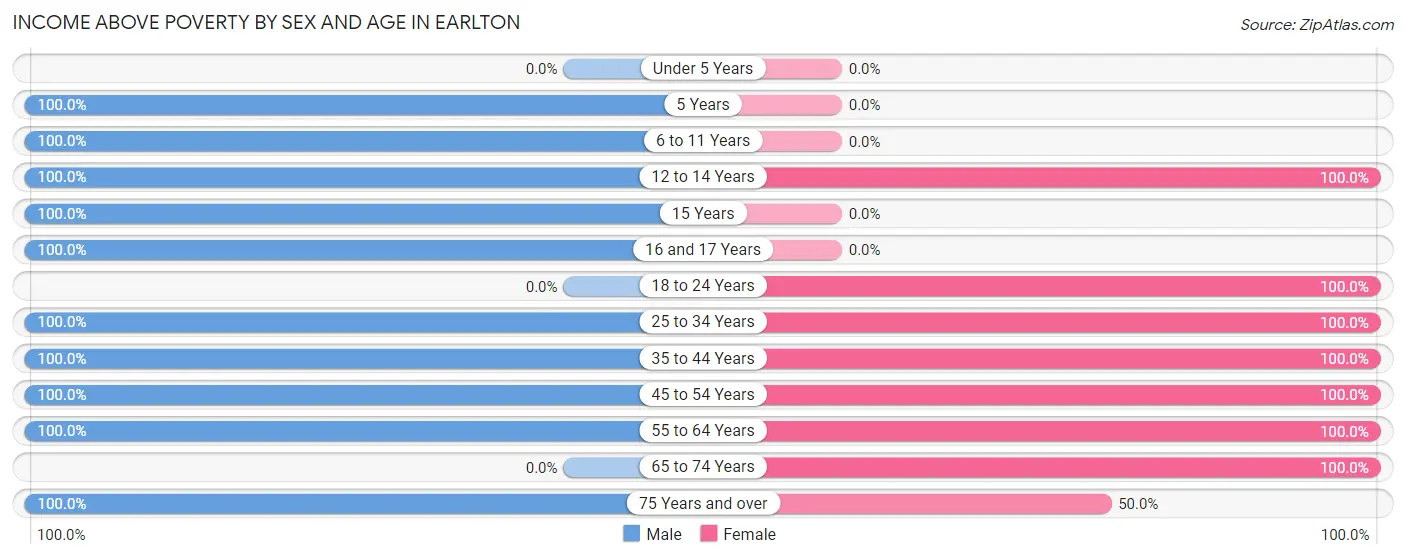
Income Above Poverty by Sex and Age in Earlton
According to the poverty statistics in Earlton, males aged 5 years and females aged 12 to 14 years are the age groups that are most secure financially, with 100.0% of males and 100.0% of females in these age groups living above the poverty line.
| Age Bracket | Male | Female |
| Under 5 Years | 0 (0.0%) | 0 (0.0%) |
| 5 Years | 8 (100.0%) | 0 (0.0%) |
| 6 to 11 Years | 1 (100.0%) | 0 (0.0%) |
| 12 to 14 Years | 1 (100.0%) | 18 (100.0%) |
| 15 Years | 4 (100.0%) | 0 (0.0%) |
| 16 and 17 Years | 1 (100.0%) | 0 (0.0%) |
| 18 to 24 Years | 0 (0.0%) | 8 (100.0%) |
| 25 to 34 Years | 3 (100.0%) | 17 (100.0%) |
| 35 to 44 Years | 4 (100.0%) | 6 (100.0%) |
| 45 to 54 Years | 17 (100.0%) | 5 (100.0%) |
| 55 to 64 Years | 3 (100.0%) | 17 (100.0%) |
| 65 to 74 Years | 0 (0.0%) | 1 (100.0%) |
| 75 Years and over | 4 (100.0%) | 3 (50.0%) |
| Total | 46 (100.0%) | 75 (96.2%) |
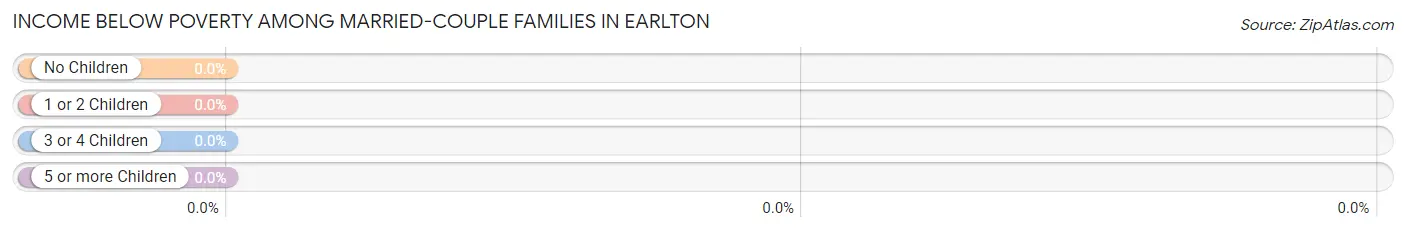
Income Below Poverty Among Married-Couple Families in Earlton
| Children | Above Poverty | Below Poverty |
| No Children | 21 (100.0%) | 0 (0.0%) |
| 1 or 2 Children | 11 (100.0%) | 0 (0.0%) |
| 3 or 4 Children | 2 (100.0%) | 0 (0.0%) |
| 5 or more Children | 0 (0.0%) | 0 (0.0%) |
| Total | 34 (100.0%) | 0 (0.0%) |
Income Below Poverty Among Single-Parent Households in Earlton
| Children | Single Father | Single Mother |
| No Children | 0 (0.0%) | 0 (0.0%) |
| 1 or 2 Children | 0 (0.0%) | 0 (0.0%) |
| 3 or 4 Children | 0 (0.0%) | 0 (0.0%) |
| 5 or more Children | 0 (0.0%) | 0 (0.0%) |
| Total | 0 (0.0%) | 0 (0.0%) |
Income Below Poverty Among Married-Couple vs Single-Parent Households in Earlton
| Children | Married-Couple Families | Single-Parent Households |
| No Children | 0 (0.0%) | 0 (0.0%) |
| 1 or 2 Children | 0 (0.0%) | 0 (0.0%) |
| 3 or 4 Children | 0 (0.0%) | 0 (0.0%) |
| 5 or more Children | 0 (0.0%) | 0 (0.0%) |
| Total | 0 (0.0%) | 0 (0.0%) |
Race in Earlton
The most populous races in Earlton are White / Caucasian (89 | 71.8%), Two or more Races (26 | 21.0%), and Black / African American (9 | 7.3%).
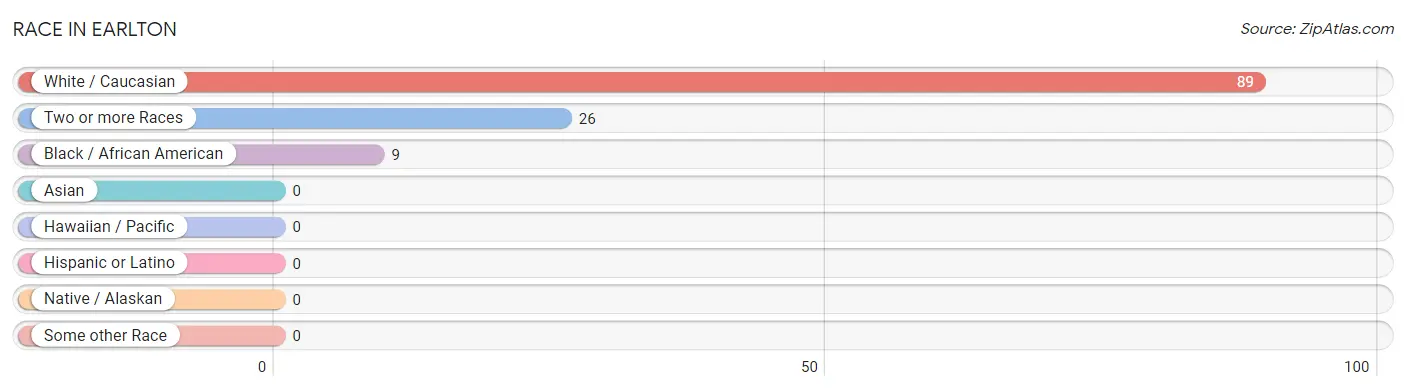
| Race | # Population | % Population |
| Asian | 0 | 0.0% |
| Black / African American | 9 | 7.3% |
| Hawaiian / Pacific | 0 | 0.0% |
| Hispanic or Latino | 0 | 0.0% |
| Native / Alaskan | 0 | 0.0% |
| White / Caucasian | 89 | 71.8% |
| Two or more Races | 26 | 21.0% |
| Some other Race | 0 | 0.0% |
| Total | 124 | 100.0% |
Ancestry in Earlton
The most populous ancestries reported in Earlton are German (45 | 36.3%), Irish (28 | 22.6%), Sioux (26 | 21.0%), Italian (7 | 5.7%), and European (6 | 4.8%), together accounting for 90.3% of all Earlton residents.
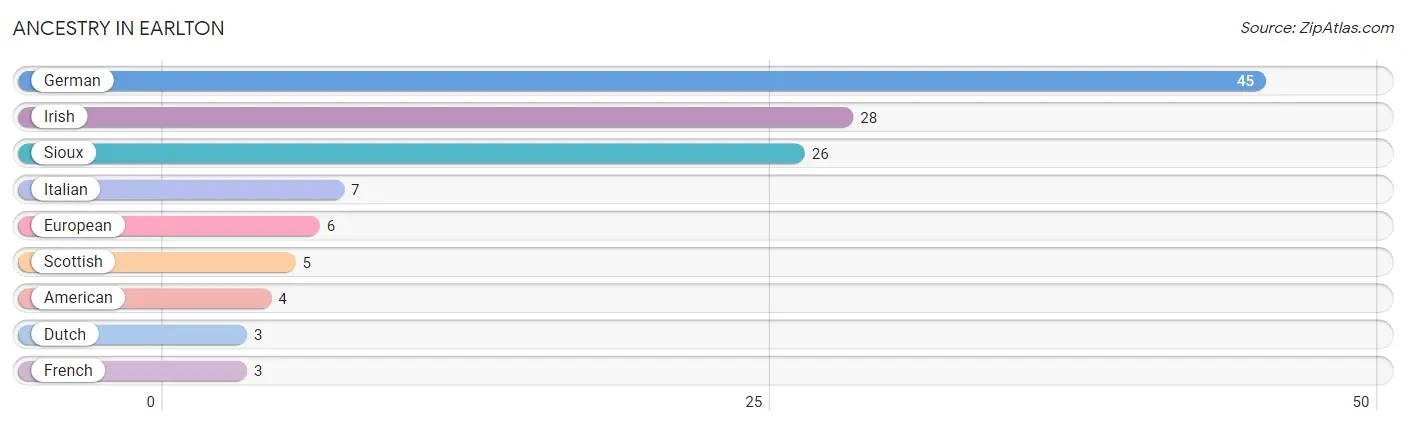
| Ancestry | # Population | % Population |
| American | 4 | 3.2% |
| Dutch | 3 | 2.4% |
| European | 6 | 4.8% |
| French | 3 | 2.4% |
| German | 45 | 36.3% |
| Irish | 28 | 22.6% |
| Italian | 7 | 5.7% |
| Scottish | 5 | 4.0% |
| Sioux | 26 | 21.0% | View All 9 Rows |
Immigrants in Earlton

| Immigration Origin | # Population | % Population | View All 0 Rows |
Sex and Age in Earlton
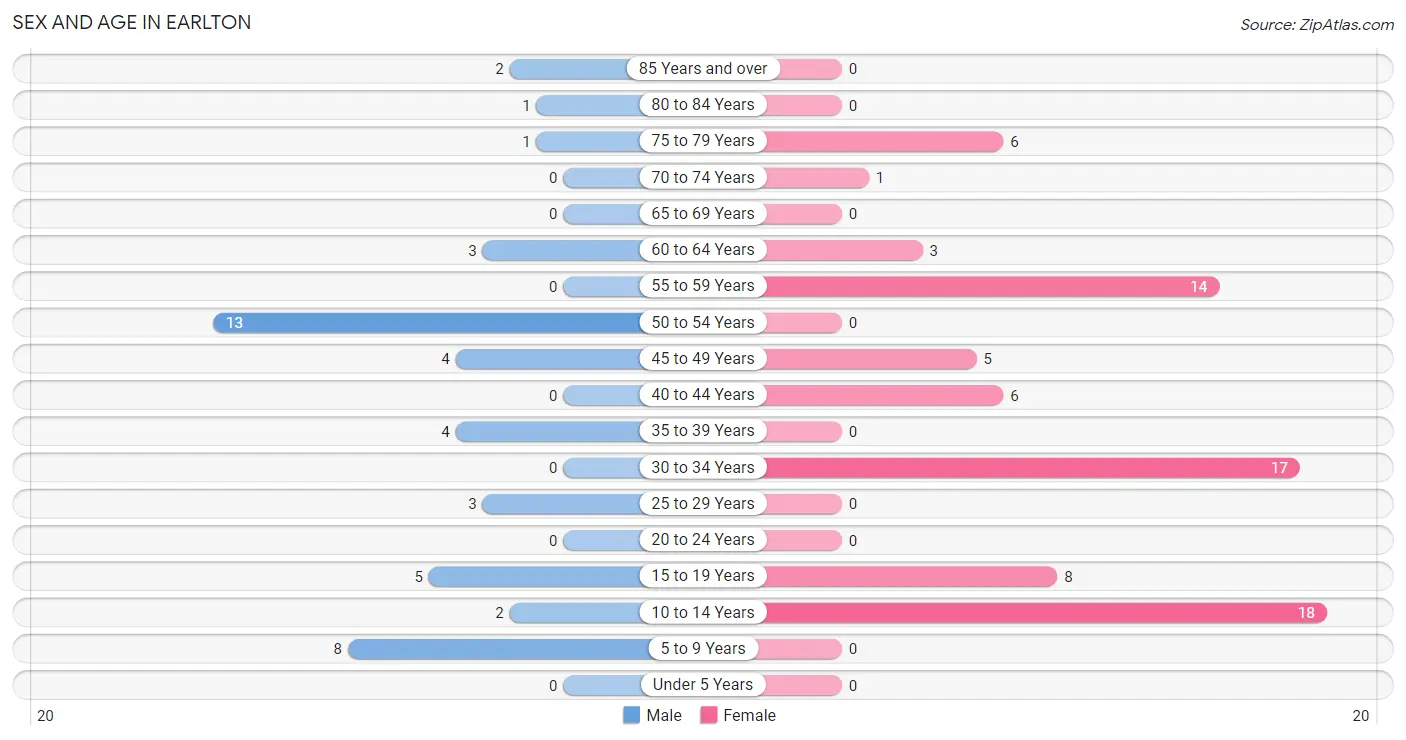
Sex and Age in Earlton
The most populous age groups in Earlton are 50 to 54 Years (13 | 28.3%) for men and 10 to 14 Years (18 | 23.1%) for women.
| Age Bracket | Male | Female |
| Under 5 Years | 0 (0.0%) | 0 (0.0%) |
| 5 to 9 Years | 8 (17.4%) | 0 (0.0%) |
| 10 to 14 Years | 2 (4.3%) | 18 (23.1%) |
| 15 to 19 Years | 5 (10.9%) | 8 (10.3%) |
| 20 to 24 Years | 0 (0.0%) | 0 (0.0%) |
| 25 to 29 Years | 3 (6.5%) | 0 (0.0%) |
| 30 to 34 Years | 0 (0.0%) | 17 (21.8%) |
| 35 to 39 Years | 4 (8.7%) | 0 (0.0%) |
| 40 to 44 Years | 0 (0.0%) | 6 (7.7%) |
| 45 to 49 Years | 4 (8.7%) | 5 (6.4%) |
| 50 to 54 Years | 13 (28.3%) | 0 (0.0%) |
| 55 to 59 Years | 0 (0.0%) | 14 (17.9%) |
| 60 to 64 Years | 3 (6.5%) | 3 (3.8%) |
| 65 to 69 Years | 0 (0.0%) | 0 (0.0%) |
| 70 to 74 Years | 0 (0.0%) | 1 (1.3%) |
| 75 to 79 Years | 1 (2.2%) | 6 (7.7%) |
| 80 to 84 Years | 1 (2.2%) | 0 (0.0%) |
| 85 Years and over | 2 (4.3%) | 0 (0.0%) |
| Total | 46 (100.0%) | 78 (100.0%) |
Families and Households in Earlton
Median Family Size in Earlton
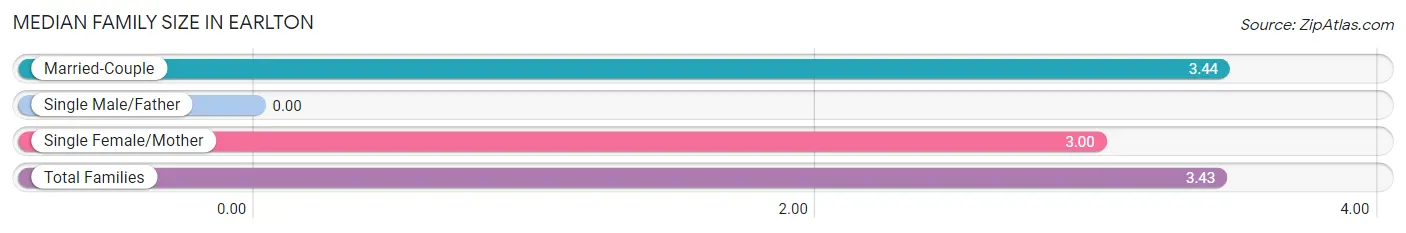
| Family Type | # Families | Family Size |
| Married-Couple | 34 (97.1%) | 3.44 |
| Single Male/Father | 0 (0.0%) | - |
| Single Female/Mother | 1 (2.9%) | 3.00 |
| Total Families | 35 (100.0%) | 3.43 |
Median Household Size in Earlton
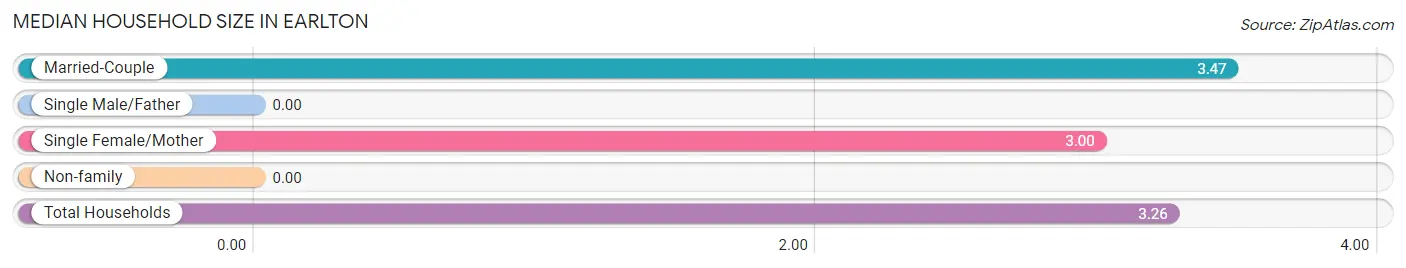
| Household Type | # Households | Household Size |
| Married-Couple | 34 (89.5%) | 3.47 |
| Single Male/Father | 0 (0.0%) | - |
| Single Female/Mother | 1 (2.6%) | 3.00 |
| Non-family | 3 (7.9%) | - |
| Total Households | 38 (100.0%) | 3.26 |
Household Size by Marriage Status in Earlton
Out of a total of 38 households in Earlton, 35 (92.1%) are family households, while 3 (7.9%) are nonfamily households. The most numerous type of family households are 3-person households, comprising 23, and the most common type of nonfamily households are 1-person households, comprising 3.
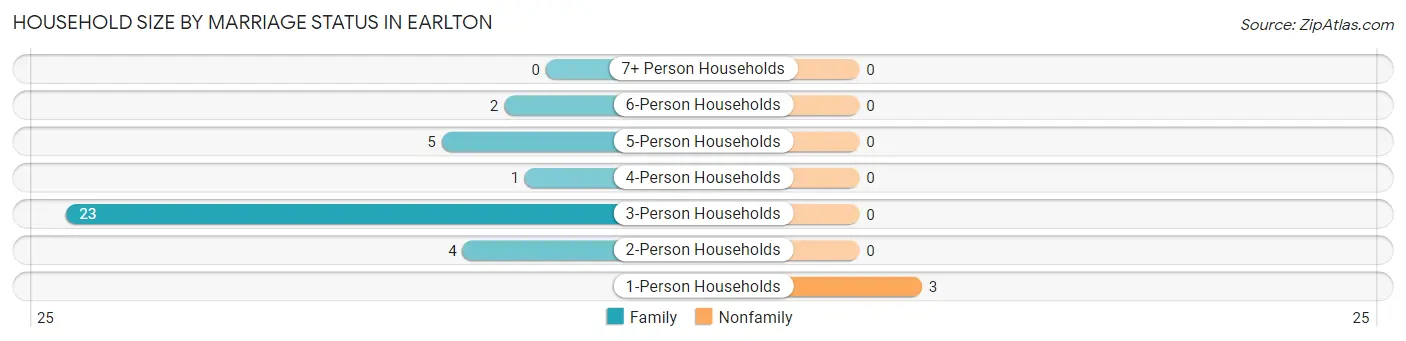
| Household Size | Family Households | Nonfamily Households |
| 1-Person Households | - | 3 (7.9%) |
| 2-Person Households | 4 (10.5%) | 0 (0.0%) |
| 3-Person Households | 23 (60.5%) | 0 (0.0%) |
| 4-Person Households | 1 (2.6%) | 0 (0.0%) |
| 5-Person Households | 5 (13.2%) | 0 (0.0%) |
| 6-Person Households | 2 (5.3%) | 0 (0.0%) |
| 7+ Person Households | 0 (0.0%) | 0 (0.0%) |
| Total | 35 (92.1%) | 3 (7.9%) |
Female Fertility in Earlton
Fertility by Age in Earlton
| Age Bracket | Women with Births | Births / 1,000 Women |
| 15 to 19 years | 0 (0.0%) | 0.0 |
| 20 to 34 years | 0 (0.0%) | 0.0 |
| 35 to 50 years | 0 (0.0%) | 0.0 |
| Total | 0 (0.0%) | 0.0 |
Fertility by Age by Marriage Status in Earlton
| Age Bracket | Married | Unmarried |
| 15 to 19 years | 0 (0.0%) | 0 (0.0%) |
| 20 to 34 years | 0 (0.0%) | 0 (0.0%) |
| 35 to 50 years | 0 (0.0%) | 0 (0.0%) |
| Total | 0 (0.0%) | 0 (0.0%) |
Fertility by Education in Earlton
| Educational Attainment | Women with Births | Births / 1,000 Women |
| Less than High School | 0 (0.0%) | 0.0 |
| High School Diploma | 0 (0.0%) | 0.0 |
| College or Associate's Degree | 0 (0.0%) | 0.0 |
| Bachelor's Degree | 0 (0.0%) | 0.0 |
| Graduate Degree | 0 (0.0%) | 0.0 |
| Total | 0 (0.0%) | 0.0 |
Fertility by Education by Marriage Status in Earlton
| Educational Attainment | Married | Unmarried |
| Less than High School | 0 (0.0%) | 0 (0.0%) |
| High School Diploma | 0 (0.0%) | 0 (0.0%) |
| College or Associate's Degree | 0 (0.0%) | 0 (0.0%) |
| Bachelor's Degree | 0 (0.0%) | 0 (0.0%) |
| Graduate Degree | 0 (0.0%) | 0 (0.0%) |
| Total | 0 (0.0%) | 0 (0.0%) |
Employment Characteristics in Earlton
Employment by Class of Employer in Earlton
Among the 43 employed individuals in Earlton, local government employees (19 | 44.2%), private company employees (11 | 25.6%), and self-employed (not incorporated) (8 | 18.6%) make up the most common classes of employment.
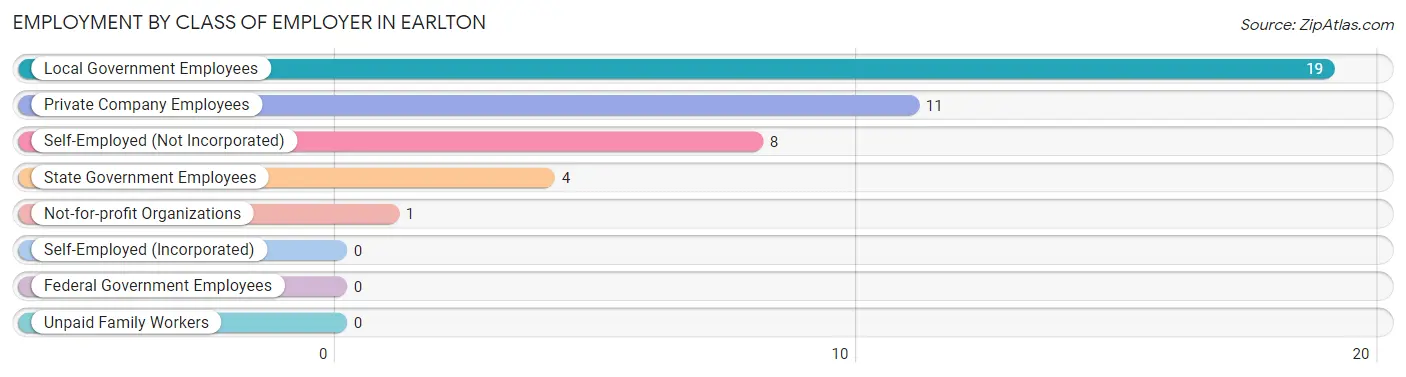
| Employer Class | # Employees | % Employees |
| Private Company Employees | 11 | 25.6% |
| Self-Employed (Incorporated) | 0 | 0.0% |
| Self-Employed (Not Incorporated) | 8 | 18.6% |
| Not-for-profit Organizations | 1 | 2.3% |
| Local Government Employees | 19 | 44.2% |
| State Government Employees | 4 | 9.3% |
| Federal Government Employees | 0 | 0.0% |
| Unpaid Family Workers | 0 | 0.0% |
| Total | 43 | 100.0% |
Employment Status by Age in Earlton
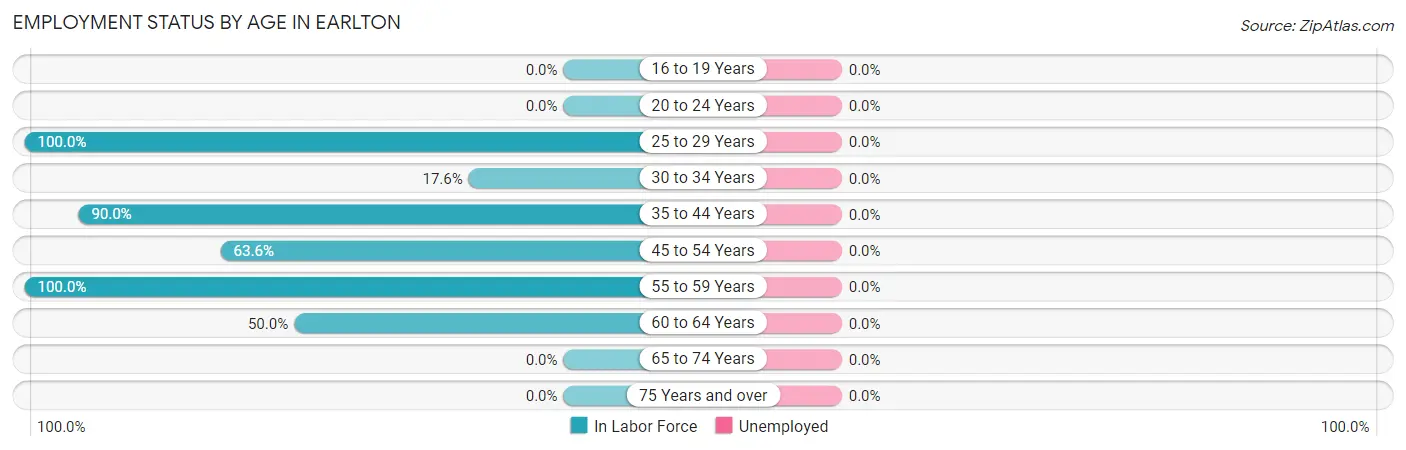
| Age Bracket | In Labor Force | Unemployed |
| 16 to 19 Years | 0 (0.0%) | 0 (0.0%) |
| 20 to 24 Years | 0 (0.0%) | 0 (0.0%) |
| 25 to 29 Years | 3 (100.0%) | 0 (0.0%) |
| 30 to 34 Years | 3 (17.6%) | 0 (0.0%) |
| 35 to 44 Years | 9 (90.0%) | 0 (0.0%) |
| 45 to 54 Years | 14 (63.6%) | 0 (0.0%) |
| 55 to 59 Years | 14 (100.0%) | 0 (0.0%) |
| 60 to 64 Years | 3 (50.0%) | 0 (0.0%) |
| 65 to 74 Years | 0 (0.0%) | 0 (0.0%) |
| 75 Years and over | 0 (0.0%) | 0 (0.0%) |
| Total | 46 (50.0%) | 0 (0.0%) |
Employment Status by Educational Attainment in Earlton
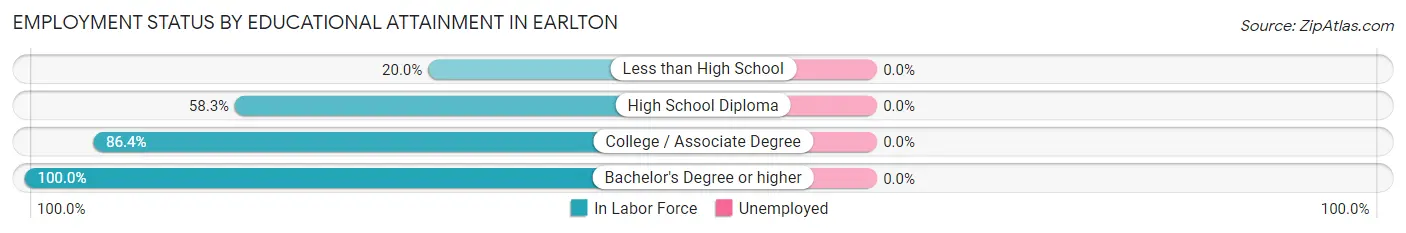
| Educational Attainment | In Labor Force | Unemployed |
| Less than High School | 2 (20.0%) | 0 (0.0%) |
| High School Diploma | 21 (58.3%) | 0 (0.0%) |
| College / Associate Degree | 19 (86.4%) | 0 (0.0%) |
| Bachelor's Degree or higher | 4 (100.0%) | 0 (0.0%) |
| Total | 46 (63.9%) | 0 (0.0%) |
Employment Occupations by Sex in Earlton
Management, Business, Science and Arts Occupations
The most common Management, Business, Science and Arts occupations in Earlton are Management (13 | 28.3%), Community & Social Service (4 | 8.7%), Education, Arts & Media (4 | 8.7%), and Business & Financial (2 | 4.3%).
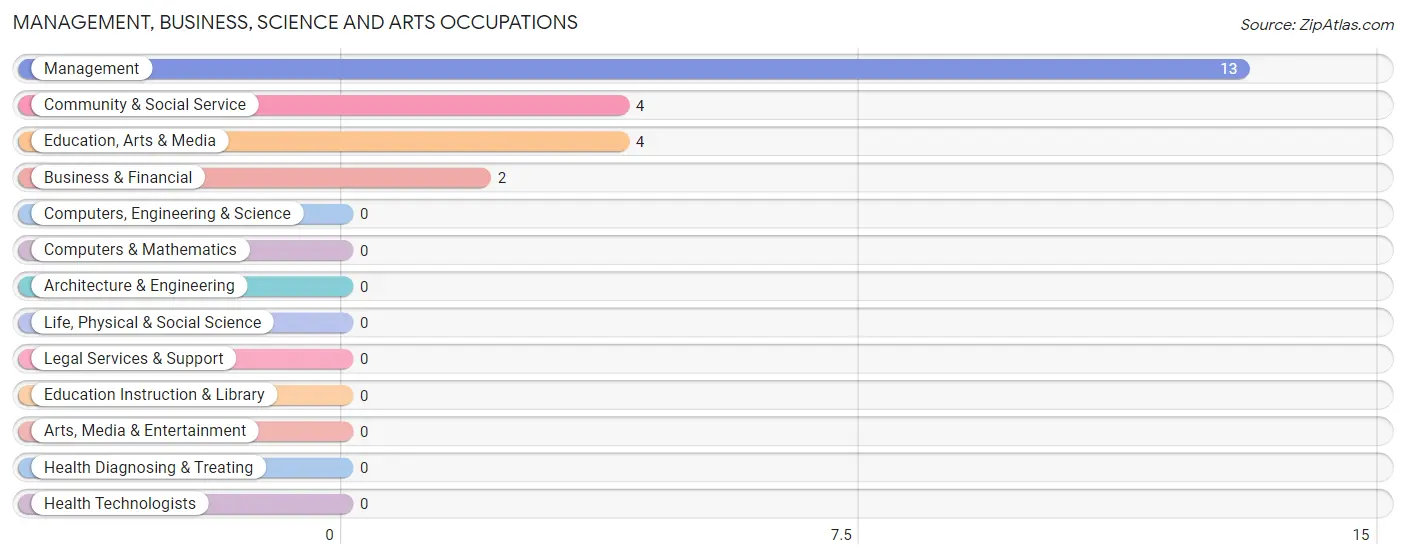
Management, Business, Science and Arts Occupations by Sex
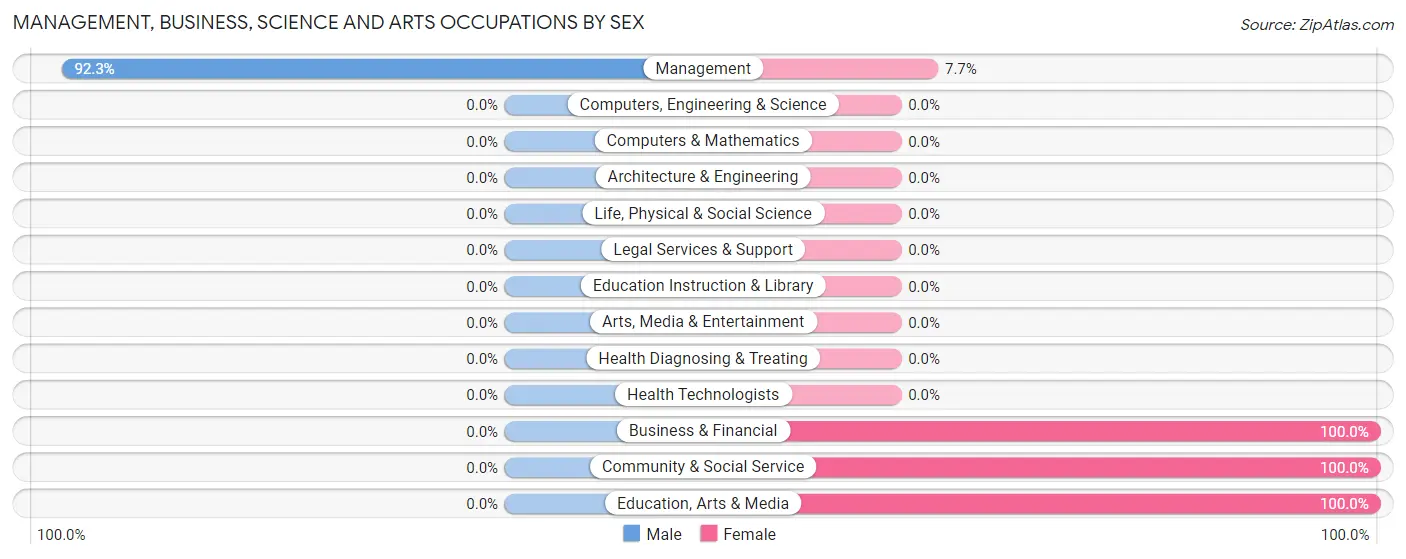
| Occupation | Male | Female |
| Management | 12 (92.3%) | 1 (7.7%) |
| Business & Financial | 0 (0.0%) | 2 (100.0%) |
| Computers, Engineering & Science | 0 (0.0%) | 0 (0.0%) |
| Computers & Mathematics | 0 (0.0%) | 0 (0.0%) |
| Architecture & Engineering | 0 (0.0%) | 0 (0.0%) |
| Life, Physical & Social Science | 0 (0.0%) | 0 (0.0%) |
| Community & Social Service | 0 (0.0%) | 4 (100.0%) |
| Education, Arts & Media | 0 (0.0%) | 4 (100.0%) |
| Legal Services & Support | 0 (0.0%) | 0 (0.0%) |
| Education Instruction & Library | 0 (0.0%) | 0 (0.0%) |
| Arts, Media & Entertainment | 0 (0.0%) | 0 (0.0%) |
| Health Diagnosing & Treating | 0 (0.0%) | 0 (0.0%) |
| Health Technologists | 0 (0.0%) | 0 (0.0%) |
| Total (Category) | 12 (63.2%) | 7 (36.8%) |
| Total (Overall) | 16 (34.8%) | 30 (65.2%) |
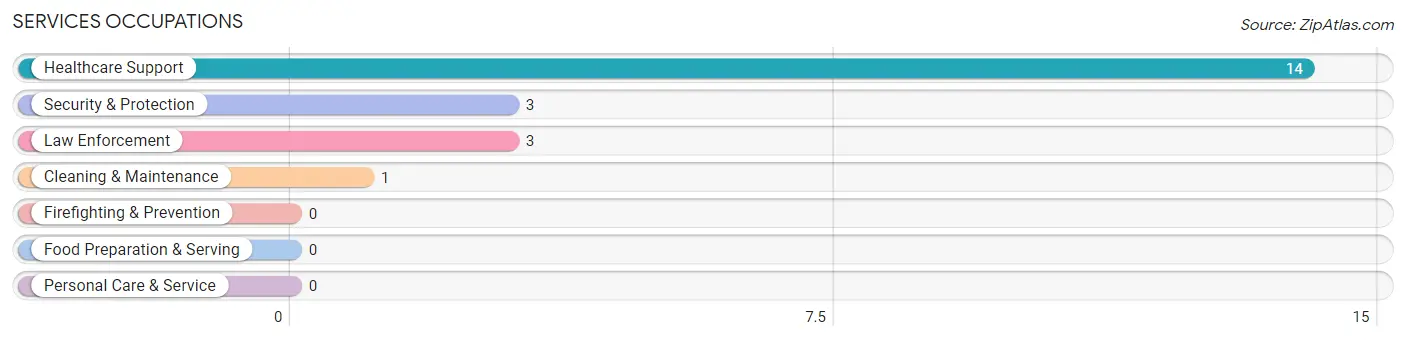
Services Occupations
The most common Services occupations in Earlton are Healthcare Support (14 | 30.4%), Security & Protection (3 | 6.5%), Law Enforcement (3 | 6.5%), and Cleaning & Maintenance (1 | 2.2%).
Services Occupations by Sex
Within the Services occupations in Earlton, the most male-oriented occupations are Security & Protection (100.0%), and Law Enforcement (100.0%), while the most female-oriented occupations are Healthcare Support (100.0%), and Cleaning & Maintenance (100.0%).
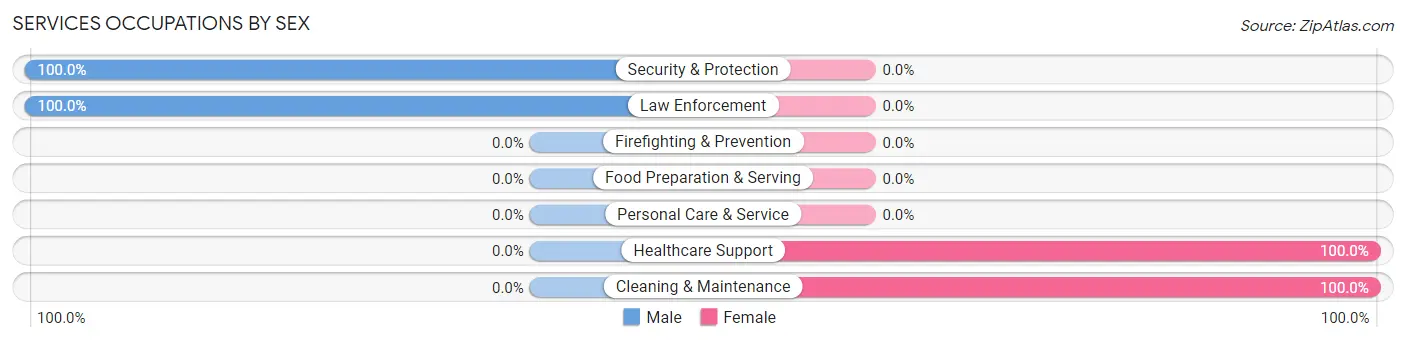
| Occupation | Male | Female |
| Healthcare Support | 0 (0.0%) | 14 (100.0%) |
| Security & Protection | 3 (100.0%) | 0 (0.0%) |
| Firefighting & Prevention | 0 (0.0%) | 0 (0.0%) |
| Law Enforcement | 3 (100.0%) | 0 (0.0%) |
| Food Preparation & Serving | 0 (0.0%) | 0 (0.0%) |
| Cleaning & Maintenance | 0 (0.0%) | 1 (100.0%) |
| Personal Care & Service | 0 (0.0%) | 0 (0.0%) |
| Total (Category) | 3 (16.7%) | 15 (83.3%) |
| Total (Overall) | 16 (34.8%) | 30 (65.2%) |
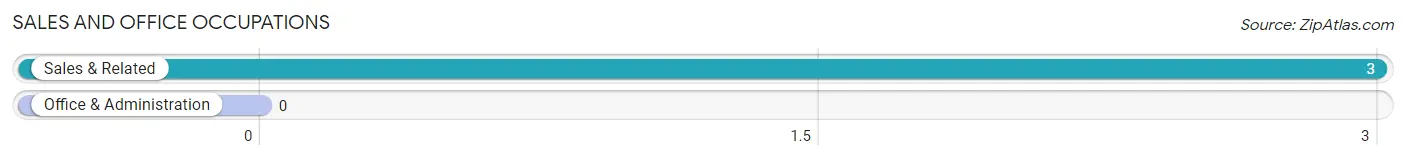
Sales and Office Occupations
The most common Sales and Office occupations in Earlton are , and Sales & Related (3 | 6.5%).
Sales and Office Occupations by Sex
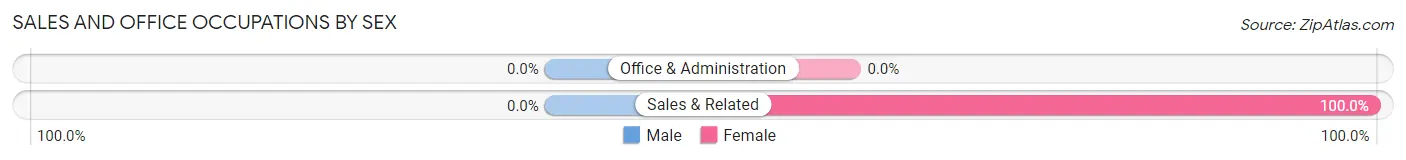
| Occupation | Male | Female |
| Sales & Related | 0 (0.0%) | 3 (100.0%) |
| Office & Administration | 0 (0.0%) | 0 (0.0%) |
| Total (Category) | 0 (0.0%) | 3 (100.0%) |
| Total (Overall) | 16 (34.8%) | 30 (65.2%) |
Natural Resources, Construction and Maintenance Occupations
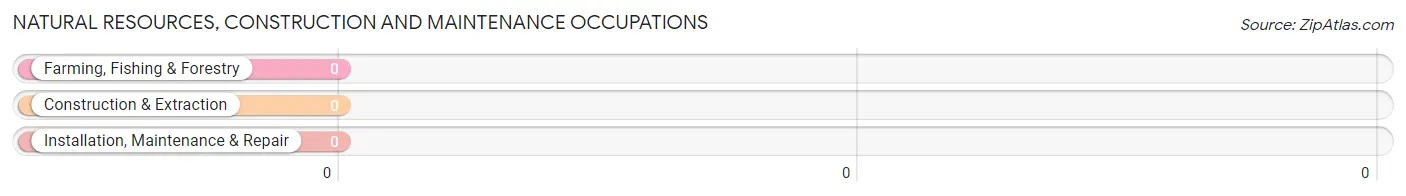
Natural Resources, Construction and Maintenance Occupations by Sex
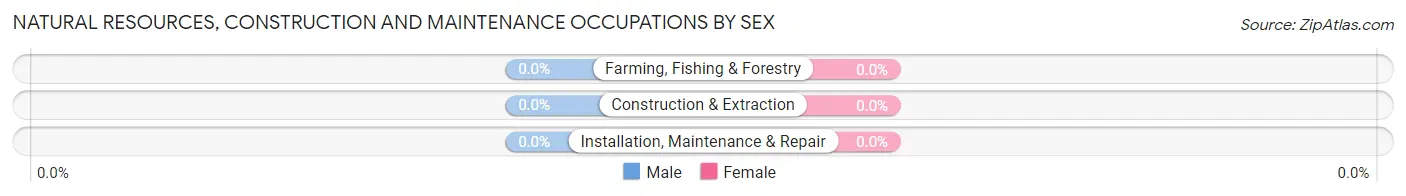
| Occupation | Male | Female |
| Farming, Fishing & Forestry | 0 (0.0%) | 0 (0.0%) |
| Construction & Extraction | 0 (0.0%) | 0 (0.0%) |
| Installation, Maintenance & Repair | 0 (0.0%) | 0 (0.0%) |
| Total (Category) | 0 (0.0%) | 0 (0.0%) |
| Total (Overall) | 16 (34.8%) | 30 (65.2%) |
Production, Transportation and Moving Occupations
The most common Production, Transportation and Moving occupations in Earlton are Production (4 | 8.7%), Transportation (1 | 2.2%), and Material Moving (1 | 2.2%).
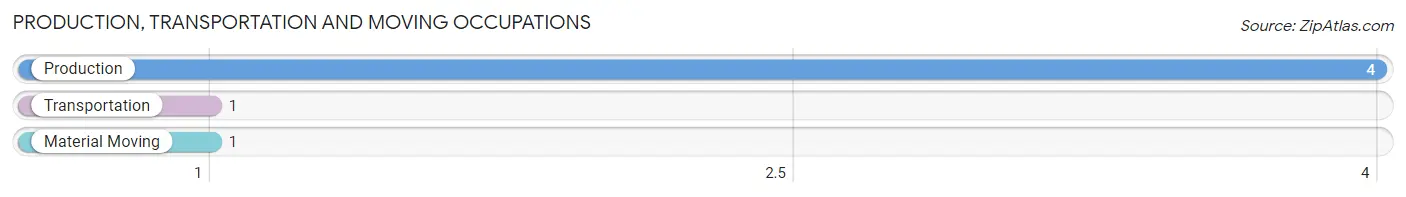
Production, Transportation and Moving Occupations by Sex
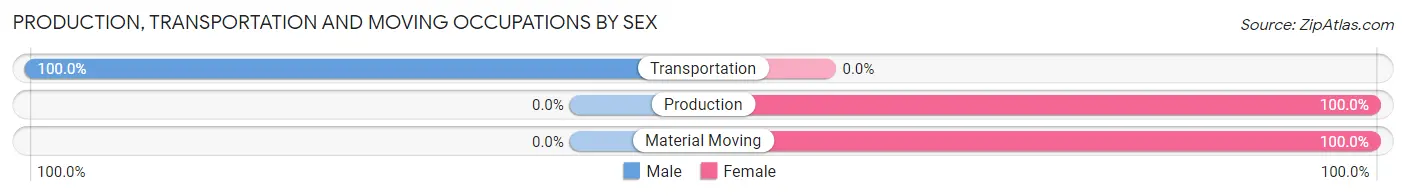
| Occupation | Male | Female |
| Production | 0 (0.0%) | 4 (100.0%) |
| Transportation | 1 (100.0%) | 0 (0.0%) |
| Material Moving | 0 (0.0%) | 1 (100.0%) |
| Total (Category) | 1 (16.7%) | 5 (83.3%) |
| Total (Overall) | 16 (34.8%) | 30 (65.2%) |
Employment Industries by Sex in Earlton
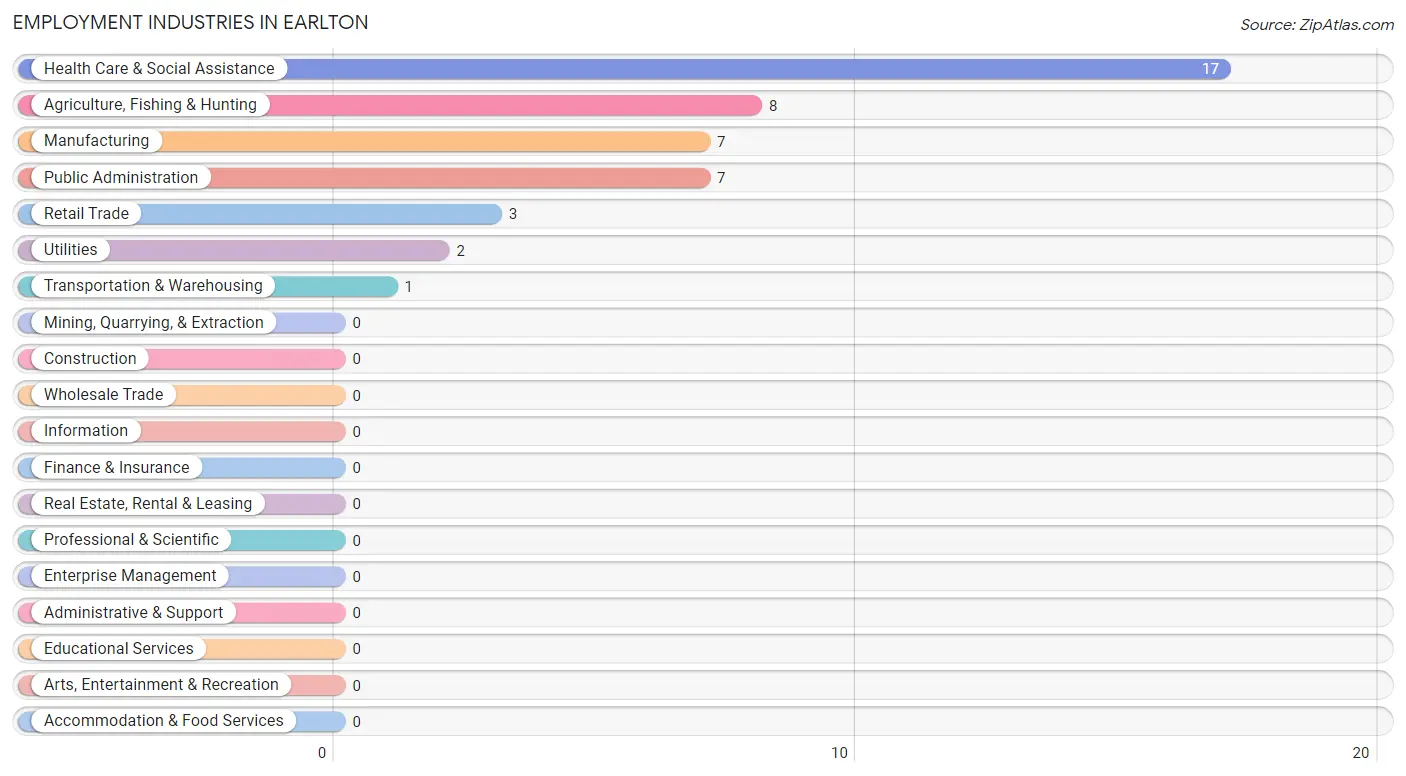
Employment Industries in Earlton
The major employment industries in Earlton include Health Care & Social Assistance (17 | 37.0%), Agriculture, Fishing & Hunting (8 | 17.4%), Manufacturing (7 | 15.2%), Public Administration (7 | 15.2%), and Retail Trade (3 | 6.5%).
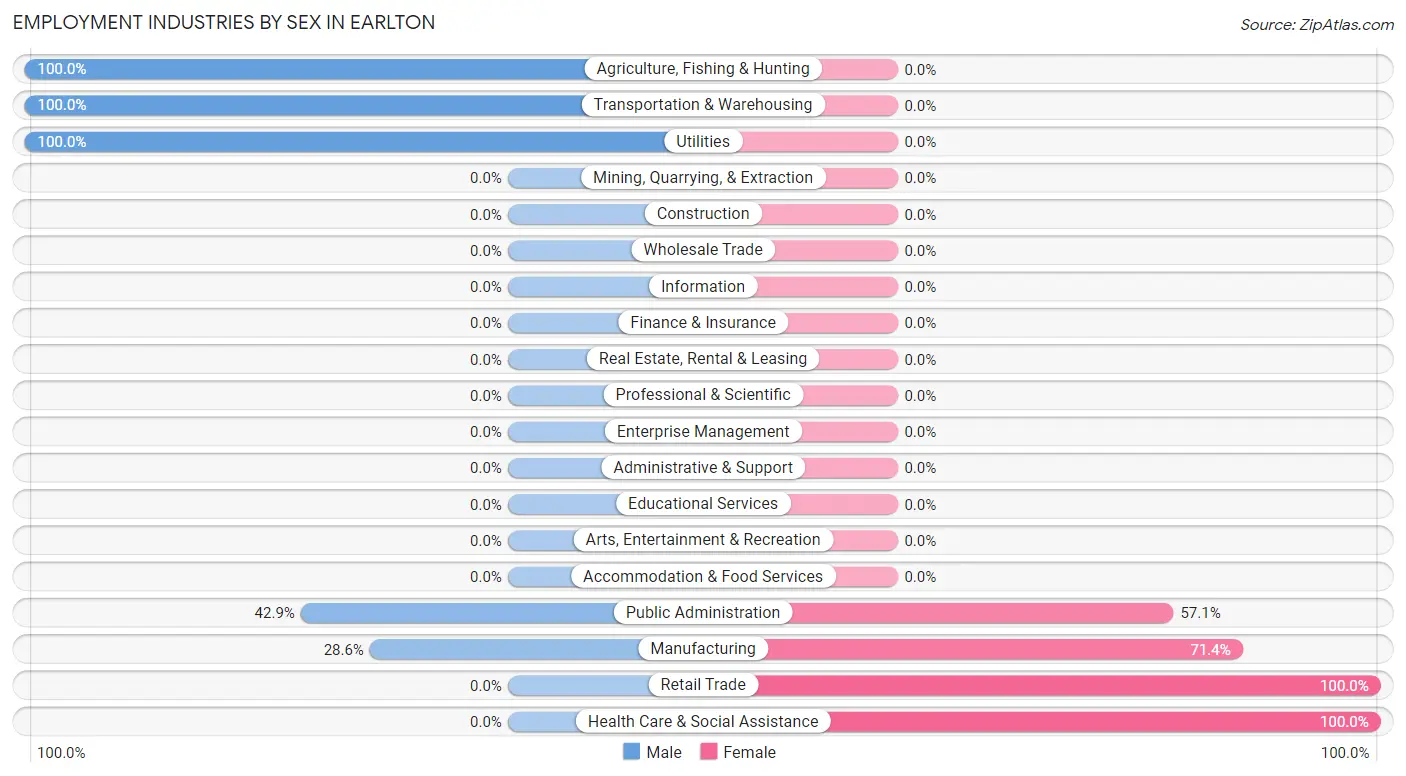
Employment Industries by Sex in Earlton
The Earlton industries that see more men than women are Agriculture, Fishing & Hunting (100.0%), Transportation & Warehousing (100.0%), and Utilities (100.0%), whereas the industries that tend to have a higher number of women are Retail Trade (100.0%), Health Care & Social Assistance (100.0%), and Manufacturing (71.4%).
| Industry | Male | Female |
| Agriculture, Fishing & Hunting | 8 (100.0%) | 0 (0.0%) |
| Mining, Quarrying, & Extraction | 0 (0.0%) | 0 (0.0%) |
| Construction | 0 (0.0%) | 0 (0.0%) |
| Manufacturing | 2 (28.6%) | 5 (71.4%) |
| Wholesale Trade | 0 (0.0%) | 0 (0.0%) |
| Retail Trade | 0 (0.0%) | 3 (100.0%) |
| Transportation & Warehousing | 1 (100.0%) | 0 (0.0%) |
| Utilities | 2 (100.0%) | 0 (0.0%) |
| Information | 0 (0.0%) | 0 (0.0%) |
| Finance & Insurance | 0 (0.0%) | 0 (0.0%) |
| Real Estate, Rental & Leasing | 0 (0.0%) | 0 (0.0%) |
| Professional & Scientific | 0 (0.0%) | 0 (0.0%) |
| Enterprise Management | 0 (0.0%) | 0 (0.0%) |
| Administrative & Support | 0 (0.0%) | 0 (0.0%) |
| Educational Services | 0 (0.0%) | 0 (0.0%) |
| Health Care & Social Assistance | 0 (0.0%) | 17 (100.0%) |
| Arts, Entertainment & Recreation | 0 (0.0%) | 0 (0.0%) |
| Accommodation & Food Services | 0 (0.0%) | 0 (0.0%) |
| Public Administration | 3 (42.9%) | 4 (57.1%) |
| Total | 16 (34.8%) | 30 (65.2%) |
Education in Earlton
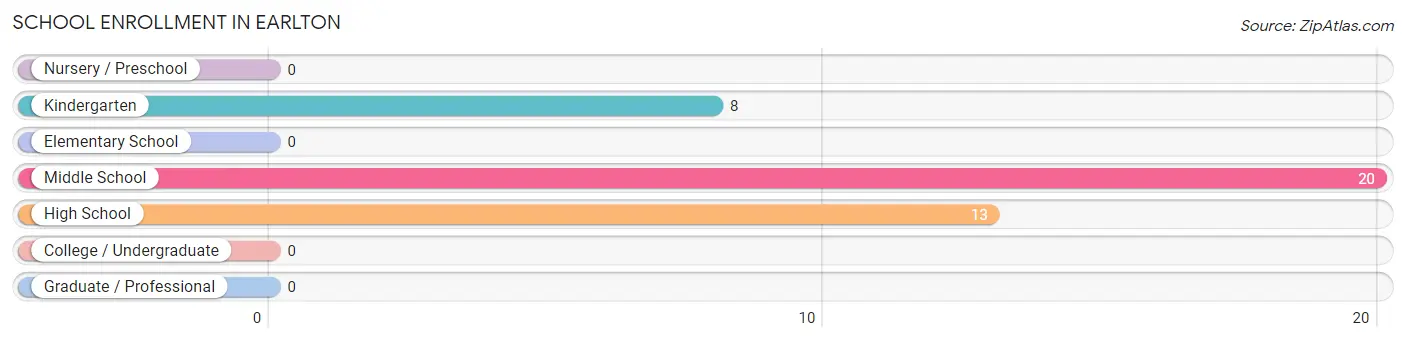
School Enrollment in Earlton
The most common levels of schooling among the 41 students in Earlton are middle school (20 | 48.8%), high school (13 | 31.7%), and kindergarten (8 | 19.5%).
| School Level | # Students | % Students |
| Nursery / Preschool | 0 | 0.0% |
| Kindergarten | 8 | 19.5% |
| Elementary School | 0 | 0.0% |
| Middle School | 20 | 48.8% |
| High School | 13 | 31.7% |
| College / Undergraduate | 0 | 0.0% |
| Graduate / Professional | 0 | 0.0% |
| Total | 41 | 100.0% |
School Enrollment by Age by Funding Source in Earlton
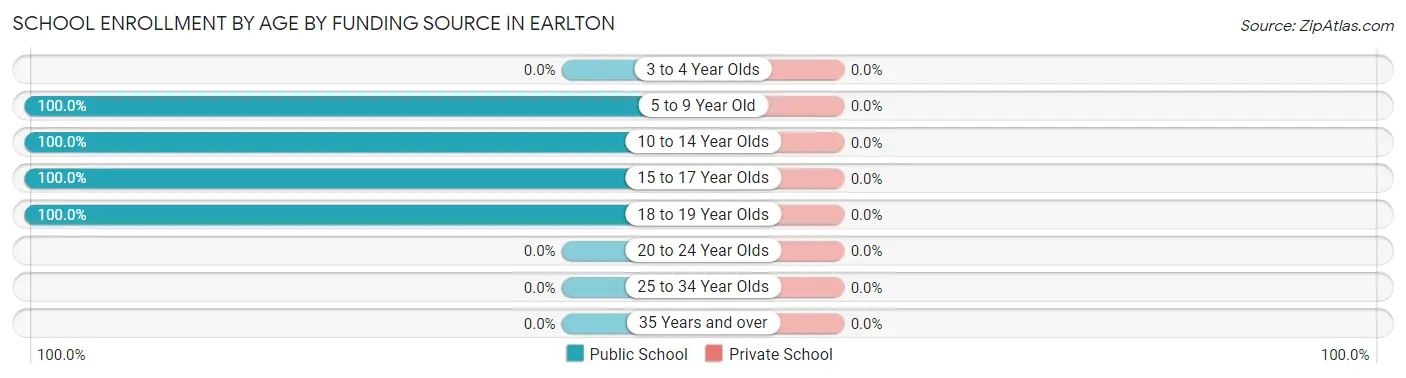
| Age Bracket | Public School | Private School |
| 3 to 4 Year Olds | 0 (0.0%) | 0 (0.0%) |
| 5 to 9 Year Old | 8 (100.0%) | 0 (0.0%) |
| 10 to 14 Year Olds | 20 (100.0%) | 0 (0.0%) |
| 15 to 17 Year Olds | 5 (100.0%) | 0 (0.0%) |
| 18 to 19 Year Olds | 8 (100.0%) | 0 (0.0%) |
| 20 to 24 Year Olds | 0 (0.0%) | 0 (0.0%) |
| 25 to 34 Year Olds | 0 (0.0%) | 0 (0.0%) |
| 35 Years and over | 0 (0.0%) | 0 (0.0%) |
| Total | 41 (100.0%) | 0 (0.0%) |
Educational Attainment by Field of Study in Earlton
, and science & technology (4 | 100.0%) are the most common fields of study among 4 individuals in Earlton who have obtained a bachelor's degree or higher.
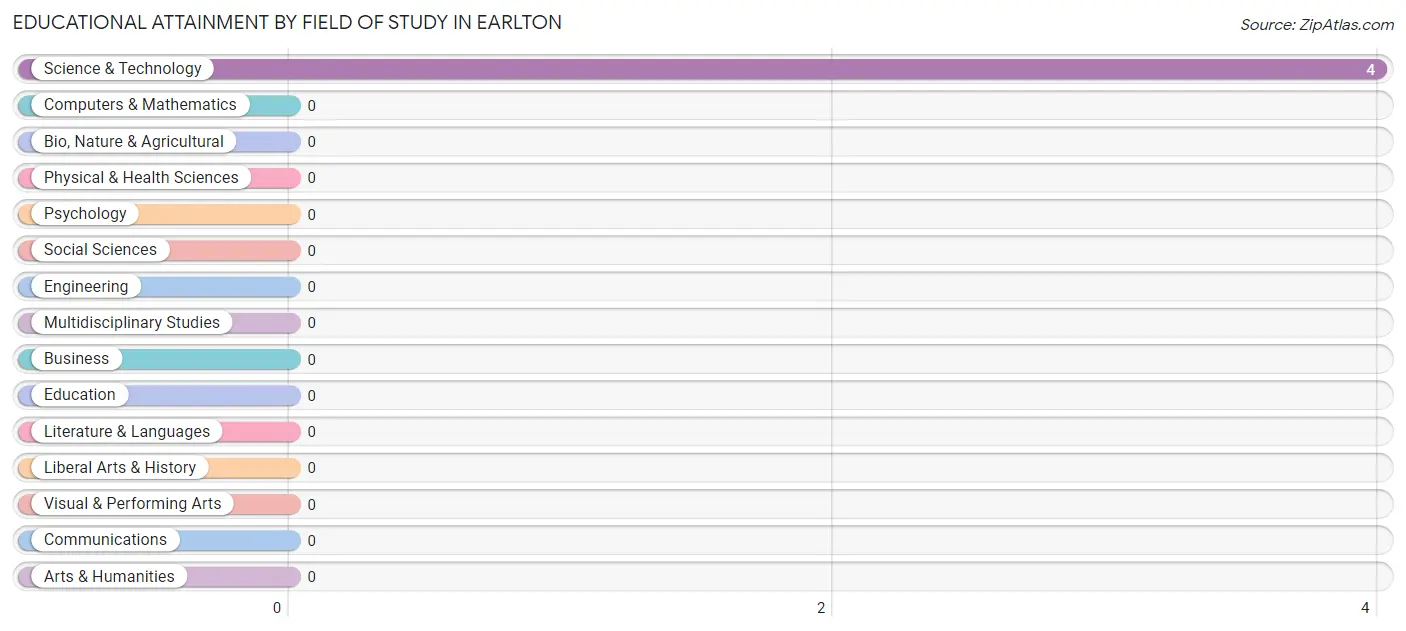
| Field of Study | # Graduates | % Graduates |
| Computers & Mathematics | 0 | 0.0% |
| Bio, Nature & Agricultural | 0 | 0.0% |
| Physical & Health Sciences | 0 | 0.0% |
| Psychology | 0 | 0.0% |
| Social Sciences | 0 | 0.0% |
| Engineering | 0 | 0.0% |
| Multidisciplinary Studies | 0 | 0.0% |
| Science & Technology | 4 | 100.0% |
| Business | 0 | 0.0% |
| Education | 0 | 0.0% |
| Literature & Languages | 0 | 0.0% |
| Liberal Arts & History | 0 | 0.0% |
| Visual & Performing Arts | 0 | 0.0% |
| Communications | 0 | 0.0% |
| Arts & Humanities | 0 | 0.0% |
| Total | 4 | 100.0% |
Transportation & Commute in Earlton
Vehicle Availability by Sex in Earlton
The most prevalent vehicle ownership categories in Earlton are males with 4 vehicles (7, accounting for 43.8%) and females with 4 vehicles (5, making up 25.9%).
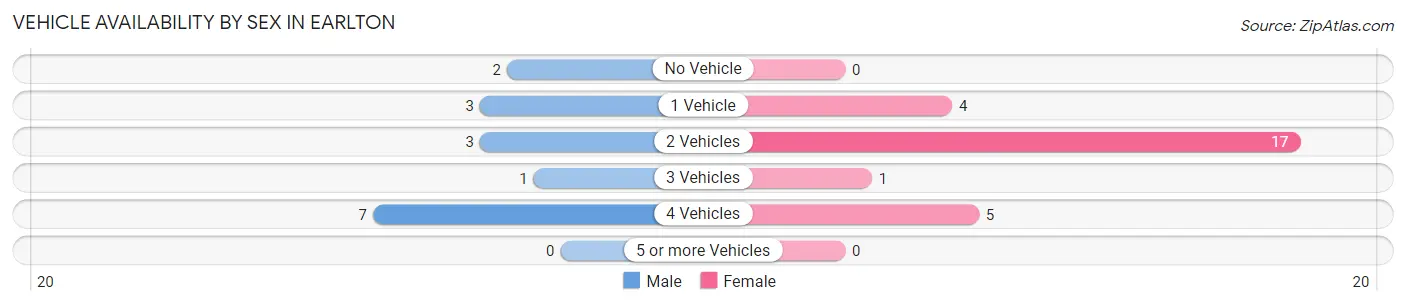
| Vehicles Available | Male | Female |
| No Vehicle | 2 (12.5%) | 0 (0.0%) |
| 1 Vehicle | 3 (18.8%) | 4 (14.8%) |
| 2 Vehicles | 3 (18.8%) | 17 (63.0%) |
| 3 Vehicles | 1 (6.2%) | 1 (3.7%) |
| 4 Vehicles | 7 (43.8%) | 5 (18.5%) |
| 5 or more Vehicles | 0 (0.0%) | 0 (0.0%) |
| Total | 16 (100.0%) | 27 (100.0%) |
Commute Time in Earlton
The most frequently occuring commute durations in Earlton are less than 5 minutes (18 commuters, 41.9%), 15 to 19 minutes (11 commuters, 25.6%), and 20 to 24 minutes (4 commuters, 9.3%).
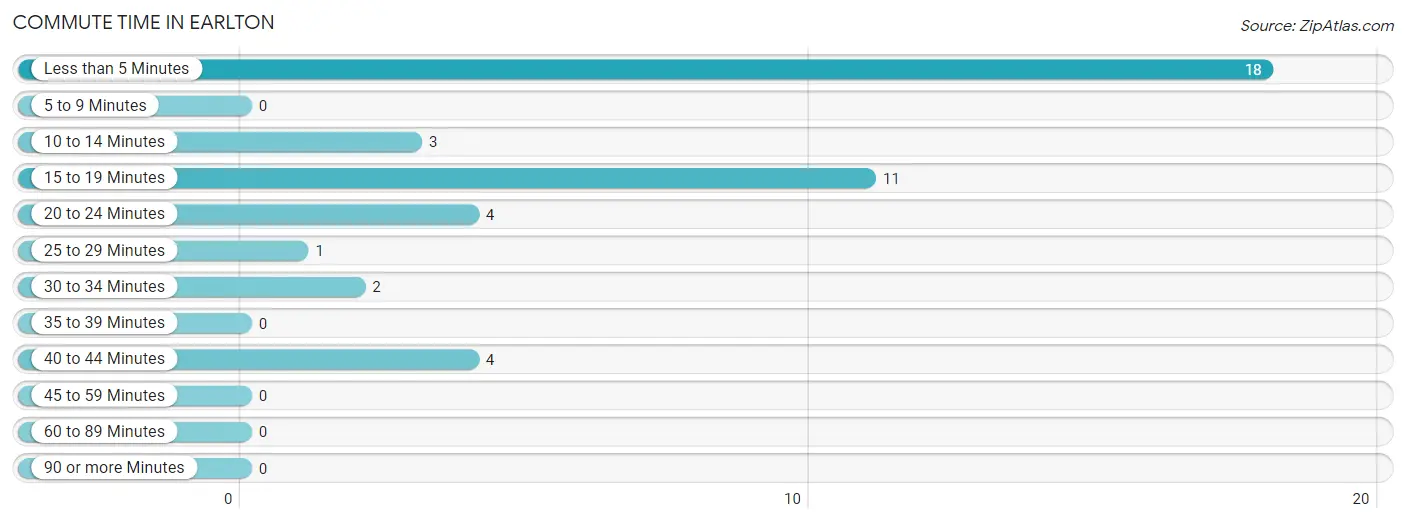
| Commute Time | # Commuters | % Commuters |
| Less than 5 Minutes | 18 | 41.9% |
| 5 to 9 Minutes | 0 | 0.0% |
| 10 to 14 Minutes | 3 | 7.0% |
| 15 to 19 Minutes | 11 | 25.6% |
| 20 to 24 Minutes | 4 | 9.3% |
| 25 to 29 Minutes | 1 | 2.3% |
| 30 to 34 Minutes | 2 | 4.6% |
| 35 to 39 Minutes | 0 | 0.0% |
| 40 to 44 Minutes | 4 | 9.3% |
| 45 to 59 Minutes | 0 | 0.0% |
| 60 to 89 Minutes | 0 | 0.0% |
| 90 or more Minutes | 0 | 0.0% |
Commute Time by Sex in Earlton
The most common commute times in Earlton are 15 to 19 minutes (7 commuters, 43.8%) for males and less than 5 minutes (14 commuters, 51.8%) for females.
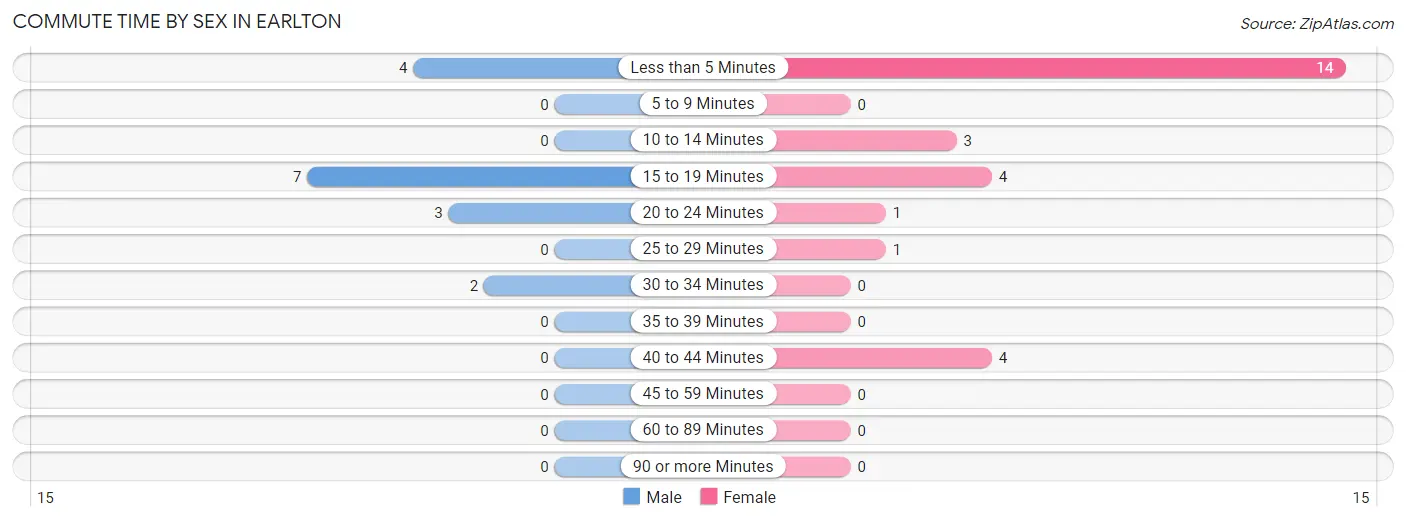
| Commute Time | Male | Female |
| Less than 5 Minutes | 4 (25.0%) | 14 (51.8%) |
| 5 to 9 Minutes | 0 (0.0%) | 0 (0.0%) |
| 10 to 14 Minutes | 0 (0.0%) | 3 (11.1%) |
| 15 to 19 Minutes | 7 (43.8%) | 4 (14.8%) |
| 20 to 24 Minutes | 3 (18.8%) | 1 (3.7%) |
| 25 to 29 Minutes | 0 (0.0%) | 1 (3.7%) |
| 30 to 34 Minutes | 2 (12.5%) | 0 (0.0%) |
| 35 to 39 Minutes | 0 (0.0%) | 0 (0.0%) |
| 40 to 44 Minutes | 0 (0.0%) | 4 (14.8%) |
| 45 to 59 Minutes | 0 (0.0%) | 0 (0.0%) |
| 60 to 89 Minutes | 0 (0.0%) | 0 (0.0%) |
| 90 or more Minutes | 0 (0.0%) | 0 (0.0%) |
Time of Departure to Work by Sex in Earlton
The most frequent times of departure to work in Earlton are 5:00 AM to 5:29 AM (5, 31.2%) for males and 8:00 AM to 8:29 AM (14, 51.8%) for females.
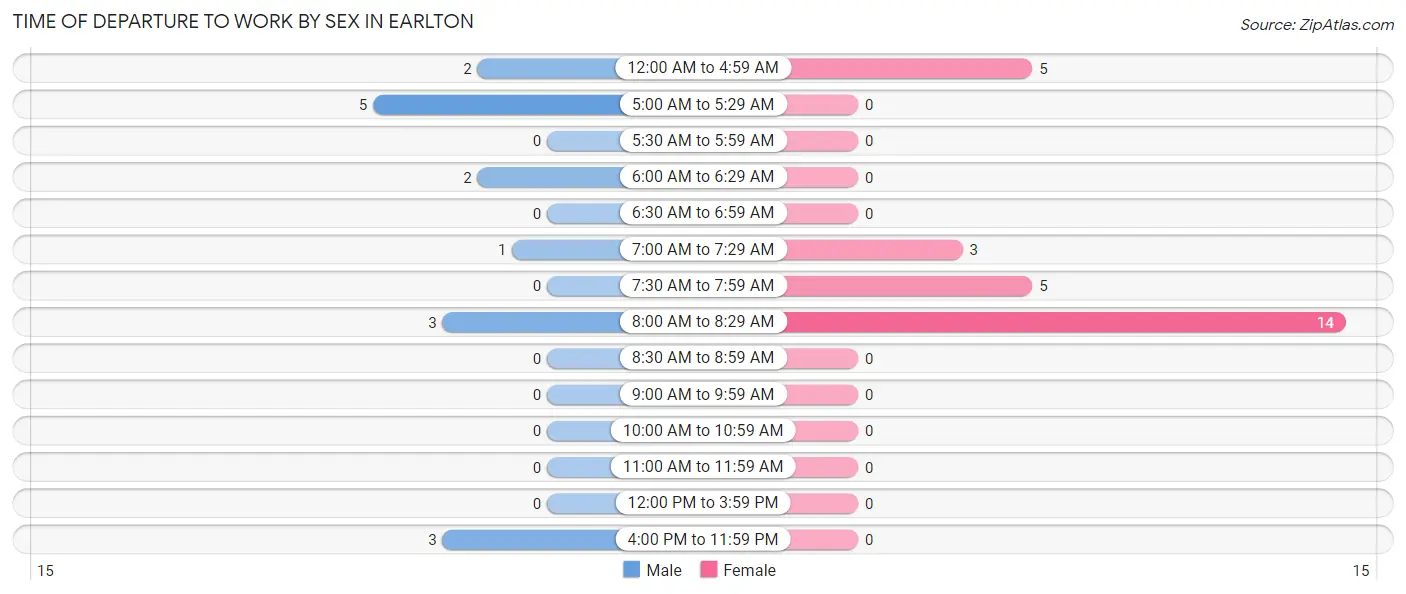
| Time of Departure | Male | Female |
| 12:00 AM to 4:59 AM | 2 (12.5%) | 5 (18.5%) |
| 5:00 AM to 5:29 AM | 5 (31.2%) | 0 (0.0%) |
| 5:30 AM to 5:59 AM | 0 (0.0%) | 0 (0.0%) |
| 6:00 AM to 6:29 AM | 2 (12.5%) | 0 (0.0%) |
| 6:30 AM to 6:59 AM | 0 (0.0%) | 0 (0.0%) |
| 7:00 AM to 7:29 AM | 1 (6.2%) | 3 (11.1%) |
| 7:30 AM to 7:59 AM | 0 (0.0%) | 5 (18.5%) |
| 8:00 AM to 8:29 AM | 3 (18.8%) | 14 (51.8%) |
| 8:30 AM to 8:59 AM | 0 (0.0%) | 0 (0.0%) |
| 9:00 AM to 9:59 AM | 0 (0.0%) | 0 (0.0%) |
| 10:00 AM to 10:59 AM | 0 (0.0%) | 0 (0.0%) |
| 11:00 AM to 11:59 AM | 0 (0.0%) | 0 (0.0%) |
| 12:00 PM to 3:59 PM | 0 (0.0%) | 0 (0.0%) |
| 4:00 PM to 11:59 PM | 3 (18.8%) | 0 (0.0%) |
| Total | 16 (100.0%) | 27 (100.0%) |
Housing Occupancy in Earlton
Occupancy by Ownership in Earlton
Of the total 38 dwellings in Earlton, owner-occupied units account for 38 (100.0%), while renter-occupied units make up 0 (0.0%).
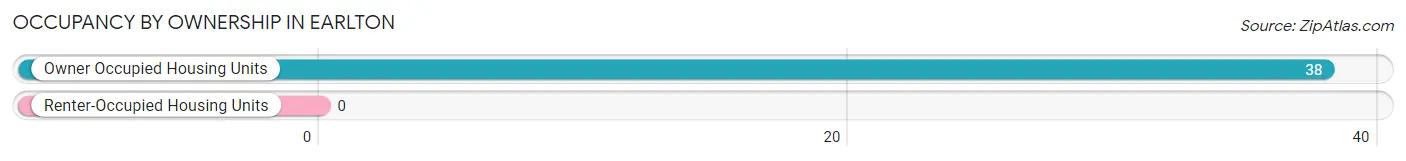
| Occupancy | # Housing Units | % Housing Units |
| Owner Occupied Housing Units | 38 | 100.0% |
| Renter-Occupied Housing Units | 0 | 0.0% |
| Total Occupied Housing Units | 38 | 100.0% |
Occupancy by Household Size in Earlton
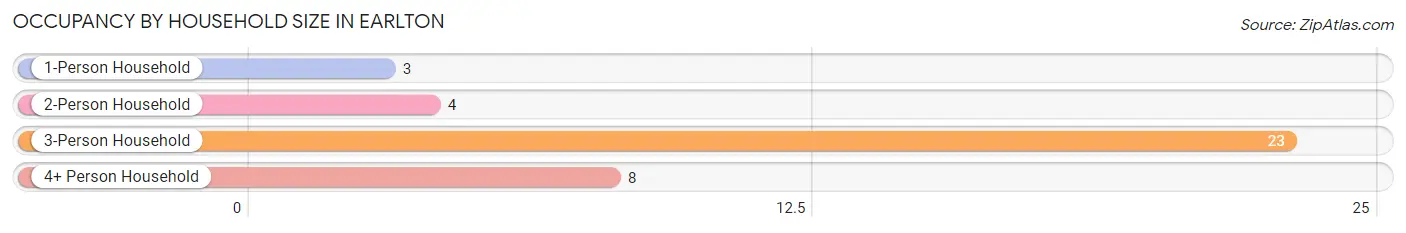
| Household Size | # Housing Units | % Housing Units |
| 1-Person Household | 3 | 7.9% |
| 2-Person Household | 4 | 10.5% |
| 3-Person Household | 23 | 60.5% |
| 4+ Person Household | 8 | 21.0% |
| Total Housing Units | 38 | 100.0% |
Occupancy by Ownership by Household Size in Earlton
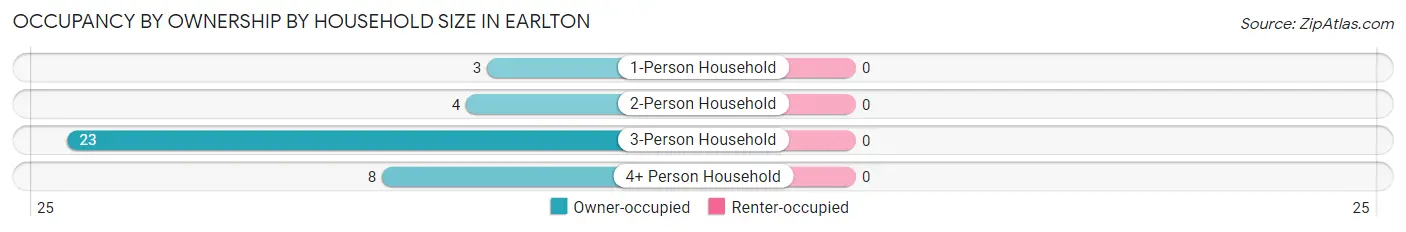
| Household Size | Owner-occupied | Renter-occupied |
| 1-Person Household | 3 (100.0%) | 0 (0.0%) |
| 2-Person Household | 4 (100.0%) | 0 (0.0%) |
| 3-Person Household | 23 (100.0%) | 0 (0.0%) |
| 4+ Person Household | 8 (100.0%) | 0 (0.0%) |
| Total Housing Units | 38 (100.0%) | 0 (0.0%) |
Occupancy by Educational Attainment in Earlton
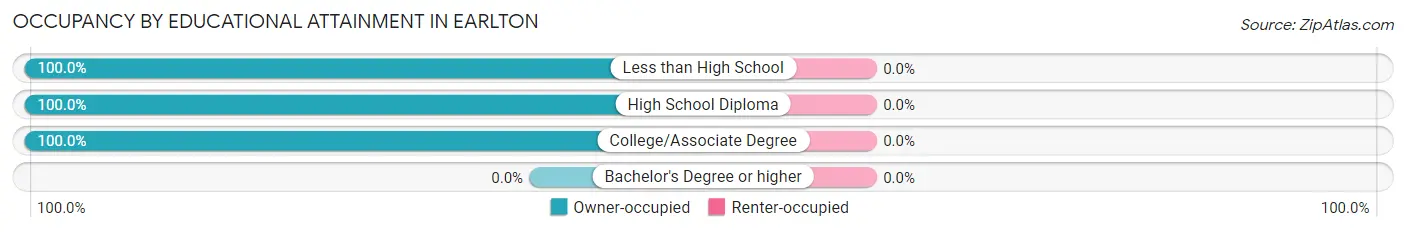
| Household Size | Owner-occupied | Renter-occupied |
| Less than High School | 2 (100.0%) | 0 (0.0%) |
| High School Diploma | 24 (100.0%) | 0 (0.0%) |
| College/Associate Degree | 12 (100.0%) | 0 (0.0%) |
| Bachelor's Degree or higher | 0 (0.0%) | 0 (0.0%) |
Occupancy by Age of Householder in Earlton
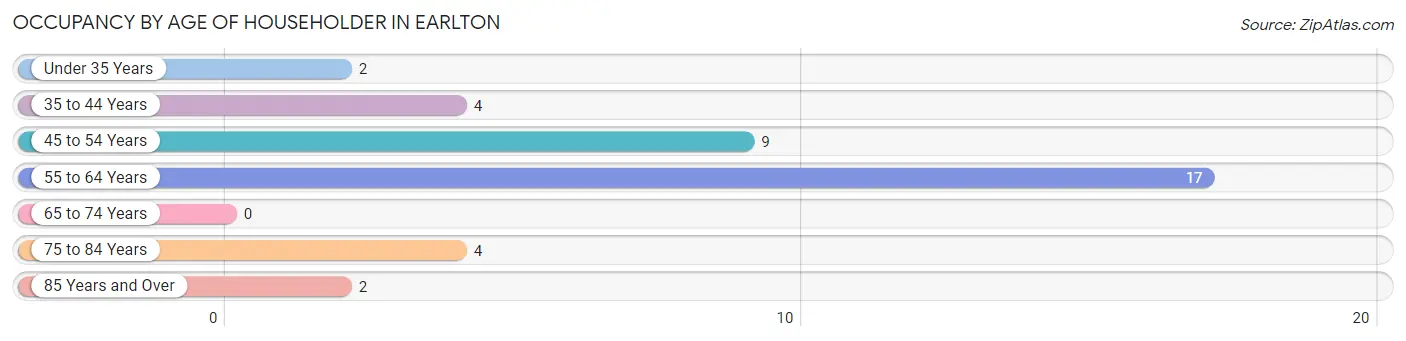
| Age Bracket | # Households | % Households |
| Under 35 Years | 2 | 5.3% |
| 35 to 44 Years | 4 | 10.5% |
| 45 to 54 Years | 9 | 23.7% |
| 55 to 64 Years | 17 | 44.7% |
| 65 to 74 Years | 0 | 0.0% |
| 75 to 84 Years | 4 | 10.5% |
| 85 Years and Over | 2 | 5.3% |
| Total | 38 | 100.0% |
Housing Finances in Earlton
Median Income by Occupancy in Earlton
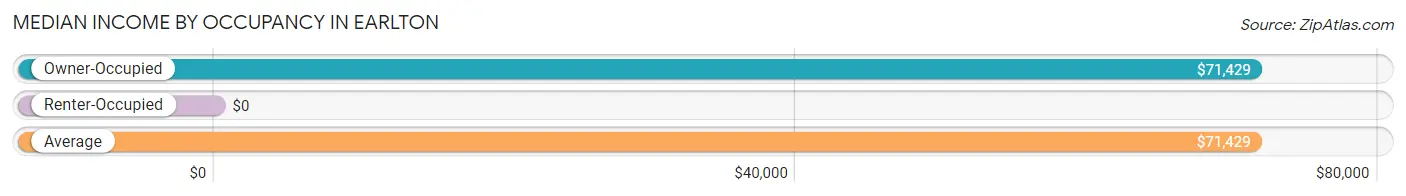
| Occupancy Type | # Households | Median Income |
| Owner-Occupied | 38 (100.0%) | $71,429 |
| Renter-Occupied | 0 (0.0%) | $0 |
| Average | 38 (100.0%) | $71,429 |
Occupancy by Householder Income Bracket in Earlton
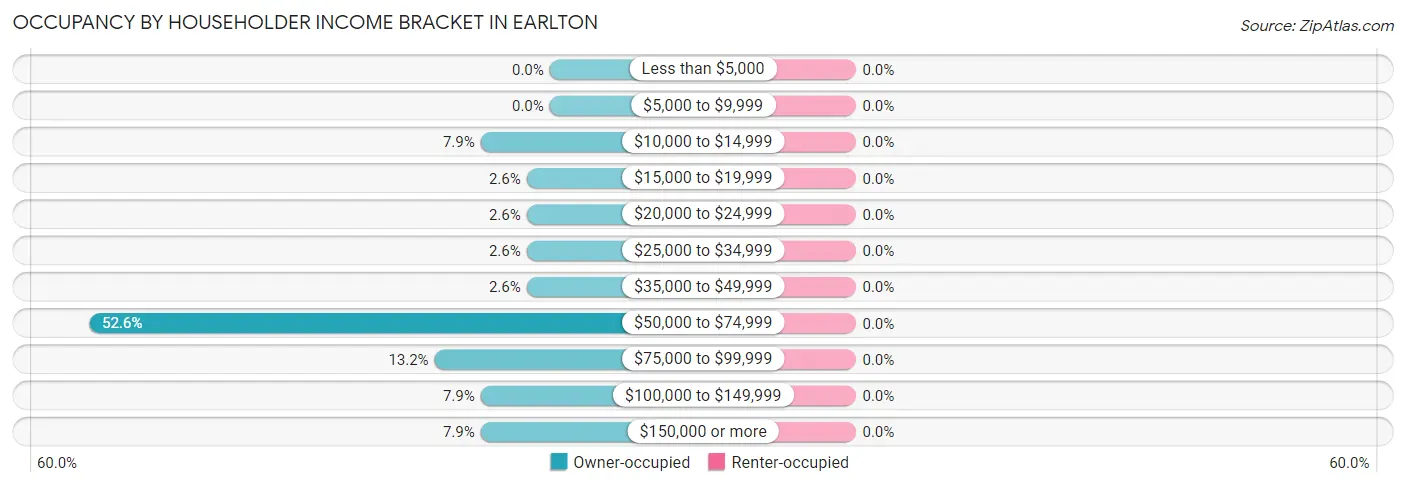
| Income Bracket | Owner-occupied | Renter-occupied |
| Less than $5,000 | 0 (0.0%) | 0 (0.0%) |
| $5,000 to $9,999 | 0 (0.0%) | 0 (0.0%) |
| $10,000 to $14,999 | 3 (7.9%) | 0 (0.0%) |
| $15,000 to $19,999 | 1 (2.6%) | 0 (0.0%) |
| $20,000 to $24,999 | 1 (2.6%) | 0 (0.0%) |
| $25,000 to $34,999 | 1 (2.6%) | 0 (0.0%) |
| $35,000 to $49,999 | 1 (2.6%) | 0 (0.0%) |
| $50,000 to $74,999 | 20 (52.6%) | 0 (0.0%) |
| $75,000 to $99,999 | 5 (13.2%) | 0 (0.0%) |
| $100,000 to $149,999 | 3 (7.9%) | 0 (0.0%) |
| $150,000 or more | 3 (7.9%) | 0 (0.0%) |
| Total | 38 (100.0%) | 0 (0.0%) |
Monthly Housing Cost Tiers in Earlton
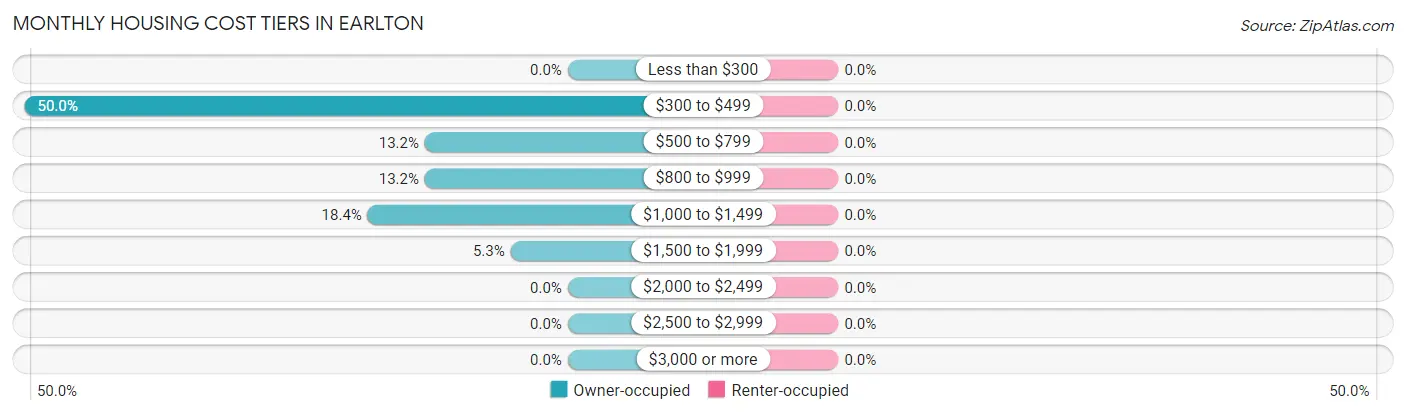
| Monthly Cost | Owner-occupied | Renter-occupied |
| Less than $300 | 0 (0.0%) | 0 (0.0%) |
| $300 to $499 | 19 (50.0%) | 0 (0.0%) |
| $500 to $799 | 5 (13.2%) | 0 (0.0%) |
| $800 to $999 | 5 (13.2%) | 0 (0.0%) |
| $1,000 to $1,499 | 7 (18.4%) | 0 (0.0%) |
| $1,500 to $1,999 | 2 (5.3%) | 0 (0.0%) |
| $2,000 to $2,499 | 0 (0.0%) | 0 (0.0%) |
| $2,500 to $2,999 | 0 (0.0%) | 0 (0.0%) |
| $3,000 or more | 0 (0.0%) | 0 (0.0%) |
| Total | 38 (100.0%) | 0 (0.0%) |
Physical Housing Characteristics in Earlton
Housing Structures in Earlton

| Structure Type | # Housing Units | % Housing Units |
| Single Unit, Detached | 27 | 71.1% |
| Single Unit, Attached | 0 | 0.0% |
| 2 Unit Apartments | 0 | 0.0% |
| 3 or 4 Unit Apartments | 0 | 0.0% |
| 5 to 9 Unit Apartments | 0 | 0.0% |
| 10 or more Apartments | 0 | 0.0% |
| Mobile Home / Other | 11 | 28.9% |
| Total | 38 | 100.0% |
Housing Structures by Occupancy in Earlton
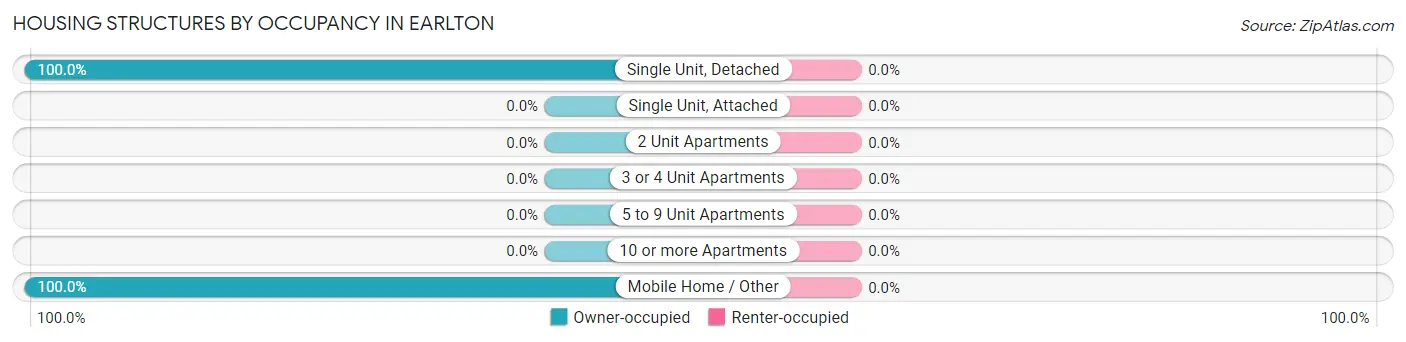
| Structure Type | Owner-occupied | Renter-occupied |
| Single Unit, Detached | 27 (100.0%) | 0 (0.0%) |
| Single Unit, Attached | 0 (0.0%) | 0 (0.0%) |
| 2 Unit Apartments | 0 (0.0%) | 0 (0.0%) |
| 3 or 4 Unit Apartments | 0 (0.0%) | 0 (0.0%) |
| 5 to 9 Unit Apartments | 0 (0.0%) | 0 (0.0%) |
| 10 or more Apartments | 0 (0.0%) | 0 (0.0%) |
| Mobile Home / Other | 11 (100.0%) | 0 (0.0%) |
| Total | 38 (100.0%) | 0 (0.0%) |
Housing Structures by Number of Rooms in Earlton
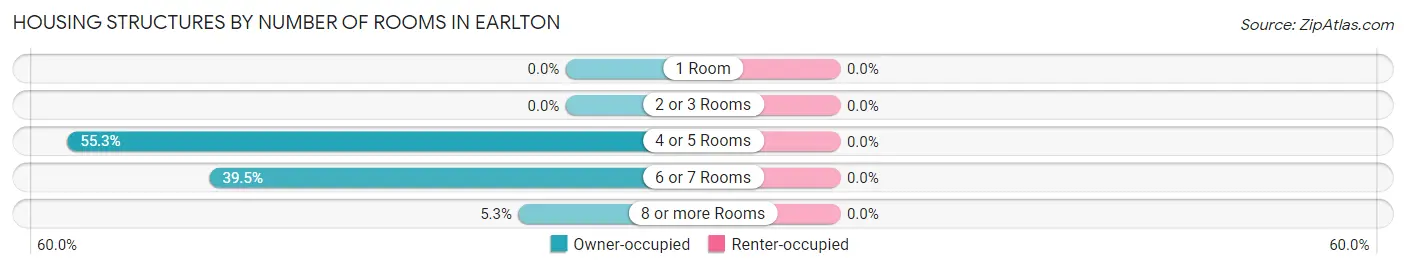
| Number of Rooms | Owner-occupied | Renter-occupied |
| 1 Room | 0 (0.0%) | 0 (0.0%) |
| 2 or 3 Rooms | 0 (0.0%) | 0 (0.0%) |
| 4 or 5 Rooms | 21 (55.3%) | 0 (0.0%) |
| 6 or 7 Rooms | 15 (39.5%) | 0 (0.0%) |
| 8 or more Rooms | 2 (5.3%) | 0 (0.0%) |
| Total | 38 (100.0%) | 0 (0.0%) |
Housing Structure by Heating Type in Earlton
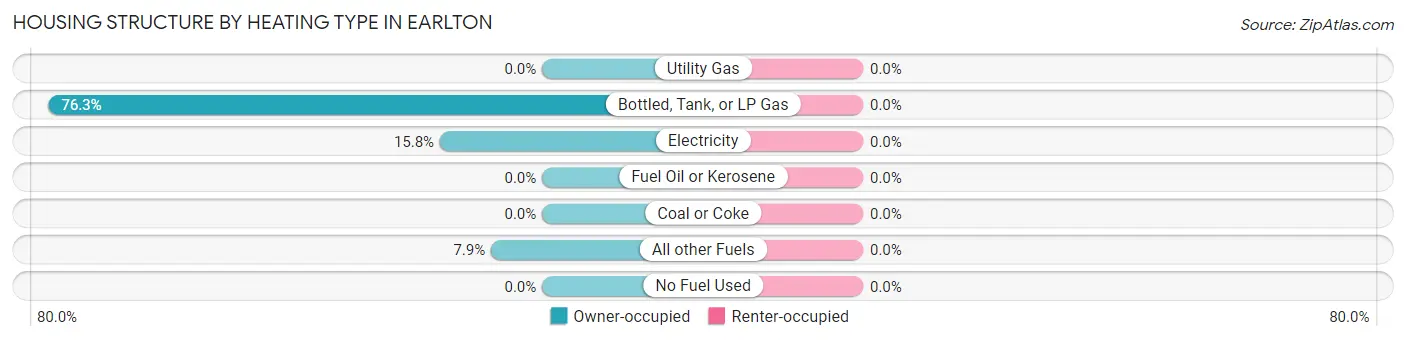
| Heating Type | Owner-occupied | Renter-occupied |
| Utility Gas | 0 (0.0%) | 0 (0.0%) |
| Bottled, Tank, or LP Gas | 29 (76.3%) | 0 (0.0%) |
| Electricity | 6 (15.8%) | 0 (0.0%) |
| Fuel Oil or Kerosene | 0 (0.0%) | 0 (0.0%) |
| Coal or Coke | 0 (0.0%) | 0 (0.0%) |
| All other Fuels | 3 (7.9%) | 0 (0.0%) |
| No Fuel Used | 0 (0.0%) | 0 (0.0%) |
| Total | 38 (100.0%) | 0 (0.0%) |
Household Vehicle Usage in Earlton
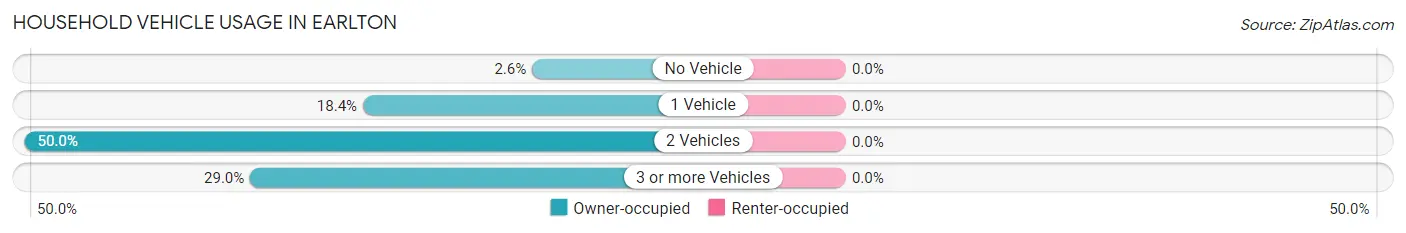
| Vehicles per Household | Owner-occupied | Renter-occupied |
| No Vehicle | 1 (2.6%) | 0 (0.0%) |
| 1 Vehicle | 7 (18.4%) | 0 (0.0%) |
| 2 Vehicles | 19 (50.0%) | 0 (0.0%) |
| 3 or more Vehicles | 11 (28.9%) | 0 (0.0%) |
| Total | 38 (100.0%) | 0 (0.0%) |
Real Estate & Mortgages in Earlton
Real Estate and Mortgage Overview in Earlton
| Characteristic | Without Mortgage | With Mortgage |
| Housing Units | 25 | 13 |
| Median Property Value | $36,600 | $102,500 |
| Median Household Income | $70,804 | $0 |
| Monthly Housing Costs | $462 | $0 |
| Real Estate Taxes | $664 | $0 |
Property Value by Mortgage Status in Earlton
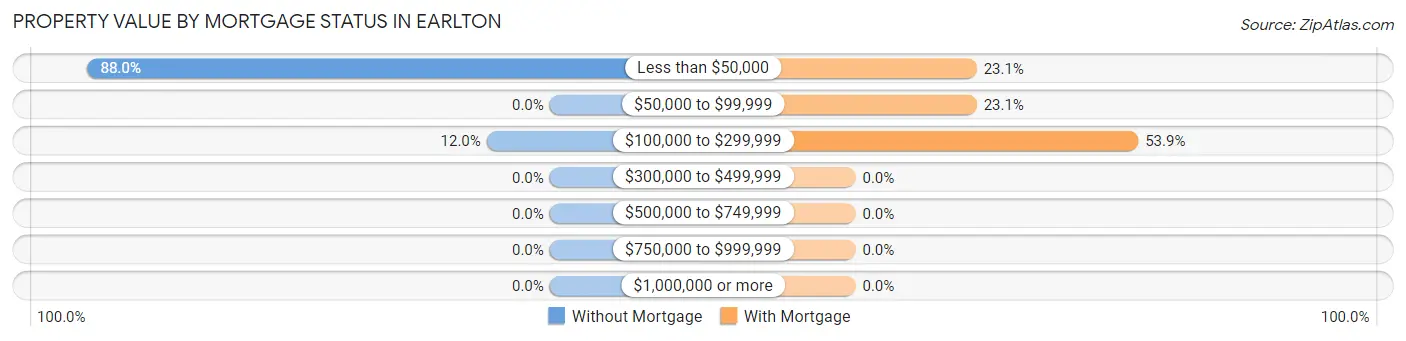
| Property Value | Without Mortgage | With Mortgage |
| Less than $50,000 | 22 (88.0%) | 3 (23.1%) |
| $50,000 to $99,999 | 0 (0.0%) | 3 (23.1%) |
| $100,000 to $299,999 | 3 (12.0%) | 7 (53.8%) |
| $300,000 to $499,999 | 0 (0.0%) | 0 (0.0%) |
| $500,000 to $749,999 | 0 (0.0%) | 0 (0.0%) |
| $750,000 to $999,999 | 0 (0.0%) | 0 (0.0%) |
| $1,000,000 or more | 0 (0.0%) | 0 (0.0%) |
| Total | 25 (100.0%) | 13 (100.0%) |
Household Income by Mortgage Status in Earlton
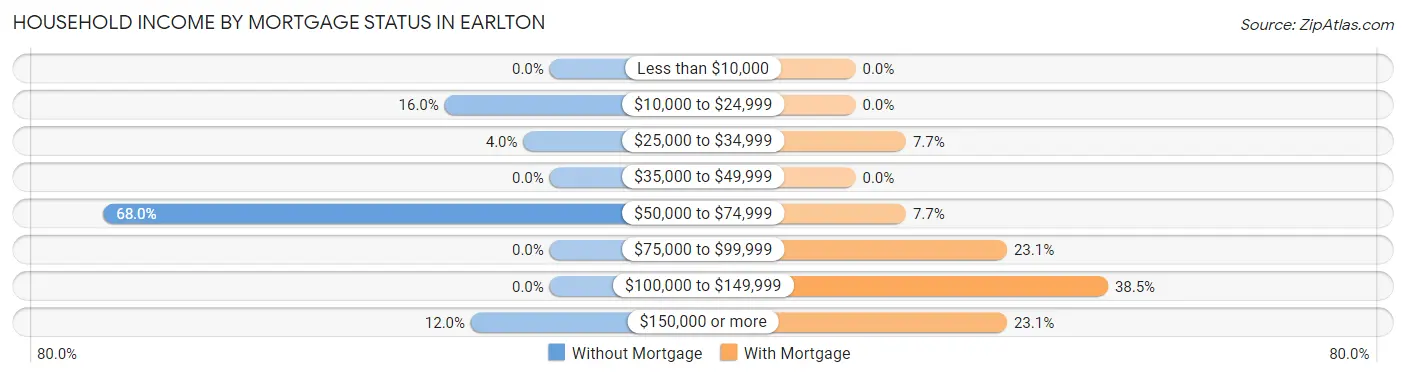
| Household Income | Without Mortgage | With Mortgage |
| Less than $10,000 | 0 (0.0%) | 0 (0.0%) |
| $10,000 to $24,999 | 4 (16.0%) | 0 (0.0%) |
| $25,000 to $34,999 | 1 (4.0%) | 1 (7.7%) |
| $35,000 to $49,999 | 0 (0.0%) | 0 (0.0%) |
| $50,000 to $74,999 | 17 (68.0%) | 1 (7.7%) |
| $75,000 to $99,999 | 0 (0.0%) | 3 (23.1%) |
| $100,000 to $149,999 | 0 (0.0%) | 5 (38.5%) |
| $150,000 or more | 3 (12.0%) | 3 (23.1%) |
| Total | 25 (100.0%) | 13 (100.0%) |
Property Value to Household Income Ratio in Earlton
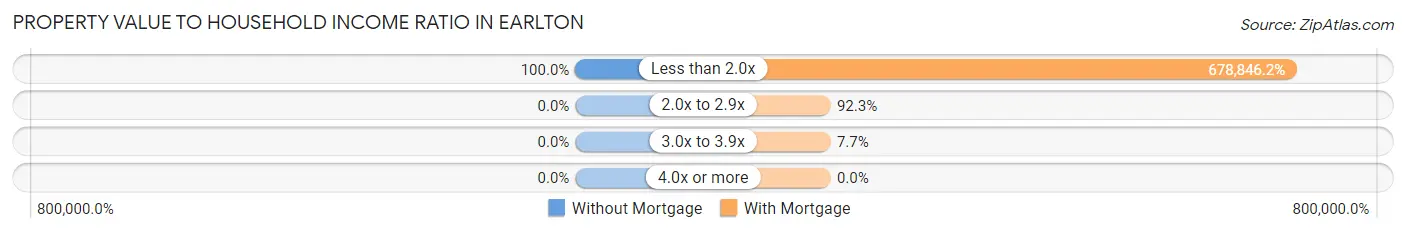
| Value-to-Income Ratio | Without Mortgage | With Mortgage |
| Less than 2.0x | 25 (100.0%) | 88,250 (678,846.2%) |
| 2.0x to 2.9x | 0 (0.0%) | 12 (92.3%) |
| 3.0x to 3.9x | 0 (0.0%) | 1 (7.7%) |
| 4.0x or more | 0 (0.0%) | 0 (0.0%) |
| Total | 25 (100.0%) | 13 (100.0%) |
Real Estate Taxes by Mortgage Status in Earlton
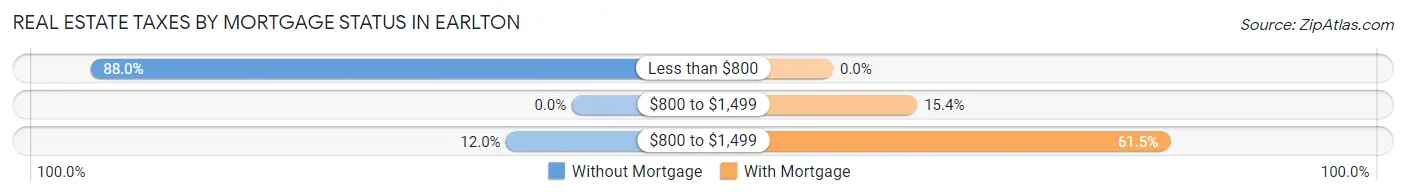
| Property Taxes | Without Mortgage | With Mortgage |
| Less than $800 | 22 (88.0%) | 0 (0.0%) |
| $800 to $1,499 | 0 (0.0%) | 2 (15.4%) |
| $800 to $1,499 | 3 (12.0%) | 8 (61.5%) |
| Total | 25 (100.0%) | 13 (100.0%) |
Health & Disability in Earlton
Health Insurance Coverage by Age in Earlton
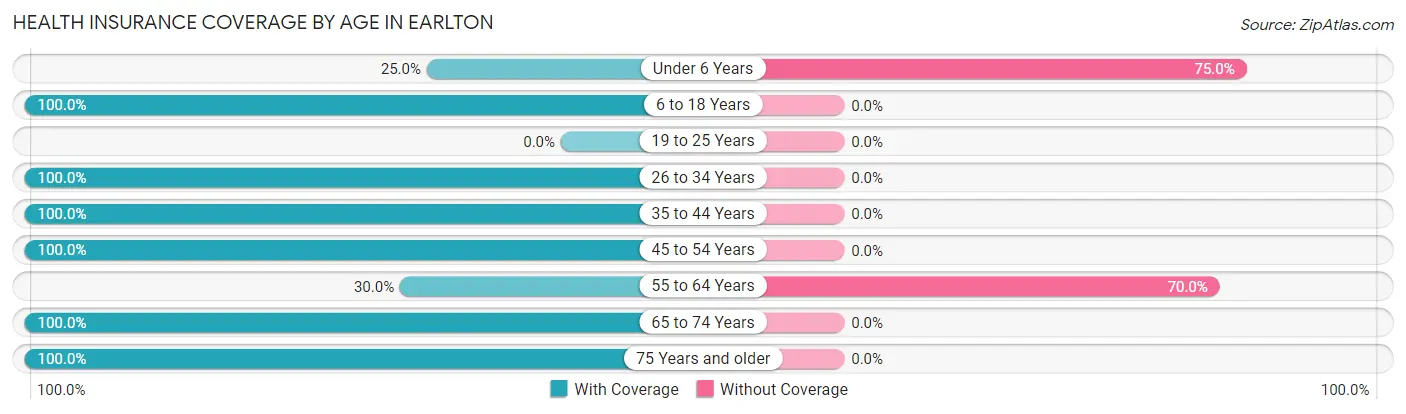
| Age Bracket | With Coverage | Without Coverage |
| Under 6 Years | 2 (25.0%) | 6 (75.0%) |
| 6 to 18 Years | 33 (100.0%) | 0 (0.0%) |
| 19 to 25 Years | 0 (0.0%) | 0 (0.0%) |
| 26 to 34 Years | 20 (100.0%) | 0 (0.0%) |
| 35 to 44 Years | 10 (100.0%) | 0 (0.0%) |
| 45 to 54 Years | 22 (100.0%) | 0 (0.0%) |
| 55 to 64 Years | 6 (30.0%) | 14 (70.0%) |
| 65 to 74 Years | 1 (100.0%) | 0 (0.0%) |
| 75 Years and older | 10 (100.0%) | 0 (0.0%) |
| Total | 104 (83.9%) | 20 (16.1%) |
Health Insurance Coverage by Citizenship Status in Earlton
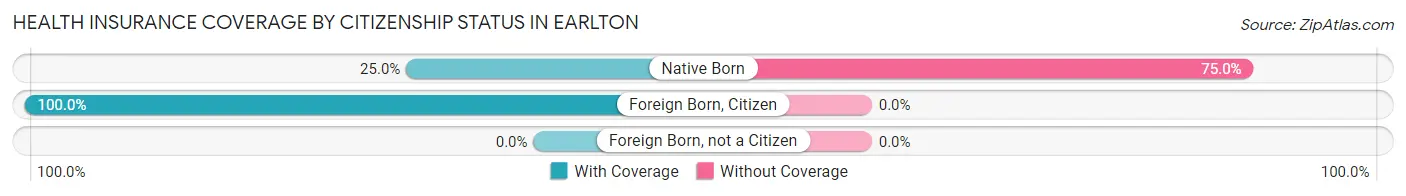
| Citizenship Status | With Coverage | Without Coverage |
| Native Born | 2 (25.0%) | 6 (75.0%) |
| Foreign Born, Citizen | 33 (100.0%) | 0 (0.0%) |
| Foreign Born, not a Citizen | 0 (0.0%) | 0 (0.0%) |
Health Insurance Coverage by Household Income in Earlton
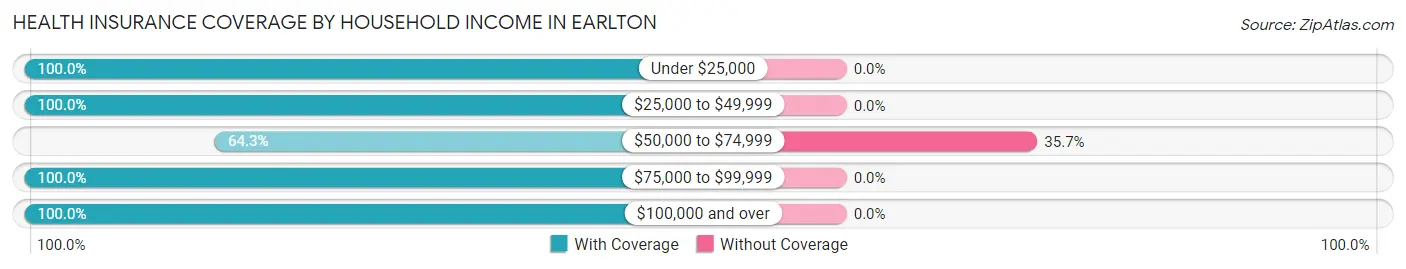
| Household Income | With Coverage | Without Coverage |
| Under $25,000 | 8 (100.0%) | 0 (0.0%) |
| $25,000 to $49,999 | 5 (100.0%) | 0 (0.0%) |
| $50,000 to $74,999 | 36 (64.3%) | 20 (35.7%) |
| $75,000 to $99,999 | 31 (100.0%) | 0 (0.0%) |
| $100,000 and over | 24 (100.0%) | 0 (0.0%) |
Public vs Private Health Insurance Coverage by Age in Earlton
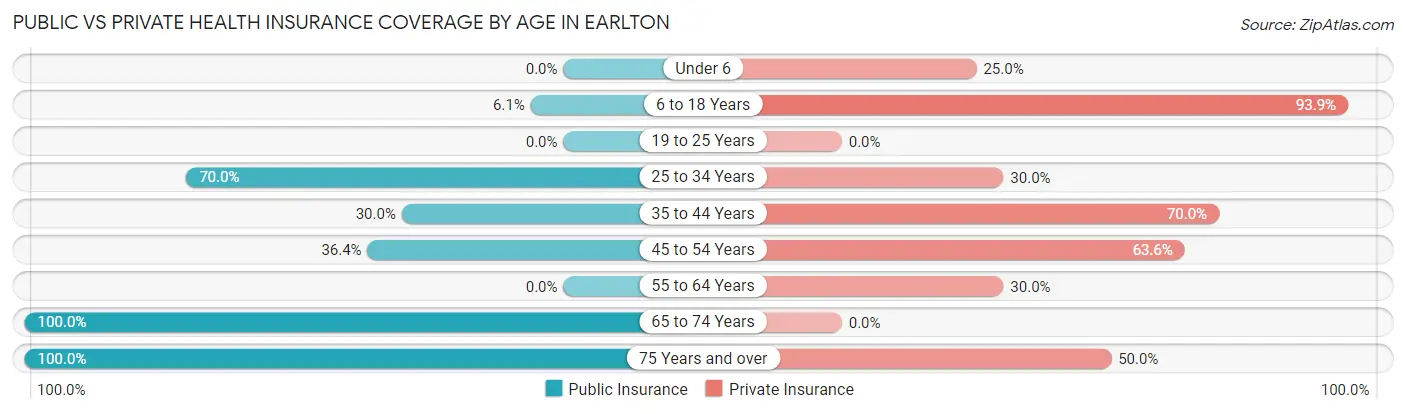
| Age Bracket | Public Insurance | Private Insurance |
| Under 6 | 0 (0.0%) | 2 (25.0%) |
| 6 to 18 Years | 2 (6.1%) | 31 (93.9%) |
| 19 to 25 Years | 0 (0.0%) | 0 (0.0%) |
| 25 to 34 Years | 14 (70.0%) | 6 (30.0%) |
| 35 to 44 Years | 3 (30.0%) | 7 (70.0%) |
| 45 to 54 Years | 8 (36.4%) | 14 (63.6%) |
| 55 to 64 Years | 0 (0.0%) | 6 (30.0%) |
| 65 to 74 Years | 1 (100.0%) | 0 (0.0%) |
| 75 Years and over | 10 (100.0%) | 5 (50.0%) |
| Total | 38 (30.6%) | 71 (57.3%) |
Disability Status by Sex by Age in Earlton
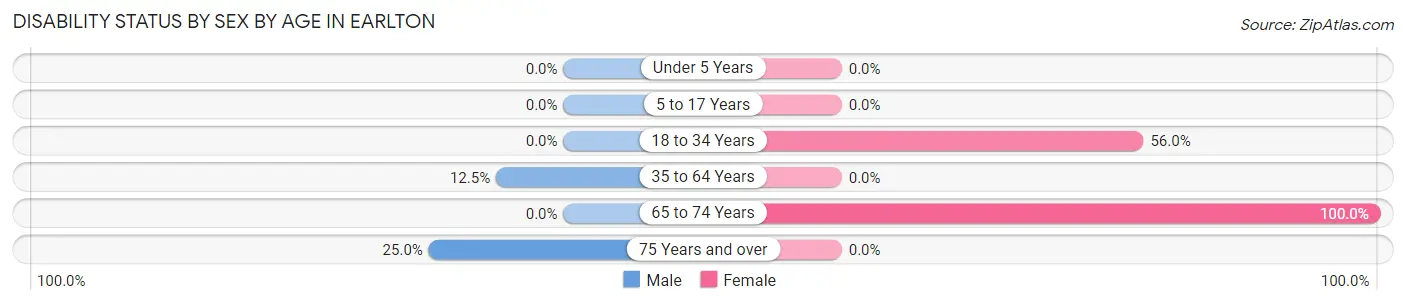
| Age Bracket | Male | Female |
| Under 5 Years | 0 (0.0%) | 0 (0.0%) |
| 5 to 17 Years | 0 (0.0%) | 0 (0.0%) |
| 18 to 34 Years | 0 (0.0%) | 14 (56.0%) |
| 35 to 64 Years | 3 (12.5%) | 0 (0.0%) |
| 65 to 74 Years | 0 (0.0%) | 1 (100.0%) |
| 75 Years and over | 1 (25.0%) | 0 (0.0%) |
Disability Class by Sex by Age in Earlton
Disability Class: Hearing Difficulty
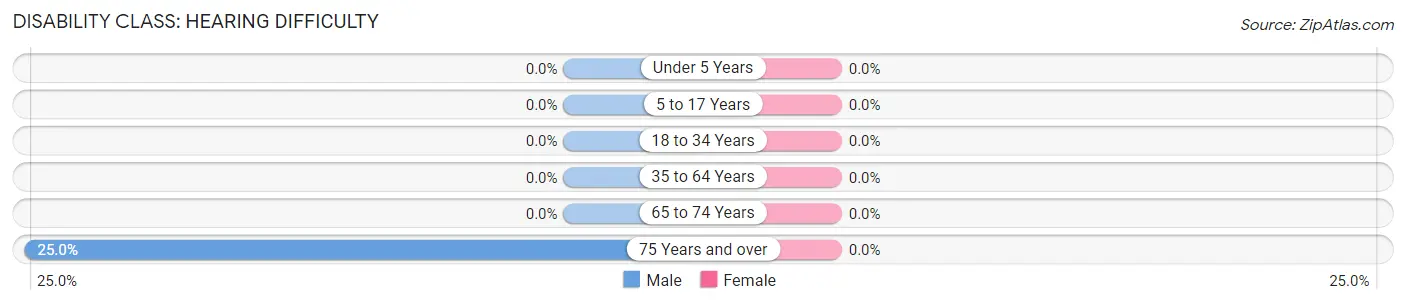
| Age Bracket | Male | Female |
| Under 5 Years | 0 (0.0%) | 0 (0.0%) |
| 5 to 17 Years | 0 (0.0%) | 0 (0.0%) |
| 18 to 34 Years | 0 (0.0%) | 0 (0.0%) |
| 35 to 64 Years | 0 (0.0%) | 0 (0.0%) |
| 65 to 74 Years | 0 (0.0%) | 0 (0.0%) |
| 75 Years and over | 1 (25.0%) | 0 (0.0%) |
Disability Class: Vision Difficulty
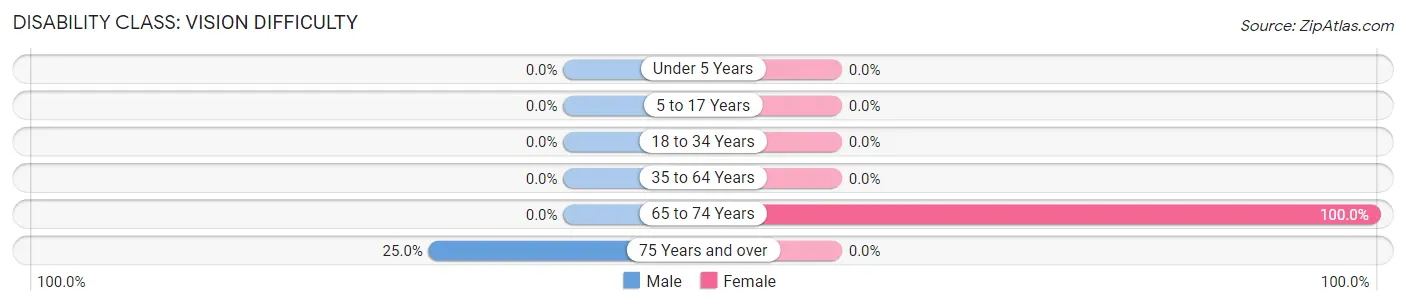
| Age Bracket | Male | Female |
| Under 5 Years | 0 (0.0%) | 0 (0.0%) |
| 5 to 17 Years | 0 (0.0%) | 0 (0.0%) |
| 18 to 34 Years | 0 (0.0%) | 0 (0.0%) |
| 35 to 64 Years | 0 (0.0%) | 0 (0.0%) |
| 65 to 74 Years | 0 (0.0%) | 1 (100.0%) |
| 75 Years and over | 1 (25.0%) | 0 (0.0%) |
Disability Class: Cognitive Difficulty
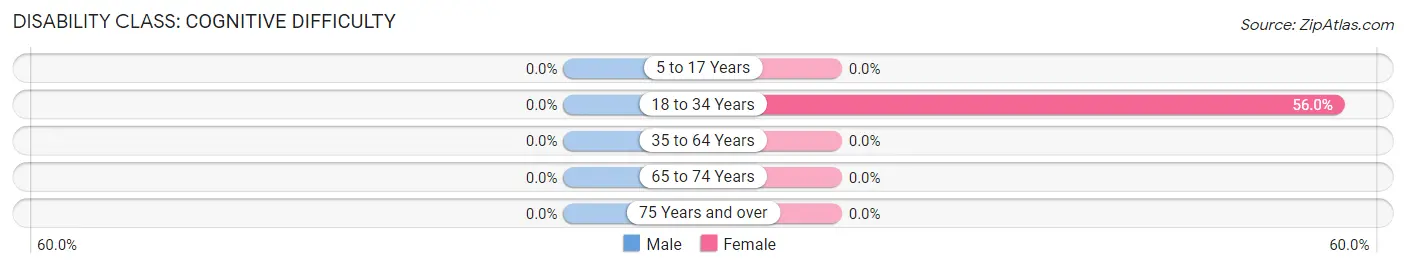
| Age Bracket | Male | Female |
| 5 to 17 Years | 0 (0.0%) | 0 (0.0%) |
| 18 to 34 Years | 0 (0.0%) | 14 (56.0%) |
| 35 to 64 Years | 0 (0.0%) | 0 (0.0%) |
| 65 to 74 Years | 0 (0.0%) | 0 (0.0%) |
| 75 Years and over | 0 (0.0%) | 0 (0.0%) |
Disability Class: Ambulatory Difficulty
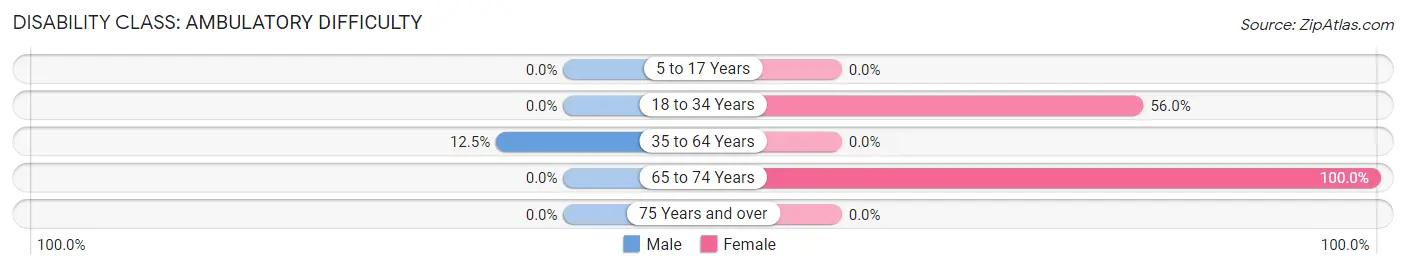
| Age Bracket | Male | Female |
| 5 to 17 Years | 0 (0.0%) | 0 (0.0%) |
| 18 to 34 Years | 0 (0.0%) | 14 (56.0%) |
| 35 to 64 Years | 3 (12.5%) | 0 (0.0%) |
| 65 to 74 Years | 0 (0.0%) | 1 (100.0%) |
| 75 Years and over | 0 (0.0%) | 0 (0.0%) |
Disability Class: Self-Care Difficulty
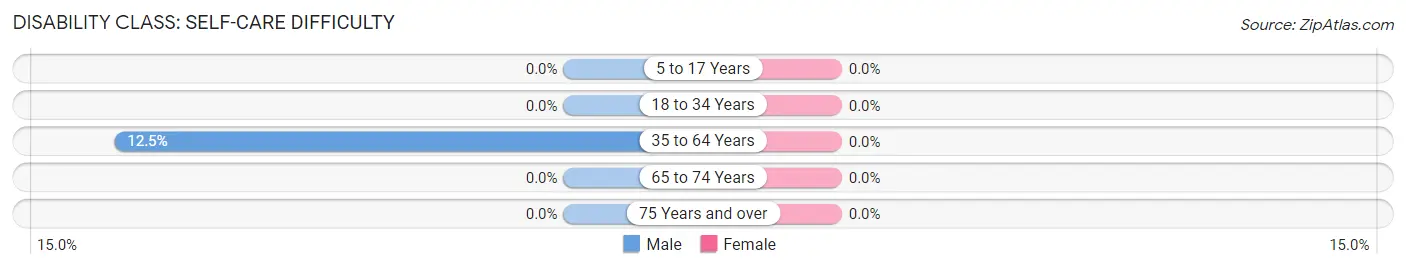
| Age Bracket | Male | Female |
| 5 to 17 Years | 0 (0.0%) | 0 (0.0%) |
| 18 to 34 Years | 0 (0.0%) | 0 (0.0%) |
| 35 to 64 Years | 3 (12.5%) | 0 (0.0%) |
| 65 to 74 Years | 0 (0.0%) | 0 (0.0%) |
| 75 Years and over | 0 (0.0%) | 0 (0.0%) |
Technology Access in Earlton
Computing Device Access in Earlton
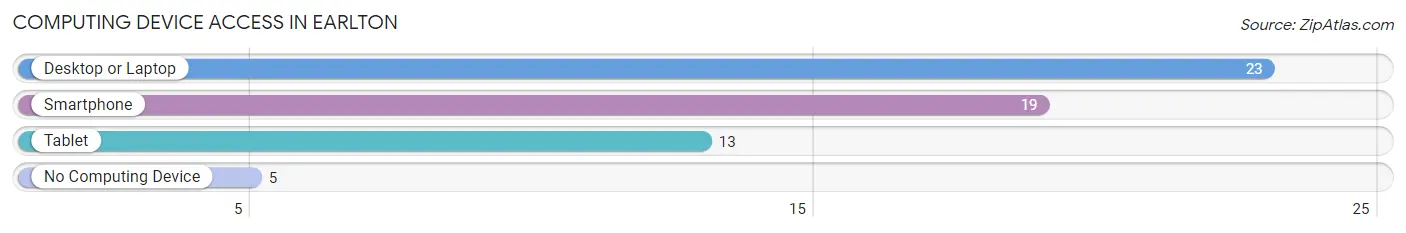
| Device Type | # Households | % Households |
| Desktop or Laptop | 23 | 60.5% |
| Smartphone | 19 | 50.0% |
| Tablet | 13 | 34.2% |
| No Computing Device | 5 | 13.2% |
| Total | 38 | 100.0% |
Internet Access in Earlton
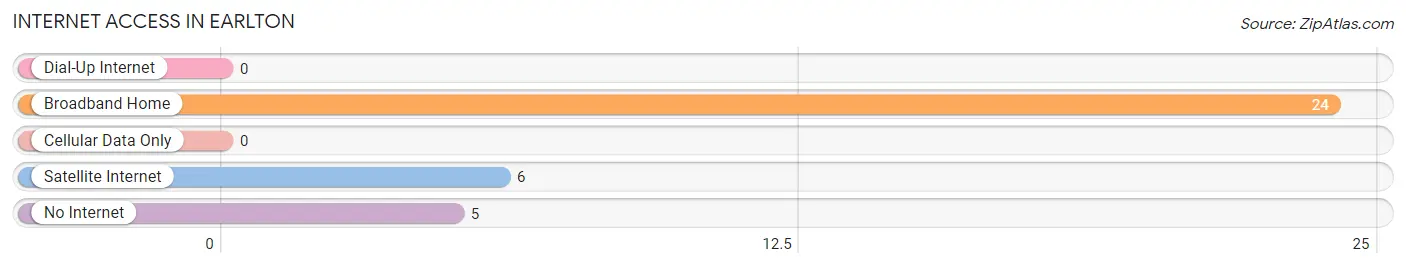
| Internet Type | # Households | % Households |
| Dial-Up Internet | 0 | 0.0% |
| Broadband Home | 24 | 63.2% |
| Cellular Data Only | 0 | 0.0% |
| Satellite Internet | 6 | 15.8% |
| No Internet | 5 | 13.2% |
| Total | 38 | 100.0% |
Earlton Summary
Earlton is a small town located in the state of Kansas, in the United States. It is situated in the southeastern corner of the state, in the county of Greenwood. The town has a population of just over 500 people, and is located about 25 miles south of the city of Wichita.
History
Earlton was founded in 1887 by a group of settlers from the nearby town of El Dorado. The town was named after the Earl family, who were among the first settlers. The town was originally a farming community, and the main crops grown were wheat, corn, and oats. In the early 1900s, the town began to grow and develop, and by the 1920s, it had become a thriving community.
In the 1950s, Earlton began to experience a decline in population, as many of the younger residents moved away to larger cities. However, in the late 1970s, the town began to experience a resurgence, as new businesses and industries began to move into the area. Today, Earlton is a small but vibrant community, with a variety of businesses and services.
Geography
Earlton is located in the southeastern corner of Kansas, in the county of Greenwood. The town is situated on the banks of the Arkansas River, and is surrounded by rolling hills and farmland. The town is located about 25 miles south of the city of Wichita, and is about an hour and a half drive from the state capital of Topeka.
The climate in Earlton is typical of the Midwest, with hot summers and cold winters. The average temperature in the summer months is around 80 degrees Fahrenheit, while in the winter months it can drop to as low as 20 degrees. The town receives an average of about 30 inches of rain per year, and is prone to occasional severe weather, such as tornadoes and thunderstorms.
Economy
Earlton’s economy is largely based on agriculture, with the main crops being wheat, corn, and oats. The town also has a number of small businesses, including a grocery store, a hardware store, and a few restaurants. In recent years, the town has seen an increase in tourism, as visitors come to explore the area’s natural beauty and enjoy the small-town atmosphere.
Demographics
As of the 2010 census, the population of Earlton was 514 people. The racial makeup of the town was 95.3% White, 0.6% African American, 0.4% Native American, 0.2% Asian, and 3.5% from other races. The median household income was $37,500, and the median age was 40 years.
Conclusion
Earlton is a small town located in the southeastern corner of Kansas. It has a population of just over 500 people, and is known for its agricultural economy and small-town atmosphere. The town has experienced a resurgence in recent years, as new businesses and industries have moved into the area. The town is also a popular tourist destination, as visitors come to explore the area’s natural beauty and enjoy the small-town atmosphere.
Common Questions
What is Per Capita Income in Earlton?
Per Capita income in Earlton is $23,308.
What is the Median Family Income in Earlton?
Median Family Income in Earlton is $71,696.
What is the Median Household income in Earlton?
Median Household Income in Earlton is $71,429.
What is Inequality or Gini Index in Earlton?
Inequality or Gini Index in Earlton is 0.28.
What is the Total Population of Earlton?
Total Population of Earlton is 124.
What is the Total Male Population of Earlton?
Total Male Population of Earlton is 46.
What is the Total Female Population of Earlton?
Total Female Population of Earlton is 78.
What is the Ratio of Males per 100 Females in Earlton?
There are 58.97 Males per 100 Females in Earlton.
What is the Ratio of Females per 100 Males in Earlton?
There are 169.57 Females per 100 Males in Earlton.
What is the Median Population Age in Earlton?
Median Population Age in Earlton is 35.5 Years.
What is the Average Family Size in Earlton
Average Family Size in Earlton is 3.4 People.
What is the Average Household Size in Earlton
Average Household Size in Earlton is 3.3 People.
How Large is the Labor Force in Earlton?
There are 46 People in the Labor Forcein in Earlton.
What is the Percentage of People in the Labor Force in Earlton?
50.0% of People are in the Labor Force in Earlton.