Labette, KS Map & Demographics
Labette Map
Labette Overview
$25,405
PER CAPITA INCOME
$61,875
AVG FAMILY INCOME
$60,625
AVG HOUSEHOLD INCOME
0.28
INEQUALITY / GINI INDEX
22
TOTAL POPULATION
10
MALE POPULATION
12
FEMALE POPULATION
83.33
MALES / 100 FEMALES
120.00
FEMALES / 100 MALES
69.5
MEDIAN AGE
2.2
AVG FAMILY SIZE
2.0
AVG HOUSEHOLD SIZE
9
LABOR FORCE [ PEOPLE ]
40.9%
PERCENT IN LABOR FORCE
Income in Labette
Income Overview in Labette
Per Capita Income in Labette is $25,405, while median incomes of families and households are $61,875 and $60,625 respectively.
| Characteristic | Number | Measure |
| Per Capita Income | 22 | $25,405 |
| Median Family Income | 9 | $61,875 |
| Mean Family Income | 9 | $60,133 |
| Median Household Income | 11 | $60,625 |
| Mean Household Income | 11 | $50,809 |
| Income Deficit | 9 | $0 |
| Wage / Income Gap (%) | 22 | 0.00% |
| Wage / Income Gap ($) | 22 | 100.00¢ per $1 |
| Gini / Inequality Index | 22 | 0.28 |
Earnings by Sex in Labette
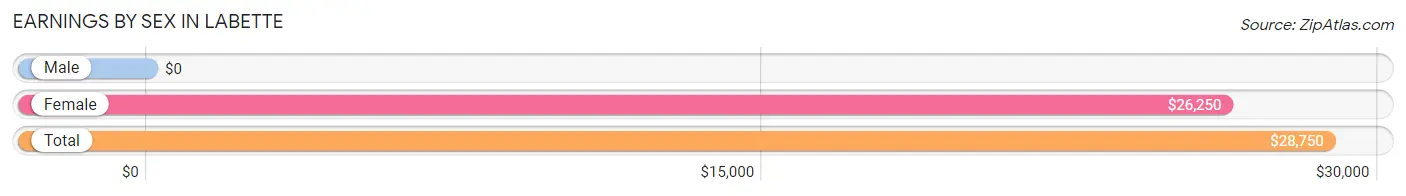
| Sex | Number | Average Earnings |
| Male | 5 (45.5%) | $0 |
| Female | 6 (54.5%) | $26,250 |
| Total | 11 (100.0%) | $28,750 |
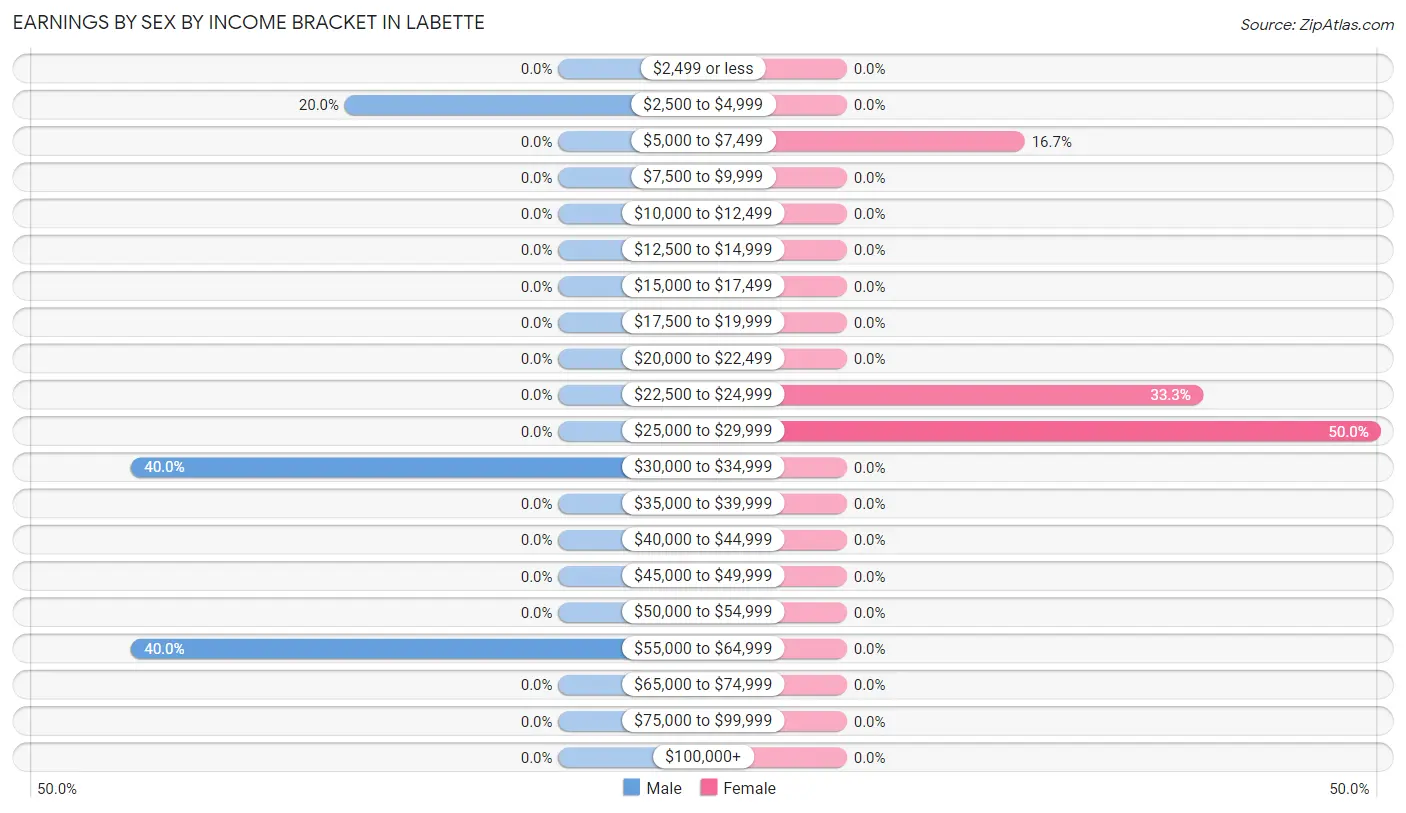
Earnings by Sex by Income Bracket in Labette
The most common earnings brackets in Labette are $30,000 to $34,999 for men (2 | 40.0%) and $25,000 to $29,999 for women (3 | 50.0%).
| Income | Male | Female |
| $2,499 or less | 0 (0.0%) | 0 (0.0%) |
| $2,500 to $4,999 | 1 (20.0%) | 0 (0.0%) |
| $5,000 to $7,499 | 0 (0.0%) | 1 (16.7%) |
| $7,500 to $9,999 | 0 (0.0%) | 0 (0.0%) |
| $10,000 to $12,499 | 0 (0.0%) | 0 (0.0%) |
| $12,500 to $14,999 | 0 (0.0%) | 0 (0.0%) |
| $15,000 to $17,499 | 0 (0.0%) | 0 (0.0%) |
| $17,500 to $19,999 | 0 (0.0%) | 0 (0.0%) |
| $20,000 to $22,499 | 0 (0.0%) | 0 (0.0%) |
| $22,500 to $24,999 | 0 (0.0%) | 2 (33.3%) |
| $25,000 to $29,999 | 0 (0.0%) | 3 (50.0%) |
| $30,000 to $34,999 | 2 (40.0%) | 0 (0.0%) |
| $35,000 to $39,999 | 0 (0.0%) | 0 (0.0%) |
| $40,000 to $44,999 | 0 (0.0%) | 0 (0.0%) |
| $45,000 to $49,999 | 0 (0.0%) | 0 (0.0%) |
| $50,000 to $54,999 | 0 (0.0%) | 0 (0.0%) |
| $55,000 to $64,999 | 2 (40.0%) | 0 (0.0%) |
| $65,000 to $74,999 | 0 (0.0%) | 0 (0.0%) |
| $75,000 to $99,999 | 0 (0.0%) | 0 (0.0%) |
| $100,000+ | 0 (0.0%) | 0 (0.0%) |
| Total | 5 (100.0%) | 6 (100.0%) |
Earnings by Sex by Educational Attainment in Labette
| Educational Attainment | Male Income | Female Income |
| Less than High School | - | - |
| High School Diploma | - | - |
| College or Associate's Degree | - | - |
| Bachelor's Degree | - | - |
| Graduate Degree | - | - |
| Total | - | - |
Family Income in Labette
Family Income Brackets in Labette
According to the Labette family income data, there are 4 families falling into the $50,000 to $74,999 income range, which is the most common income bracket and makes up 44.4% of all families.
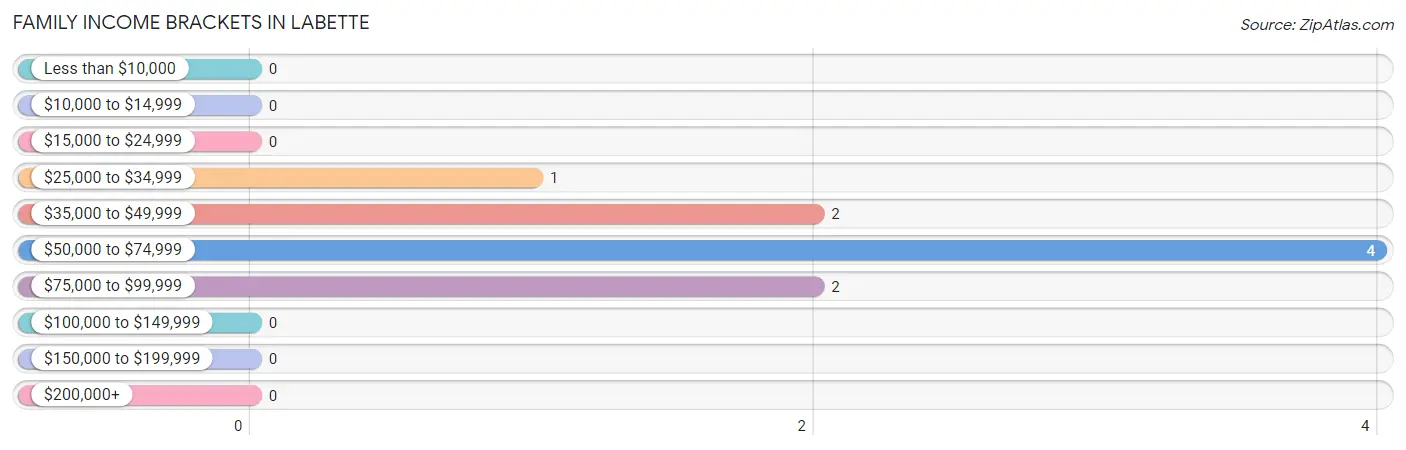
| Income Bracket | # Families | % Families |
| Less than $10,000 | 0 | 0.0% |
| $10,000 to $14,999 | 0 | 0.0% |
| $15,000 to $24,999 | 0 | 0.0% |
| $25,000 to $34,999 | 1 | 11.1% |
| $35,000 to $49,999 | 2 | 22.2% |
| $50,000 to $74,999 | 4 | 44.4% |
| $75,000 to $99,999 | 2 | 22.2% |
| $100,000 to $149,999 | 0 | 0.0% |
| $150,000 to $199,999 | 0 | 0.0% |
| $200,000+ | 0 | 0.0% |
Family Income by Famaliy Size in Labette
2-person families (6 | 66.7%) account for the highest median family income in Labette with $55,000 per family, while 2-person families (6 | 66.7%) have the highest median income of $27,500 per family member.
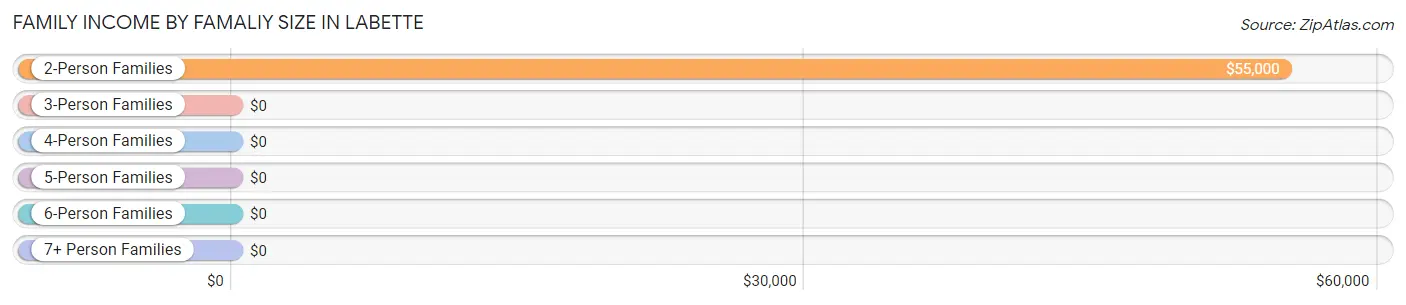
| Income Bracket | # Families | Median Income |
| 2-Person Families | 6 (66.7%) | $55,000 |
| 3-Person Families | 3 (33.3%) | $0 |
| 4-Person Families | 0 (0.0%) | $0 |
| 5-Person Families | 0 (0.0%) | $0 |
| 6-Person Families | 0 (0.0%) | $0 |
| 7+ Person Families | 0 (0.0%) | $0 |
| Total | 9 (100.0%) | $61,875 |
Family Income by Number of Earners in Labette
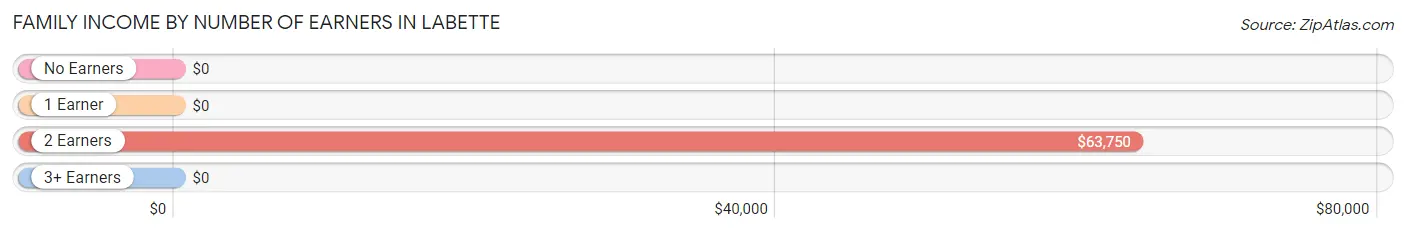
| Number of Earners | # Families | Median Income |
| No Earners | 2 (22.2%) | $0 |
| 1 Earner | 3 (33.3%) | $0 |
| 2 Earners | 4 (44.4%) | $63,750 |
| 3+ Earners | 0 (0.0%) | $0 |
| Total | 9 (100.0%) | $61,875 |
Household Income in Labette
Household Income Brackets in Labette
With 4 households falling in the category, the $50,000 to $74,999 income range is the most frequent in Labette, accounting for 36.4% of all households.
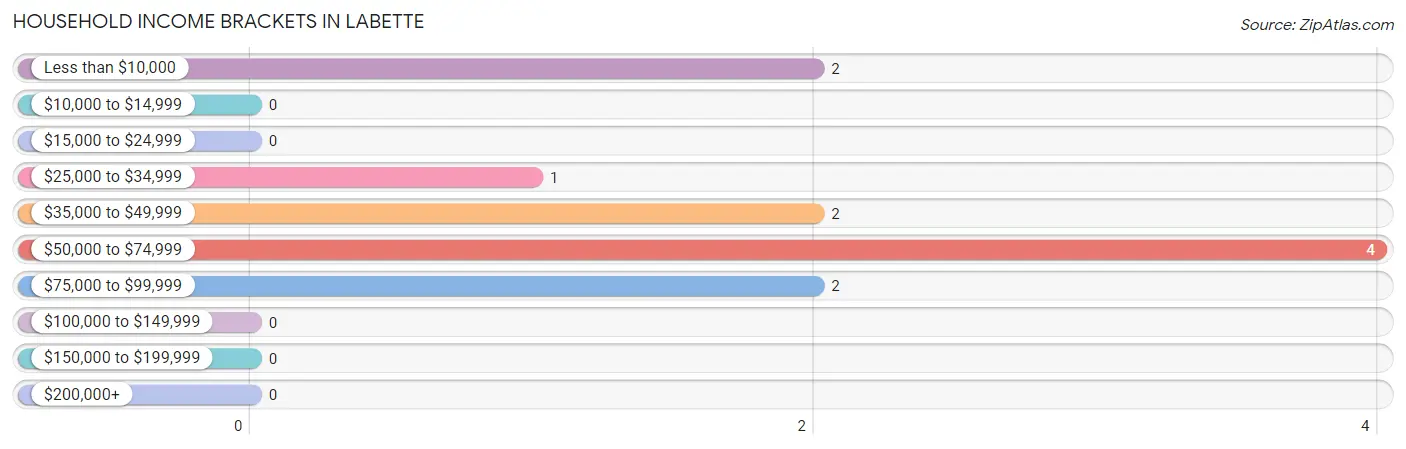
| Income Bracket | # Households | % Households |
| Less than $10,000 | 2 | 18.2% |
| $10,000 to $14,999 | 0 | 0.0% |
| $15,000 to $24,999 | 0 | 0.0% |
| $25,000 to $34,999 | 1 | 9.1% |
| $35,000 to $49,999 | 2 | 18.2% |
| $50,000 to $74,999 | 4 | 36.4% |
| $75,000 to $99,999 | 2 | 18.2% |
| $100,000 to $149,999 | 0 | 0.0% |
| $150,000 to $199,999 | 0 | 0.0% |
| $200,000+ | 0 | 0.0% |
Household Income by Householder Age in Labette
The median household income in Labette is $60,625, with the highest median household income of $47,500 found in the 65+ years age bracket for the primary householder. A total of 8 households (72.7%) fall into this category.
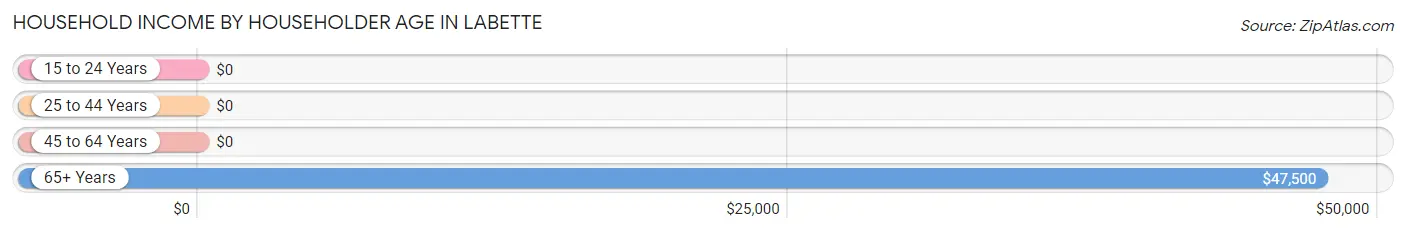
| Income Bracket | # Households | Median Income |
| 15 to 24 Years | 0 (0.0%) | $0 |
| 25 to 44 Years | 2 (18.2%) | $0 |
| 45 to 64 Years | 1 (9.1%) | $0 |
| 65+ Years | 8 (72.7%) | $47,500 |
| Total | 11 (100.0%) | $60,625 |
Poverty in Labette
Income Below Poverty by Sex and Age in Labette
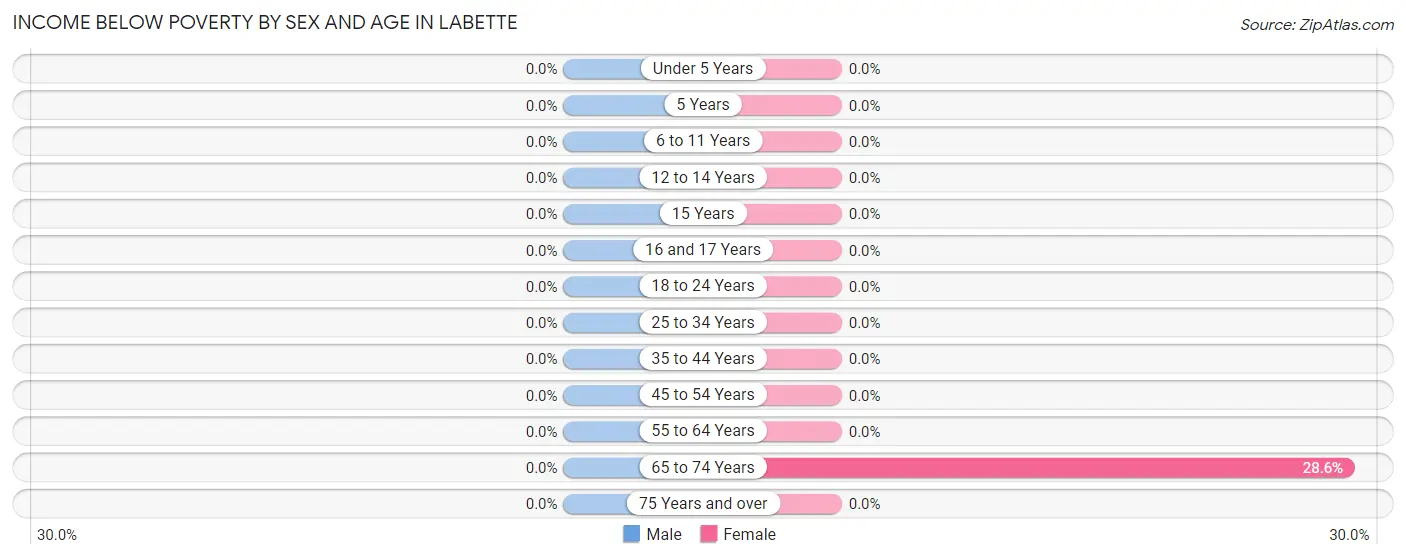
| Age Bracket | Male | Female |
| Under 5 Years | 0 (0.0%) | 0 (0.0%) |
| 5 Years | 0 (0.0%) | 0 (0.0%) |
| 6 to 11 Years | 0 (0.0%) | 0 (0.0%) |
| 12 to 14 Years | 0 (0.0%) | 0 (0.0%) |
| 15 Years | 0 (0.0%) | 0 (0.0%) |
| 16 and 17 Years | 0 (0.0%) | 0 (0.0%) |
| 18 to 24 Years | 0 (0.0%) | 0 (0.0%) |
| 25 to 34 Years | 0 (0.0%) | 0 (0.0%) |
| 35 to 44 Years | 0 (0.0%) | 0 (0.0%) |
| 45 to 54 Years | 0 (0.0%) | 0 (0.0%) |
| 55 to 64 Years | 0 (0.0%) | 0 (0.0%) |
| 65 to 74 Years | 0 (0.0%) | 2 (28.6%) |
| 75 Years and over | 0 (0.0%) | 0 (0.0%) |
| Total | 0 (0.0%) | 2 (16.7%) |
Income Above Poverty by Sex and Age in Labette
According to the poverty statistics in Labette, males aged 16 and 17 years and females aged 25 to 34 years are the age groups that are most secure financially, with 100.0% of males and 100.0% of females in these age groups living above the poverty line.
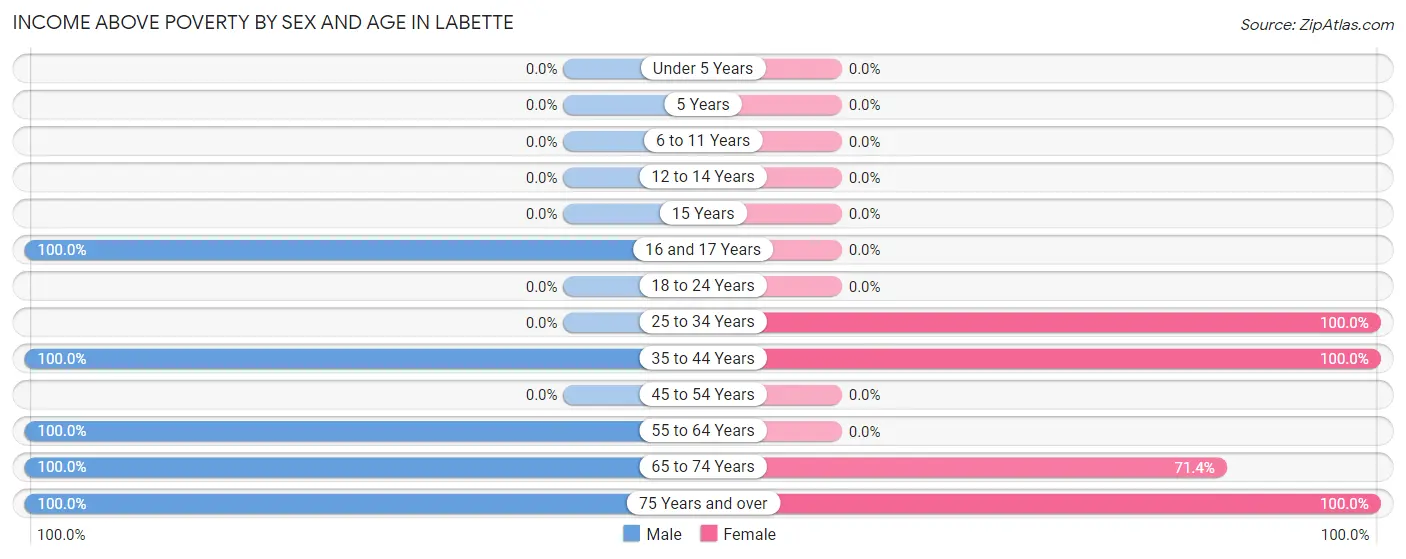
| Age Bracket | Male | Female |
| Under 5 Years | 0 (0.0%) | 0 (0.0%) |
| 5 Years | 0 (0.0%) | 0 (0.0%) |
| 6 to 11 Years | 0 (0.0%) | 0 (0.0%) |
| 12 to 14 Years | 0 (0.0%) | 0 (0.0%) |
| 15 Years | 0 (0.0%) | 0 (0.0%) |
| 16 and 17 Years | 1 (100.0%) | 0 (0.0%) |
| 18 to 24 Years | 0 (0.0%) | 0 (0.0%) |
| 25 to 34 Years | 0 (0.0%) | 1 (100.0%) |
| 35 to 44 Years | 2 (100.0%) | 2 (100.0%) |
| 45 to 54 Years | 0 (0.0%) | 0 (0.0%) |
| 55 to 64 Years | 1 (100.0%) | 0 (0.0%) |
| 65 to 74 Years | 3 (100.0%) | 5 (71.4%) |
| 75 Years and over | 3 (100.0%) | 2 (100.0%) |
| Total | 10 (100.0%) | 10 (83.3%) |
Income Below Poverty Among Married-Couple Families in Labette
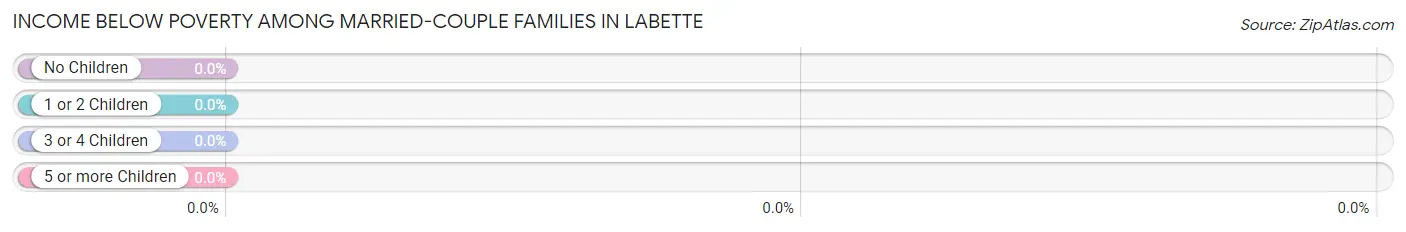
| Children | Above Poverty | Below Poverty |
| No Children | 7 (100.0%) | 0 (0.0%) |
| 1 or 2 Children | 2 (100.0%) | 0 (0.0%) |
| 3 or 4 Children | 0 (0.0%) | 0 (0.0%) |
| 5 or more Children | 0 (0.0%) | 0 (0.0%) |
| Total | 9 (100.0%) | 0 (0.0%) |
Income Below Poverty Among Single-Parent Households in Labette
| Children | Single Father | Single Mother |
| No Children | 0 (0.0%) | 0 (0.0%) |
| 1 or 2 Children | 0 (0.0%) | 0 (0.0%) |
| 3 or 4 Children | 0 (0.0%) | 0 (0.0%) |
| 5 or more Children | 0 (0.0%) | 0 (0.0%) |
| Total | 0 (0.0%) | 0 (0.0%) |
Income Below Poverty Among Married-Couple vs Single-Parent Households in Labette
| Children | Married-Couple Families | Single-Parent Households |
| No Children | 0 (0.0%) | 0 (0.0%) |
| 1 or 2 Children | 0 (0.0%) | 0 (0.0%) |
| 3 or 4 Children | 0 (0.0%) | 0 (0.0%) |
| 5 or more Children | 0 (0.0%) | 0 (0.0%) |
| Total | 0 (0.0%) | 0 (0.0%) |
Race in Labette
The most populous races in Labette are , and White / Caucasian (22 | 100.0%).
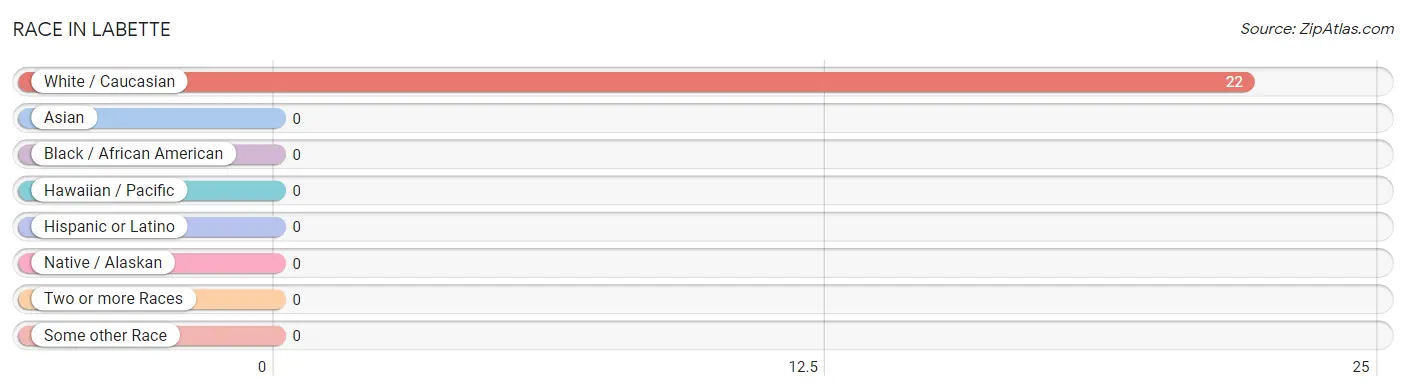
| Race | # Population | % Population |
| Asian | 0 | 0.0% |
| Black / African American | 0 | 0.0% |
| Hawaiian / Pacific | 0 | 0.0% |
| Hispanic or Latino | 0 | 0.0% |
| Native / Alaskan | 0 | 0.0% |
| White / Caucasian | 22 | 100.0% |
| Two or more Races | 0 | 0.0% |
| Some other Race | 0 | 0.0% |
| Total | 22 | 100.0% |
Ancestry in Labette
The most populous ancestries reported in Labette are American (9 | 40.9%), Scotch-Irish (2 | 9.1%), English (1 | 4.5%), Irish (1 | 4.5%), and Norwegian (1 | 4.5%), together accounting for 63.6% of all Labette residents.
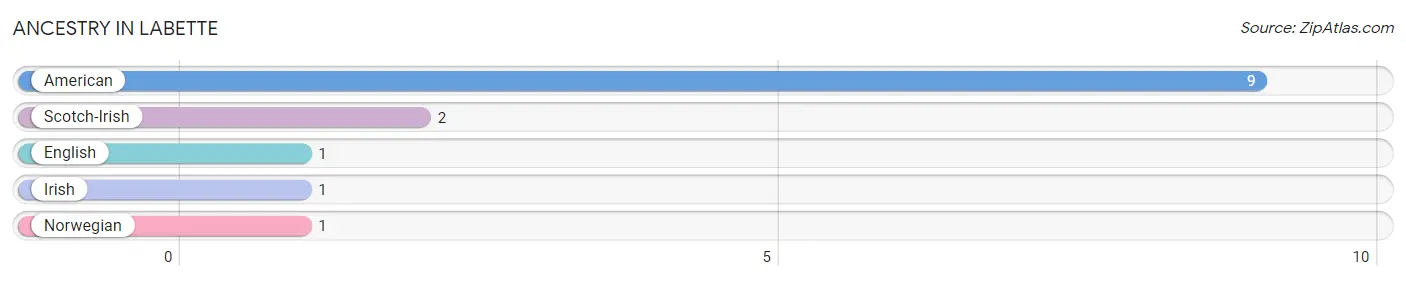
| Ancestry | # Population | % Population |
| American | 9 | 40.9% |
| English | 1 | 4.5% |
| Irish | 1 | 4.5% |
| Norwegian | 1 | 4.5% |
| Scotch-Irish | 2 | 9.1% | View All 5 Rows |
Immigrants in Labette

| Immigration Origin | # Population | % Population | View All 0 Rows |
Sex and Age in Labette
Sex and Age in Labette
The most populous age groups in Labette are 40 to 44 Years (2 | 20.0%) for men and 70 to 74 Years (4 | 33.3%) for women.
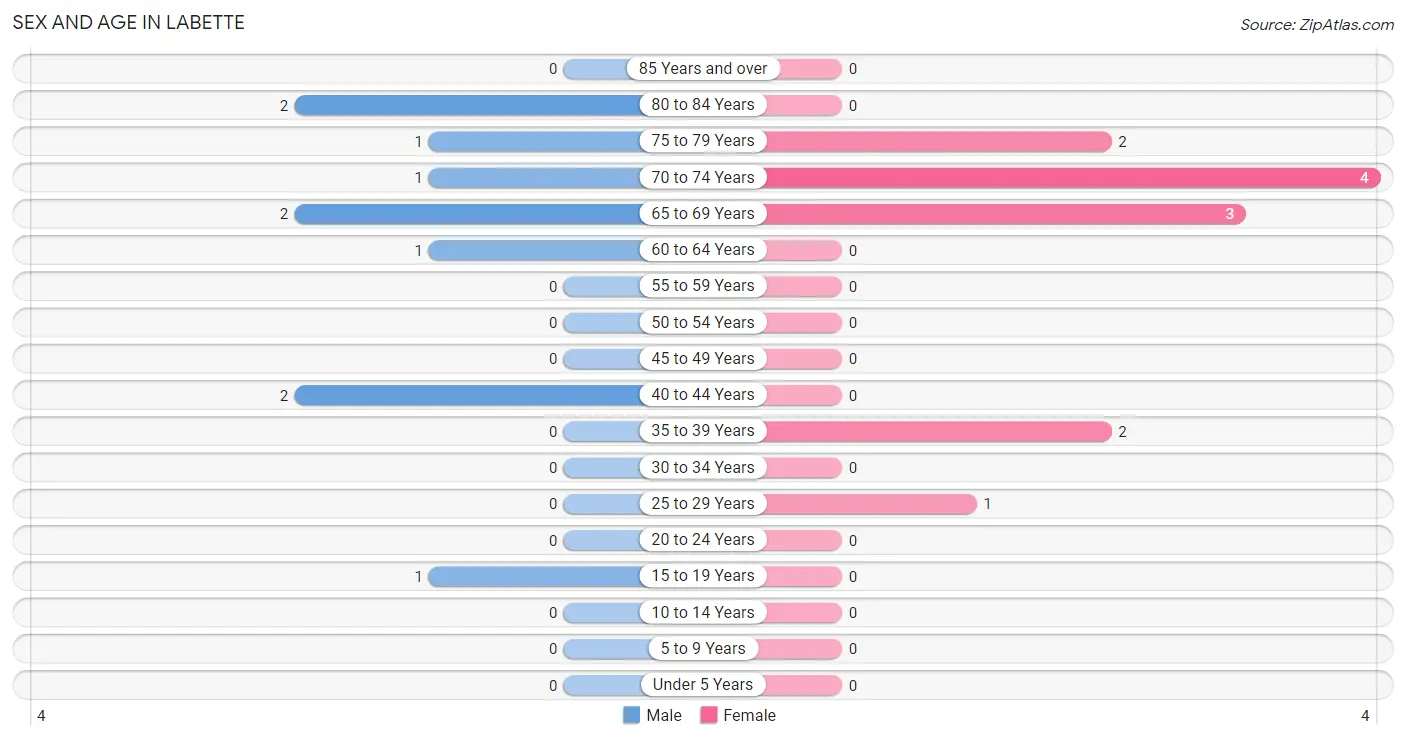
| Age Bracket | Male | Female |
| Under 5 Years | 0 (0.0%) | 0 (0.0%) |
| 5 to 9 Years | 0 (0.0%) | 0 (0.0%) |
| 10 to 14 Years | 0 (0.0%) | 0 (0.0%) |
| 15 to 19 Years | 1 (10.0%) | 0 (0.0%) |
| 20 to 24 Years | 0 (0.0%) | 0 (0.0%) |
| 25 to 29 Years | 0 (0.0%) | 1 (8.3%) |
| 30 to 34 Years | 0 (0.0%) | 0 (0.0%) |
| 35 to 39 Years | 0 (0.0%) | 2 (16.7%) |
| 40 to 44 Years | 2 (20.0%) | 0 (0.0%) |
| 45 to 49 Years | 0 (0.0%) | 0 (0.0%) |
| 50 to 54 Years | 0 (0.0%) | 0 (0.0%) |
| 55 to 59 Years | 0 (0.0%) | 0 (0.0%) |
| 60 to 64 Years | 1 (10.0%) | 0 (0.0%) |
| 65 to 69 Years | 2 (20.0%) | 3 (25.0%) |
| 70 to 74 Years | 1 (10.0%) | 4 (33.3%) |
| 75 to 79 Years | 1 (10.0%) | 2 (16.7%) |
| 80 to 84 Years | 2 (20.0%) | 0 (0.0%) |
| 85 Years and over | 0 (0.0%) | 0 (0.0%) |
| Total | 10 (100.0%) | 12 (100.0%) |
Families and Households in Labette
Median Family Size in Labette
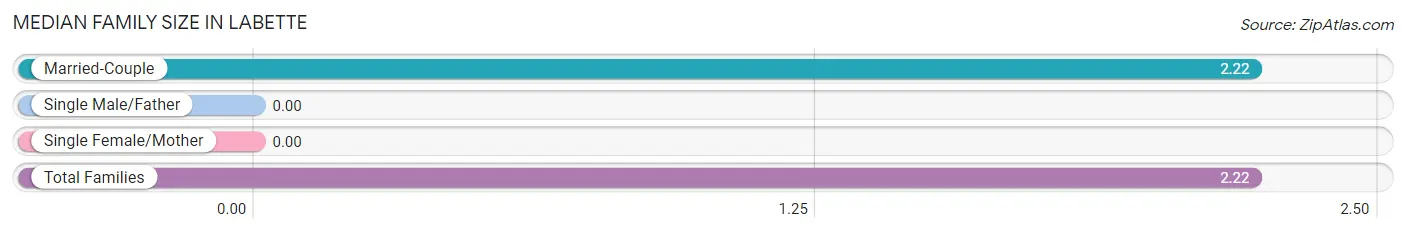
| Family Type | # Families | Family Size |
| Married-Couple | 9 (100.0%) | 2.22 |
| Single Male/Father | 0 (0.0%) | - |
| Single Female/Mother | 0 (0.0%) | - |
| Total Families | 9 (100.0%) | 2.22 |
Median Household Size in Labette
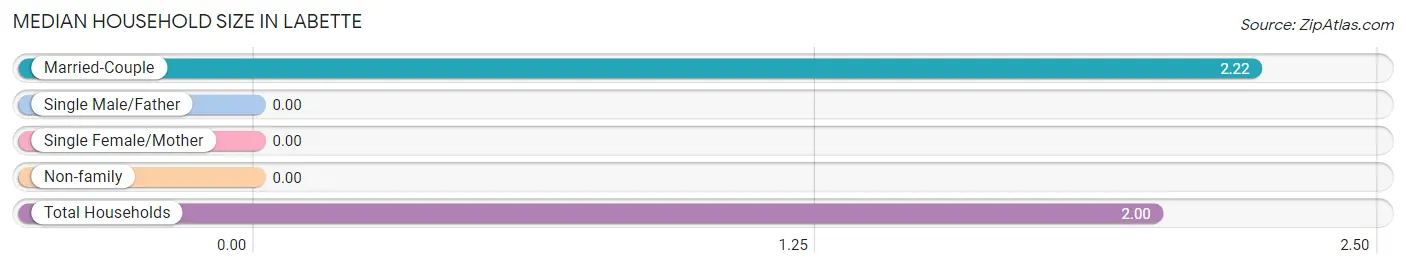
| Household Type | # Households | Household Size |
| Married-Couple | 9 (81.8%) | 2.22 |
| Single Male/Father | 0 (0.0%) | - |
| Single Female/Mother | 0 (0.0%) | - |
| Non-family | 2 (18.2%) | - |
| Total Households | 11 (100.0%) | 2.00 |
Household Size by Marriage Status in Labette
Out of a total of 11 households in Labette, 9 (81.8%) are family households, while 2 (18.2%) are nonfamily households. The most numerous type of family households are 2-person households, comprising 6, and the most common type of nonfamily households are 1-person households, comprising 2.
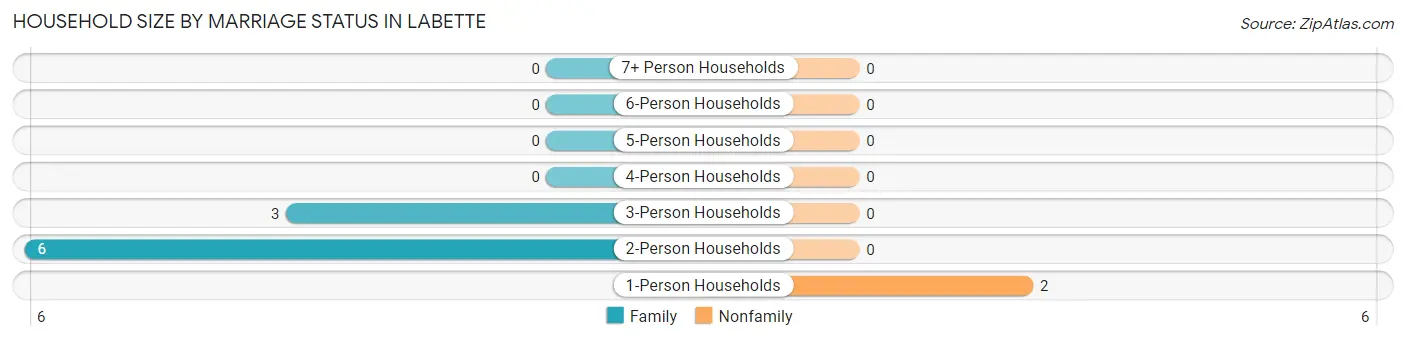
| Household Size | Family Households | Nonfamily Households |
| 1-Person Households | - | 2 (18.2%) |
| 2-Person Households | 6 (54.5%) | 0 (0.0%) |
| 3-Person Households | 3 (27.3%) | 0 (0.0%) |
| 4-Person Households | 0 (0.0%) | 0 (0.0%) |
| 5-Person Households | 0 (0.0%) | 0 (0.0%) |
| 6-Person Households | 0 (0.0%) | 0 (0.0%) |
| 7+ Person Households | 0 (0.0%) | 0 (0.0%) |
| Total | 9 (81.8%) | 2 (18.2%) |
Female Fertility in Labette
Fertility by Age in Labette
| Age Bracket | Women with Births | Births / 1,000 Women |
| 15 to 19 years | 0 (0.0%) | 0.0 |
| 20 to 34 years | 0 (0.0%) | 0.0 |
| 35 to 50 years | 0 (0.0%) | 0.0 |
| Total | 0 (0.0%) | 0.0 |
Fertility by Age by Marriage Status in Labette
| Age Bracket | Married | Unmarried |
| 15 to 19 years | 0 (0.0%) | 0 (0.0%) |
| 20 to 34 years | 0 (0.0%) | 0 (0.0%) |
| 35 to 50 years | 0 (0.0%) | 0 (0.0%) |
| Total | 0 (0.0%) | 0 (0.0%) |
Fertility by Education in Labette
| Educational Attainment | Women with Births | Births / 1,000 Women |
| Less than High School | 0 (0.0%) | 0.0 |
| High School Diploma | 0 (0.0%) | 0.0 |
| College or Associate's Degree | 0 (0.0%) | 0.0 |
| Bachelor's Degree | 0 (0.0%) | 0.0 |
| Graduate Degree | 0 (0.0%) | 0.0 |
| Total | 0 (0.0%) | 0.0 |
Fertility by Education by Marriage Status in Labette
| Educational Attainment | Married | Unmarried |
| Less than High School | 0 (0.0%) | 0 (0.0%) |
| High School Diploma | 0 (0.0%) | 0 (0.0%) |
| College or Associate's Degree | 0 (0.0%) | 0 (0.0%) |
| Bachelor's Degree | 0 (0.0%) | 0 (0.0%) |
| Graduate Degree | 0 (0.0%) | 0 (0.0%) |
| Total | 0 (0.0%) | 0 (0.0%) |
Employment Characteristics in Labette
Employment by Class of Employer in Labette
Among the 9 employed individuals in Labette, private company employees (4 | 44.4%), local government employees (3 | 33.3%), and federal government employees (2 | 22.2%) make up the most common classes of employment.
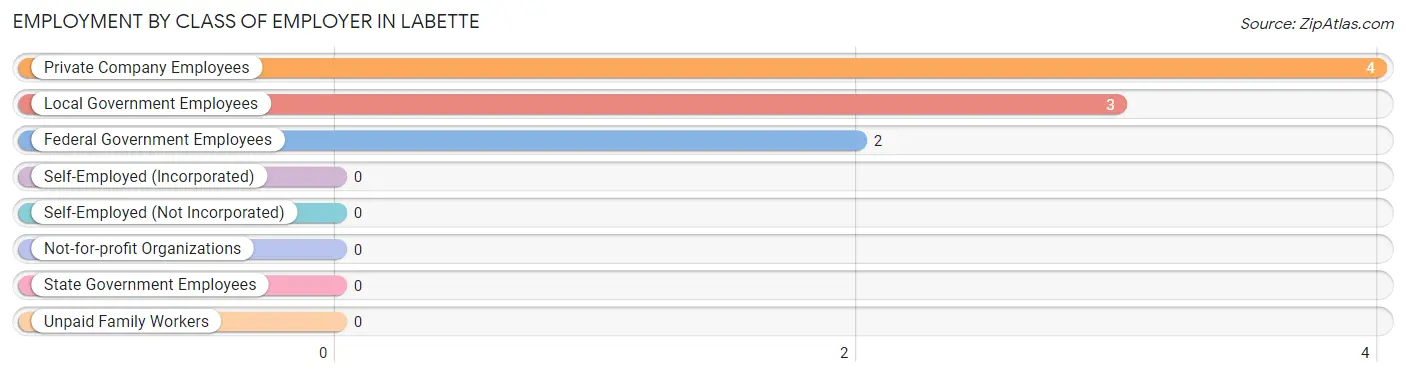
| Employer Class | # Employees | % Employees |
| Private Company Employees | 4 | 44.4% |
| Self-Employed (Incorporated) | 0 | 0.0% |
| Self-Employed (Not Incorporated) | 0 | 0.0% |
| Not-for-profit Organizations | 0 | 0.0% |
| Local Government Employees | 3 | 33.3% |
| State Government Employees | 0 | 0.0% |
| Federal Government Employees | 2 | 22.2% |
| Unpaid Family Workers | 0 | 0.0% |
| Total | 9 | 100.0% |
Employment Status by Age in Labette
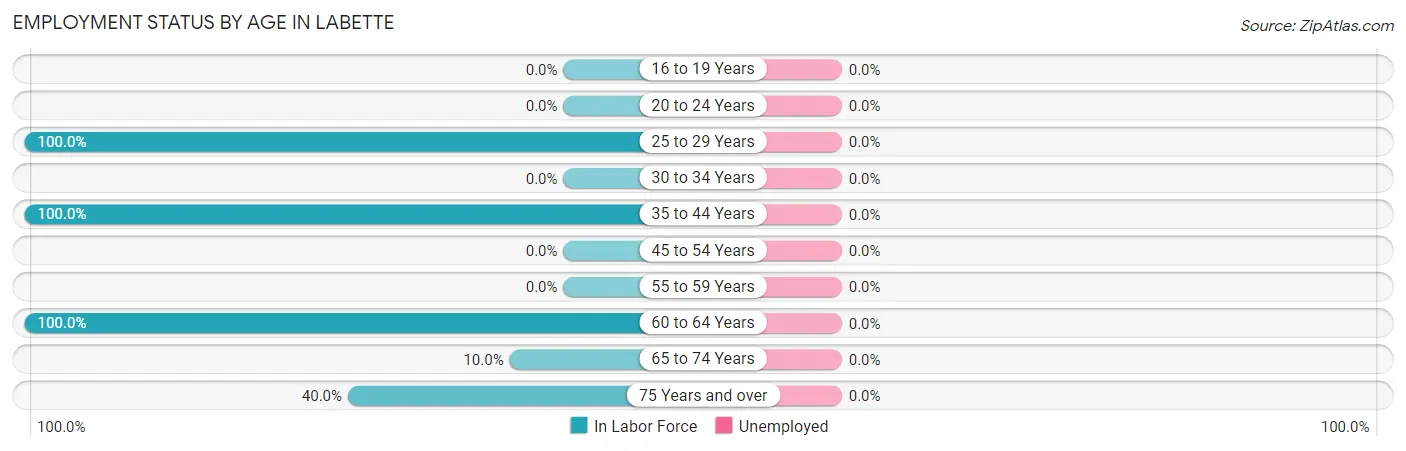
| Age Bracket | In Labor Force | Unemployed |
| 16 to 19 Years | 0 (0.0%) | 0 (0.0%) |
| 20 to 24 Years | 0 (0.0%) | 0 (0.0%) |
| 25 to 29 Years | 1 (100.0%) | 0 (0.0%) |
| 30 to 34 Years | 0 (0.0%) | 0 (0.0%) |
| 35 to 44 Years | 4 (100.0%) | 0 (0.0%) |
| 45 to 54 Years | 0 (0.0%) | 0 (0.0%) |
| 55 to 59 Years | 0 (0.0%) | 0 (0.0%) |
| 60 to 64 Years | 1 (100.0%) | 0 (0.0%) |
| 65 to 74 Years | 1 (10.0%) | 0 (0.0%) |
| 75 Years and over | 2 (40.0%) | 0 (0.0%) |
| Total | 9 (40.9%) | 0 (0.0%) |
Employment Status by Educational Attainment in Labette
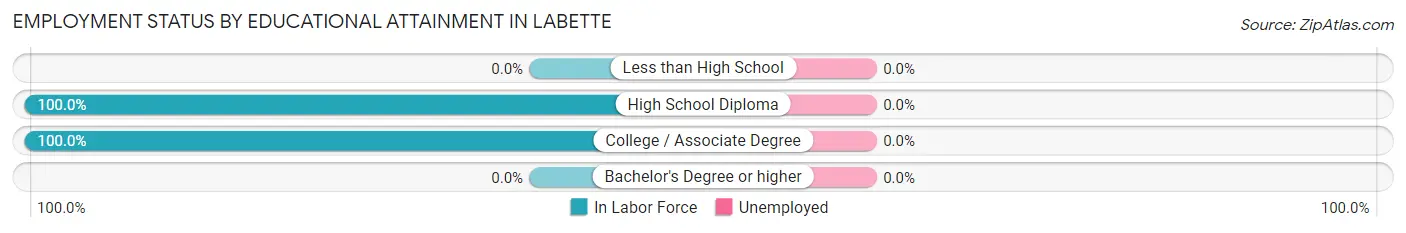
| Educational Attainment | In Labor Force | Unemployed |
| Less than High School | 0 (0.0%) | 0 (0.0%) |
| High School Diploma | 3 (100.0%) | 0 (0.0%) |
| College / Associate Degree | 3 (100.0%) | 0 (0.0%) |
| Bachelor's Degree or higher | 0 (0.0%) | 0 (0.0%) |
| Total | 6 (100.0%) | 0 (0.0%) |
Employment Occupations by Sex in Labette
Management, Business, Science and Arts Occupations
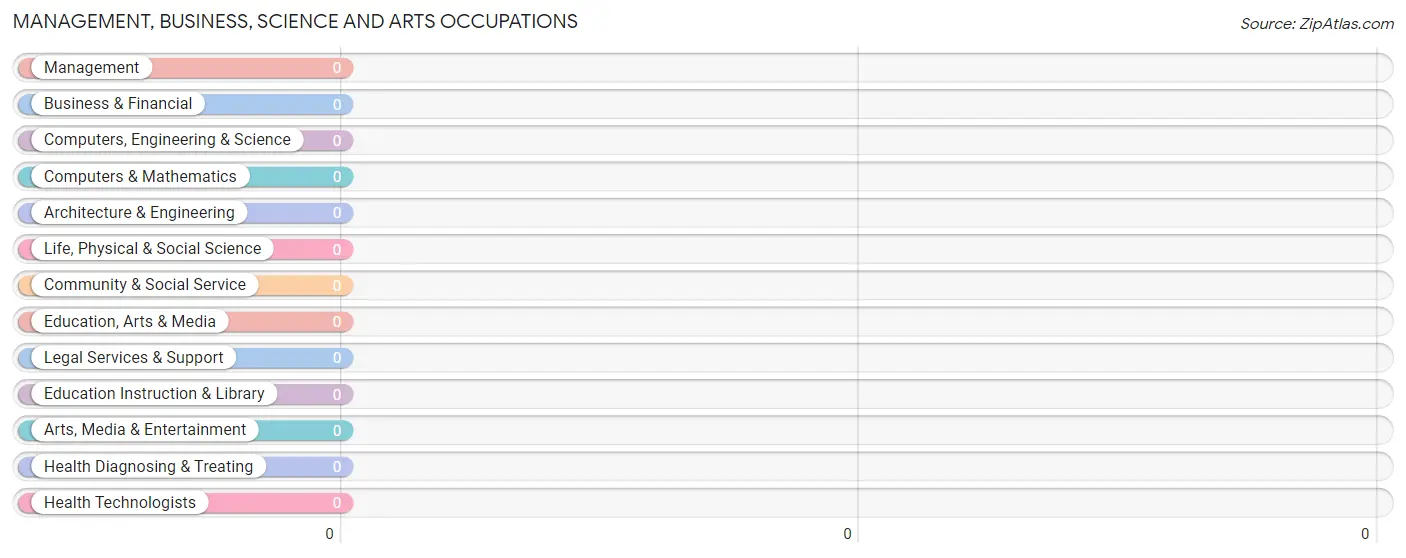
Management, Business, Science and Arts Occupations by Sex
| Occupation | Male | Female |
| Management | 0 (0.0%) | 0 (0.0%) |
| Business & Financial | 0 (0.0%) | 0 (0.0%) |
| Computers, Engineering & Science | 0 (0.0%) | 0 (0.0%) |
| Computers & Mathematics | 0 (0.0%) | 0 (0.0%) |
| Architecture & Engineering | 0 (0.0%) | 0 (0.0%) |
| Life, Physical & Social Science | 0 (0.0%) | 0 (0.0%) |
| Community & Social Service | 0 (0.0%) | 0 (0.0%) |
| Education, Arts & Media | 0 (0.0%) | 0 (0.0%) |
| Legal Services & Support | 0 (0.0%) | 0 (0.0%) |
| Education Instruction & Library | 0 (0.0%) | 0 (0.0%) |
| Arts, Media & Entertainment | 0 (0.0%) | 0 (0.0%) |
| Health Diagnosing & Treating | 0 (0.0%) | 0 (0.0%) |
| Health Technologists | 0 (0.0%) | 0 (0.0%) |
| Total (Category) | 0 (0.0%) | 0 (0.0%) |
| Total (Overall) | 4 (44.4%) | 5 (55.6%) |
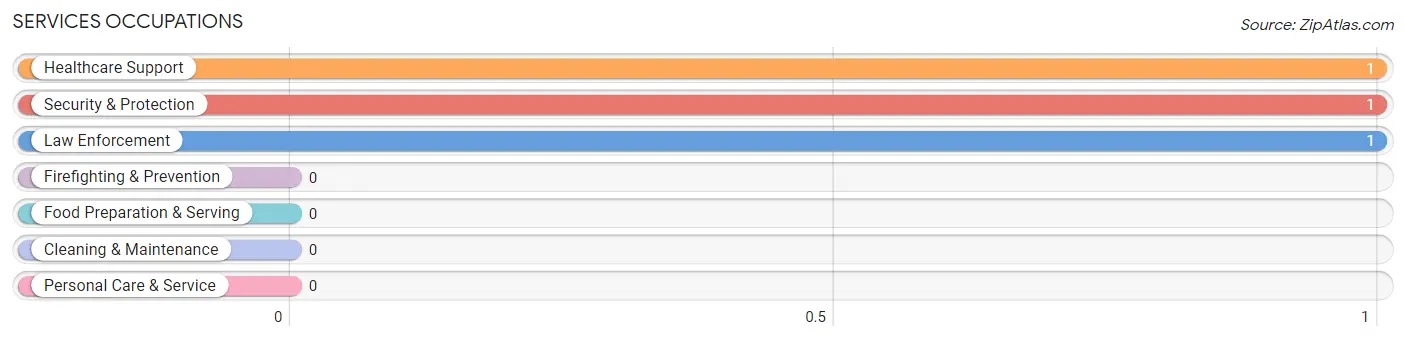
Services Occupations
The most common Services occupations in Labette are Healthcare Support (1 | 11.1%), Security & Protection (1 | 11.1%), and Law Enforcement (1 | 11.1%).
Services Occupations by Sex
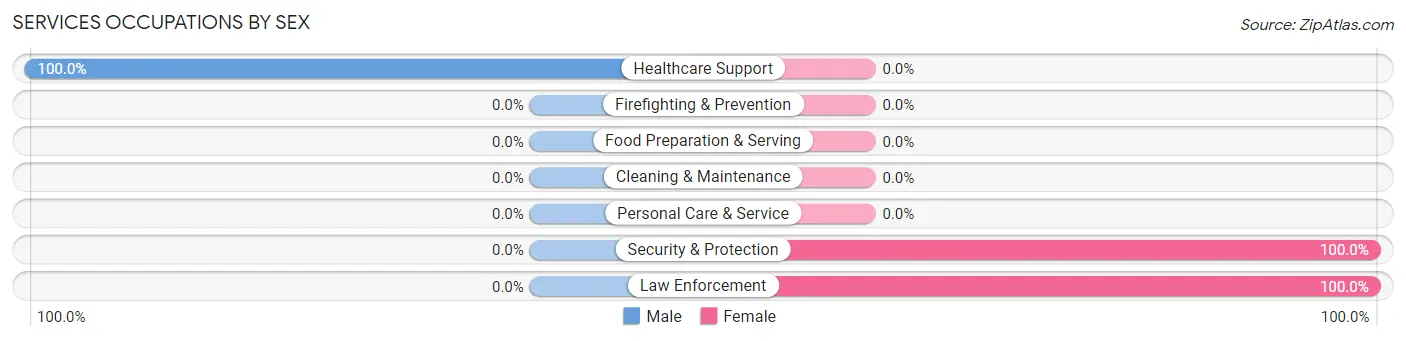
| Occupation | Male | Female |
| Healthcare Support | 1 (100.0%) | 0 (0.0%) |
| Security & Protection | 0 (0.0%) | 1 (100.0%) |
| Firefighting & Prevention | 0 (0.0%) | 0 (0.0%) |
| Law Enforcement | 0 (0.0%) | 1 (100.0%) |
| Food Preparation & Serving | 0 (0.0%) | 0 (0.0%) |
| Cleaning & Maintenance | 0 (0.0%) | 0 (0.0%) |
| Personal Care & Service | 0 (0.0%) | 0 (0.0%) |
| Total (Category) | 1 (50.0%) | 1 (50.0%) |
| Total (Overall) | 4 (44.4%) | 5 (55.6%) |
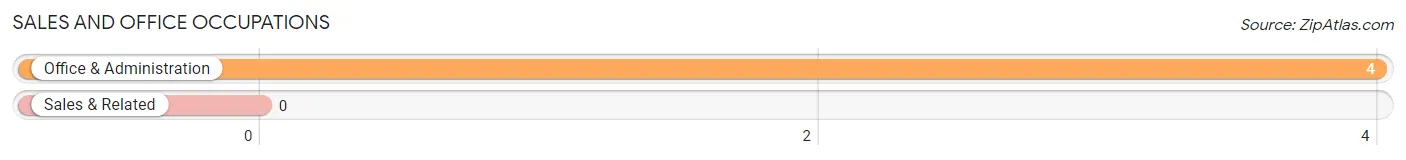
Sales and Office Occupations
The most common Sales and Office occupations in Labette are , and Office & Administration (4 | 44.4%).
Sales and Office Occupations by Sex
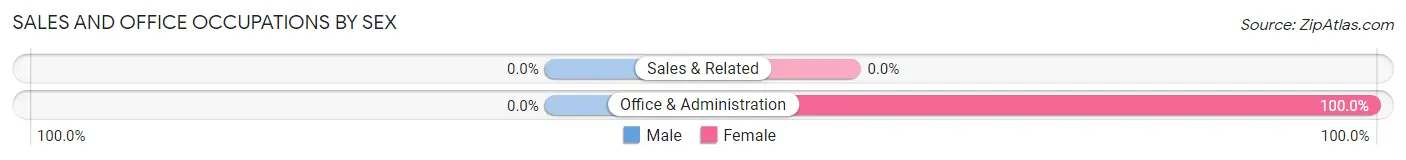
| Occupation | Male | Female |
| Sales & Related | 0 (0.0%) | 0 (0.0%) |
| Office & Administration | 0 (0.0%) | 4 (100.0%) |
| Total (Category) | 0 (0.0%) | 4 (100.0%) |
| Total (Overall) | 4 (44.4%) | 5 (55.6%) |
Natural Resources, Construction and Maintenance Occupations
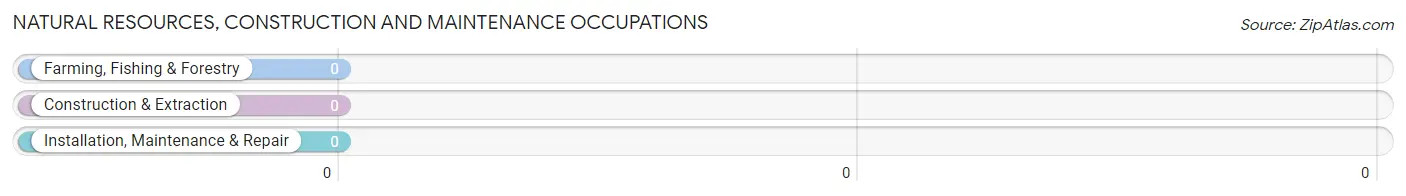
Natural Resources, Construction and Maintenance Occupations by Sex
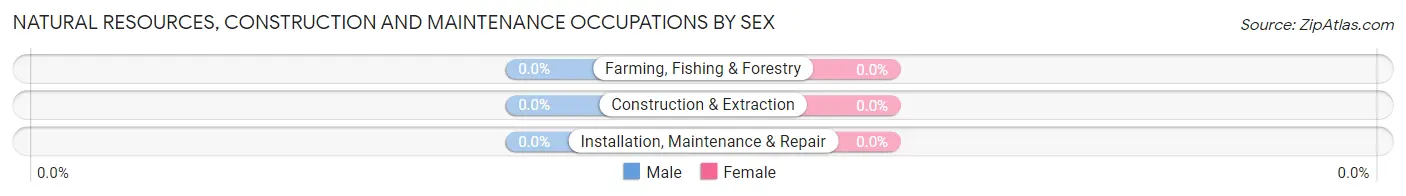
| Occupation | Male | Female |
| Farming, Fishing & Forestry | 0 (0.0%) | 0 (0.0%) |
| Construction & Extraction | 0 (0.0%) | 0 (0.0%) |
| Installation, Maintenance & Repair | 0 (0.0%) | 0 (0.0%) |
| Total (Category) | 0 (0.0%) | 0 (0.0%) |
| Total (Overall) | 4 (44.4%) | 5 (55.6%) |
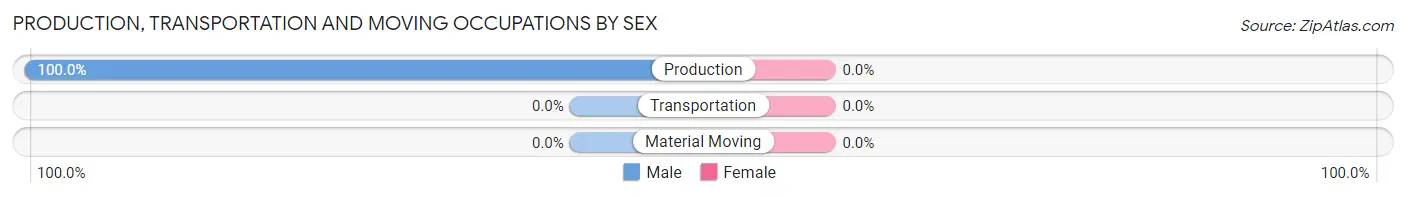
Production, Transportation and Moving Occupations
The most common Production, Transportation and Moving occupations in Labette are , and Production (3 | 33.3%).
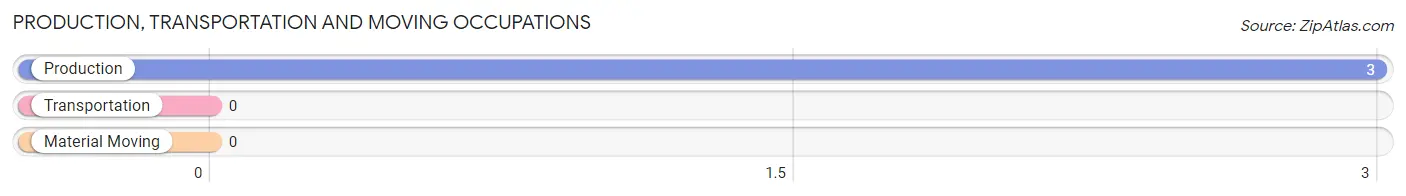
Production, Transportation and Moving Occupations by Sex
| Occupation | Male | Female |
| Production | 3 (100.0%) | 0 (0.0%) |
| Transportation | 0 (0.0%) | 0 (0.0%) |
| Material Moving | 0 (0.0%) | 0 (0.0%) |
| Total (Category) | 3 (100.0%) | 0 (0.0%) |
| Total (Overall) | 4 (44.4%) | 5 (55.6%) |
Employment Industries by Sex in Labette
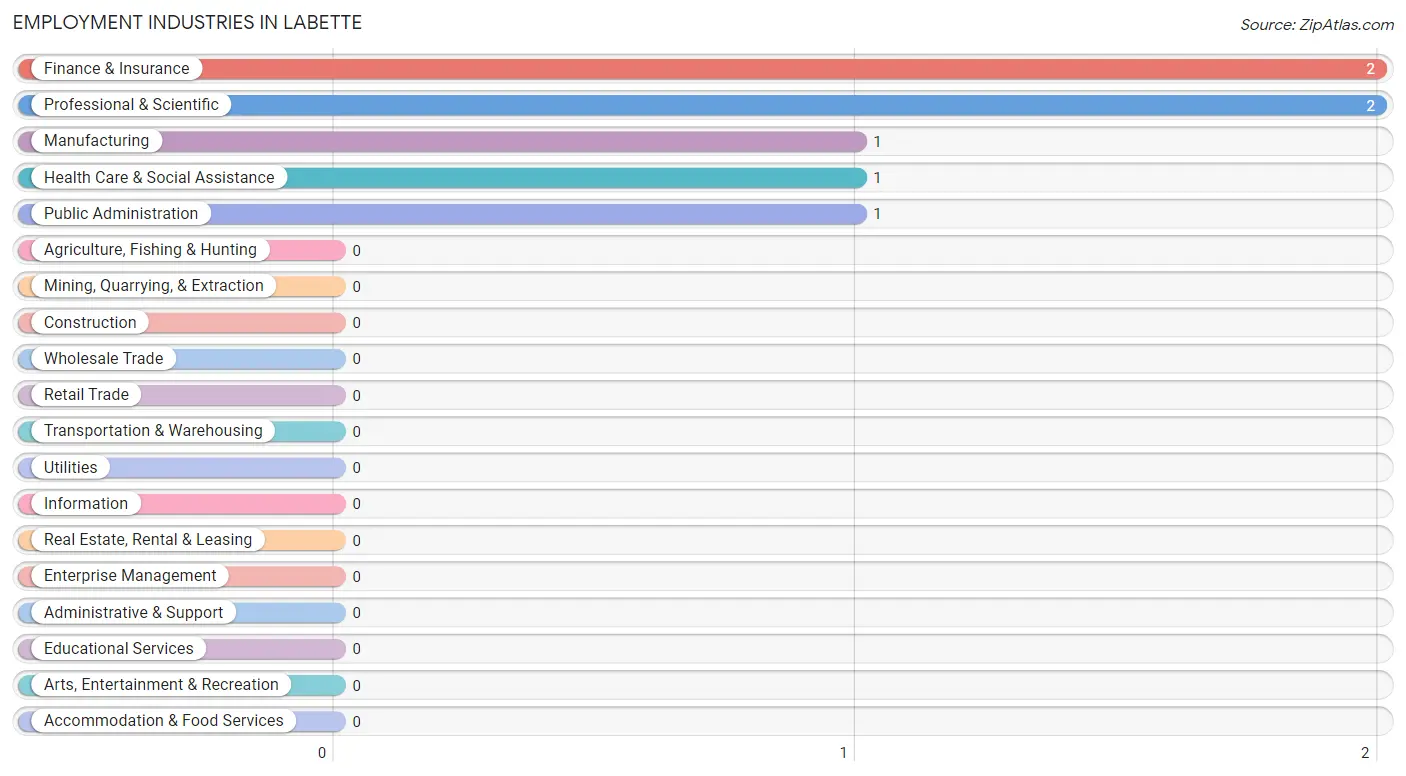
Employment Industries in Labette
The major employment industries in Labette include Finance & Insurance (2 | 22.2%), Professional & Scientific (2 | 22.2%), Manufacturing (1 | 11.1%), Health Care & Social Assistance (1 | 11.1%), and Public Administration (1 | 11.1%).
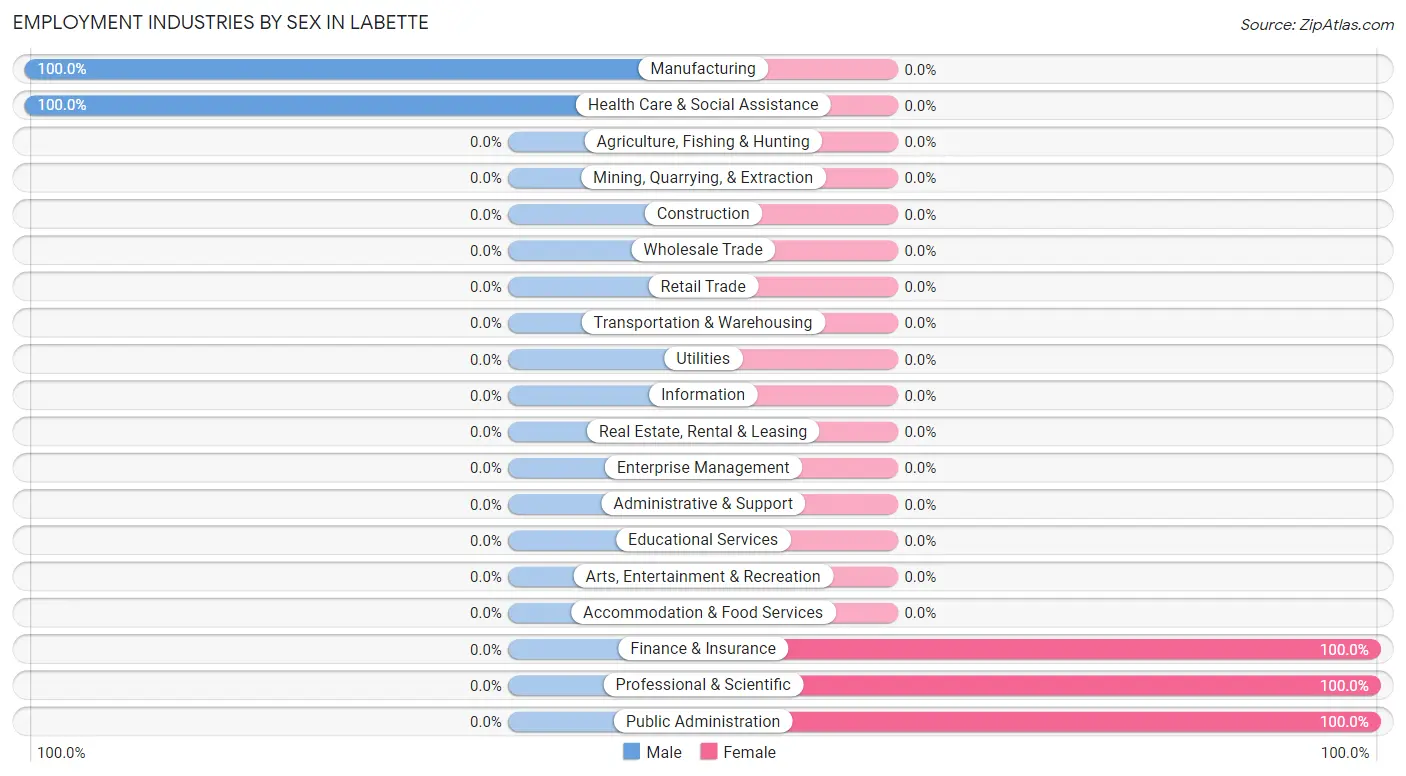
Employment Industries by Sex in Labette
The Labette industries that see more men than women are Manufacturing (100.0%), and Health Care & Social Assistance (100.0%), whereas the industries that tend to have a higher number of women are Finance & Insurance (100.0%), Professional & Scientific (100.0%), and Public Administration (100.0%).
| Industry | Male | Female |
| Agriculture, Fishing & Hunting | 0 (0.0%) | 0 (0.0%) |
| Mining, Quarrying, & Extraction | 0 (0.0%) | 0 (0.0%) |
| Construction | 0 (0.0%) | 0 (0.0%) |
| Manufacturing | 1 (100.0%) | 0 (0.0%) |
| Wholesale Trade | 0 (0.0%) | 0 (0.0%) |
| Retail Trade | 0 (0.0%) | 0 (0.0%) |
| Transportation & Warehousing | 0 (0.0%) | 0 (0.0%) |
| Utilities | 0 (0.0%) | 0 (0.0%) |
| Information | 0 (0.0%) | 0 (0.0%) |
| Finance & Insurance | 0 (0.0%) | 2 (100.0%) |
| Real Estate, Rental & Leasing | 0 (0.0%) | 0 (0.0%) |
| Professional & Scientific | 0 (0.0%) | 2 (100.0%) |
| Enterprise Management | 0 (0.0%) | 0 (0.0%) |
| Administrative & Support | 0 (0.0%) | 0 (0.0%) |
| Educational Services | 0 (0.0%) | 0 (0.0%) |
| Health Care & Social Assistance | 1 (100.0%) | 0 (0.0%) |
| Arts, Entertainment & Recreation | 0 (0.0%) | 0 (0.0%) |
| Accommodation & Food Services | 0 (0.0%) | 0 (0.0%) |
| Public Administration | 0 (0.0%) | 1 (100.0%) |
| Total | 4 (44.4%) | 5 (55.6%) |
Education in Labette
School Enrollment in Labette
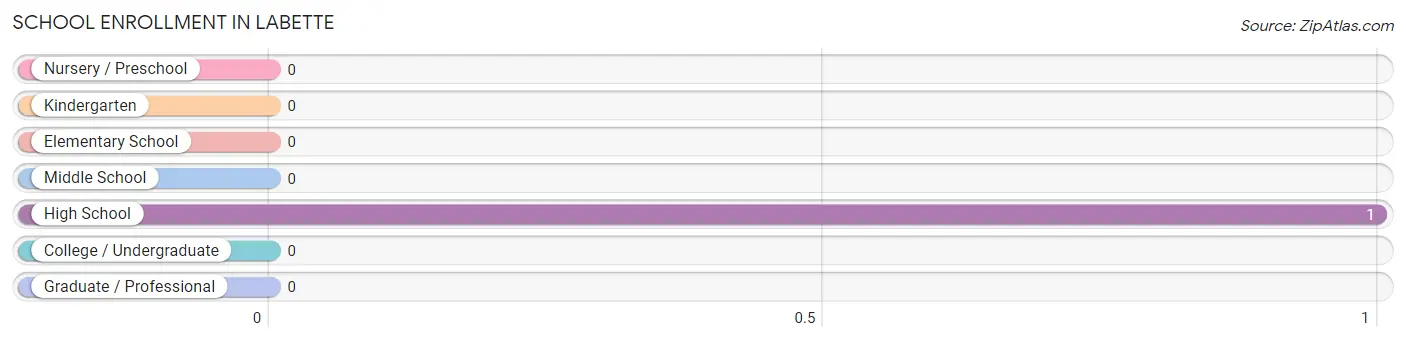
| School Level | # Students | % Students |
| Nursery / Preschool | 0 | 0.0% |
| Kindergarten | 0 | 0.0% |
| Elementary School | 0 | 0.0% |
| Middle School | 0 | 0.0% |
| High School | 1 | 100.0% |
| College / Undergraduate | 0 | 0.0% |
| Graduate / Professional | 0 | 0.0% |
| Total | 1 | 100.0% |
School Enrollment by Age by Funding Source in Labette
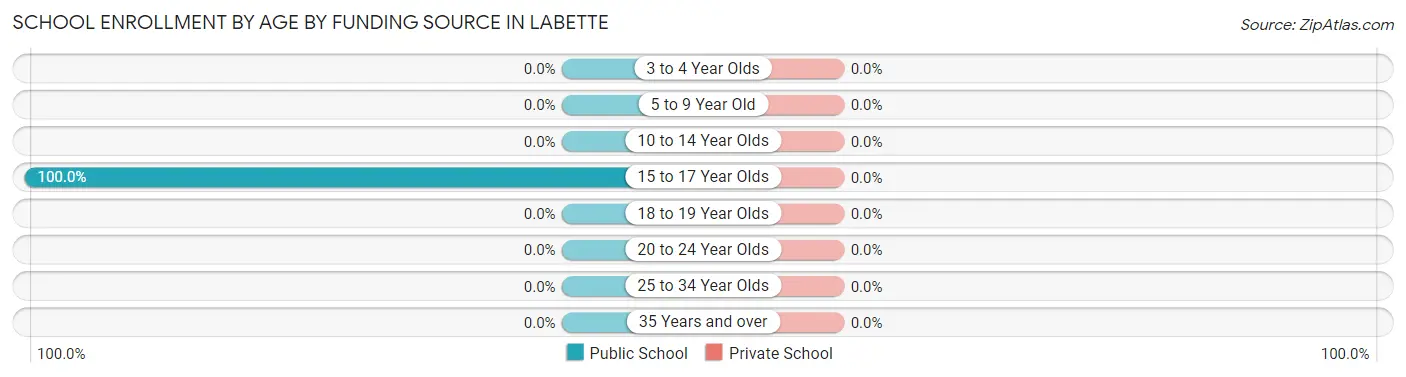
| Age Bracket | Public School | Private School |
| 3 to 4 Year Olds | 0 (0.0%) | 0 (0.0%) |
| 5 to 9 Year Old | 0 (0.0%) | 0 (0.0%) |
| 10 to 14 Year Olds | 0 (0.0%) | 0 (0.0%) |
| 15 to 17 Year Olds | 1 (100.0%) | 0 (0.0%) |
| 18 to 19 Year Olds | 0 (0.0%) | 0 (0.0%) |
| 20 to 24 Year Olds | 0 (0.0%) | 0 (0.0%) |
| 25 to 34 Year Olds | 0 (0.0%) | 0 (0.0%) |
| 35 Years and over | 0 (0.0%) | 0 (0.0%) |
| Total | 1 (100.0%) | 0 (0.0%) |
Educational Attainment by Field of Study in Labette
Business (2 | 66.7%), and liberal arts & history (1 | 33.3%) are the most common fields of study among 3 individuals in Labette who have obtained a bachelor's degree or higher.
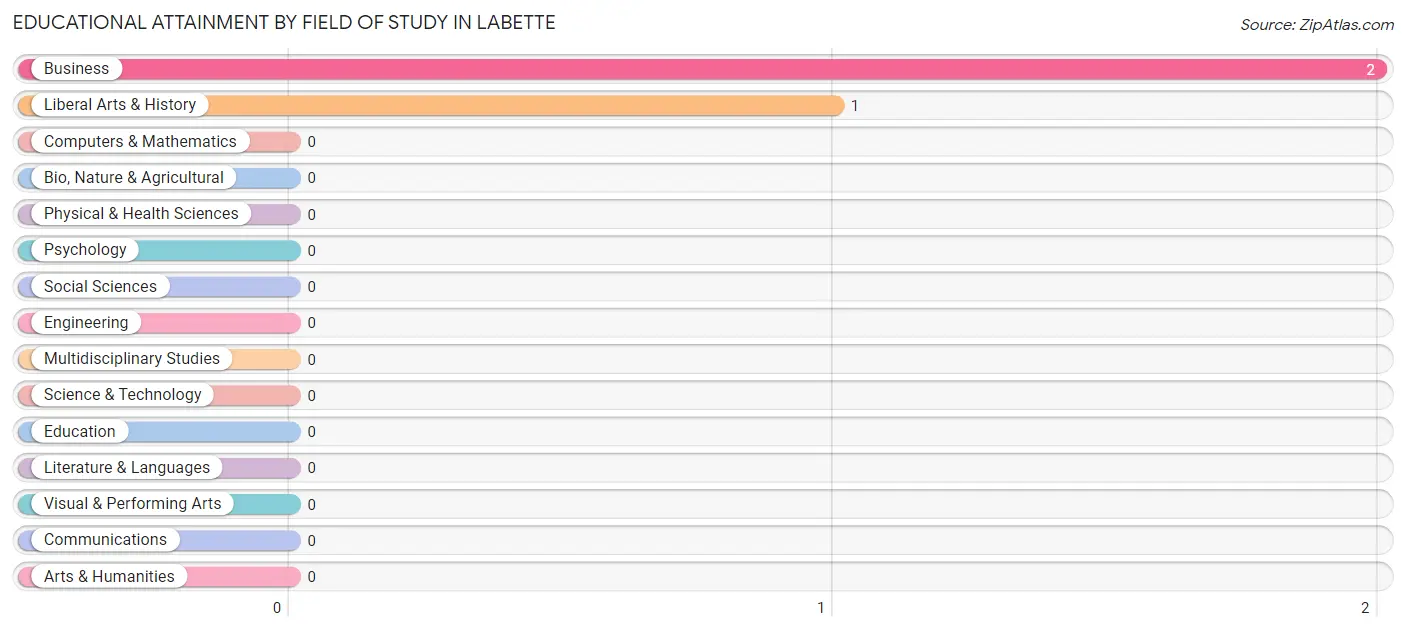
| Field of Study | # Graduates | % Graduates |
| Computers & Mathematics | 0 | 0.0% |
| Bio, Nature & Agricultural | 0 | 0.0% |
| Physical & Health Sciences | 0 | 0.0% |
| Psychology | 0 | 0.0% |
| Social Sciences | 0 | 0.0% |
| Engineering | 0 | 0.0% |
| Multidisciplinary Studies | 0 | 0.0% |
| Science & Technology | 0 | 0.0% |
| Business | 2 | 66.7% |
| Education | 0 | 0.0% |
| Literature & Languages | 0 | 0.0% |
| Liberal Arts & History | 1 | 33.3% |
| Visual & Performing Arts | 0 | 0.0% |
| Communications | 0 | 0.0% |
| Arts & Humanities | 0 | 0.0% |
| Total | 3 | 100.0% |
Transportation & Commute in Labette
Vehicle Availability by Sex in Labette
The most prevalent vehicle ownership categories in Labette are males with 3 vehicles (3, accounting for 75.0%) and females with 3 vehicles (4, making up 60.0%).
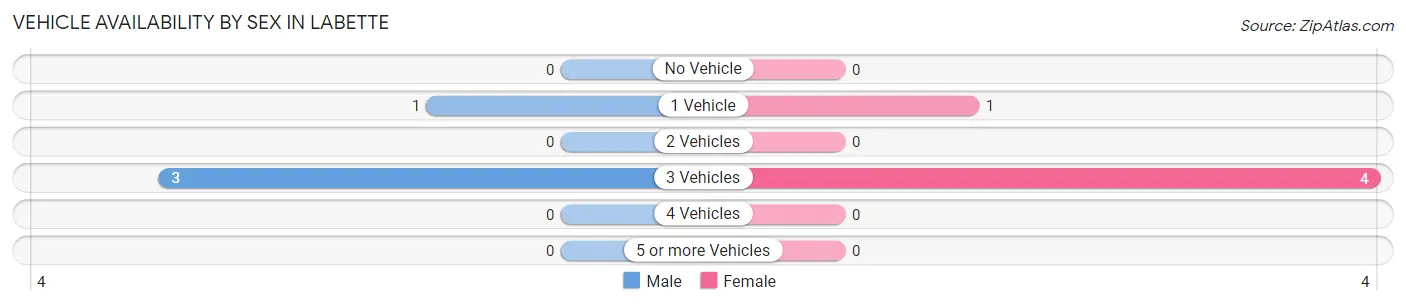
| Vehicles Available | Male | Female |
| No Vehicle | 0 (0.0%) | 0 (0.0%) |
| 1 Vehicle | 1 (25.0%) | 1 (20.0%) |
| 2 Vehicles | 0 (0.0%) | 0 (0.0%) |
| 3 Vehicles | 3 (75.0%) | 4 (80.0%) |
| 4 Vehicles | 0 (0.0%) | 0 (0.0%) |
| 5 or more Vehicles | 0 (0.0%) | 0 (0.0%) |
| Total | 4 (100.0%) | 5 (100.0%) |
Commute Time in Labette
The most frequently occuring commute durations in Labette are 10 to 14 minutes (3 commuters, 42.9%), 20 to 24 minutes (2 commuters, 28.6%), and 15 to 19 minutes (1 commuters, 14.3%).
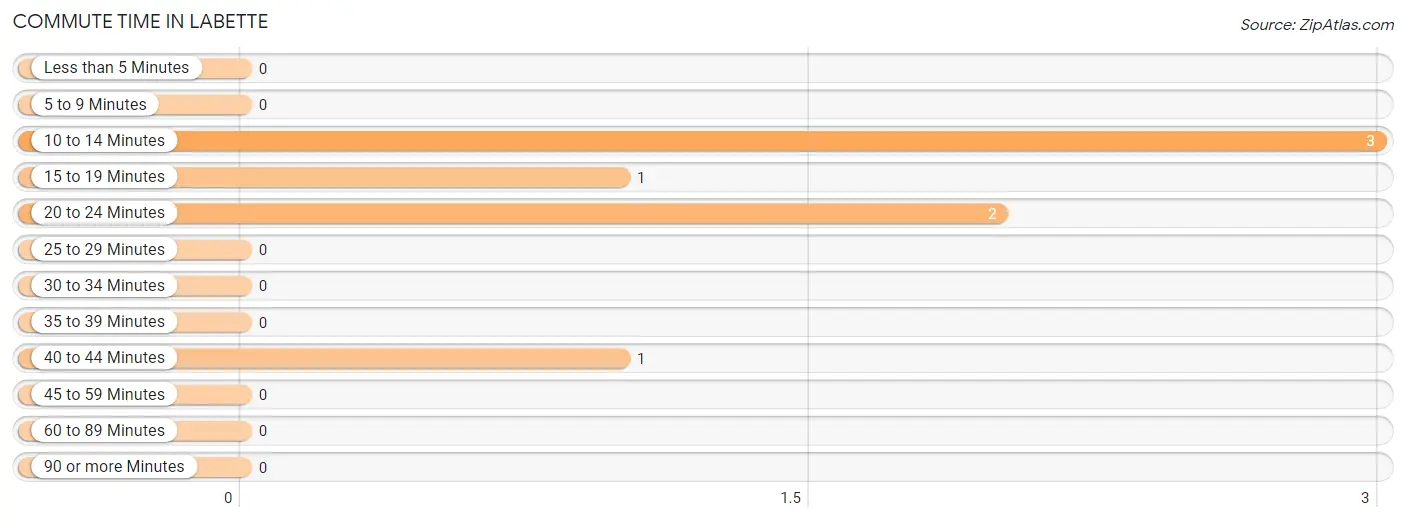
| Commute Time | # Commuters | % Commuters |
| Less than 5 Minutes | 0 | 0.0% |
| 5 to 9 Minutes | 0 | 0.0% |
| 10 to 14 Minutes | 3 | 42.9% |
| 15 to 19 Minutes | 1 | 14.3% |
| 20 to 24 Minutes | 2 | 28.6% |
| 25 to 29 Minutes | 0 | 0.0% |
| 30 to 34 Minutes | 0 | 0.0% |
| 35 to 39 Minutes | 0 | 0.0% |
| 40 to 44 Minutes | 1 | 14.3% |
| 45 to 59 Minutes | 0 | 0.0% |
| 60 to 89 Minutes | 0 | 0.0% |
| 90 or more Minutes | 0 | 0.0% |
Commute Time by Sex in Labette
The most common commute times in Labette are 20 to 24 minutes (2 commuters, 50.0%) for males and 10 to 14 minutes (2 commuters, 66.7%) for females.
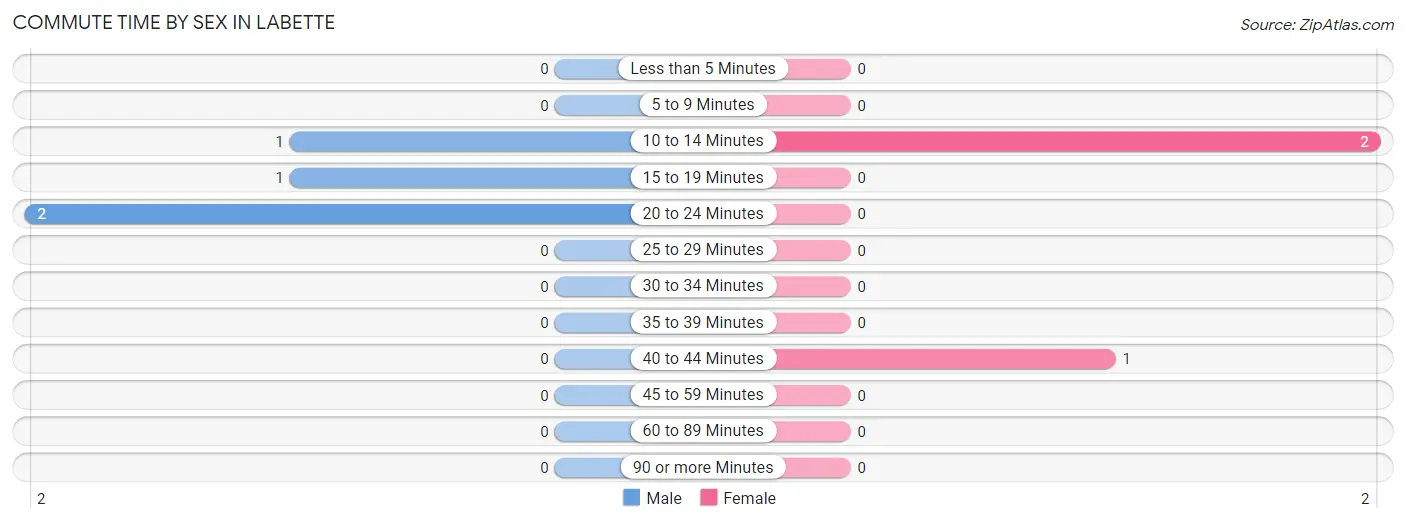
| Commute Time | Male | Female |
| Less than 5 Minutes | 0 (0.0%) | 0 (0.0%) |
| 5 to 9 Minutes | 0 (0.0%) | 0 (0.0%) |
| 10 to 14 Minutes | 1 (25.0%) | 2 (66.7%) |
| 15 to 19 Minutes | 1 (25.0%) | 0 (0.0%) |
| 20 to 24 Minutes | 2 (50.0%) | 0 (0.0%) |
| 25 to 29 Minutes | 0 (0.0%) | 0 (0.0%) |
| 30 to 34 Minutes | 0 (0.0%) | 0 (0.0%) |
| 35 to 39 Minutes | 0 (0.0%) | 0 (0.0%) |
| 40 to 44 Minutes | 0 (0.0%) | 1 (33.3%) |
| 45 to 59 Minutes | 0 (0.0%) | 0 (0.0%) |
| 60 to 89 Minutes | 0 (0.0%) | 0 (0.0%) |
| 90 or more Minutes | 0 (0.0%) | 0 (0.0%) |
Time of Departure to Work by Sex in Labette
The most frequent times of departure to work in Labette are 5:00 AM to 5:29 AM (2, 50.0%) for males and 7:30 AM to 7:59 AM (2, 66.7%) for females.
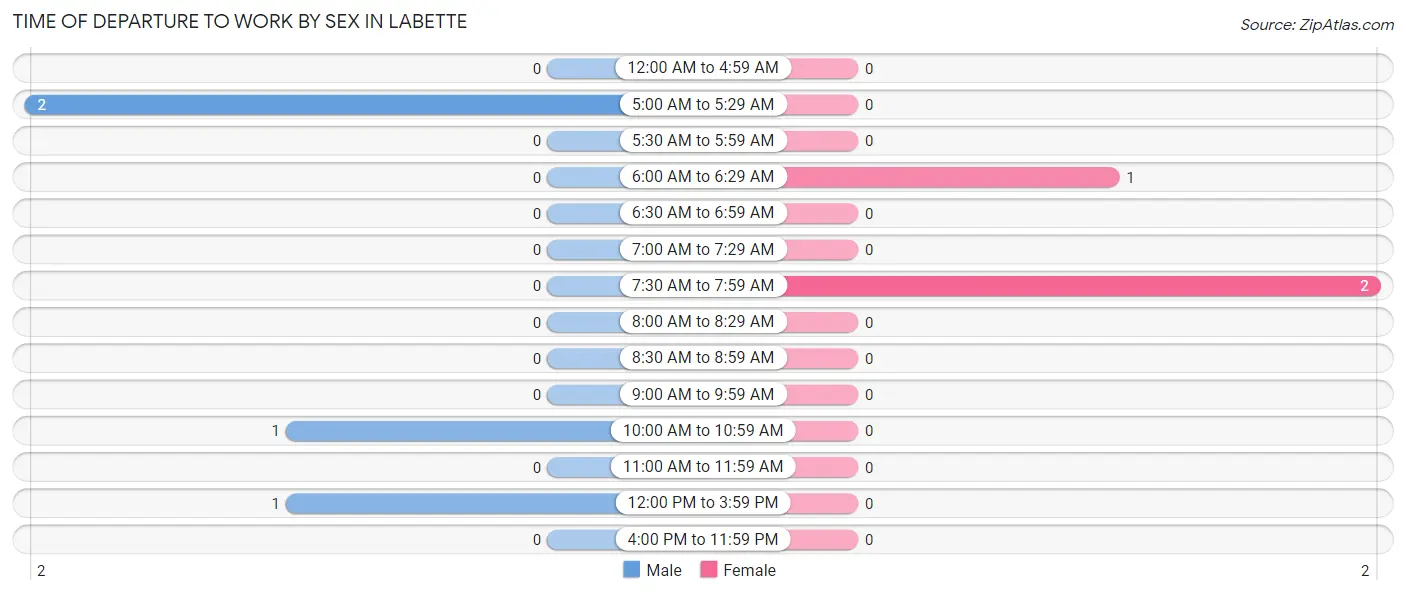
| Time of Departure | Male | Female |
| 12:00 AM to 4:59 AM | 0 (0.0%) | 0 (0.0%) |
| 5:00 AM to 5:29 AM | 2 (50.0%) | 0 (0.0%) |
| 5:30 AM to 5:59 AM | 0 (0.0%) | 0 (0.0%) |
| 6:00 AM to 6:29 AM | 0 (0.0%) | 1 (33.3%) |
| 6:30 AM to 6:59 AM | 0 (0.0%) | 0 (0.0%) |
| 7:00 AM to 7:29 AM | 0 (0.0%) | 0 (0.0%) |
| 7:30 AM to 7:59 AM | 0 (0.0%) | 2 (66.7%) |
| 8:00 AM to 8:29 AM | 0 (0.0%) | 0 (0.0%) |
| 8:30 AM to 8:59 AM | 0 (0.0%) | 0 (0.0%) |
| 9:00 AM to 9:59 AM | 0 (0.0%) | 0 (0.0%) |
| 10:00 AM to 10:59 AM | 1 (25.0%) | 0 (0.0%) |
| 11:00 AM to 11:59 AM | 0 (0.0%) | 0 (0.0%) |
| 12:00 PM to 3:59 PM | 1 (25.0%) | 0 (0.0%) |
| 4:00 PM to 11:59 PM | 0 (0.0%) | 0 (0.0%) |
| Total | 4 (100.0%) | 3 (100.0%) |
Housing Occupancy in Labette
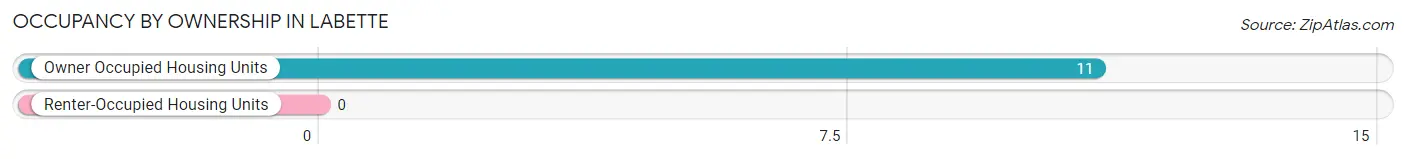
Occupancy by Ownership in Labette
Of the total 11 dwellings in Labette, owner-occupied units account for 11 (100.0%), while renter-occupied units make up 0 (0.0%).
| Occupancy | # Housing Units | % Housing Units |
| Owner Occupied Housing Units | 11 | 100.0% |
| Renter-Occupied Housing Units | 0 | 0.0% |
| Total Occupied Housing Units | 11 | 100.0% |
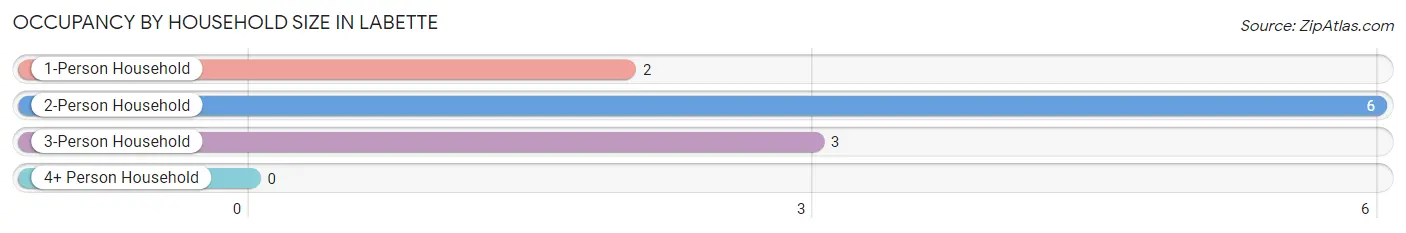
Occupancy by Household Size in Labette
| Household Size | # Housing Units | % Housing Units |
| 1-Person Household | 2 | 18.2% |
| 2-Person Household | 6 | 54.5% |
| 3-Person Household | 3 | 27.3% |
| 4+ Person Household | 0 | 0.0% |
| Total Housing Units | 11 | 100.0% |
Occupancy by Ownership by Household Size in Labette
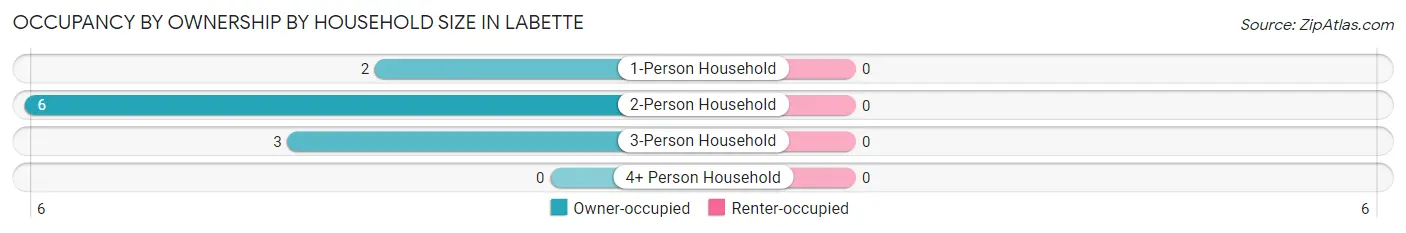
| Household Size | Owner-occupied | Renter-occupied |
| 1-Person Household | 2 (100.0%) | 0 (0.0%) |
| 2-Person Household | 6 (100.0%) | 0 (0.0%) |
| 3-Person Household | 3 (100.0%) | 0 (0.0%) |
| 4+ Person Household | 0 (0.0%) | 0 (0.0%) |
| Total Housing Units | 11 (100.0%) | 0 (0.0%) |
Occupancy by Educational Attainment in Labette
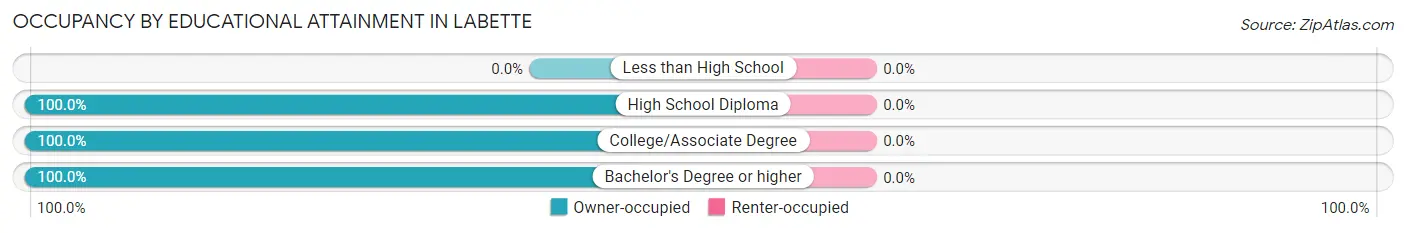
| Household Size | Owner-occupied | Renter-occupied |
| Less than High School | 0 (0.0%) | 0 (0.0%) |
| High School Diploma | 2 (100.0%) | 0 (0.0%) |
| College/Associate Degree | 6 (100.0%) | 0 (0.0%) |
| Bachelor's Degree or higher | 3 (100.0%) | 0 (0.0%) |
Occupancy by Age of Householder in Labette
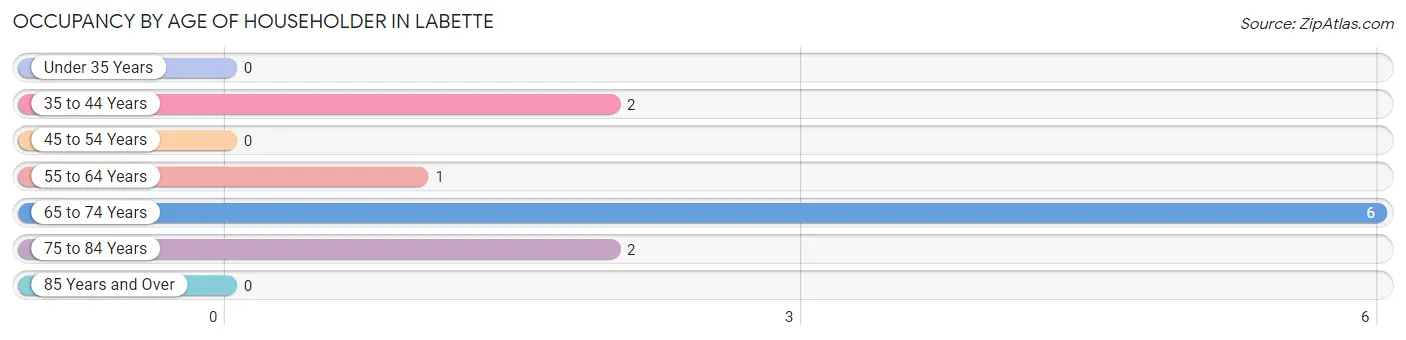
| Age Bracket | # Households | % Households |
| Under 35 Years | 0 | 0.0% |
| 35 to 44 Years | 2 | 18.2% |
| 45 to 54 Years | 0 | 0.0% |
| 55 to 64 Years | 1 | 9.1% |
| 65 to 74 Years | 6 | 54.5% |
| 75 to 84 Years | 2 | 18.2% |
| 85 Years and Over | 0 | 0.0% |
| Total | 11 | 100.0% |
Housing Finances in Labette
Median Income by Occupancy in Labette
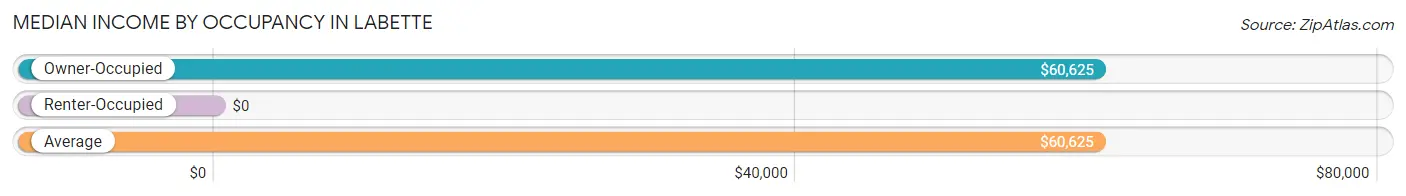
| Occupancy Type | # Households | Median Income |
| Owner-Occupied | 11 (100.0%) | $60,625 |
| Renter-Occupied | 0 (0.0%) | $0 |
| Average | 11 (100.0%) | $60,625 |
Occupancy by Householder Income Bracket in Labette
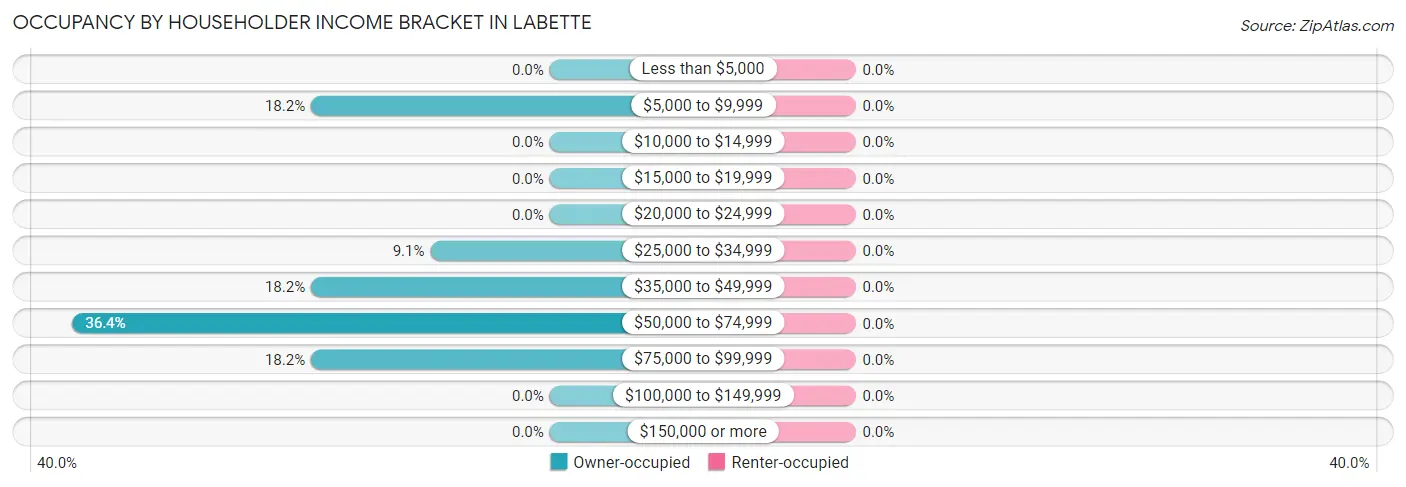
| Income Bracket | Owner-occupied | Renter-occupied |
| Less than $5,000 | 0 (0.0%) | 0 (0.0%) |
| $5,000 to $9,999 | 2 (18.2%) | 0 (0.0%) |
| $10,000 to $14,999 | 0 (0.0%) | 0 (0.0%) |
| $15,000 to $19,999 | 0 (0.0%) | 0 (0.0%) |
| $20,000 to $24,999 | 0 (0.0%) | 0 (0.0%) |
| $25,000 to $34,999 | 1 (9.1%) | 0 (0.0%) |
| $35,000 to $49,999 | 2 (18.2%) | 0 (0.0%) |
| $50,000 to $74,999 | 4 (36.4%) | 0 (0.0%) |
| $75,000 to $99,999 | 2 (18.2%) | 0 (0.0%) |
| $100,000 to $149,999 | 0 (0.0%) | 0 (0.0%) |
| $150,000 or more | 0 (0.0%) | 0 (0.0%) |
| Total | 11 (100.0%) | 0 (0.0%) |
Monthly Housing Cost Tiers in Labette
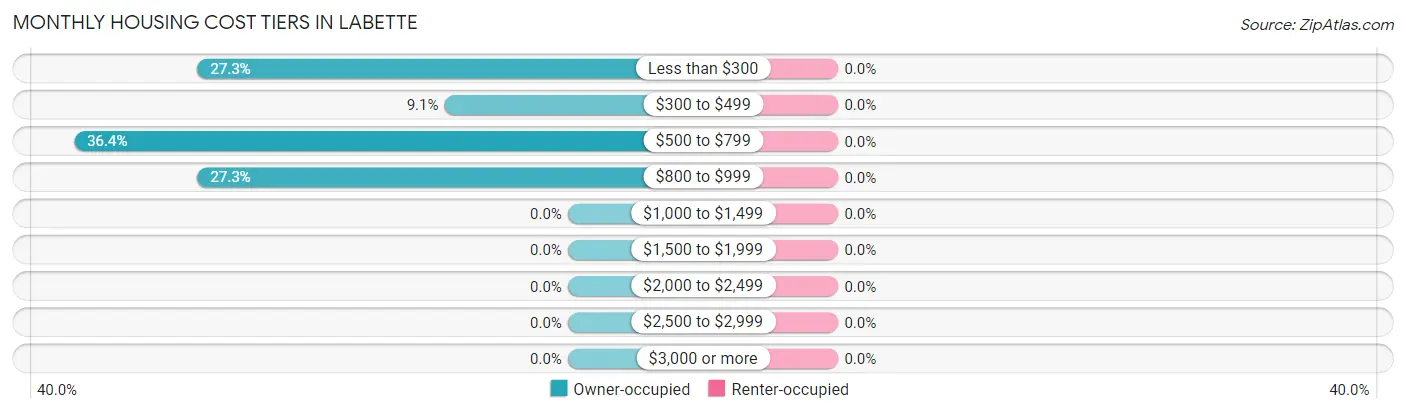
| Monthly Cost | Owner-occupied | Renter-occupied |
| Less than $300 | 3 (27.3%) | 0 (0.0%) |
| $300 to $499 | 1 (9.1%) | 0 (0.0%) |
| $500 to $799 | 4 (36.4%) | 0 (0.0%) |
| $800 to $999 | 3 (27.3%) | 0 (0.0%) |
| $1,000 to $1,499 | 0 (0.0%) | 0 (0.0%) |
| $1,500 to $1,999 | 0 (0.0%) | 0 (0.0%) |
| $2,000 to $2,499 | 0 (0.0%) | 0 (0.0%) |
| $2,500 to $2,999 | 0 (0.0%) | 0 (0.0%) |
| $3,000 or more | 0 (0.0%) | 0 (0.0%) |
| Total | 11 (100.0%) | 0 (0.0%) |
Physical Housing Characteristics in Labette
Housing Structures in Labette
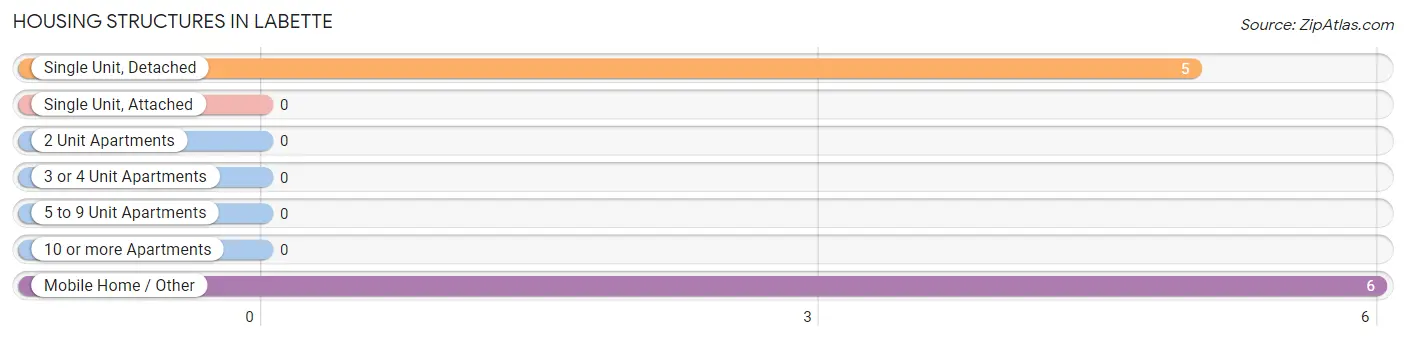
| Structure Type | # Housing Units | % Housing Units |
| Single Unit, Detached | 5 | 45.5% |
| Single Unit, Attached | 0 | 0.0% |
| 2 Unit Apartments | 0 | 0.0% |
| 3 or 4 Unit Apartments | 0 | 0.0% |
| 5 to 9 Unit Apartments | 0 | 0.0% |
| 10 or more Apartments | 0 | 0.0% |
| Mobile Home / Other | 6 | 54.5% |
| Total | 11 | 100.0% |
Housing Structures by Occupancy in Labette
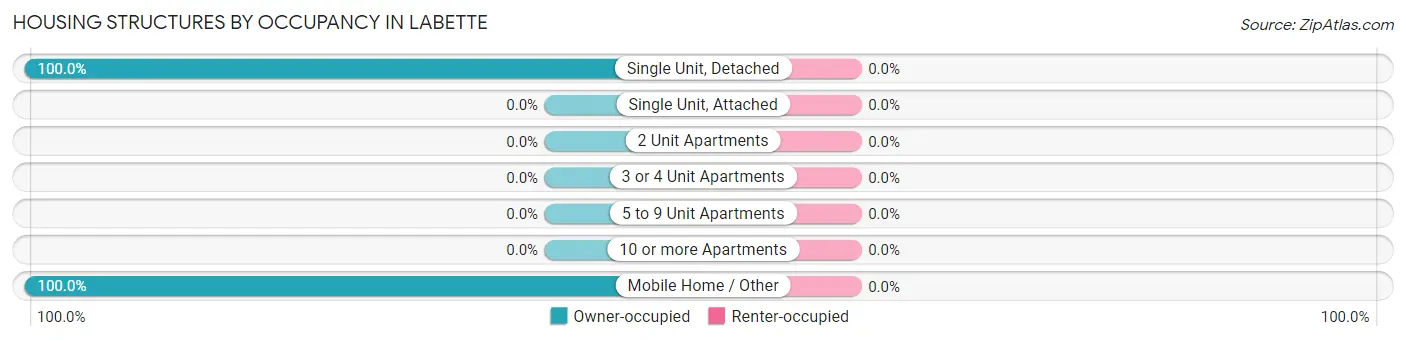
| Structure Type | Owner-occupied | Renter-occupied |
| Single Unit, Detached | 5 (100.0%) | 0 (0.0%) |
| Single Unit, Attached | 0 (0.0%) | 0 (0.0%) |
| 2 Unit Apartments | 0 (0.0%) | 0 (0.0%) |
| 3 or 4 Unit Apartments | 0 (0.0%) | 0 (0.0%) |
| 5 to 9 Unit Apartments | 0 (0.0%) | 0 (0.0%) |
| 10 or more Apartments | 0 (0.0%) | 0 (0.0%) |
| Mobile Home / Other | 6 (100.0%) | 0 (0.0%) |
| Total | 11 (100.0%) | 0 (0.0%) |
Housing Structures by Number of Rooms in Labette
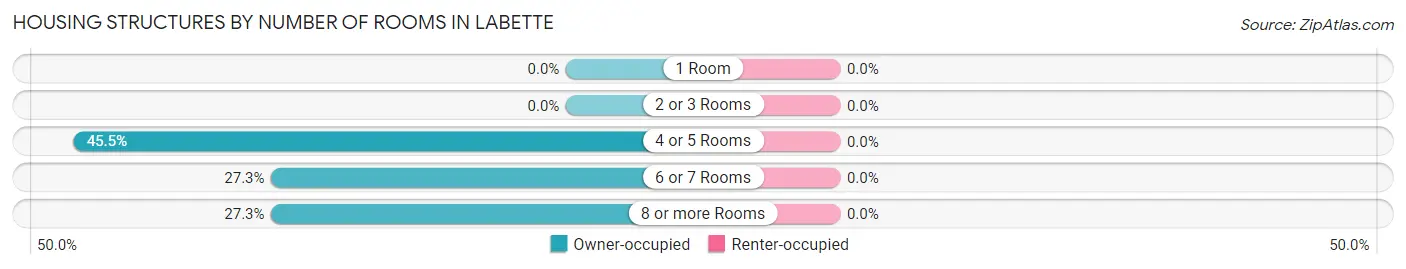
| Number of Rooms | Owner-occupied | Renter-occupied |
| 1 Room | 0 (0.0%) | 0 (0.0%) |
| 2 or 3 Rooms | 0 (0.0%) | 0 (0.0%) |
| 4 or 5 Rooms | 5 (45.5%) | 0 (0.0%) |
| 6 or 7 Rooms | 3 (27.3%) | 0 (0.0%) |
| 8 or more Rooms | 3 (27.3%) | 0 (0.0%) |
| Total | 11 (100.0%) | 0 (0.0%) |
Housing Structure by Heating Type in Labette
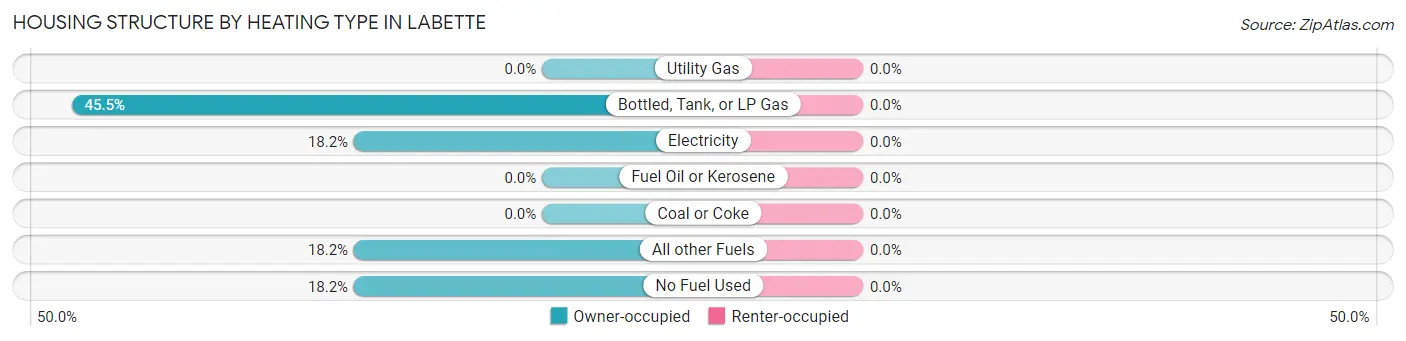
| Heating Type | Owner-occupied | Renter-occupied |
| Utility Gas | 0 (0.0%) | 0 (0.0%) |
| Bottled, Tank, or LP Gas | 5 (45.5%) | 0 (0.0%) |
| Electricity | 2 (18.2%) | 0 (0.0%) |
| Fuel Oil or Kerosene | 0 (0.0%) | 0 (0.0%) |
| Coal or Coke | 0 (0.0%) | 0 (0.0%) |
| All other Fuels | 2 (18.2%) | 0 (0.0%) |
| No Fuel Used | 2 (18.2%) | 0 (0.0%) |
| Total | 11 (100.0%) | 0 (0.0%) |
Household Vehicle Usage in Labette
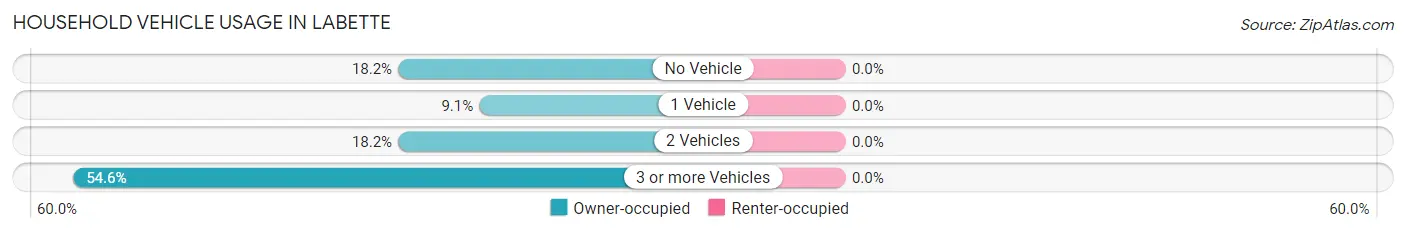
| Vehicles per Household | Owner-occupied | Renter-occupied |
| No Vehicle | 2 (18.2%) | 0 (0.0%) |
| 1 Vehicle | 1 (9.1%) | 0 (0.0%) |
| 2 Vehicles | 2 (18.2%) | 0 (0.0%) |
| 3 or more Vehicles | 6 (54.5%) | 0 (0.0%) |
| Total | 11 (100.0%) | 0 (0.0%) |
Real Estate & Mortgages in Labette
Real Estate and Mortgage Overview in Labette
| Characteristic | Without Mortgage | With Mortgage |
| Housing Units | 8 | 3 |
| Median Property Value | $65,000 | $0 |
| Median Household Income | $47,500 | $0 |
| Monthly Housing Costs | $425 | $0 |
| Real Estate Taxes | $1,000 | $1 |
Property Value by Mortgage Status in Labette
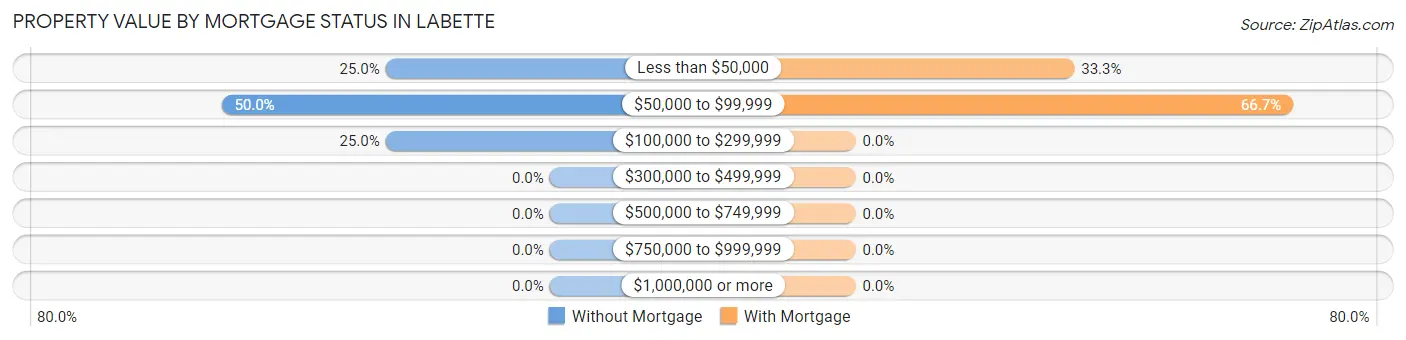
| Property Value | Without Mortgage | With Mortgage |
| Less than $50,000 | 2 (25.0%) | 1 (33.3%) |
| $50,000 to $99,999 | 4 (50.0%) | 2 (66.7%) |
| $100,000 to $299,999 | 2 (25.0%) | 0 (0.0%) |
| $300,000 to $499,999 | 0 (0.0%) | 0 (0.0%) |
| $500,000 to $749,999 | 0 (0.0%) | 0 (0.0%) |
| $750,000 to $999,999 | 0 (0.0%) | 0 (0.0%) |
| $1,000,000 or more | 0 (0.0%) | 0 (0.0%) |
| Total | 8 (100.0%) | 3 (100.0%) |
Household Income by Mortgage Status in Labette
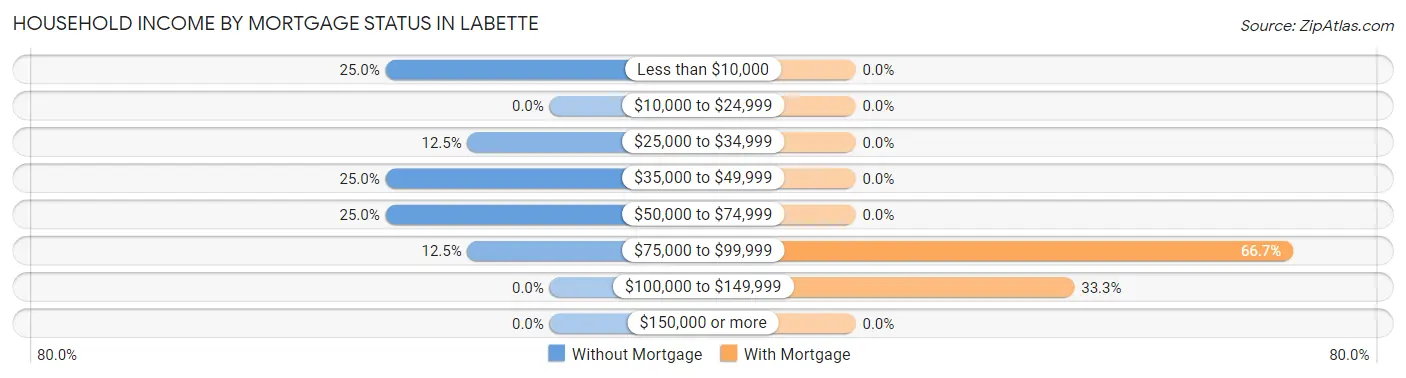
| Household Income | Without Mortgage | With Mortgage |
| Less than $10,000 | 2 (25.0%) | 0 (0.0%) |
| $10,000 to $24,999 | 0 (0.0%) | 0 (0.0%) |
| $25,000 to $34,999 | 1 (12.5%) | 0 (0.0%) |
| $35,000 to $49,999 | 2 (25.0%) | 0 (0.0%) |
| $50,000 to $74,999 | 2 (25.0%) | 0 (0.0%) |
| $75,000 to $99,999 | 1 (12.5%) | 2 (66.7%) |
| $100,000 to $149,999 | 0 (0.0%) | 1 (33.3%) |
| $150,000 or more | 0 (0.0%) | 0 (0.0%) |
| Total | 8 (100.0%) | 3 (100.0%) |
Property Value to Household Income Ratio in Labette
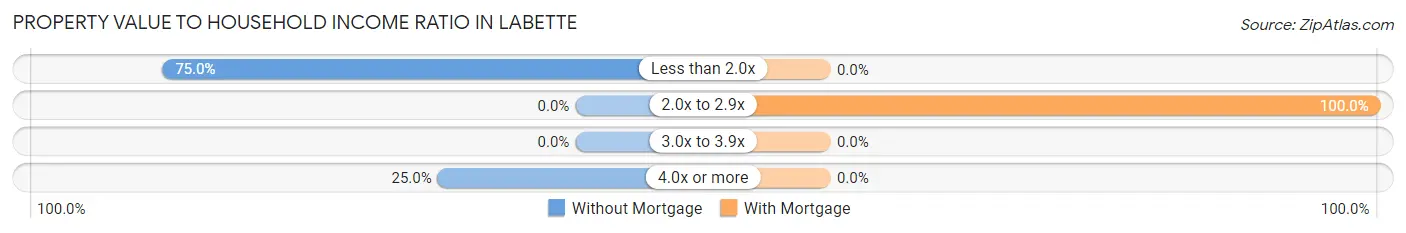
| Value-to-Income Ratio | Without Mortgage | With Mortgage |
| Less than 2.0x | 6 (75.0%) | 0 (0.0%) |
| 2.0x to 2.9x | 0 (0.0%) | 3 (100.0%) |
| 3.0x to 3.9x | 0 (0.0%) | 0 (0.0%) |
| 4.0x or more | 2 (25.0%) | 0 (0.0%) |
| Total | 8 (100.0%) | 3 (100.0%) |
Real Estate Taxes by Mortgage Status in Labette
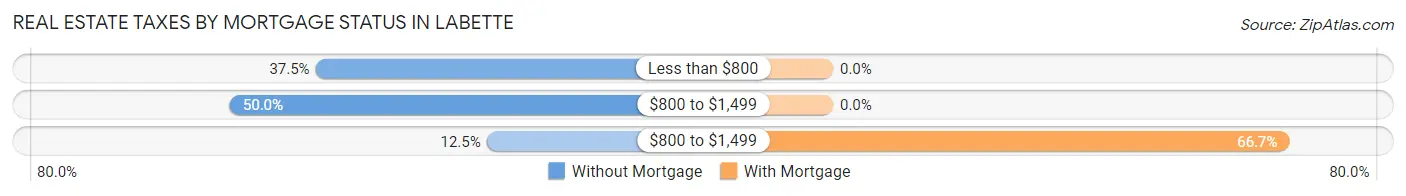
| Property Taxes | Without Mortgage | With Mortgage |
| Less than $800 | 3 (37.5%) | 0 (0.0%) |
| $800 to $1,499 | 4 (50.0%) | 0 (0.0%) |
| $800 to $1,499 | 1 (12.5%) | 2 (66.7%) |
| Total | 8 (100.0%) | 3 (100.0%) |
Health & Disability in Labette
Health Insurance Coverage by Age in Labette
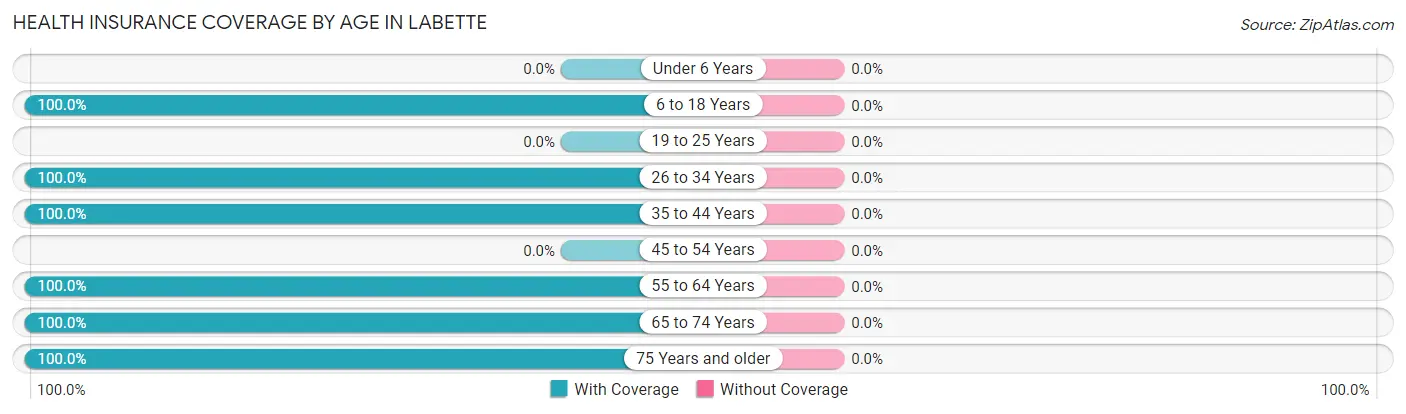
| Age Bracket | With Coverage | Without Coverage |
| Under 6 Years | 0 (0.0%) | 0 (0.0%) |
| 6 to 18 Years | 1 (100.0%) | 0 (0.0%) |
| 19 to 25 Years | 0 (0.0%) | 0 (0.0%) |
| 26 to 34 Years | 1 (100.0%) | 0 (0.0%) |
| 35 to 44 Years | 4 (100.0%) | 0 (0.0%) |
| 45 to 54 Years | 0 (0.0%) | 0 (0.0%) |
| 55 to 64 Years | 1 (100.0%) | 0 (0.0%) |
| 65 to 74 Years | 10 (100.0%) | 0 (0.0%) |
| 75 Years and older | 5 (100.0%) | 0 (0.0%) |
| Total | 22 (100.0%) | 0 (0.0%) |
Health Insurance Coverage by Citizenship Status in Labette
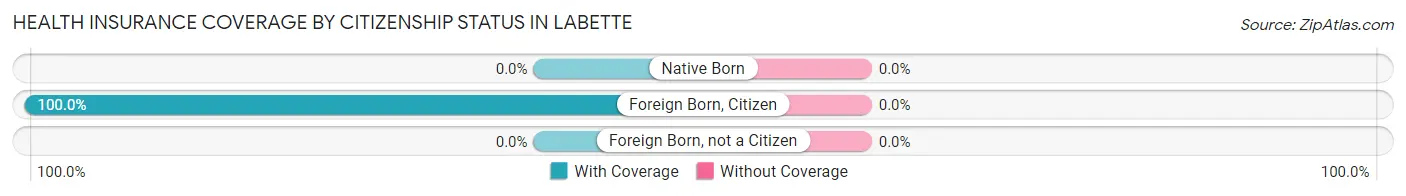
| Citizenship Status | With Coverage | Without Coverage |
| Native Born | 0 (0.0%) | 0 (0.0%) |
| Foreign Born, Citizen | 1 (100.0%) | 0 (0.0%) |
| Foreign Born, not a Citizen | 0 (0.0%) | 0 (0.0%) |
Health Insurance Coverage by Household Income in Labette
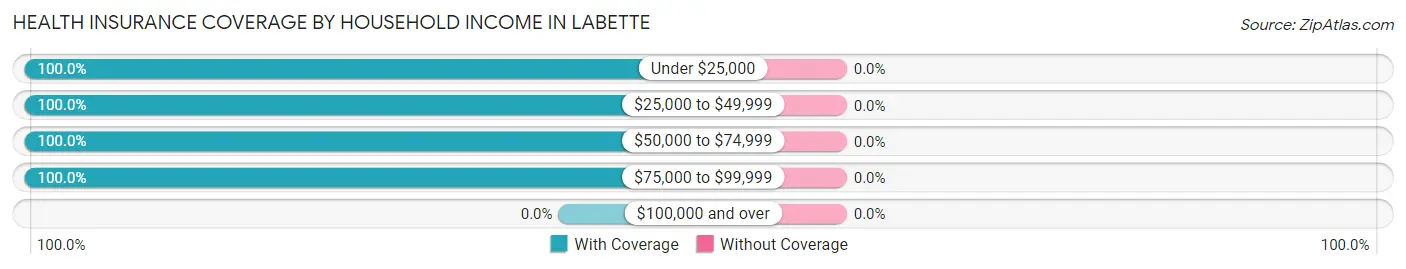
| Household Income | With Coverage | Without Coverage |
| Under $25,000 | 2 (100.0%) | 0 (0.0%) |
| $25,000 to $49,999 | 6 (100.0%) | 0 (0.0%) |
| $50,000 to $74,999 | 9 (100.0%) | 0 (0.0%) |
| $75,000 to $99,999 | 5 (100.0%) | 0 (0.0%) |
| $100,000 and over | 0 (0.0%) | 0 (0.0%) |
Public vs Private Health Insurance Coverage by Age in Labette
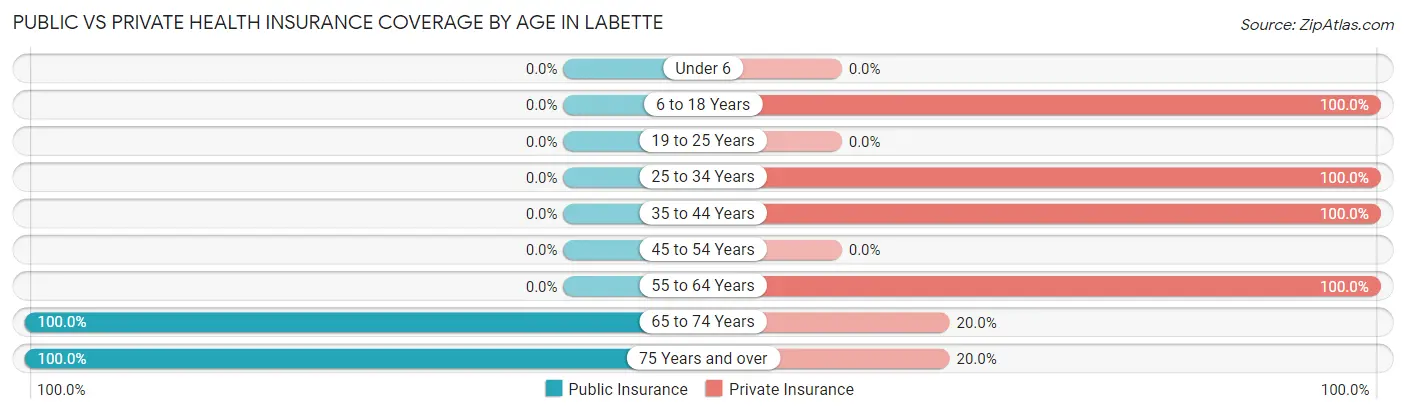
| Age Bracket | Public Insurance | Private Insurance |
| Under 6 | 0 (0.0%) | 0 (0.0%) |
| 6 to 18 Years | 0 (0.0%) | 1 (100.0%) |
| 19 to 25 Years | 0 (0.0%) | 0 (0.0%) |
| 25 to 34 Years | 0 (0.0%) | 1 (100.0%) |
| 35 to 44 Years | 0 (0.0%) | 4 (100.0%) |
| 45 to 54 Years | 0 (0.0%) | 0 (0.0%) |
| 55 to 64 Years | 0 (0.0%) | 1 (100.0%) |
| 65 to 74 Years | 10 (100.0%) | 2 (20.0%) |
| 75 Years and over | 5 (100.0%) | 1 (20.0%) |
| Total | 15 (68.2%) | 10 (45.5%) |
Disability Status by Sex by Age in Labette
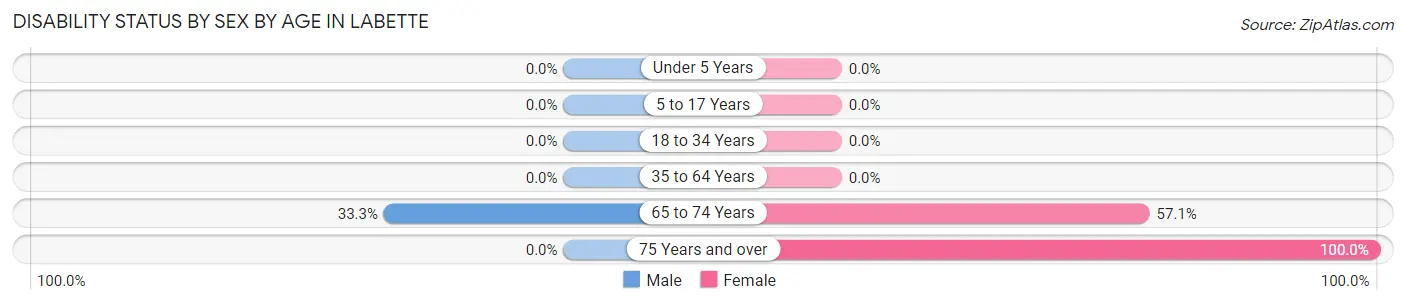
| Age Bracket | Male | Female |
| Under 5 Years | 0 (0.0%) | 0 (0.0%) |
| 5 to 17 Years | 0 (0.0%) | 0 (0.0%) |
| 18 to 34 Years | 0 (0.0%) | 0 (0.0%) |
| 35 to 64 Years | 0 (0.0%) | 0 (0.0%) |
| 65 to 74 Years | 1 (33.3%) | 4 (57.1%) |
| 75 Years and over | 0 (0.0%) | 2 (100.0%) |
Disability Class by Sex by Age in Labette
Disability Class: Hearing Difficulty
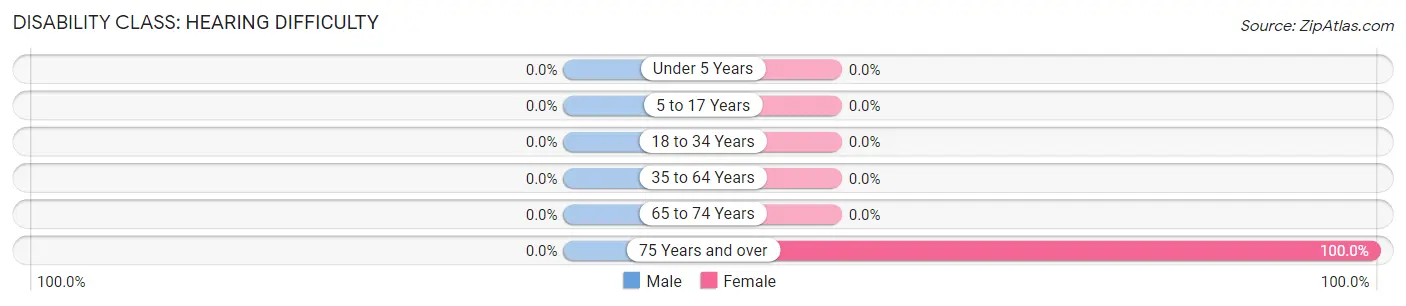
| Age Bracket | Male | Female |
| Under 5 Years | 0 (0.0%) | 0 (0.0%) |
| 5 to 17 Years | 0 (0.0%) | 0 (0.0%) |
| 18 to 34 Years | 0 (0.0%) | 0 (0.0%) |
| 35 to 64 Years | 0 (0.0%) | 0 (0.0%) |
| 65 to 74 Years | 0 (0.0%) | 0 (0.0%) |
| 75 Years and over | 0 (0.0%) | 2 (100.0%) |
Disability Class: Vision Difficulty
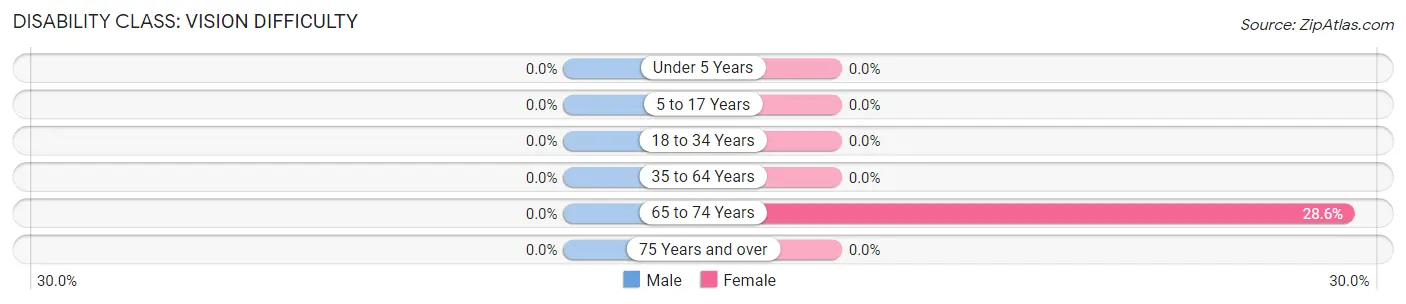
| Age Bracket | Male | Female |
| Under 5 Years | 0 (0.0%) | 0 (0.0%) |
| 5 to 17 Years | 0 (0.0%) | 0 (0.0%) |
| 18 to 34 Years | 0 (0.0%) | 0 (0.0%) |
| 35 to 64 Years | 0 (0.0%) | 0 (0.0%) |
| 65 to 74 Years | 0 (0.0%) | 2 (28.6%) |
| 75 Years and over | 0 (0.0%) | 0 (0.0%) |
Disability Class: Cognitive Difficulty
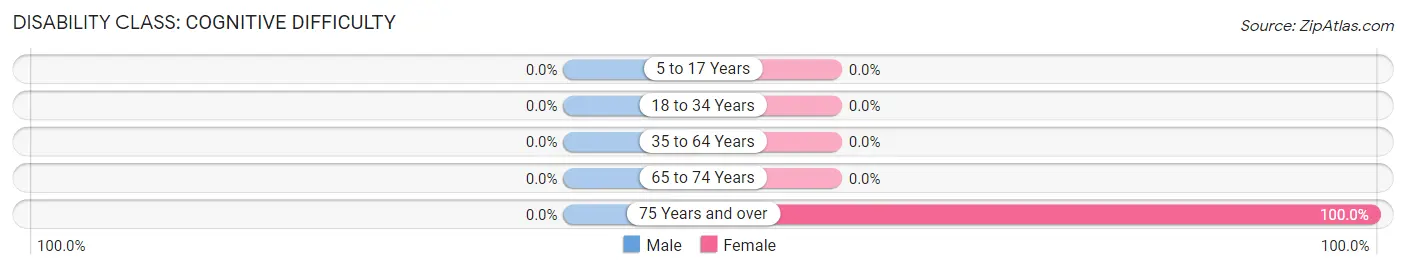
| Age Bracket | Male | Female |
| 5 to 17 Years | 0 (0.0%) | 0 (0.0%) |
| 18 to 34 Years | 0 (0.0%) | 0 (0.0%) |
| 35 to 64 Years | 0 (0.0%) | 0 (0.0%) |
| 65 to 74 Years | 0 (0.0%) | 0 (0.0%) |
| 75 Years and over | 0 (0.0%) | 2 (100.0%) |
Disability Class: Ambulatory Difficulty
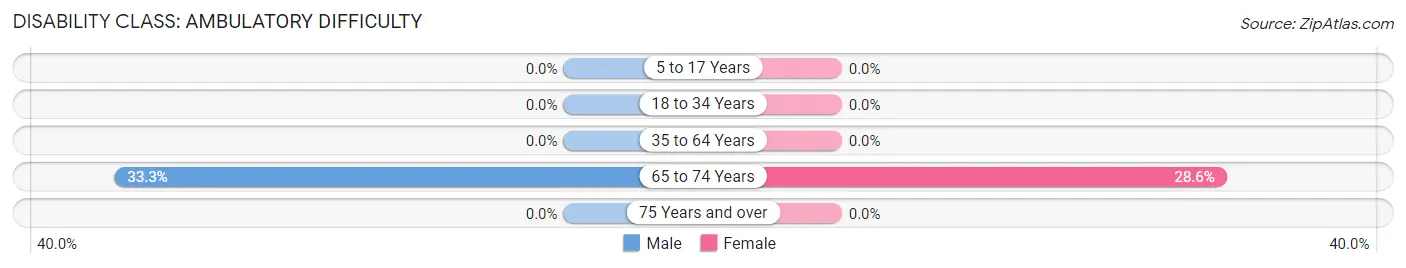
| Age Bracket | Male | Female |
| 5 to 17 Years | 0 (0.0%) | 0 (0.0%) |
| 18 to 34 Years | 0 (0.0%) | 0 (0.0%) |
| 35 to 64 Years | 0 (0.0%) | 0 (0.0%) |
| 65 to 74 Years | 1 (33.3%) | 2 (28.6%) |
| 75 Years and over | 0 (0.0%) | 0 (0.0%) |
Disability Class: Self-Care Difficulty
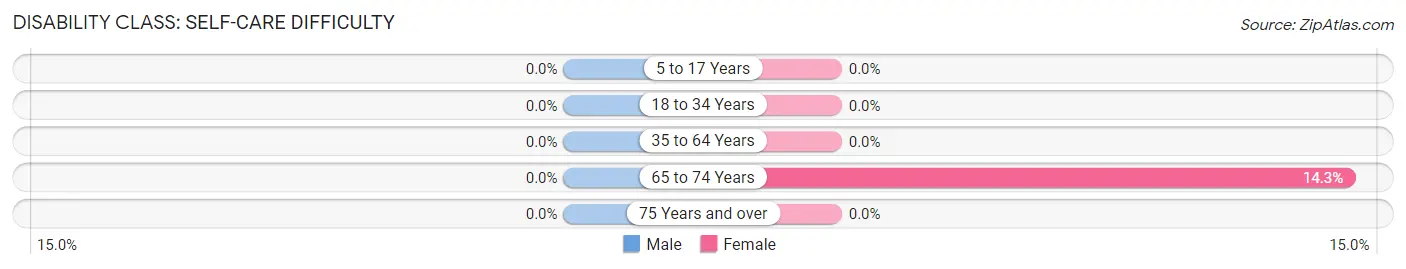
| Age Bracket | Male | Female |
| 5 to 17 Years | 0 (0.0%) | 0 (0.0%) |
| 18 to 34 Years | 0 (0.0%) | 0 (0.0%) |
| 35 to 64 Years | 0 (0.0%) | 0 (0.0%) |
| 65 to 74 Years | 0 (0.0%) | 1 (14.3%) |
| 75 Years and over | 0 (0.0%) | 0 (0.0%) |
Technology Access in Labette
Computing Device Access in Labette
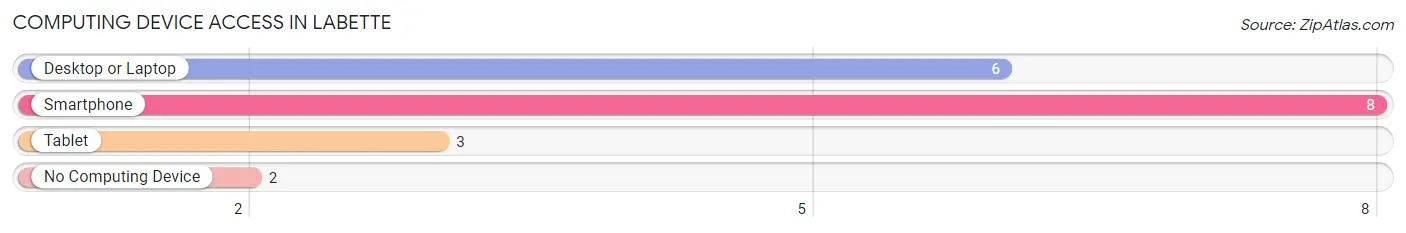
| Device Type | # Households | % Households |
| Desktop or Laptop | 6 | 54.5% |
| Smartphone | 8 | 72.7% |
| Tablet | 3 | 27.3% |
| No Computing Device | 2 | 18.2% |
| Total | 11 | 100.0% |
Internet Access in Labette
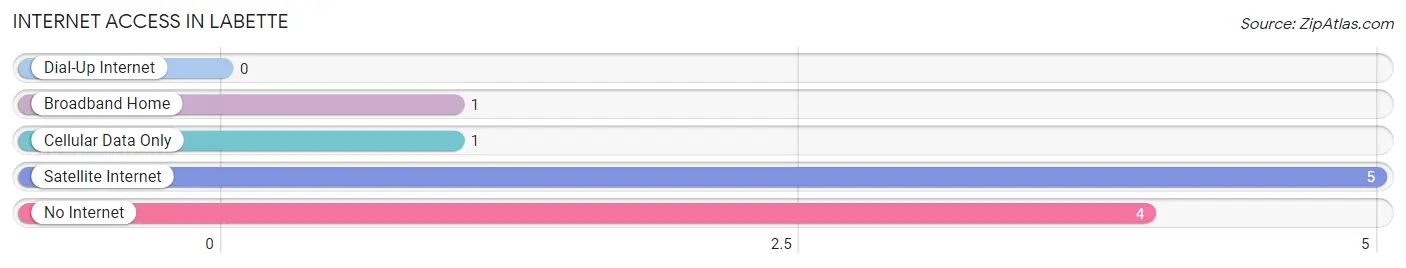
| Internet Type | # Households | % Households |
| Dial-Up Internet | 0 | 0.0% |
| Broadband Home | 1 | 9.1% |
| Cellular Data Only | 1 | 9.1% |
| Satellite Internet | 5 | 45.5% |
| No Internet | 4 | 36.4% |
| Total | 11 | 100.0% |
Labette Summary
Labette County, Kansas is located in the southeastern corner of the state, and is bordered by Missouri to the east, Oklahoma to the south, and Neosho County to the west. The county seat is the city of Parsons, and the county is named after the Labette Creek, which runs through the county. The county has a total area of 576 square miles, and a population of approximately 11,000 people.
Labette County was established in 1867, and was originally part of the Osage Indian Reservation. The county was named after the Labette Creek, which was named after a French trapper named Pierre Labette. The county was originally home to several Native American tribes, including the Osage, Kaw, and Pawnee.
The economy of Labette County is largely based on agriculture, with corn, soybeans, and wheat being the main crops. The county also has a strong manufacturing sector, with companies such as John Deere, Caterpillar, and Tyson Foods having a presence in the area. The county also has a strong tourism industry, with attractions such as the Parsons Historical Museum, the Parsons Public Library, and the Parsons Arts Center.
The demographics of Labette County are largely white, with approximately 90% of the population being white. The remaining 10% of the population is made up of African Americans, Hispanics, and Native Americans. The median household income in Labette County is approximately $40,000, and the median home value is around $90,000.
Labette County is served by several school districts, including Parsons USD 503, Labette County USD 506, and Oswego USD 504. The county also has several higher education institutions, including Labette Community College, Pittsburg State University, and Fort Scott Community College.
Labette County is a great place to live, work, and play. The county has a strong economy, a diverse population, and a variety of attractions and activities. Whether you are looking for a place to raise a family, start a business, or just enjoy the outdoors, Labette County has something for everyone.
Common Questions
What is Per Capita Income in Labette?
Per Capita income in Labette is $25,405.
What is the Median Family Income in Labette?
Median Family Income in Labette is $61,875.
What is the Median Household income in Labette?
Median Household Income in Labette is $60,625.
What is Inequality or Gini Index in Labette?
Inequality or Gini Index in Labette is 0.28.
What is the Total Population of Labette?
Total Population of Labette is 22.
What is the Total Male Population of Labette?
Total Male Population of Labette is 10.
What is the Total Female Population of Labette?
Total Female Population of Labette is 12.
What is the Ratio of Males per 100 Females in Labette?
There are 83.33 Males per 100 Females in Labette.
What is the Ratio of Females per 100 Males in Labette?
There are 120.00 Females per 100 Males in Labette.
What is the Median Population Age in Labette?
Median Population Age in Labette is 69.5 Years.
What is the Average Family Size in Labette
Average Family Size in Labette is 2.2 People.
What is the Average Household Size in Labette
Average Household Size in Labette is 2.0 People.
How Large is the Labor Force in Labette?
There are 9 People in the Labor Forcein in Labette.
What is the Percentage of People in the Labor Force in Labette?
40.9% of People are in the Labor Force in Labette.