Paraguayan vs Tsimshian Wage/Income Gap
COMPARE
Paraguayan
Tsimshian
Wage/Income Gap
Wage/Income Gap Comparison
Paraguayans
Tsimshian
25.8%
WAGE/INCOME GAP
46.7/ 100
METRIC RATING
176th/ 347
METRIC RANK
23.9%
WAGE/INCOME GAP
98.9/ 100
METRIC RATING
103rd/ 347
METRIC RANK
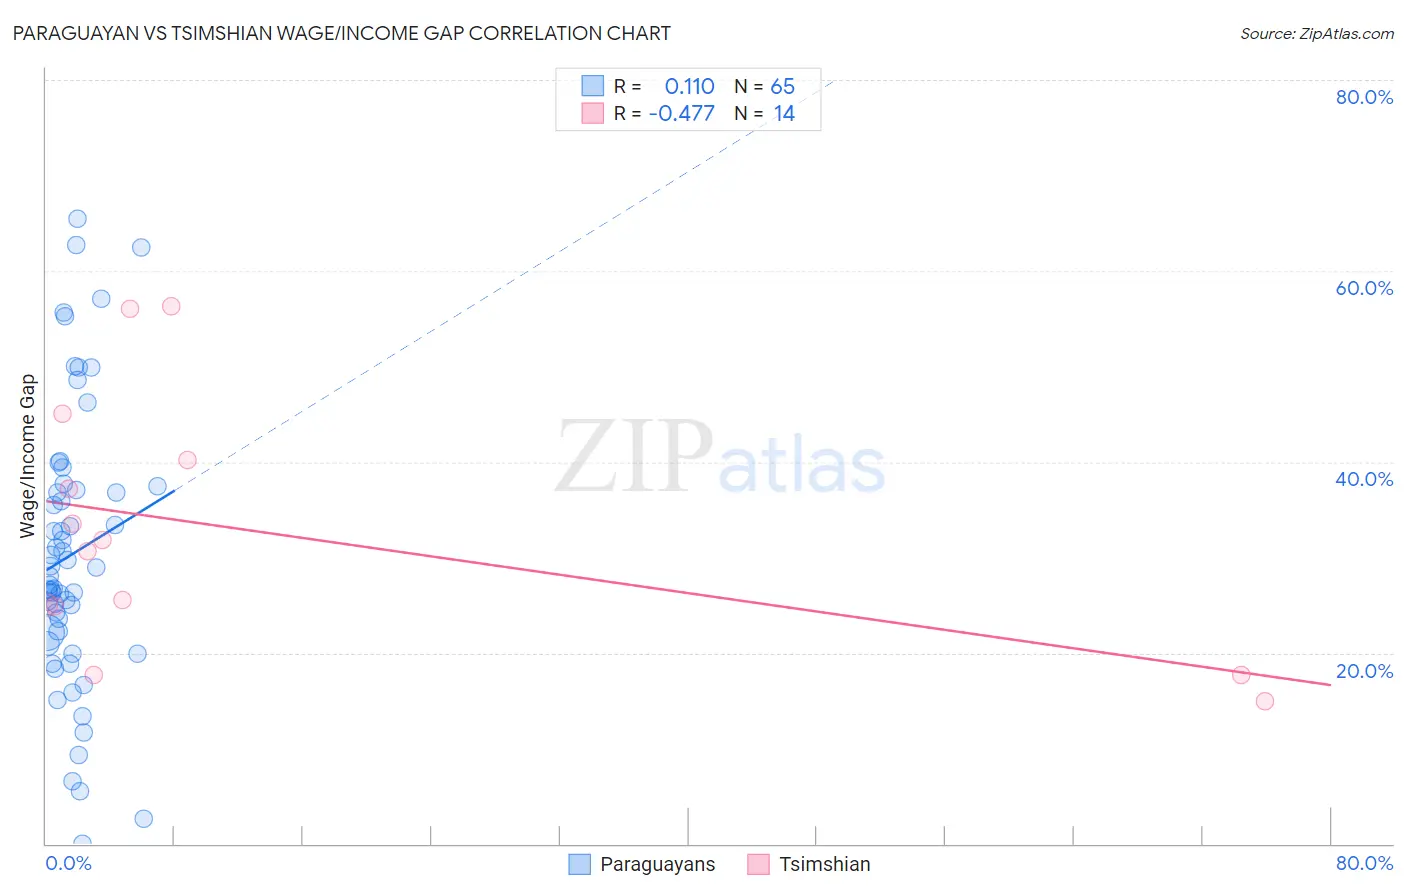
Paraguayan vs Tsimshian Wage/Income Gap Correlation Chart
The statistical analysis conducted on geographies consisting of 95,100,210 people shows a poor positive correlation between the proportion of Paraguayans and wage/income gap percentage in the United States with a correlation coefficient (R) of 0.110 and weighted average of 25.8%. Similarly, the statistical analysis conducted on geographies consisting of 15,623,634 people shows a moderate negative correlation between the proportion of Tsimshian and wage/income gap percentage in the United States with a correlation coefficient (R) of -0.477 and weighted average of 23.9%, a difference of 8.2%.
Wage/Income Gap Correlation Summary
| Measurement | Paraguayan | Tsimshian |
| Minimum | 0.048% | 14.9% |
| Maximum | 65.5% | 56.3% |
| Range | 65.4% | 41.4% |
| Mean | 30.3% | 32.6% |
| Median | 28.0% | 31.2% |
| Interquartile 25% (IQ1) | 21.5% | 24.9% |
| Interquartile 75% (IQ3) | 37.3% | 40.2% |
| Interquartile Range (IQR) | 15.8% | 15.3% |
| Standard Deviation (Sample) | 14.5% | 13.2% |
| Standard Deviation (Population) | 14.3% | 12.7% |
Similar Demographics by Wage/Income Gap
Demographics Similar to Paraguayans by Wage/Income Gap
In terms of wage/income gap, the demographic groups most similar to Paraguayans are Sri Lankan (25.8%, a difference of 0.020%), Cambodian (25.8%, a difference of 0.11%), Alaskan Athabascan (25.8%, a difference of 0.21%), Chinese (25.9%, a difference of 0.32%), and Immigrants from Belarus (25.7%, a difference of 0.41%).
| Demographics | Rating | Rank | Wage/Income Gap |
| Peruvians | 60.1 /100 | #169 | Good 25.6% |
| Immigrants | Oceania | 57.5 /100 | #170 | Average 25.6% |
| Immigrants | Greece | 56.6 /100 | #171 | Average 25.7% |
| Immigrants | Chile | 53.2 /100 | #172 | Average 25.7% |
| Immigrants | Belarus | 52.9 /100 | #173 | Average 25.7% |
| Alaskan Athabascans | 50.0 /100 | #174 | Average 25.8% |
| Sri Lankans | 47.0 /100 | #175 | Average 25.8% |
| Paraguayans | 46.7 /100 | #176 | Average 25.8% |
| Cambodians | 45.1 /100 | #177 | Average 25.8% |
| Chinese | 42.0 /100 | #178 | Average 25.9% |
| Samoans | 38.6 /100 | #179 | Fair 26.0% |
| Guamanians/Chamorros | 38.0 /100 | #180 | Fair 26.0% |
| Immigrants | Bolivia | 36.4 /100 | #181 | Fair 26.0% |
| Immigrants | Serbia | 35.4 /100 | #182 | Fair 26.0% |
| Immigrants | Kazakhstan | 35.2 /100 | #183 | Fair 26.0% |
Demographics Similar to Tsimshian by Wage/Income Gap
In terms of wage/income gap, the demographic groups most similar to Tsimshian are Immigrants from Laos (23.8%, a difference of 0.23%), Tlingit-Haida (24.0%, a difference of 0.33%), Japanese (23.8%, a difference of 0.37%), Moroccan (24.0%, a difference of 0.39%), and Sudanese (24.0%, a difference of 0.39%).
| Demographics | Rating | Rank | Wage/Income Gap |
| Kiowa | 99.4 /100 | #96 | Exceptional 23.6% |
| Immigrants | Sudan | 99.4 /100 | #97 | Exceptional 23.6% |
| Immigrants | Latin America | 99.2 /100 | #98 | Exceptional 23.7% |
| Aleuts | 99.2 /100 | #99 | Exceptional 23.7% |
| Yakama | 99.2 /100 | #100 | Exceptional 23.7% |
| Japanese | 99.1 /100 | #101 | Exceptional 23.8% |
| Immigrants | Laos | 99.0 /100 | #102 | Exceptional 23.8% |
| Tsimshian | 98.9 /100 | #103 | Exceptional 23.9% |
| Tlingit-Haida | 98.7 /100 | #104 | Exceptional 24.0% |
| Moroccans | 98.6 /100 | #105 | Exceptional 24.0% |
| Sudanese | 98.6 /100 | #106 | Exceptional 24.0% |
| Yaqui | 98.4 /100 | #107 | Exceptional 24.0% |
| Immigrants | Albania | 98.4 /100 | #108 | Exceptional 24.0% |
| Ugandans | 98.3 /100 | #109 | Exceptional 24.1% |
| Immigrants | Morocco | 98.1 /100 | #110 | Exceptional 24.1% |