Korean Unemployment Among Women with Children Ages 6 to 17 years
COMPARE
Korean
Select to Compare
Unemployment Among Women with Children Ages 6 to 17 years
Korean Unemployment Among Women with Children Ages 6 to 17 years
8.2%
UNEMPLOYMENT | WOMEN W/ CHILDREN 6 TO 17
100.0/ 100
METRIC RATING
61st/ 347
METRIC RANK
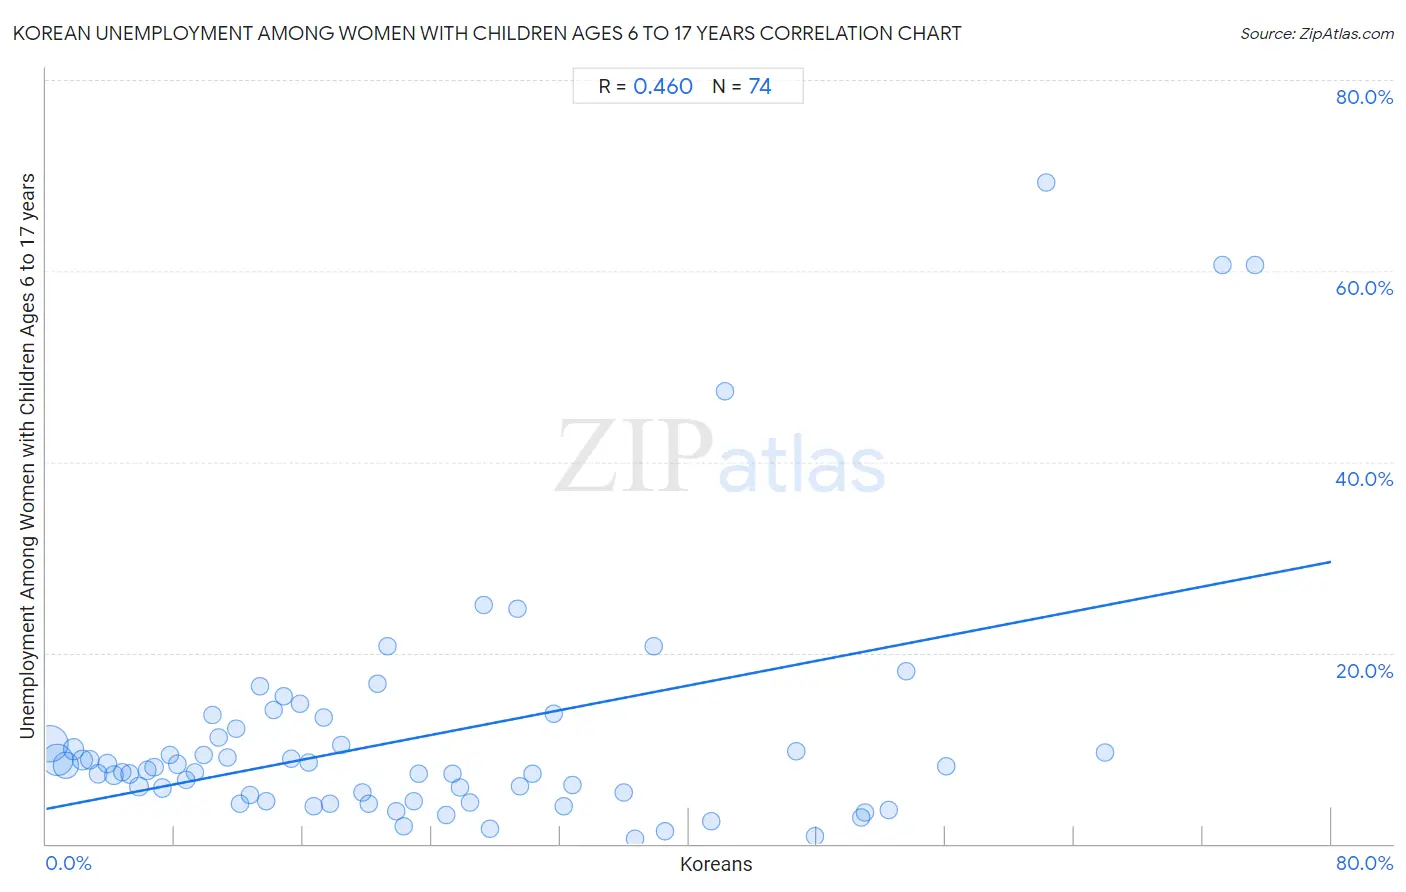
Korean Unemployment Among Women with Children Ages 6 to 17 years Correlation Chart
The statistical analysis conducted on geographies consisting of 342,207,280 people shows a moderate positive correlation between the proportion of Koreans and unemployment rate among women with children between the ages 6 and 17 in the United States with a correlation coefficient (R) of 0.460 and weighted average of 8.2%. On average, for every 1% (one percent) increase in Koreans within a typical geography, there is an increase of 0.32% in unemployment rate among women with children between the ages 6 and 17.
It is essential to understand that the correlation between the percentage of Koreans and unemployment rate among women with children between the ages 6 and 17 does not imply a direct cause-and-effect relationship. It remains uncertain whether the presence of Koreans influences an upward or downward trend in the level of unemployment rate among women with children between the ages 6 and 17 within an area, or if Koreans simply ended up residing in those areas with higher or lower levels of unemployment rate among women with children between the ages 6 and 17 due to other factors.
Demographics Similar to Koreans by Unemployment Among Women with Children Ages 6 to 17 years
In terms of unemployment among women with children ages 6 to 17 years, the demographic groups most similar to Koreans are Spanish American Indian (8.2%, a difference of 0.030%), Basque (8.2%, a difference of 0.18%), Immigrants from Philippines (8.2%, a difference of 0.19%), Immigrants from Malaysia (8.2%, a difference of 0.25%), and Immigrants from South Eastern Asia (8.2%, a difference of 0.43%).
| Demographics | Rating | Rank | Unemployment Among Women with Children Ages 6 to 17 years |
| Immigrants from Armenia | 100.0 /100 | #54 | Exceptional 8.2% |
| Immigrants from Japan | 100.0 /100 | #55 | Exceptional 8.2% |
| Immigrants from Bosnia and Herzegovina | 100.0 /100 | #56 | Exceptional 8.2% |
| Immigrants from Laos | 100.0 /100 | #57 | Exceptional 8.2% |
| Immigrants from Malaysia | 100.0 /100 | #58 | Exceptional 8.2% |
| Immigrants from Philippines | 100.0 /100 | #59 | Exceptional 8.2% |
| Basques | 100.0 /100 | #60 | Exceptional 8.2% |
| Koreans | 100.0 /100 | #61 | Exceptional 8.2% |
| Spanish American Indians | 100.0 /100 | #62 | Exceptional 8.2% |
| Immigrants from South Eastern Asia | 99.9 /100 | #63 | Exceptional 8.2% |
| Immigrants from Kuwait | 99.9 /100 | #64 | Exceptional 8.3% |
| Immigrants from Albania | 99.9 /100 | #65 | Exceptional 8.3% |
| Luxembourgers | 99.9 /100 | #66 | Exceptional 8.3% |
| Armenians | 99.9 /100 | #67 | Exceptional 8.3% |
| Marshallese | 99.9 /100 | #68 | Exceptional 8.3% |
Korean Unemployment Among Women with Children Ages 6 to 17 years Correlation Summary
| Measurement | Korean Data | Unemployment Among Women with Children Ages 6 to 17 years Data |
| Minimum | 0.26% | 0.50% |
| Maximum | 75.3% | 69.2% |
| Range | 75.0% | 68.7% |
| Mean | 23.3% | 11.2% |
| Median | 19.0% | 7.9% |
| Interquartile 25% (IQ1) | 9.3% | 4.5% |
| Interquartile 75% (IQ3) | 32.2% | 11.2% |
| Interquartile Range (IQR) | 22.9% | 6.6% |
| Standard Deviation (Sample) | 18.3% | 12.8% |
| Standard Deviation (Population) | 18.1% | 12.8% |
Correlation Details
| Korean Percentile | Sample Size | Unemployment Among Women with Children Ages 6 to 17 years |
[ 0.0% - 0.5% ] 0.26% | 113,241,937 | 10.5% |
[ 0.5% - 1.0% ] 0.70% | 84,704,477 | 8.8% |
[ 1.0% - 1.5% ] 1.21% | 49,827,129 | 8.3% |
[ 1.5% - 2.0% ] 1.72% | 16,863,047 | 9.9% |
[ 2.0% - 2.5% ] 2.25% | 14,448,970 | 8.8% |
[ 2.5% - 3.0% ] 2.72% | 9,584,758 | 8.8% |
[ 3.0% - 3.5% ] 3.23% | 7,221,407 | 7.4% |
[ 3.5% - 4.0% ] 3.79% | 9,656,012 | 8.4% |
[ 4.0% - 4.5% ] 4.20% | 5,258,606 | 7.1% |
[ 4.5% - 5.0% ] 4.74% | 3,321,797 | 7.5% |
[ 5.0% - 5.5% ] 5.18% | 4,331,819 | 7.3% |
[ 5.5% - 6.0% ] 5.76% | 4,041,522 | 6.0% |
[ 6.0% - 6.5% ] 6.28% | 3,252,887 | 7.7% |
[ 6.5% - 7.0% ] 6.73% | 3,390,952 | 8.0% |
[ 7.0% - 7.5% ] 7.22% | 1,297,053 | 5.8% |
[ 7.5% - 8.0% ] 7.73% | 894,320 | 9.3% |
[ 8.0% - 8.5% ] 8.17% | 1,731,132 | 8.3% |
[ 8.5% - 9.0% ] 8.72% | 1,110,310 | 6.7% |
[ 9.0% - 9.5% ] 9.28% | 1,108,426 | 7.5% |
[ 9.5% - 10.0% ] 9.83% | 475,929 | 9.3% |
[ 10.0% - 10.5% ] 10.36% | 277,084 | 13.5% |
[ 10.5% - 11.0% ] 10.77% | 401,479 | 11.2% |
[ 11.0% - 11.5% ] 11.25% | 393,151 | 9.0% |
[ 11.5% - 12.0% ] 11.80% | 542,399 | 12.1% |
[ 12.0% - 12.5% ] 12.08% | 187,176 | 4.1% |
[ 12.5% - 13.0% ] 12.72% | 243,410 | 5.1% |
[ 13.0% - 13.5% ] 13.28% | 86,298 | 16.6% |
[ 13.5% - 14.0% ] 13.70% | 345,489 | 4.5% |
[ 14.0% - 14.5% ] 14.18% | 531,435 | 14.0% |
[ 14.5% - 15.0% ] 14.81% | 99,941 | 15.4% |
[ 15.0% - 15.5% ] 15.27% | 328,586 | 8.9% |
[ 15.5% - 16.0% ] 15.82% | 173,651 | 14.7% |
[ 16.0% - 16.5% ] 16.31% | 73,579 | 8.6% |
[ 16.5% - 17.0% ] 16.69% | 70,214 | 3.9% |
[ 17.0% - 17.5% ] 17.25% | 189,484 | 13.2% |
[ 17.5% - 18.0% ] 17.64% | 93,036 | 4.2% |
[ 18.0% - 18.5% ] 18.37% | 7,418 | 10.4% |
[ 19.5% - 20.0% ] 19.72% | 538,918 | 5.4% |
[ 20.0% - 20.5% ] 20.05% | 67,514 | 4.2% |
[ 20.5% - 21.0% ] 20.63% | 664 | 16.7% |
[ 21.0% - 21.5% ] 21.24% | 35,608 | 20.7% |
[ 21.5% - 22.0% ] 21.77% | 127,228 | 3.5% |
[ 22.0% - 22.5% ] 22.27% | 140,738 | 1.9% |
[ 22.5% - 23.0% ] 22.84% | 238,848 | 4.5% |
[ 23.0% - 23.5% ] 23.23% | 140,835 | 7.4% |
[ 24.5% - 25.0% ] 24.88% | 89,016 | 3.1% |
[ 25.0% - 25.5% ] 25.32% | 63,106 | 7.4% |
[ 25.5% - 26.0% ] 25.78% | 56,367 | 5.9% |
[ 26.0% - 26.5% ] 26.39% | 22,247 | 4.3% |
[ 27.0% - 27.5% ] 27.25% | 2,716 | 25.0% |
[ 27.5% - 28.0% ] 27.64% | 29,018 | 1.6% |
[ 29.0% - 29.5% ] 29.34% | 13,932 | 24.6% |
[ 29.5% - 30.0% ] 29.53% | 54,470 | 6.0% |
[ 30.0% - 30.5% ] 30.28% | 41,834 | 7.3% |
[ 31.5% - 32.0% ] 31.62% | 3,902 | 13.6% |
[ 32.0% - 32.5% ] 32.22% | 148,162 | 4.0% |
[ 32.5% - 33.0% ] 32.72% | 162,383 | 6.1% |
[ 35.5% - 36.0% ] 35.94% | 11,029 | 5.4% |
[ 36.5% - 37.0% ] 36.62% | 22,701 | 0.50% |
[ 37.5% - 38.0% ] 37.79% | 4,708 | 20.7% |
[ 38.0% - 38.5% ] 38.49% | 12,906 | 1.3% |
[ 41.0% - 41.5% ] 41.37% | 17,400 | 2.4% |
[ 42.0% - 42.5% ] 42.22% | 5,393 | 47.4% |
[ 46.5% - 47.0% ] 46.66% | 52,328 | 9.7% |
[ 47.5% - 48.0% ] 47.85% | 82,504 | 0.80% |
[ 50.5% - 51.0% ] 50.78% | 27,198 | 2.8% |
[ 51.0% - 51.5% ] 51.00% | 27,233 | 3.3% |
[ 52.0% - 52.5% ] 52.44% | 25,902 | 3.5% |
[ 53.5% - 54.0% ] 53.57% | 13,919 | 18.1% |
[ 56.0% - 56.5% ] 56.07% | 72,605 | 8.1% |
[ 62.0% - 62.5% ] 62.24% | 3,909 | 69.2% |
[ 65.5% - 66.0% ] 65.90% | 39,873 | 9.5% |
[ 73.0% - 73.5% ] 73.27% | 1,949 | 60.6% |
[ 75.0% - 75.5% ] 75.28% | 1,897 | 60.6% |