Immigrants from Kuwait vs Comanche Wage/Income Gap
COMPARE
Immigrants from Kuwait
Comanche
Wage/Income Gap
Wage/Income Gap Comparison
Immigrants from Kuwait
Comanche
26.6%
WAGE/INCOME GAP
12.6/ 100
METRIC RATING
209th/ 347
METRIC RANK
25.0%
WAGE/INCOME GAP
85.2/ 100
METRIC RATING
145th/ 347
METRIC RANK
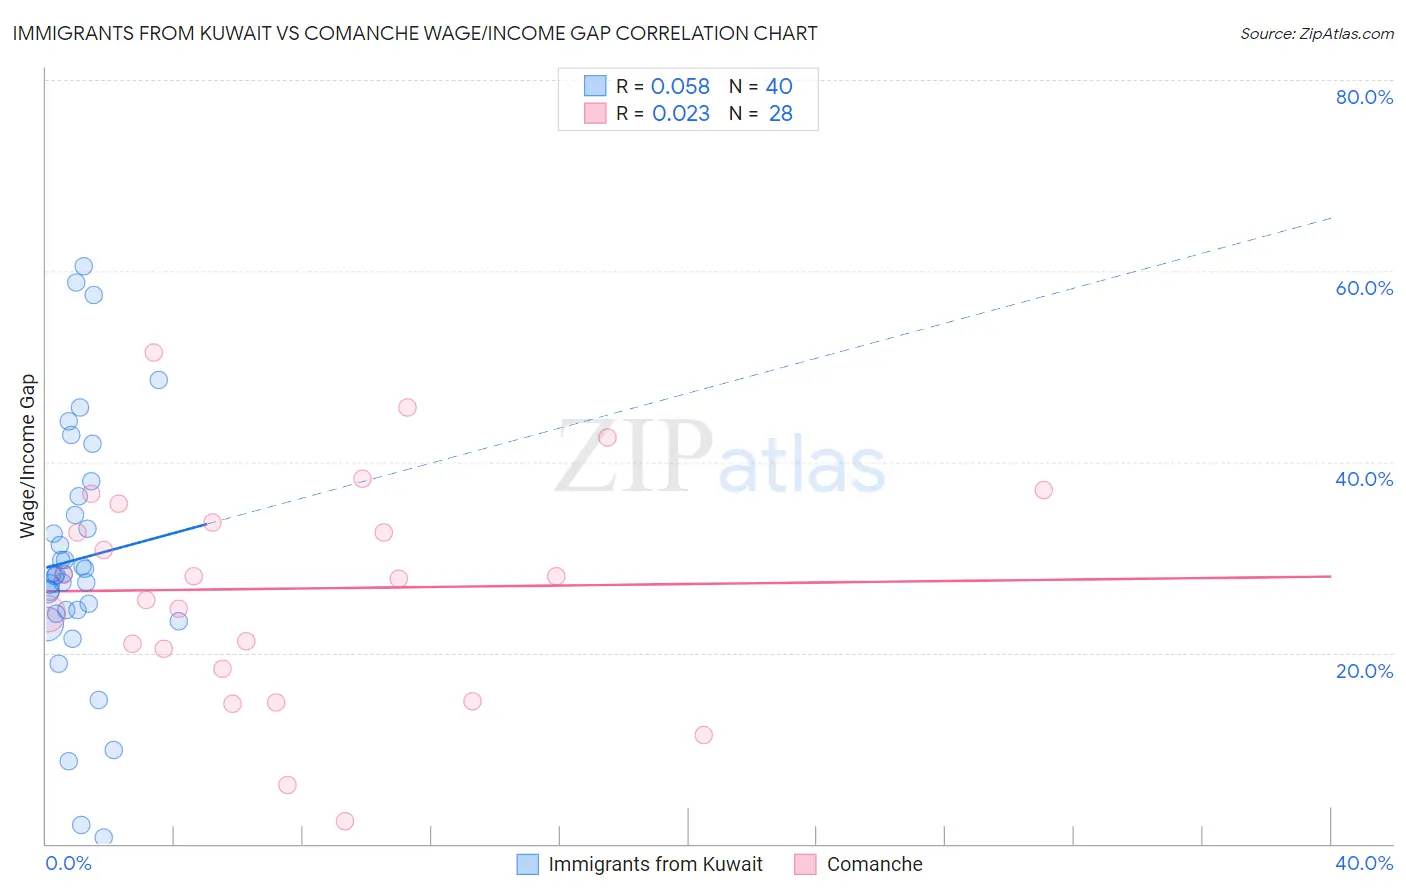
Immigrants from Kuwait vs Comanche Wage/Income Gap Correlation Chart
The statistical analysis conducted on geographies consisting of 136,915,503 people shows a slight positive correlation between the proportion of Immigrants from Kuwait and wage/income gap percentage in the United States with a correlation coefficient (R) of 0.058 and weighted average of 26.6%. Similarly, the statistical analysis conducted on geographies consisting of 109,744,354 people shows no correlation between the proportion of Comanche and wage/income gap percentage in the United States with a correlation coefficient (R) of 0.023 and weighted average of 25.0%, a difference of 6.2%.
Wage/Income Gap Correlation Summary
| Measurement | Immigrants from Kuwait | Comanche |
| Minimum | 0.69% | 2.4% |
| Maximum | 60.5% | 51.5% |
| Range | 59.8% | 49.1% |
| Mean | 29.8% | 26.7% |
| Median | 28.2% | 27.9% |
| Interquartile 25% (IQ1) | 24.3% | 19.4% |
| Interquartile 75% (IQ3) | 35.4% | 34.7% |
| Interquartile Range (IQR) | 11.1% | 15.3% |
| Standard Deviation (Sample) | 13.4% | 11.6% |
| Standard Deviation (Population) | 13.2% | 11.4% |
Similar Demographics by Wage/Income Gap
Demographics Similar to Immigrants from Kuwait by Wage/Income Gap
In terms of wage/income gap, the demographic groups most similar to Immigrants from Kuwait are Egyptian (26.6%, a difference of 0.020%), Arab (26.6%, a difference of 0.040%), Mongolian (26.6%, a difference of 0.17%), Iraqi (26.6%, a difference of 0.20%), and Immigrants from Iraq (26.7%, a difference of 0.35%).
| Demographics | Rating | Rank | Wage/Income Gap |
| Laotians | 19.2 /100 | #202 | Poor 26.4% |
| Immigrants | Eastern Europe | 19.2 /100 | #203 | Poor 26.4% |
| Immigrants | Russia | 19.0 /100 | #204 | Poor 26.4% |
| Immigrants | Southern Europe | 17.3 /100 | #205 | Poor 26.4% |
| Indians (Asian) | 16.5 /100 | #206 | Poor 26.4% |
| Immigrants | Italy | 15.8 /100 | #207 | Poor 26.5% |
| Egyptians | 12.7 /100 | #208 | Poor 26.6% |
| Immigrants | Kuwait | 12.6 /100 | #209 | Poor 26.6% |
| Arabs | 12.3 /100 | #210 | Poor 26.6% |
| Mongolians | 11.4 /100 | #211 | Poor 26.6% |
| Iraqis | 11.2 /100 | #212 | Poor 26.6% |
| Immigrants | Iraq | 10.3 /100 | #213 | Poor 26.7% |
| Immigrants | China | 10.3 /100 | #214 | Poor 26.7% |
| Yugoslavians | 9.7 /100 | #215 | Tragic 26.7% |
| Immigrants | Portugal | 9.5 /100 | #216 | Tragic 26.7% |
Demographics Similar to Comanche by Wage/Income Gap
In terms of wage/income gap, the demographic groups most similar to Comanche are South American (25.0%, a difference of 0.0%), Malaysian (25.0%, a difference of 0.030%), Iroquois (25.1%, a difference of 0.16%), Chippewa (25.0%, a difference of 0.24%), and Immigrants from Peru (25.1%, a difference of 0.31%).
| Demographics | Rating | Rank | Wage/Income Gap |
| Immigrants | Bosnia and Herzegovina | 90.1 /100 | #138 | Exceptional 24.8% |
| Hispanics or Latinos | 89.5 /100 | #139 | Excellent 24.9% |
| Immigrants | Nepal | 89.3 /100 | #140 | Excellent 24.9% |
| Hawaiians | 89.3 /100 | #141 | Excellent 24.9% |
| Afghans | 88.1 /100 | #142 | Excellent 24.9% |
| Immigrants | Uganda | 88.0 /100 | #143 | Excellent 24.9% |
| Chippewa | 86.9 /100 | #144 | Excellent 25.0% |
| Comanche | 85.2 /100 | #145 | Excellent 25.0% |
| South Americans | 85.2 /100 | #146 | Excellent 25.0% |
| Malaysians | 84.9 /100 | #147 | Excellent 25.0% |
| Iroquois | 83.9 /100 | #148 | Excellent 25.1% |
| Immigrants | Peru | 82.6 /100 | #149 | Excellent 25.1% |
| Immigrants | Immigrants | 82.3 /100 | #150 | Excellent 25.1% |
| Taiwanese | 81.6 /100 | #151 | Excellent 25.1% |
| Uruguayans | 81.3 /100 | #152 | Excellent 25.2% |