Immigrants from Guyana Disability Age 5 to 17
COMPARE
Immigrants from Guyana
Select to Compare
Disability Age 5 to 17
Immigrants from Guyana Disability Age 5 to 17
5.2%
DISABILITY | AGE 5 TO 17
99.6/ 100
METRIC RATING
76th/ 347
METRIC RANK
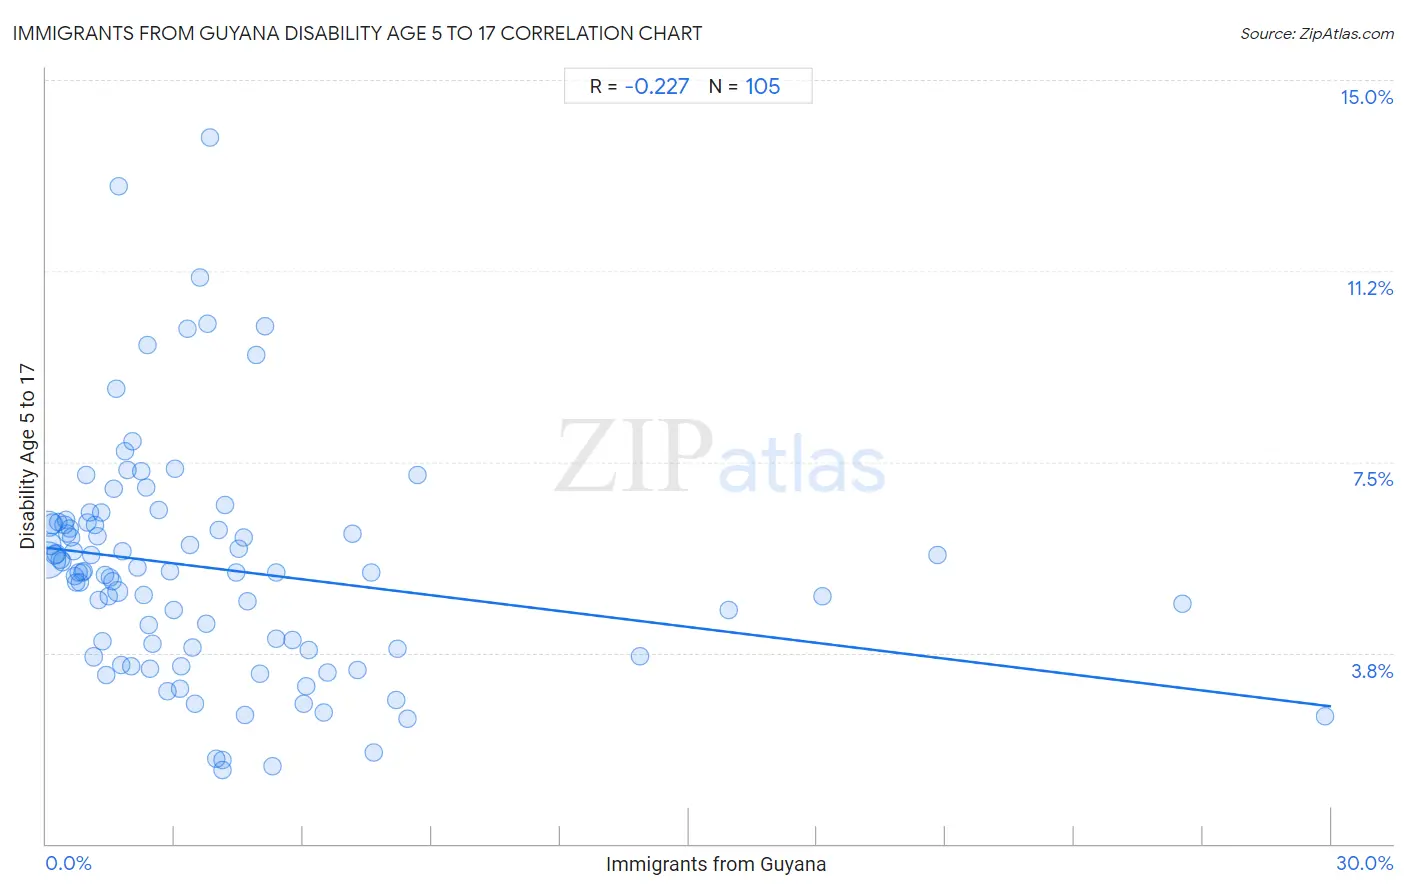
Immigrants from Guyana Disability Age 5 to 17 Correlation Chart
The statistical analysis conducted on geographies consisting of 183,069,872 people shows a weak negative correlation between the proportion of Immigrants from Guyana and percentage of population with a disability between the ages 5 and 17 in the United States with a correlation coefficient (R) of -0.227 and weighted average of 5.2%. On average, for every 1% (one percent) increase in Immigrants from Guyana within a typical geography, there is a decrease of 0.10% in percentage of population with a disability between the ages 5 and 17.
It is essential to understand that the correlation between the percentage of Immigrants from Guyana and percentage of population with a disability between the ages 5 and 17 does not imply a direct cause-and-effect relationship. It remains uncertain whether the presence of Immigrants from Guyana influences an upward or downward trend in the level of percentage of population with a disability between the ages 5 and 17 within an area, or if Immigrants from Guyana simply ended up residing in those areas with higher or lower levels of percentage of population with a disability between the ages 5 and 17 due to other factors.
Demographics Similar to Immigrants from Guyana by Disability Age 5 to 17
In terms of disability age 5 to 17, the demographic groups most similar to Immigrants from Guyana are Immigrants from Kazakhstan (5.2%, a difference of 0.030%), Immigrants from Moldova (5.2%, a difference of 0.040%), Immigrants from Cuba (5.2%, a difference of 0.040%), Afghan (5.2%, a difference of 0.070%), and Sri Lankan (5.2%, a difference of 0.10%).
| Demographics | Rating | Rank | Disability Age 5 to 17 |
| Guyanese | 99.7 /100 | #69 | Exceptional 5.2% |
| Immigrants from Belgium | 99.7 /100 | #70 | Exceptional 5.2% |
| Jordanians | 99.7 /100 | #71 | Exceptional 5.2% |
| Immigrants from Vietnam | 99.7 /100 | #72 | Exceptional 5.2% |
| Immigrants from Czechoslovakia | 99.7 /100 | #73 | Exceptional 5.2% |
| Immigrants from Romania | 99.7 /100 | #74 | Exceptional 5.2% |
| Immigrants from Moldova | 99.6 /100 | #75 | Exceptional 5.2% |
| Immigrants from Guyana | 99.6 /100 | #76 | Exceptional 5.2% |
| Immigrants from Kazakhstan | 99.6 /100 | #77 | Exceptional 5.2% |
| Immigrants from Cuba | 99.6 /100 | #78 | Exceptional 5.2% |
| Afghans | 99.6 /100 | #79 | Exceptional 5.2% |
| Sri Lankans | 99.6 /100 | #80 | Exceptional 5.2% |
| Native Hawaiians | 99.6 /100 | #81 | Exceptional 5.2% |
| Immigrants from Sweden | 99.5 /100 | #82 | Exceptional 5.2% |
| Immigrants from France | 99.5 /100 | #83 | Exceptional 5.2% |
Immigrants from Guyana Disability Age 5 to 17 Correlation Summary
| Measurement | Immigrants from Guyana Data | Disability Age 5 to 17 Data |
| Minimum | 0.017% | 1.5% |
| Maximum | 29.8% | 13.9% |
| Range | 29.8% | 12.4% |
| Mean | 3.9% | 5.4% |
| Median | 2.4% | 5.3% |
| Interquartile 25% (IQ1) | 1.1% | 3.8% |
| Interquartile 75% (IQ3) | 4.8% | 6.3% |
| Interquartile Range (IQR) | 3.7% | 2.5% |
| Standard Deviation (Sample) | 4.9% | 2.3% |
| Standard Deviation (Population) | 4.9% | 2.2% |
Correlation Details
| Immigrants from Guyana Percentile | Sample Size | Disability Age 5 to 17 |
[ 0.0% - 0.5% ] 0.017% | 79,437,083 | 5.6% |
[ 0.0% - 0.5% ] 0.063% | 31,740,649 | 6.3% |
[ 0.0% - 0.5% ] 0.11% | 14,377,828 | 5.9% |
[ 0.0% - 0.5% ] 0.15% | 9,819,239 | 6.3% |
[ 0.0% - 0.5% ] 0.19% | 6,422,549 | 5.7% |
[ 0.0% - 0.5% ] 0.24% | 4,598,886 | 5.7% |
[ 0.0% - 0.5% ] 0.28% | 3,847,381 | 6.3% |
[ 0.0% - 0.5% ] 0.32% | 3,046,468 | 5.6% |
[ 0.0% - 0.5% ] 0.37% | 2,136,254 | 5.5% |
[ 0.0% - 0.5% ] 0.41% | 2,002,657 | 6.3% |
[ 0.0% - 0.5% ] 0.46% | 1,326,307 | 6.4% |
[ 0.0% - 0.5% ] 0.50% | 1,409,819 | 6.1% |
[ 0.5% - 1.0% ] 0.54% | 1,680,317 | 6.2% |
[ 0.5% - 1.0% ] 0.58% | 933,691 | 6.0% |
[ 0.5% - 1.0% ] 0.63% | 893,280 | 5.7% |
[ 0.5% - 1.0% ] 0.67% | 775,122 | 5.2% |
[ 0.5% - 1.0% ] 0.71% | 544,216 | 5.1% |
[ 0.5% - 1.0% ] 0.75% | 477,542 | 5.3% |
[ 0.5% - 1.0% ] 0.80% | 698,314 | 5.1% |
[ 0.5% - 1.0% ] 0.85% | 371,701 | 5.3% |
[ 0.5% - 1.0% ] 0.88% | 603,974 | 5.3% |
[ 0.5% - 1.0% ] 0.94% | 639,760 | 7.3% |
[ 0.5% - 1.0% ] 0.97% | 402,423 | 6.3% |
[ 1.0% - 1.5% ] 1.01% | 459,823 | 6.5% |
[ 1.0% - 1.5% ] 1.05% | 175,189 | 5.7% |
[ 1.0% - 1.5% ] 1.11% | 485,074 | 3.7% |
[ 1.0% - 1.5% ] 1.15% | 240,669 | 6.3% |
[ 1.0% - 1.5% ] 1.20% | 260,155 | 6.0% |
[ 1.0% - 1.5% ] 1.24% | 297,885 | 4.8% |
[ 1.0% - 1.5% ] 1.29% | 184,197 | 6.5% |
[ 1.0% - 1.5% ] 1.32% | 114,023 | 4.0% |
[ 1.0% - 1.5% ] 1.37% | 172,109 | 5.3% |
[ 1.0% - 1.5% ] 1.41% | 31,132 | 3.3% |
[ 1.0% - 1.5% ] 1.45% | 128,480 | 4.9% |
[ 1.0% - 1.5% ] 1.49% | 109,333 | 5.2% |
[ 1.5% - 2.0% ] 1.54% | 98,754 | 5.2% |
[ 1.5% - 2.0% ] 1.59% | 100,368 | 7.0% |
[ 1.5% - 2.0% ] 1.63% | 95,034 | 8.9% |
[ 1.5% - 2.0% ] 1.67% | 8,681,792 | 4.9% |
[ 1.5% - 2.0% ] 1.70% | 17,453 | 12.9% |
[ 1.5% - 2.0% ] 1.76% | 41,085 | 3.5% |
[ 1.5% - 2.0% ] 1.79% | 39,833 | 5.7% |
[ 1.5% - 2.0% ] 1.85% | 10,060 | 7.7% |
[ 1.5% - 2.0% ] 1.89% | 9,572 | 7.3% |
[ 1.5% - 2.0% ] 1.98% | 50,700 | 3.5% |
[ 2.0% - 2.5% ] 2.01% | 62,566 | 7.9% |
[ 2.0% - 2.5% ] 2.13% | 5,164 | 5.4% |
[ 2.0% - 2.5% ] 2.22% | 99,189 | 7.3% |
[ 2.0% - 2.5% ] 2.28% | 163,473 | 4.9% |
[ 2.0% - 2.5% ] 2.32% | 126,582 | 7.0% |
[ 2.0% - 2.5% ] 2.35% | 42,887 | 9.8% |
[ 2.0% - 2.5% ] 2.39% | 1,798 | 4.3% |
[ 2.0% - 2.5% ] 2.44% | 23,072 | 3.4% |
[ 2.0% - 2.5% ] 2.48% | 2,096 | 3.9% |
[ 2.5% - 3.0% ] 2.61% | 67,015 | 6.5% |
[ 2.5% - 3.0% ] 2.84% | 184,531 | 3.0% |
[ 2.5% - 3.0% ] 2.90% | 59,721 | 5.4% |
[ 2.5% - 3.0% ] 2.97% | 113,334 | 4.6% |
[ 3.0% - 3.5% ] 3.01% | 24,584 | 7.4% |
[ 3.0% - 3.5% ] 3.12% | 8,128 | 3.0% |
[ 3.0% - 3.5% ] 3.16% | 70,738 | 3.5% |
[ 3.0% - 3.5% ] 3.30% | 41,633 | 10.1% |
[ 3.0% - 3.5% ] 3.36% | 44,527 | 5.9% |
[ 3.0% - 3.5% ] 3.41% | 103,664 | 3.9% |
[ 3.0% - 3.5% ] 3.48% | 41,552 | 2.7% |
[ 3.5% - 4.0% ] 3.59% | 3,568 | 11.1% |
[ 3.5% - 4.0% ] 3.74% | 34,406 | 4.3% |
[ 3.5% - 4.0% ] 3.77% | 92,588 | 10.2% |
[ 3.5% - 4.0% ] 3.83% | 14,793 | 13.9% |
[ 3.5% - 4.0% ] 3.97% | 1,790 | 1.7% |
[ 4.0% - 4.5% ] 4.02% | 96,801 | 6.2% |
[ 4.0% - 4.5% ] 4.11% | 5,164 | 1.7% |
[ 4.0% - 4.5% ] 4.12% | 14,287 | 1.5% |
[ 4.0% - 4.5% ] 4.18% | 43,014 | 6.7% |
[ 4.0% - 4.5% ] 4.42% | 29,680 | 5.3% |
[ 4.0% - 4.5% ] 4.48% | 218,639 | 5.8% |
[ 4.5% - 5.0% ] 4.60% | 5,938 | 6.0% |
[ 4.5% - 5.0% ] 4.64% | 100,082 | 2.5% |
[ 4.5% - 5.0% ] 4.69% | 132,305 | 4.8% |
[ 4.5% - 5.0% ] 4.91% | 21,329 | 9.6% |
[ 4.5% - 5.0% ] 4.99% | 108,470 | 3.3% |
[ 5.0% - 5.5% ] 5.12% | 15,459 | 10.2% |
[ 5.0% - 5.5% ] 5.30% | 44,832 | 1.5% |
[ 5.0% - 5.5% ] 5.37% | 22,770 | 4.0% |
[ 5.0% - 5.5% ] 5.37% | 29,216 | 5.3% |
[ 5.5% - 6.0% ] 5.74% | 27,845 | 4.0% |
[ 6.0% - 6.5% ] 6.02% | 1,179 | 2.8% |
[ 6.0% - 6.5% ] 6.07% | 25,187 | 3.1% |
[ 6.0% - 6.5% ] 6.13% | 14,367 | 3.8% |
[ 6.0% - 6.5% ] 6.47% | 108,180 | 2.6% |
[ 6.5% - 7.0% ] 6.56% | 78,506 | 3.4% |
[ 7.0% - 7.5% ] 7.15% | 21,901 | 6.1% |
[ 7.0% - 7.5% ] 7.27% | 38,317 | 3.4% |
[ 7.5% - 8.0% ] 7.59% | 40,593 | 5.3% |
[ 7.5% - 8.0% ] 7.64% | 59,961 | 1.8% |
[ 8.0% - 8.5% ] 8.16% | 38,865 | 2.8% |
[ 8.0% - 8.5% ] 8.19% | 31,200 | 3.8% |
[ 8.0% - 8.5% ] 8.44% | 27,794 | 2.5% |
[ 8.5% - 9.0% ] 8.66% | 68,476 | 7.2% |
[ 13.5% - 14.0% ] 13.87% | 29,921 | 3.7% |
[ 15.5% - 16.0% ] 15.94% | 19,554 | 4.6% |
[ 18.0% - 18.5% ] 18.13% | 21,349 | 4.9% |
[ 20.5% - 21.0% ] 20.81% | 7,863 | 5.7% |
[ 26.5% - 27.0% ] 26.52% | 51,153 | 4.7% |
[ 29.5% - 30.0% ] 29.84% | 48,096 | 2.5% |