Immigrants from Caribbean Married-couple Households
COMPARE
Immigrants from Caribbean
Select to Compare
Married-couple Households
Immigrants from Caribbean Married-couple Households
40.8%
MARRIED-COUPLE HOUSEHOLDS
0.0/ 100
METRIC RATING
316th/ 347
METRIC RANK
Immigrants from Caribbean Married-couple Households Correlation Chart
The statistical analysis conducted on geographies consisting of 449,664,871 people shows a poor positive correlation between the proportion of Immigrants from Caribbean and percentage of married-couple family households in the United States with a correlation coefficient (R) of 0.154 and weighted average of 40.8%. On average, for every 1% (one percent) increase in Immigrants from Caribbean within a typical geography, there is an increase of 0.068% in percentage of married-couple family households.
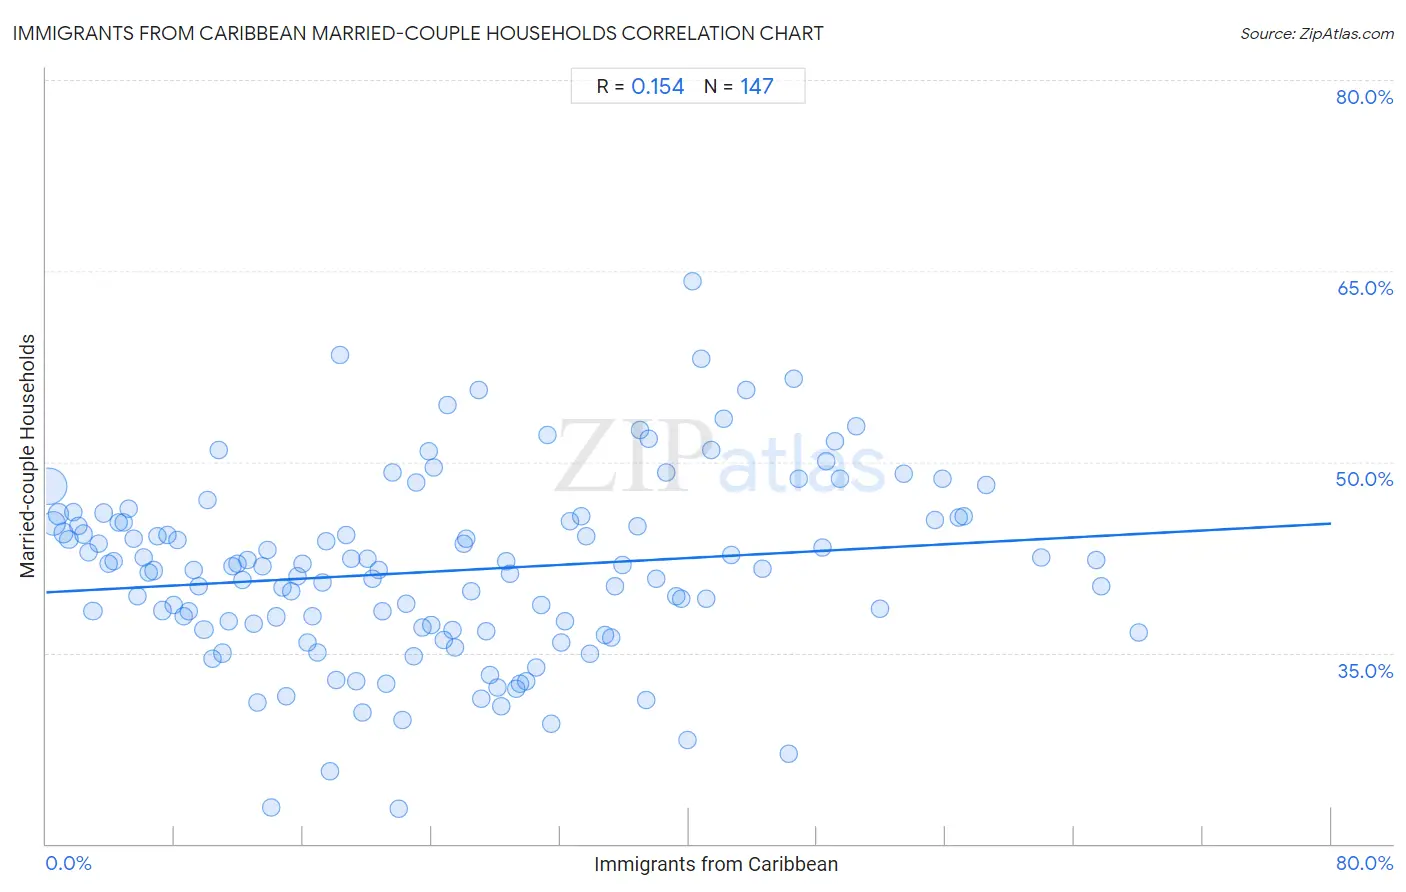
It is essential to understand that the correlation between the percentage of Immigrants from Caribbean and percentage of married-couple family households does not imply a direct cause-and-effect relationship. It remains uncertain whether the presence of Immigrants from Caribbean influences an upward or downward trend in the level of percentage of married-couple family households within an area, or if Immigrants from Caribbean simply ended up residing in those areas with higher or lower levels of percentage of married-couple family households due to other factors.
Demographics Similar to Immigrants from Caribbean by Married-couple Households
In terms of married-couple households, the demographic groups most similar to Immigrants from Caribbean are Trinidadian and Tobagonian (40.9%, a difference of 0.18%), Jamaican (40.9%, a difference of 0.26%), Immigrants from Jamaica (40.7%, a difference of 0.29%), Liberian (40.7%, a difference of 0.30%), and Immigrants from Haiti (40.9%, a difference of 0.34%).
| Demographics | Rating | Rank | Married-couple Households |
| Immigrants from Trinidad and Tobago | 0.0 /100 | #309 | Tragic 41.2% |
| Haitians | 0.0 /100 | #310 | Tragic 41.2% |
| Colville | 0.0 /100 | #311 | Tragic 41.0% |
| Africans | 0.0 /100 | #312 | Tragic 40.9% |
| Immigrants from Haiti | 0.0 /100 | #313 | Tragic 40.9% |
| Jamaicans | 0.0 /100 | #314 | Tragic 40.9% |
| Trinidadians and Tobagonians | 0.0 /100 | #315 | Tragic 40.9% |
| Immigrants from Caribbean | 0.0 /100 | #316 | Tragic 40.8% |
| Immigrants from Jamaica | 0.0 /100 | #317 | Tragic 40.7% |
| Liberians | 0.0 /100 | #318 | Tragic 40.7% |
| Bahamians | 0.0 /100 | #319 | Tragic 40.5% |
| West Indians | 0.0 /100 | #320 | Tragic 40.3% |
| Immigrants from Liberia | 0.0 /100 | #321 | Tragic 40.3% |
| Immigrants from Zaire | 0.0 /100 | #322 | Tragic 40.1% |
| Puerto Ricans | 0.0 /100 | #323 | Tragic 40.1% |
Immigrants from Caribbean Married-couple Households Correlation Summary
| Measurement | Immigrants from Caribbean Data | Married-couple Households Data |
| Minimum | 0.14% | 22.8% |
| Maximum | 68.0% | 64.2% |
| Range | 67.9% | 41.4% |
| Mean | 24.7% | 41.4% |
| Median | 22.9% | 41.7% |
| Interquartile 25% (IQ1) | 11.4% | 36.8% |
| Interquartile 75% (IQ3) | 35.9% | 45.4% |
| Interquartile Range (IQR) | 24.5% | 8.5% |
| Standard Deviation (Sample) | 16.4% | 7.2% |
| Standard Deviation (Population) | 16.3% | 7.1% |
Correlation Details
| Immigrants from Caribbean Percentile | Sample Size | Married-couple Households |
[ 0.0% - 0.5% ] 0.14% | 214,370,164 | 48.0% |
[ 0.0% - 0.5% ] 0.43% | 79,677,065 | 45.2% |
[ 0.5% - 1.0% ] 0.77% | 34,925,461 | 45.9% |
[ 1.0% - 1.5% ] 1.08% | 19,951,329 | 44.4% |
[ 1.0% - 1.5% ] 1.38% | 12,128,101 | 43.9% |
[ 1.5% - 2.0% ] 1.70% | 9,200,859 | 46.0% |
[ 2.0% - 2.5% ] 2.01% | 7,999,458 | 45.0% |
[ 2.0% - 2.5% ] 2.31% | 6,258,419 | 44.3% |
[ 2.5% - 3.0% ] 2.64% | 4,976,918 | 42.9% |
[ 2.5% - 3.0% ] 2.91% | 4,494,771 | 38.3% |
[ 3.0% - 3.5% ] 3.24% | 2,725,650 | 43.6% |
[ 3.5% - 4.0% ] 3.56% | 2,245,978 | 46.0% |
[ 3.5% - 4.0% ] 3.87% | 2,121,602 | 42.0% |
[ 4.0% - 4.5% ] 4.19% | 1,766,142 | 42.2% |
[ 4.0% - 4.5% ] 4.47% | 1,741,044 | 45.3% |
[ 4.5% - 5.0% ] 4.80% | 1,607,202 | 45.2% |
[ 5.0% - 5.5% ] 5.10% | 1,362,904 | 46.3% |
[ 5.0% - 5.5% ] 5.42% | 1,380,194 | 44.0% |
[ 5.5% - 6.0% ] 5.71% | 1,144,290 | 39.4% |
[ 6.0% - 6.5% ] 6.04% | 1,654,117 | 42.5% |
[ 6.0% - 6.5% ] 6.35% | 898,029 | 41.3% |
[ 6.5% - 7.0% ] 6.67% | 1,144,553 | 41.5% |
[ 6.5% - 7.0% ] 6.93% | 1,053,092 | 44.1% |
[ 7.0% - 7.5% ] 7.23% | 1,355,309 | 38.3% |
[ 7.5% - 8.0% ] 7.56% | 799,822 | 44.2% |
[ 7.5% - 8.0% ] 7.91% | 847,149 | 38.8% |
[ 8.0% - 8.5% ] 8.19% | 681,939 | 43.9% |
[ 8.5% - 9.0% ] 8.57% | 1,311,288 | 37.9% |
[ 8.5% - 9.0% ] 8.83% | 420,058 | 38.2% |
[ 9.0% - 9.5% ] 9.15% | 566,861 | 41.5% |
[ 9.0% - 9.5% ] 9.47% | 874,139 | 40.2% |
[ 9.5% - 10.0% ] 9.82% | 9,195,251 | 36.8% |
[ 10.0% - 10.5% ] 10.04% | 369,389 | 47.0% |
[ 10.0% - 10.5% ] 10.34% | 550,946 | 34.5% |
[ 10.5% - 11.0% ] 10.73% | 118,593 | 50.9% |
[ 10.5% - 11.0% ] 10.98% | 583,753 | 35.0% |
[ 11.0% - 11.5% ] 11.37% | 398,243 | 37.5% |
[ 11.5% - 12.0% ] 11.58% | 597,865 | 41.8% |
[ 11.5% - 12.0% ] 11.94% | 653,713 | 42.0% |
[ 12.0% - 12.5% ] 12.23% | 668,173 | 40.7% |
[ 12.5% - 13.0% ] 12.51% | 304,290 | 42.3% |
[ 12.5% - 13.0% ] 12.90% | 244,232 | 37.3% |
[ 13.0% - 13.5% ] 13.15% | 247,306 | 31.1% |
[ 13.0% - 13.5% ] 13.49% | 304,024 | 41.8% |
[ 13.5% - 14.0% ] 13.79% | 424,001 | 43.1% |
[ 14.0% - 14.5% ] 14.01% | 151,379 | 22.8% |
[ 14.0% - 14.5% ] 14.35% | 597,702 | 37.8% |
[ 14.5% - 15.0% ] 14.73% | 321,134 | 40.1% |
[ 14.5% - 15.0% ] 14.98% | 330,345 | 31.6% |
[ 15.0% - 15.5% ] 15.29% | 325,318 | 39.8% |
[ 15.5% - 16.0% ] 15.66% | 169,760 | 41.1% |
[ 15.5% - 16.0% ] 15.92% | 109,805 | 42.0% |
[ 16.0% - 16.5% ] 16.26% | 213,745 | 35.8% |
[ 16.5% - 17.0% ] 16.61% | 370,147 | 37.8% |
[ 16.5% - 17.0% ] 16.90% | 605,456 | 35.0% |
[ 17.0% - 17.5% ] 17.16% | 283,731 | 40.5% |
[ 17.0% - 17.5% ] 17.43% | 221,404 | 43.8% |
[ 17.5% - 18.0% ] 17.69% | 60,268 | 25.7% |
[ 18.0% - 18.5% ] 18.05% | 299,765 | 32.9% |
[ 18.0% - 18.5% ] 18.29% | 39,768 | 58.4% |
[ 18.5% - 19.0% ] 18.69% | 265,280 | 44.3% |
[ 18.5% - 19.0% ] 18.96% | 131,557 | 42.4% |
[ 19.0% - 19.5% ] 19.29% | 132,044 | 32.8% |
[ 19.5% - 20.0% ] 19.68% | 260,686 | 30.3% |
[ 20.0% - 20.5% ] 20.04% | 220,417 | 42.4% |
[ 20.0% - 20.5% ] 20.32% | 44,582 | 40.8% |
[ 20.5% - 21.0% ] 20.70% | 212,055 | 41.5% |
[ 20.5% - 21.0% ] 20.91% | 258,757 | 38.3% |
[ 21.0% - 21.5% ] 21.19% | 314,382 | 32.6% |
[ 21.5% - 22.0% ] 21.59% | 165,351 | 49.2% |
[ 21.5% - 22.0% ] 21.94% | 79,817 | 22.8% |
[ 22.0% - 22.5% ] 22.14% | 234,023 | 29.7% |
[ 22.0% - 22.5% ] 22.45% | 444,921 | 38.8% |
[ 22.5% - 23.0% ] 22.92% | 195,693 | 34.7% |
[ 23.0% - 23.5% ] 23.03% | 184,030 | 48.4% |
[ 23.0% - 23.5% ] 23.42% | 399,995 | 37.0% |
[ 23.5% - 24.0% ] 23.79% | 49,318 | 50.8% |
[ 23.5% - 24.0% ] 23.95% | 120,060 | 37.1% |
[ 24.0% - 24.5% ] 24.16% | 29,400 | 49.6% |
[ 24.5% - 25.0% ] 24.75% | 1,782 | 36.0% |
[ 24.5% - 25.0% ] 24.99% | 83,771 | 54.5% |
[ 25.0% - 25.5% ] 25.30% | 125,014 | 36.8% |
[ 25.0% - 25.5% ] 25.46% | 42,404 | 35.4% |
[ 25.5% - 26.0% ] 25.96% | 28,132 | 43.6% |
[ 26.0% - 26.5% ] 26.18% | 35,074 | 43.9% |
[ 26.0% - 26.5% ] 26.42% | 136,487 | 39.8% |
[ 26.5% - 27.0% ] 26.91% | 68,832 | 55.7% |
[ 27.0% - 27.5% ] 27.09% | 200,454 | 31.4% |
[ 27.0% - 27.5% ] 27.40% | 177,910 | 36.7% |
[ 27.5% - 28.0% ] 27.66% | 193,399 | 33.2% |
[ 28.0% - 28.5% ] 28.06% | 86,601 | 32.2% |
[ 28.0% - 28.5% ] 28.35% | 192,191 | 30.8% |
[ 28.5% - 29.0% ] 28.63% | 88,917 | 42.2% |
[ 28.5% - 29.0% ] 28.87% | 83,669 | 41.2% |
[ 29.0% - 29.5% ] 29.27% | 94,023 | 32.2% |
[ 29.5% - 30.0% ] 29.51% | 517,199 | 32.5% |
[ 29.5% - 30.0% ] 29.85% | 146,102 | 32.8% |
[ 30.5% - 31.0% ] 30.51% | 128,523 | 33.9% |
[ 30.5% - 31.0% ] 30.80% | 90,432 | 38.7% |
[ 31.0% - 31.5% ] 31.20% | 37,954 | 52.1% |
[ 31.0% - 31.5% ] 31.47% | 128,256 | 29.4% |
[ 32.0% - 32.5% ] 32.04% | 29,240 | 35.8% |
[ 32.0% - 32.5% ] 32.29% | 72,447 | 37.5% |
[ 32.5% - 33.0% ] 32.59% | 162,741 | 45.4% |
[ 33.0% - 33.5% ] 33.33% | 121,630 | 45.8% |
[ 33.5% - 34.0% ] 33.59% | 13,781 | 44.2% |
[ 33.5% - 34.0% ] 33.82% | 152,144 | 34.9% |
[ 34.5% - 35.0% ] 34.82% | 221,208 | 36.4% |
[ 35.0% - 35.5% ] 35.14% | 130,749 | 36.2% |
[ 35.0% - 35.5% ] 35.41% | 73,798 | 40.2% |
[ 35.5% - 36.0% ] 35.89% | 90,475 | 41.9% |
[ 36.5% - 37.0% ] 36.77% | 60,466 | 44.9% |
[ 36.5% - 37.0% ] 36.93% | 47,116 | 52.5% |
[ 37.0% - 37.5% ] 37.34% | 131,244 | 31.3% |
[ 37.5% - 38.0% ] 37.54% | 20,230 | 51.8% |
[ 38.0% - 38.5% ] 38.01% | 129,669 | 40.8% |
[ 38.5% - 39.0% ] 38.57% | 9,971 | 49.1% |
[ 39.0% - 39.5% ] 39.21% | 34,725 | 39.4% |
[ 39.5% - 40.0% ] 39.53% | 98,575 | 39.2% |
[ 39.5% - 40.0% ] 39.91% | 35,914 | 28.2% |
[ 40.0% - 40.5% ] 40.26% | 5,303 | 64.2% |
[ 40.5% - 41.0% ] 40.77% | 13,877 | 58.1% |
[ 41.0% - 41.5% ] 41.07% | 75,037 | 39.3% |
[ 41.0% - 41.5% ] 41.40% | 69,663 | 50.9% |
[ 42.0% - 42.5% ] 42.22% | 13,824 | 53.4% |
[ 42.5% - 43.0% ] 42.68% | 34,335 | 42.7% |
[ 43.5% - 44.0% ] 43.57% | 52,661 | 55.6% |
[ 44.5% - 45.0% ] 44.60% | 19,399 | 41.7% |
[ 46.0% - 46.5% ] 46.20% | 1,775 | 27.0% |
[ 46.5% - 47.0% ] 46.51% | 55,241 | 56.5% |
[ 46.5% - 47.0% ] 46.83% | 24,597 | 48.6% |
[ 48.0% - 48.5% ] 48.31% | 40,739 | 43.3% |
[ 48.5% - 49.0% ] 48.55% | 10,725 | 50.1% |
[ 49.0% - 49.5% ] 49.08% | 52,851 | 51.7% |
[ 49.0% - 49.5% ] 49.45% | 53,765 | 48.7% |
[ 50.0% - 50.5% ] 50.47% | 50,233 | 52.8% |
[ 51.5% - 52.0% ] 51.94% | 46,798 | 38.5% |
[ 53.0% - 53.5% ] 53.39% | 52,047 | 49.0% |
[ 55.0% - 55.5% ] 55.34% | 45,620 | 45.5% |
[ 55.5% - 56.0% ] 55.83% | 20,850 | 48.7% |
[ 56.5% - 57.0% ] 56.81% | 22,815 | 45.7% |
[ 57.0% - 57.5% ] 57.14% | 77 | 45.7% |
[ 58.5% - 59.0% ] 58.50% | 26,596 | 48.2% |
[ 61.5% - 62.0% ] 61.95% | 224,014 | 42.5% |
[ 65.0% - 65.5% ] 65.40% | 29,830 | 42.3% |
[ 65.5% - 66.0% ] 65.67% | 71,088 | 40.3% |
[ 68.0% - 68.5% ] 68.02% | 42,081 | 36.6% |