Immigrants from Bosnia and Herzegovina Married-couple Households
COMPARE
Immigrants from Bosnia and Herzegovina
Select to Compare
Married-couple Households
Immigrants from Bosnia and Herzegovina Married-couple Households
44.4%
MARRIED-COUPLE HOUSEHOLDS
1.0/ 100
METRIC RATING
241st/ 347
METRIC RANK
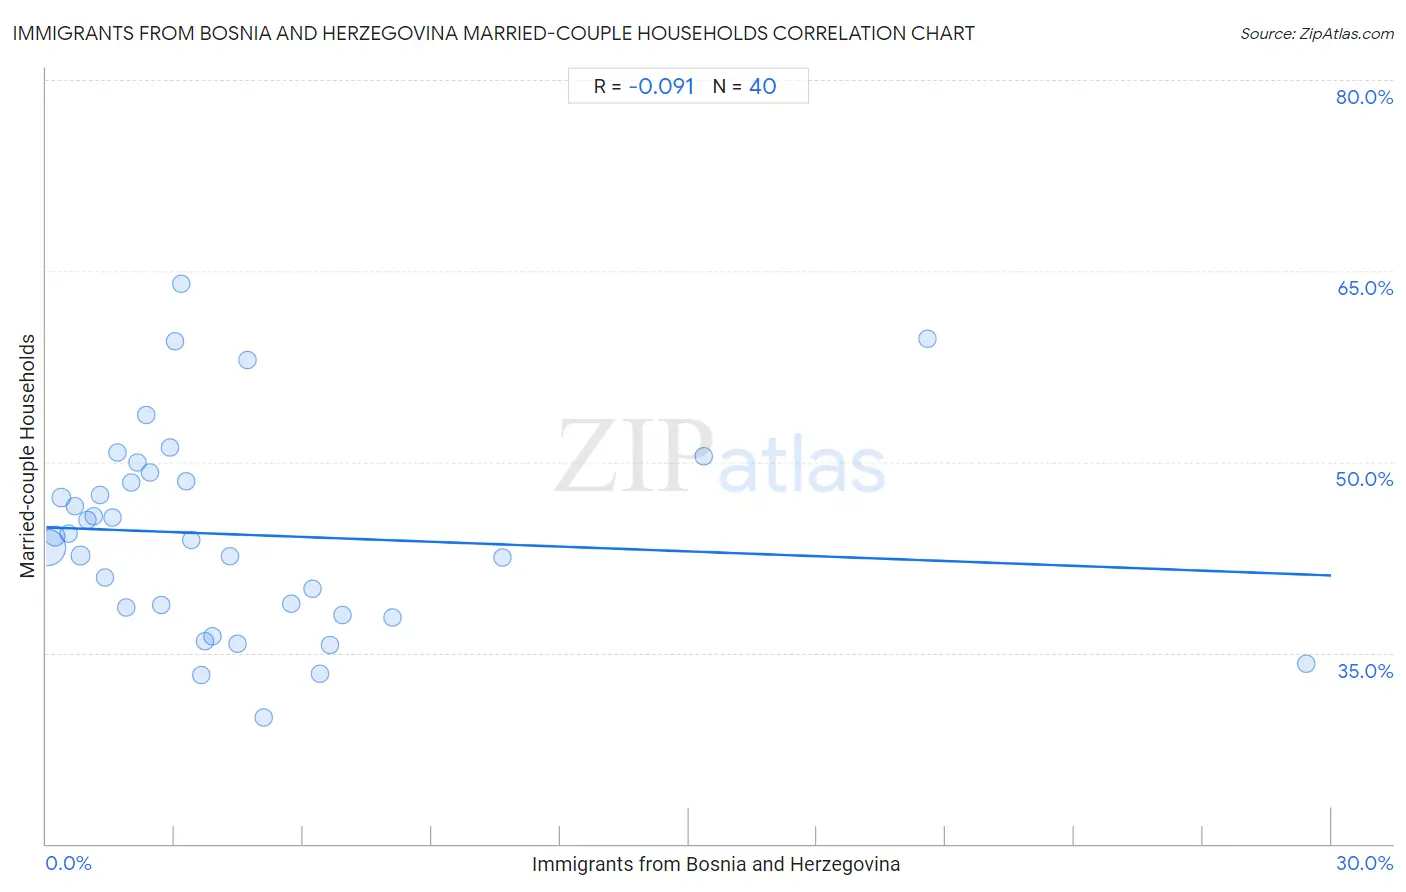
Immigrants from Bosnia and Herzegovina Married-couple Households Correlation Chart
The statistical analysis conducted on geographies consisting of 156,805,510 people shows a slight negative correlation between the proportion of Immigrants from Bosnia and Herzegovina and percentage of married-couple family households in the United States with a correlation coefficient (R) of -0.091 and weighted average of 44.4%. On average, for every 1% (one percent) increase in Immigrants from Bosnia and Herzegovina within a typical geography, there is a decrease of 0.13% in percentage of married-couple family households.
It is essential to understand that the correlation between the percentage of Immigrants from Bosnia and Herzegovina and percentage of married-couple family households does not imply a direct cause-and-effect relationship. It remains uncertain whether the presence of Immigrants from Bosnia and Herzegovina influences an upward or downward trend in the level of percentage of married-couple family households within an area, or if Immigrants from Bosnia and Herzegovina simply ended up residing in those areas with higher or lower levels of percentage of married-couple family households due to other factors.
Demographics Similar to Immigrants from Bosnia and Herzegovina by Married-couple Households
In terms of married-couple households, the demographic groups most similar to Immigrants from Bosnia and Herzegovina are Ute (44.4%, a difference of 0.0%), Immigrants from Albania (44.4%, a difference of 0.040%), Spanish American (44.5%, a difference of 0.080%), Immigrants from Uruguay (44.5%, a difference of 0.10%), and Immigrants from Saudi Arabia (44.4%, a difference of 0.11%).
| Demographics | Rating | Rank | Married-couple Households |
| Immigrants from Panama | 1.3 /100 | #234 | Tragic 44.6% |
| Immigrants from Nicaragua | 1.2 /100 | #235 | Tragic 44.5% |
| Yaqui | 1.2 /100 | #236 | Tragic 44.5% |
| Comanche | 1.2 /100 | #237 | Tragic 44.5% |
| Immigrants from Uruguay | 1.1 /100 | #238 | Tragic 44.5% |
| Spanish Americans | 1.1 /100 | #239 | Tragic 44.5% |
| Ute | 1.0 /100 | #240 | Tragic 44.4% |
| Immigrants from Bosnia and Herzegovina | 1.0 /100 | #241 | Tragic 44.4% |
| Immigrants from Albania | 1.0 /100 | #242 | Tragic 44.4% |
| Immigrants from Saudi Arabia | 0.9 /100 | #243 | Tragic 44.4% |
| Immigrants from Armenia | 0.7 /100 | #244 | Tragic 44.3% |
| Immigrants from El Salvador | 0.7 /100 | #245 | Tragic 44.3% |
| Immigrants from Cuba | 0.6 /100 | #246 | Tragic 44.2% |
| Immigrants from Morocco | 0.6 /100 | #247 | Tragic 44.2% |
| Yup'ik | 0.4 /100 | #248 | Tragic 44.1% |
Immigrants from Bosnia and Herzegovina Married-couple Households Correlation Summary
| Measurement | Immigrants from Bosnia and Herzegovina Data | Married-couple Households Data |
| Minimum | 0.041% | 29.9% |
| Maximum | 29.4% | 64.0% |
| Range | 29.4% | 34.1% |
| Mean | 4.6% | 44.3% |
| Median | 3.1% | 44.0% |
| Interquartile 25% (IQ1) | 1.5% | 38.2% |
| Interquartile 75% (IQ3) | 5.4% | 48.8% |
| Interquartile Range (IQR) | 3.9% | 10.6% |
| Standard Deviation (Sample) | 5.7% | 7.9% |
| Standard Deviation (Population) | 5.6% | 7.8% |
Correlation Details
| Immigrants from Bosnia and Herzegovina Percentile | Sample Size | Married-couple Households |
[ 0.0% - 0.5% ] 0.041% | 124,008,596 | 43.3% |
[ 0.0% - 0.5% ] 0.20% | 17,597,799 | 44.1% |
[ 0.0% - 0.5% ] 0.36% | 7,607,813 | 47.2% |
[ 0.5% - 1.0% ] 0.51% | 2,122,855 | 44.4% |
[ 0.5% - 1.0% ] 0.66% | 1,196,775 | 46.5% |
[ 0.5% - 1.0% ] 0.80% | 1,320,654 | 42.6% |
[ 0.5% - 1.0% ] 0.95% | 572,001 | 45.4% |
[ 1.0% - 1.5% ] 1.10% | 369,725 | 45.7% |
[ 1.0% - 1.5% ] 1.26% | 520,714 | 47.4% |
[ 1.0% - 1.5% ] 1.37% | 102,204 | 40.9% |
[ 1.5% - 2.0% ] 1.54% | 175,181 | 45.6% |
[ 1.5% - 2.0% ] 1.66% | 359,718 | 50.7% |
[ 1.5% - 2.0% ] 1.86% | 106,566 | 38.5% |
[ 1.5% - 2.0% ] 1.98% | 105,445 | 48.4% |
[ 2.0% - 2.5% ] 2.14% | 113,789 | 49.9% |
[ 2.0% - 2.5% ] 2.34% | 72,733 | 53.7% |
[ 2.0% - 2.5% ] 2.43% | 47,303 | 49.2% |
[ 2.5% - 3.0% ] 2.70% | 816 | 38.7% |
[ 2.5% - 3.0% ] 2.88% | 22,992 | 51.1% |
[ 3.0% - 3.5% ] 3.01% | 532 | 59.5% |
[ 3.0% - 3.5% ] 3.16% | 12,587 | 64.0% |
[ 3.0% - 3.5% ] 3.26% | 11,619 | 48.4% |
[ 3.0% - 3.5% ] 3.38% | 50,347 | 43.9% |
[ 3.5% - 4.0% ] 3.62% | 48,317 | 33.3% |
[ 3.5% - 4.0% ] 3.70% | 7,051 | 35.9% |
[ 3.5% - 4.0% ] 3.89% | 24,014 | 36.3% |
[ 4.0% - 4.5% ] 4.28% | 19,922 | 42.5% |
[ 4.0% - 4.5% ] 4.45% | 69,823 | 35.7% |
[ 4.5% - 5.0% ] 4.68% | 2,220 | 58.0% |
[ 5.0% - 5.5% ] 5.09% | 5,345 | 29.9% |
[ 5.5% - 6.0% ] 5.71% | 8,759 | 38.8% |
[ 6.0% - 6.5% ] 6.23% | 45,300 | 40.0% |
[ 6.0% - 6.5% ] 6.38% | 47 | 33.3% |
[ 6.5% - 7.0% ] 6.62% | 40,152 | 35.6% |
[ 6.5% - 7.0% ] 6.90% | 32,750 | 37.9% |
[ 8.0% - 8.5% ] 8.09% | 136 | 37.7% |
[ 10.5% - 11.0% ] 10.65% | 695 | 42.4% |
[ 15.0% - 15.5% ] 15.36% | 1,875 | 50.5% |
[ 20.5% - 21.0% ] 20.59% | 102 | 59.6% |
[ 29.0% - 29.5% ] 29.41% | 238 | 34.1% |