Guyanese 4 or more Vehicles in Household
COMPARE
Guyanese
Select to Compare
4 or more Vehicles in Household
Guyanese 4 or more Vehicles in Household
3.5%
4+ VEHICLES AVAILABLE
0.0/ 100
METRIC RATING
342nd/ 347
METRIC RANK
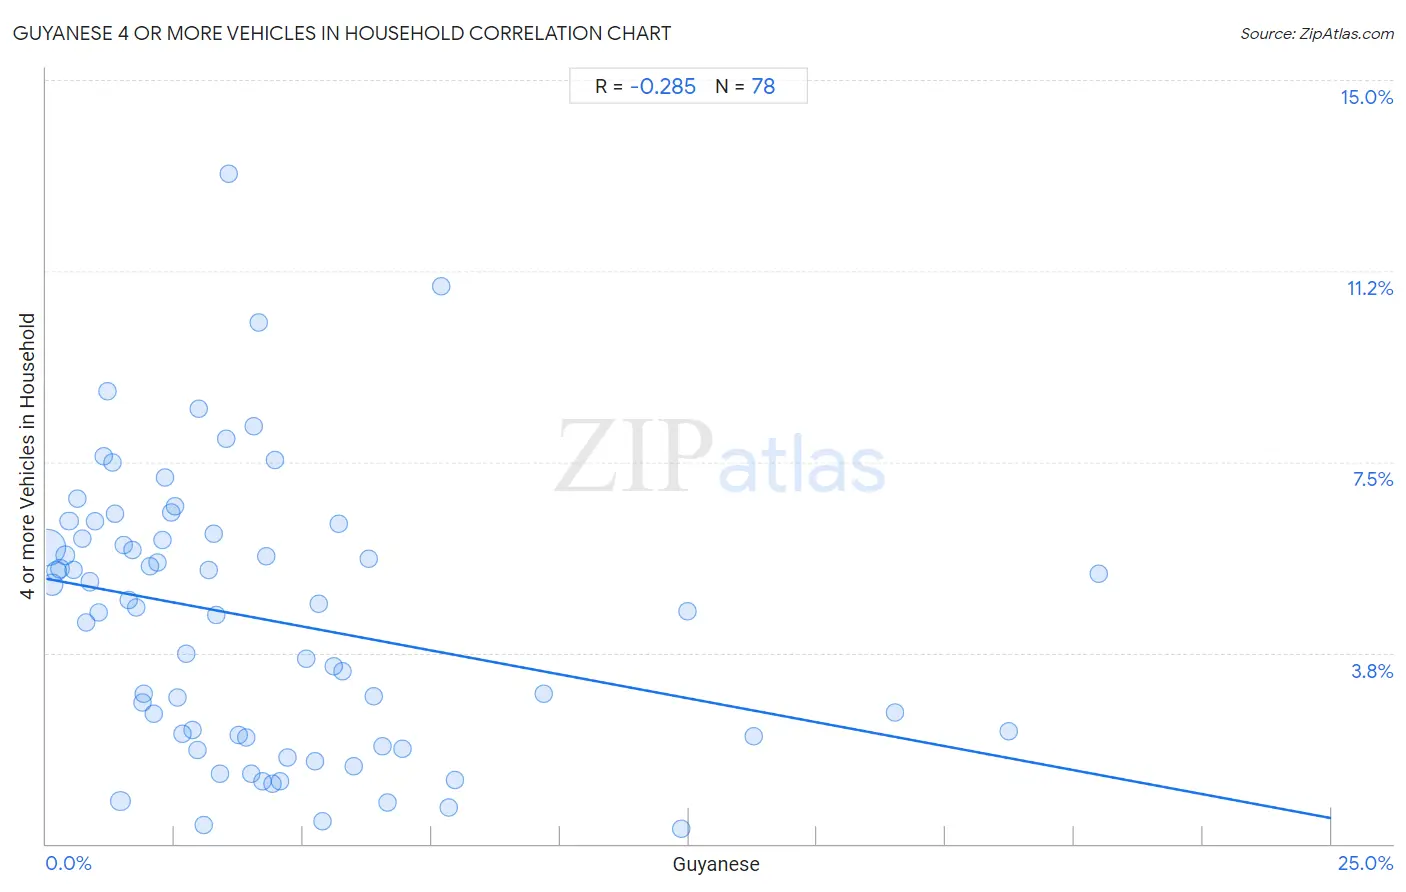
Guyanese 4 or more Vehicles in Household Correlation Chart
The statistical analysis conducted on geographies consisting of 175,655,859 people shows a weak negative correlation between the proportion of Guyanese and percentage of households with 4 or more vehicles available in the United States with a correlation coefficient (R) of -0.285 and weighted average of 3.5%. On average, for every 1% (one percent) increase in Guyanese within a typical geography, there is a decrease of 0.19% in percentage of households with 4 or more vehicles available.
It is essential to understand that the correlation between the percentage of Guyanese and percentage of households with 4 or more vehicles available does not imply a direct cause-and-effect relationship. It remains uncertain whether the presence of Guyanese influences an upward or downward trend in the level of percentage of households with 4 or more vehicles available within an area, or if Guyanese simply ended up residing in those areas with higher or lower levels of percentage of households with 4 or more vehicles available due to other factors.
Demographics Similar to Guyanese by 4 or more Vehicles in Household
In terms of 4 or more vehicles in household, the demographic groups most similar to Guyanese are Dominican (3.5%, a difference of 0.69%), British West Indian (3.5%, a difference of 0.94%), Immigrants from Guyana (3.4%, a difference of 2.6%), Immigrants from Barbados (3.6%, a difference of 3.5%), and Immigrants from Uzbekistan (3.6%, a difference of 4.1%).
| Demographics | Rating | Rank | 4 or more Vehicles in Household |
| Immigrants from Albania | 0.0 /100 | #333 | Tragic 4.1% |
| Immigrants from Trinidad and Tobago | 0.0 /100 | #334 | Tragic 4.1% |
| Barbadians | 0.0 /100 | #335 | Tragic 3.9% |
| Immigrants from Bangladesh | 0.0 /100 | #336 | Tragic 3.9% |
| Vietnamese | 0.0 /100 | #337 | Tragic 3.9% |
| Immigrants from Cabo Verde | 0.0 /100 | #338 | Tragic 3.8% |
| Immigrants from Uzbekistan | 0.0 /100 | #339 | Tragic 3.6% |
| Immigrants from Barbados | 0.0 /100 | #340 | Tragic 3.6% |
| Dominicans | 0.0 /100 | #341 | Tragic 3.5% |
| Guyanese | 0.0 /100 | #342 | Tragic 3.5% |
| British West Indians | 0.0 /100 | #343 | Tragic 3.5% |
| Immigrants from Guyana | 0.0 /100 | #344 | Tragic 3.4% |
| Immigrants from Dominican Republic | 0.0 /100 | #345 | Tragic 3.3% |
| Immigrants from St. Vincent and the Grenadines | 0.0 /100 | #346 | Tragic 3.0% |
| Immigrants from Grenada | 0.0 /100 | #347 | Tragic 2.7% |
Guyanese 4 or more Vehicles in Household Correlation Summary
| Measurement | Guyanese Data | 4 or more Vehicles in Household Data |
| Minimum | 0.028% | 0.29% |
| Maximum | 20.5% | 13.2% |
| Range | 20.5% | 12.9% |
| Mean | 4.2% | 4.4% |
| Median | 3.2% | 4.6% |
| Interquartile 25% (IQ1) | 1.6% | 2.1% |
| Interquartile 75% (IQ3) | 5.4% | 6.0% |
| Interquartile Range (IQR) | 3.8% | 3.9% |
| Standard Deviation (Sample) | 4.1% | 2.7% |
| Standard Deviation (Population) | 4.0% | 2.7% |
Correlation Details
| Guyanese Percentile | Sample Size | 4 or more Vehicles in Household |
[ 0.0% - 0.5% ] 0.028% | 105,365,550 | 5.8% |
[ 0.0% - 0.5% ] 0.12% | 24,332,976 | 5.1% |
[ 0.0% - 0.5% ] 0.20% | 10,219,890 | 5.4% |
[ 0.0% - 0.5% ] 0.28% | 7,171,473 | 5.4% |
[ 0.0% - 0.5% ] 0.37% | 3,786,318 | 5.7% |
[ 0.0% - 0.5% ] 0.45% | 2,700,323 | 6.3% |
[ 0.5% - 1.0% ] 0.53% | 1,902,512 | 5.4% |
[ 0.5% - 1.0% ] 0.61% | 1,382,342 | 6.8% |
[ 0.5% - 1.0% ] 0.71% | 1,682,056 | 6.0% |
[ 0.5% - 1.0% ] 0.78% | 819,589 | 4.3% |
[ 0.5% - 1.0% ] 0.86% | 1,625,921 | 5.1% |
[ 0.5% - 1.0% ] 0.94% | 247,414 | 6.3% |
[ 1.0% - 1.5% ] 1.02% | 716,571 | 4.5% |
[ 1.0% - 1.5% ] 1.11% | 326,399 | 7.6% |
[ 1.0% - 1.5% ] 1.18% | 174,379 | 8.9% |
[ 1.0% - 1.5% ] 1.28% | 162,038 | 7.5% |
[ 1.0% - 1.5% ] 1.34% | 198,541 | 6.5% |
[ 1.0% - 1.5% ] 1.44% | 9,101,728 | 0.84% |
[ 1.5% - 2.0% ] 1.51% | 97,919 | 5.9% |
[ 1.5% - 2.0% ] 1.60% | 82,205 | 4.8% |
[ 1.5% - 2.0% ] 1.68% | 131,211 | 5.8% |
[ 1.5% - 2.0% ] 1.76% | 129,820 | 4.6% |
[ 1.5% - 2.0% ] 1.86% | 91,105 | 2.8% |
[ 1.5% - 2.0% ] 1.91% | 143,392 | 2.9% |
[ 2.0% - 2.5% ] 2.01% | 33,555 | 5.4% |
[ 2.0% - 2.5% ] 2.09% | 152,542 | 2.6% |
[ 2.0% - 2.5% ] 2.16% | 35,059 | 5.5% |
[ 2.0% - 2.5% ] 2.26% | 105,706 | 6.0% |
[ 2.0% - 2.5% ] 2.32% | 39,894 | 7.2% |
[ 2.0% - 2.5% ] 2.43% | 56,385 | 6.5% |
[ 2.5% - 3.0% ] 2.51% | 22,745 | 6.6% |
[ 2.5% - 3.0% ] 2.56% | 112,496 | 2.9% |
[ 2.5% - 3.0% ] 2.64% | 10,531 | 2.2% |
[ 2.5% - 3.0% ] 2.72% | 87,187 | 3.7% |
[ 2.5% - 3.0% ] 2.83% | 101,103 | 2.2% |
[ 2.5% - 3.0% ] 2.93% | 180,896 | 1.8% |
[ 2.5% - 3.0% ] 2.97% | 44,140 | 8.5% |
[ 3.0% - 3.5% ] 3.07% | 102,515 | 0.37% |
[ 3.0% - 3.5% ] 3.15% | 71,908 | 5.4% |
[ 3.0% - 3.5% ] 3.26% | 66,771 | 6.1% |
[ 3.0% - 3.5% ] 3.31% | 41,511 | 4.5% |
[ 3.0% - 3.5% ] 3.39% | 60,268 | 1.4% |
[ 3.5% - 4.0% ] 3.51% | 4,783 | 8.0% |
[ 3.5% - 4.0% ] 3.55% | 5,131 | 13.2% |
[ 3.5% - 4.0% ] 3.75% | 120,337 | 2.1% |
[ 3.5% - 4.0% ] 3.89% | 156,163 | 2.1% |
[ 3.5% - 4.0% ] 3.98% | 72,273 | 1.4% |
[ 4.0% - 4.5% ] 4.04% | 7,284 | 8.2% |
[ 4.0% - 4.5% ] 4.14% | 11,110 | 10.2% |
[ 4.0% - 4.5% ] 4.22% | 14,367 | 1.2% |
[ 4.0% - 4.5% ] 4.27% | 6,529 | 5.6% |
[ 4.0% - 4.5% ] 4.40% | 39,557 | 1.2% |
[ 4.0% - 4.5% ] 4.46% | 112,720 | 7.5% |
[ 4.5% - 5.0% ] 4.56% | 64,268 | 1.2% |
[ 4.5% - 5.0% ] 4.68% | 131,608 | 1.7% |
[ 5.0% - 5.5% ] 5.05% | 137,948 | 3.6% |
[ 5.0% - 5.5% ] 5.24% | 68,879 | 1.6% |
[ 5.0% - 5.5% ] 5.31% | 21,901 | 4.7% |
[ 5.0% - 5.5% ] 5.37% | 4,562 | 0.44% |
[ 5.5% - 6.0% ] 5.60% | 49,622 | 3.5% |
[ 5.5% - 6.0% ] 5.70% | 31,953 | 6.3% |
[ 5.5% - 6.0% ] 5.75% | 16,374 | 3.4% |
[ 5.5% - 6.0% ] 5.99% | 25,187 | 1.5% |
[ 6.0% - 6.5% ] 6.26% | 2,219 | 5.6% |
[ 6.0% - 6.5% ] 6.37% | 35,154 | 2.9% |
[ 6.5% - 7.0% ] 6.54% | 68,476 | 1.9% |
[ 6.5% - 7.0% ] 6.63% | 108,180 | 0.80% |
[ 6.5% - 7.0% ] 6.93% | 27,794 | 1.9% |
[ 7.5% - 8.0% ] 7.68% | 8,128 | 11.0% |
[ 7.5% - 8.0% ] 7.83% | 138,467 | 0.72% |
[ 7.5% - 8.0% ] 7.96% | 31,200 | 1.3% |
[ 9.5% - 10.0% ] 9.68% | 38,865 | 2.9% |
[ 12.0% - 12.5% ] 12.35% | 7,863 | 0.29% |
[ 12.0% - 12.5% ] 12.47% | 21,349 | 4.6% |
[ 13.5% - 14.0% ] 13.78% | 29,921 | 2.1% |
[ 16.5% - 17.0% ] 16.52% | 19,554 | 2.6% |
[ 18.5% - 19.0% ] 18.74% | 48,096 | 2.2% |
[ 20.0% - 20.5% ] 20.48% | 51,153 | 5.3% |