Ghanaian Male Disability
COMPARE
Ghanaian
Select to Compare
Male Disability
Ghanaian Male Disability
10.8%
DISABILITY | MALES
93.4/ 100
METRIC RATING
112th/ 347
METRIC RANK
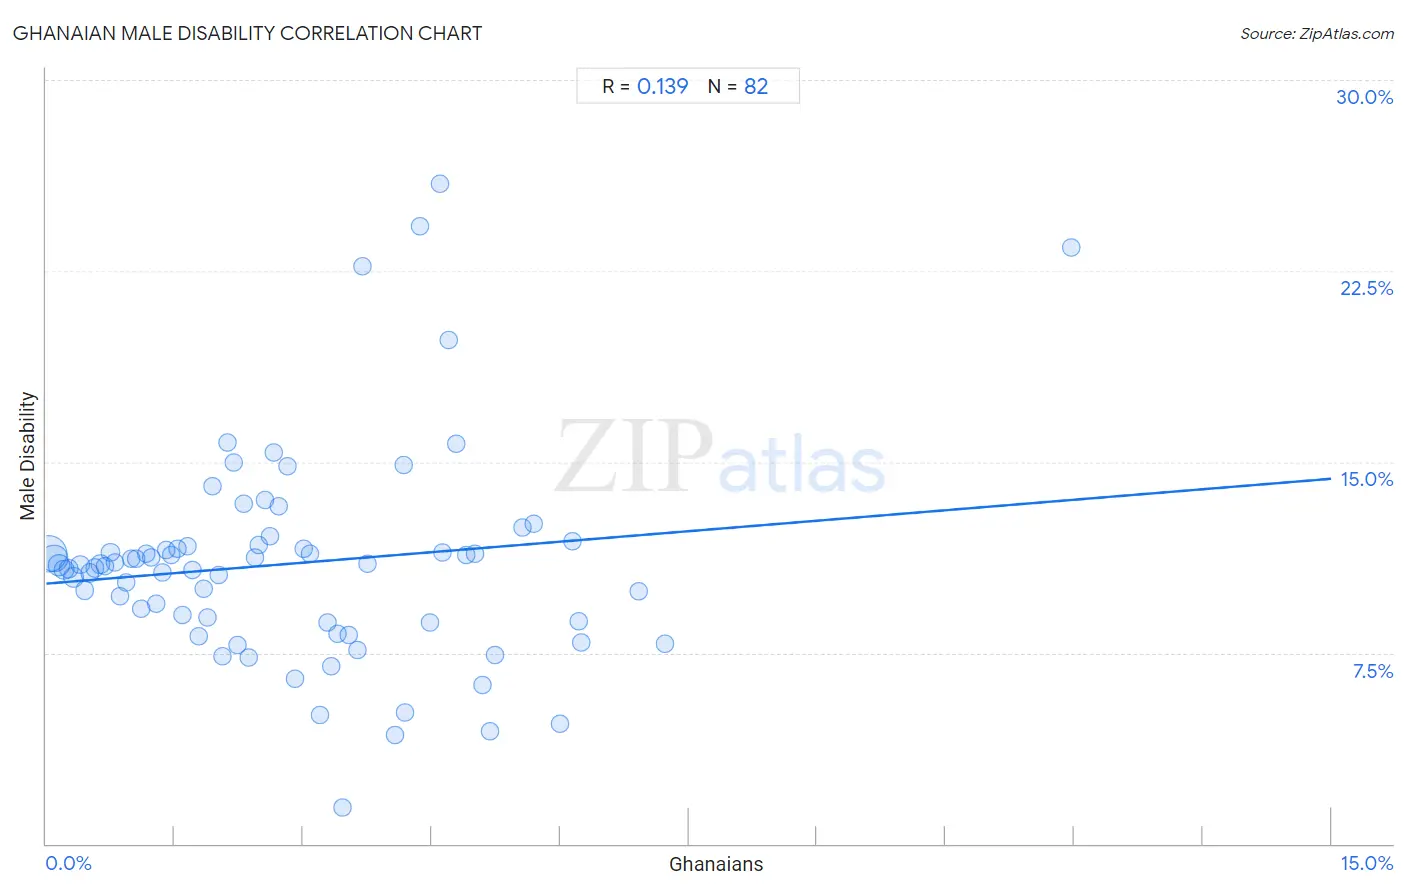
Ghanaian Male Disability Correlation Chart
The statistical analysis conducted on geographies consisting of 190,687,278 people shows a poor positive correlation between the proportion of Ghanaians and percentage of males with a disability in the United States with a correlation coefficient (R) of 0.139 and weighted average of 10.8%. On average, for every 1% (one percent) increase in Ghanaians within a typical geography, there is an increase of 0.27% in percentage of males with a disability.
It is essential to understand that the correlation between the percentage of Ghanaians and percentage of males with a disability does not imply a direct cause-and-effect relationship. It remains uncertain whether the presence of Ghanaians influences an upward or downward trend in the level of percentage of males with a disability within an area, or if Ghanaians simply ended up residing in those areas with higher or lower levels of percentage of males with a disability due to other factors.
Demographics Similar to Ghanaians by Male Disability
In terms of male disability, the demographic groups most similar to Ghanaians are Immigrants from Zimbabwe (10.8%, a difference of 0.090%), Immigrants from Uruguay (10.8%, a difference of 0.10%), Immigrants (10.8%, a difference of 0.14%), Central American (10.8%, a difference of 0.15%), and Immigrants from Uganda (10.8%, a difference of 0.16%).
| Demographics | Rating | Rank | Male Disability |
| Immigrants from Brazil | 95.0 /100 | #105 | Exceptional 10.8% |
| Immigrants from Syria | 94.9 /100 | #106 | Exceptional 10.8% |
| Immigrants from Eastern Africa | 94.3 /100 | #107 | Exceptional 10.8% |
| Immigrants from Belgium | 94.2 /100 | #108 | Exceptional 10.8% |
| Immigrants from Uganda | 94.0 /100 | #109 | Exceptional 10.8% |
| Immigrants | 93.9 /100 | #110 | Exceptional 10.8% |
| Immigrants from Uruguay | 93.8 /100 | #111 | Exceptional 10.8% |
| Ghanaians | 93.4 /100 | #112 | Exceptional 10.8% |
| Immigrants from Zimbabwe | 93.0 /100 | #113 | Exceptional 10.8% |
| Central Americans | 92.7 /100 | #114 | Exceptional 10.8% |
| Immigrants from Barbados | 92.2 /100 | #115 | Exceptional 10.8% |
| Immigrants from South Africa | 91.8 /100 | #116 | Exceptional 10.8% |
| Eastern Europeans | 90.6 /100 | #117 | Exceptional 10.9% |
| Immigrants from Cuba | 90.2 /100 | #118 | Exceptional 10.9% |
| Armenians | 90.1 /100 | #119 | Exceptional 10.9% |
Ghanaian Male Disability Correlation Summary
| Measurement | Ghanaian Data | Male Disability Data |
| Minimum | 0.028% | 1.4% |
| Maximum | 12.0% | 25.9% |
| Range | 11.9% | 24.5% |
| Mean | 2.9% | 11.0% |
| Median | 2.5% | 11.0% |
| Interquartile 25% (IQ1) | 1.2% | 8.7% |
| Interquartile 75% (IQ3) | 4.2% | 11.7% |
| Interquartile Range (IQR) | 3.0% | 3.0% |
| Standard Deviation (Sample) | 2.1% | 4.2% |
| Standard Deviation (Population) | 2.1% | 4.1% |
Correlation Details
| Ghanaian Percentile | Sample Size | Male Disability |
[ 0.0% - 0.5% ] 0.028% | 84,693,809 | 11.4% |
[ 0.0% - 0.5% ] 0.088% | 42,475,821 | 11.2% |
[ 0.0% - 0.5% ] 0.15% | 14,994,589 | 10.9% |
[ 0.0% - 0.5% ] 0.21% | 8,622,191 | 10.8% |
[ 0.0% - 0.5% ] 0.27% | 6,207,299 | 10.8% |
[ 0.0% - 0.5% ] 0.32% | 12,771,919 | 10.5% |
[ 0.0% - 0.5% ] 0.39% | 3,388,390 | 11.0% |
[ 0.0% - 0.5% ] 0.45% | 2,805,890 | 10.0% |
[ 0.5% - 1.0% ] 0.51% | 1,750,776 | 10.6% |
[ 0.5% - 1.0% ] 0.57% | 1,312,558 | 10.8% |
[ 0.5% - 1.0% ] 0.63% | 1,995,893 | 11.0% |
[ 0.5% - 1.0% ] 0.68% | 803,629 | 10.9% |
[ 0.5% - 1.0% ] 0.75% | 1,424,240 | 11.4% |
[ 0.5% - 1.0% ] 0.80% | 670,209 | 11.1% |
[ 0.5% - 1.0% ] 0.87% | 530,607 | 9.7% |
[ 0.5% - 1.0% ] 0.93% | 450,837 | 10.3% |
[ 0.5% - 1.0% ] 0.99% | 370,267 | 11.2% |
[ 1.0% - 1.5% ] 1.05% | 567,076 | 11.2% |
[ 1.0% - 1.5% ] 1.10% | 231,909 | 9.2% |
[ 1.0% - 1.5% ] 1.17% | 321,189 | 11.4% |
[ 1.0% - 1.5% ] 1.22% | 323,918 | 11.3% |
[ 1.0% - 1.5% ] 1.28% | 443,712 | 9.4% |
[ 1.0% - 1.5% ] 1.35% | 191,762 | 10.7% |
[ 1.0% - 1.5% ] 1.40% | 339,224 | 11.5% |
[ 1.0% - 1.5% ] 1.46% | 232,886 | 11.4% |
[ 1.5% - 2.0% ] 1.53% | 62,787 | 11.6% |
[ 1.5% - 2.0% ] 1.58% | 193,038 | 9.0% |
[ 1.5% - 2.0% ] 1.65% | 209,236 | 11.7% |
[ 1.5% - 2.0% ] 1.71% | 115,620 | 10.7% |
[ 1.5% - 2.0% ] 1.78% | 77,677 | 8.2% |
[ 1.5% - 2.0% ] 1.84% | 252,368 | 10.0% |
[ 1.5% - 2.0% ] 1.88% | 280,547 | 8.9% |
[ 1.5% - 2.0% ] 1.94% | 75,155 | 14.0% |
[ 2.0% - 2.5% ] 2.02% | 126,465 | 10.6% |
[ 2.0% - 2.5% ] 2.06% | 85,128 | 7.4% |
[ 2.0% - 2.5% ] 2.12% | 118,697 | 15.8% |
[ 2.0% - 2.5% ] 2.19% | 3,424 | 15.0% |
[ 2.0% - 2.5% ] 2.23% | 14,296 | 7.8% |
[ 2.0% - 2.5% ] 2.31% | 36,119 | 13.3% |
[ 2.0% - 2.5% ] 2.37% | 38,913 | 7.3% |
[ 2.0% - 2.5% ] 2.44% | 84,672 | 11.2% |
[ 2.0% - 2.5% ] 2.49% | 6,916 | 11.7% |
[ 2.5% - 3.0% ] 2.55% | 232,392 | 13.5% |
[ 2.5% - 3.0% ] 2.61% | 16,183 | 12.1% |
[ 2.5% - 3.0% ] 2.66% | 6,773 | 15.4% |
[ 2.5% - 3.0% ] 2.72% | 181,389 | 13.3% |
[ 2.5% - 3.0% ] 2.81% | 13,927 | 14.8% |
[ 2.5% - 3.0% ] 2.91% | 9,389 | 6.5% |
[ 3.0% - 3.5% ] 3.01% | 47,793 | 11.6% |
[ 3.0% - 3.5% ] 3.08% | 3,638 | 11.4% |
[ 3.0% - 3.5% ] 3.19% | 2,694 | 5.1% |
[ 3.0% - 3.5% ] 3.28% | 22,049 | 8.7% |
[ 3.0% - 3.5% ] 3.33% | 38,632 | 7.0% |
[ 3.0% - 3.5% ] 3.40% | 19,605 | 8.3% |
[ 3.0% - 3.5% ] 3.46% | 1,705 | 1.4% |
[ 3.5% - 4.0% ] 3.52% | 36,265 | 8.2% |
[ 3.5% - 4.0% ] 3.64% | 22,966 | 7.6% |
[ 3.5% - 4.0% ] 3.70% | 703 | 22.7% |
[ 3.5% - 4.0% ] 3.75% | 55,168 | 11.0% |
[ 4.0% - 4.5% ] 4.08% | 19,938 | 4.3% |
[ 4.0% - 4.5% ] 4.17% | 30,590 | 14.9% |
[ 4.0% - 4.5% ] 4.19% | 2,980 | 5.2% |
[ 4.0% - 4.5% ] 4.37% | 229 | 24.3% |
[ 4.0% - 4.5% ] 4.47% | 72,215 | 8.7% |
[ 4.5% - 5.0% ] 4.60% | 630 | 25.9% |
[ 4.5% - 5.0% ] 4.63% | 3,135 | 11.5% |
[ 4.5% - 5.0% ] 4.70% | 2,721 | 19.8% |
[ 4.5% - 5.0% ] 4.79% | 376 | 15.7% |
[ 4.5% - 5.0% ] 4.91% | 23,110 | 11.3% |
[ 5.0% - 5.5% ] 5.01% | 43,231 | 11.4% |
[ 5.0% - 5.5% ] 5.09% | 2,474 | 6.2% |
[ 5.0% - 5.5% ] 5.18% | 733 | 4.4% |
[ 5.0% - 5.5% ] 5.24% | 15,508 | 7.4% |
[ 5.5% - 6.0% ] 5.56% | 1,798 | 12.4% |
[ 5.5% - 6.0% ] 5.69% | 1,107 | 12.6% |
[ 6.0% - 6.5% ] 6.00% | 22,505 | 4.7% |
[ 6.0% - 6.5% ] 6.14% | 1,010 | 11.9% |
[ 6.0% - 6.5% ] 6.21% | 22,114 | 8.7% |
[ 6.0% - 6.5% ] 6.24% | 2,034 | 7.9% |
[ 6.5% - 7.0% ] 6.92% | 1,041 | 9.9% |
[ 7.0% - 7.5% ] 7.22% | 3,575 | 7.8% |
[ 11.5% - 12.0% ] 11.97% | 1,295 | 23.4% |